


Características


¿Tienes alguna pregunta?
Recomendar


7 diapositivas
Agile Responsibility Assignment Infographic
Navigate the complexities of project responsibilities with the agile responsibility assignment infographic. Articulately designed using a palette of blue, yellow, brown, and white, this template brings clarity to task assignments in an agile environment. Ideal for project managers, scrum masters, or agile coaches, it provides a comprehensive view of roles and responsibilities. The matrix style not only adds visual appeal but also makes information absorption effortless. This infographic is an essential tool for ensuring team alignment and is seamlessly compatible with PowerPoint, Keynote, and Google Slides.


6 diapositivas
Multiple Business Solutions Options Slide Presentation
Explore diverse strategies with the Multiple Business Solutions Options Slide Presentation. Featuring a vertical stack of labeled briefcases (A–F), this slide is designed to compare and communicate multiple business ideas, solutions, or pathways in a clear, structured layout. Ideal for pitching product variations, workflow choices, or market entry tactics. Each option is paired with customizable text fields for added clarity. Compatible with PowerPoint, Keynote, and Google Slides for easy editing and integration into your existing decks.


10 diapositivas
Employee Retention and HR Strategy Presentation
Present your HR initiatives with a clean, puzzle-inspired visual in this Employee Retention and HR Strategy slide. This layout features a silhouette icon alongside a 5-step vertical format—each step with its own icon and title box—to illustrate key elements like onboarding, employee engagement, recognition programs, and more. Fully editable and compatible with PowerPoint, Keynote, and Google Slides.


4 diapositivas
End-to-End Supply Chain Optimization Presentation
Streamline your logistics strategy with this modern End-to-End Supply Chain Optimization slide. Featuring bold vector icons representing production, automation, and distribution, this layout clearly visualizes key supply chain stages. Ideal for presenting operations flow, logistics planning, or manufacturing improvements. Fully customizable in PowerPoint, Keynote, and Google Slides for seamless integration into your business deck.


20 diapositivas
Blaze UX UI Design Pitch Deck Presentation
Craft a visually stunning pitch that brings your UX/UI design process to life with this sleek and modern presentation template. From concept development to final prototypes, each slide is designed to showcase research, wireframes, typography, and more with a seamless, professional aesthetic. Fully compatible with PowerPoint, Keynote, and Google Slides.


6 diapositivas
Insurance Comparison Infographic
Insurance comparison is the process of evaluating and comparing different insurance policies offered by various insurance companies to find the one that best meets your needs and requirements. This infographic template is a visual representation of different types of insurance policies and their key features, designed to help consumers compare and make informed decisions about their insurance needs. This infographic aims to simplify complex insurance information. This can be used on insurance websites, marketing materials, and educational resources to assist consumers in making well-informed insurance choices based on their unique needs and preferences.


22 diapositivas
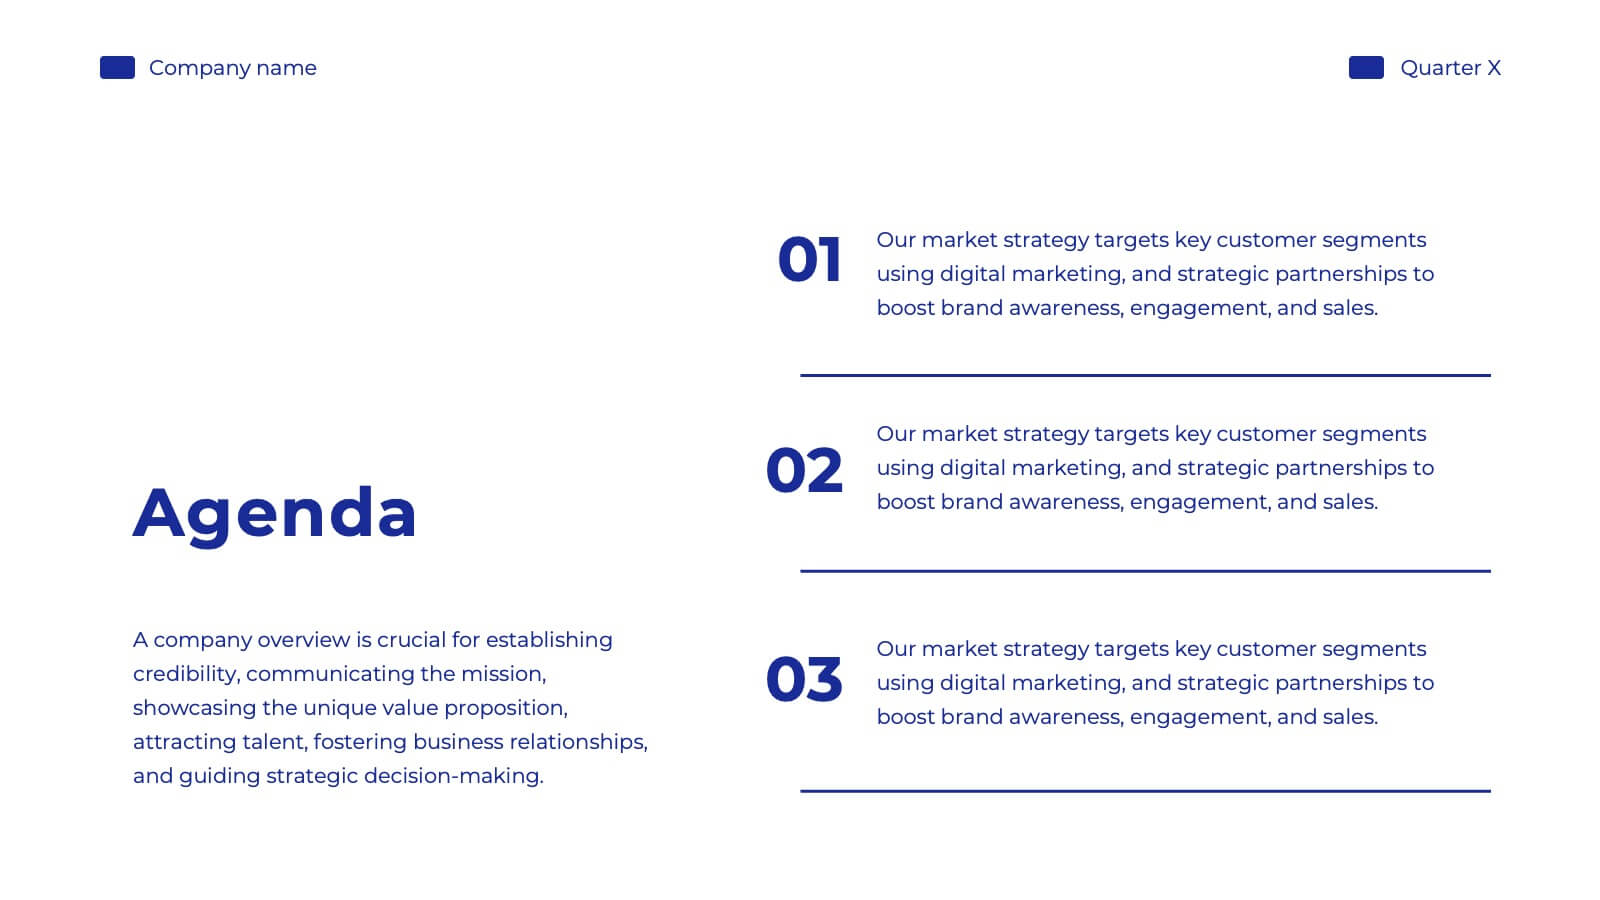
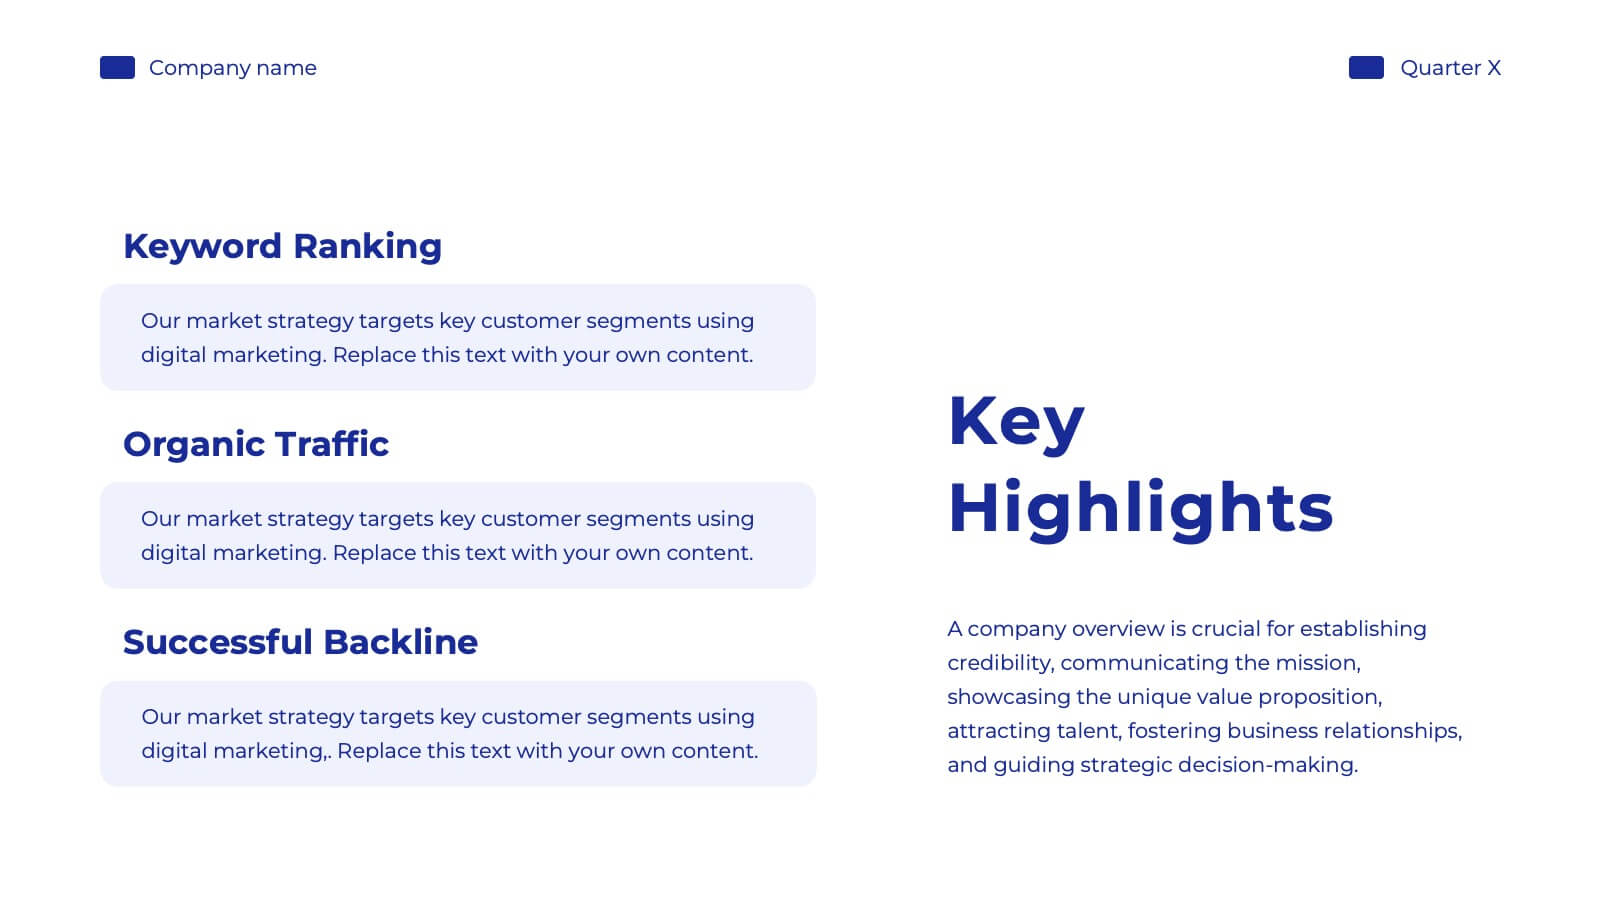
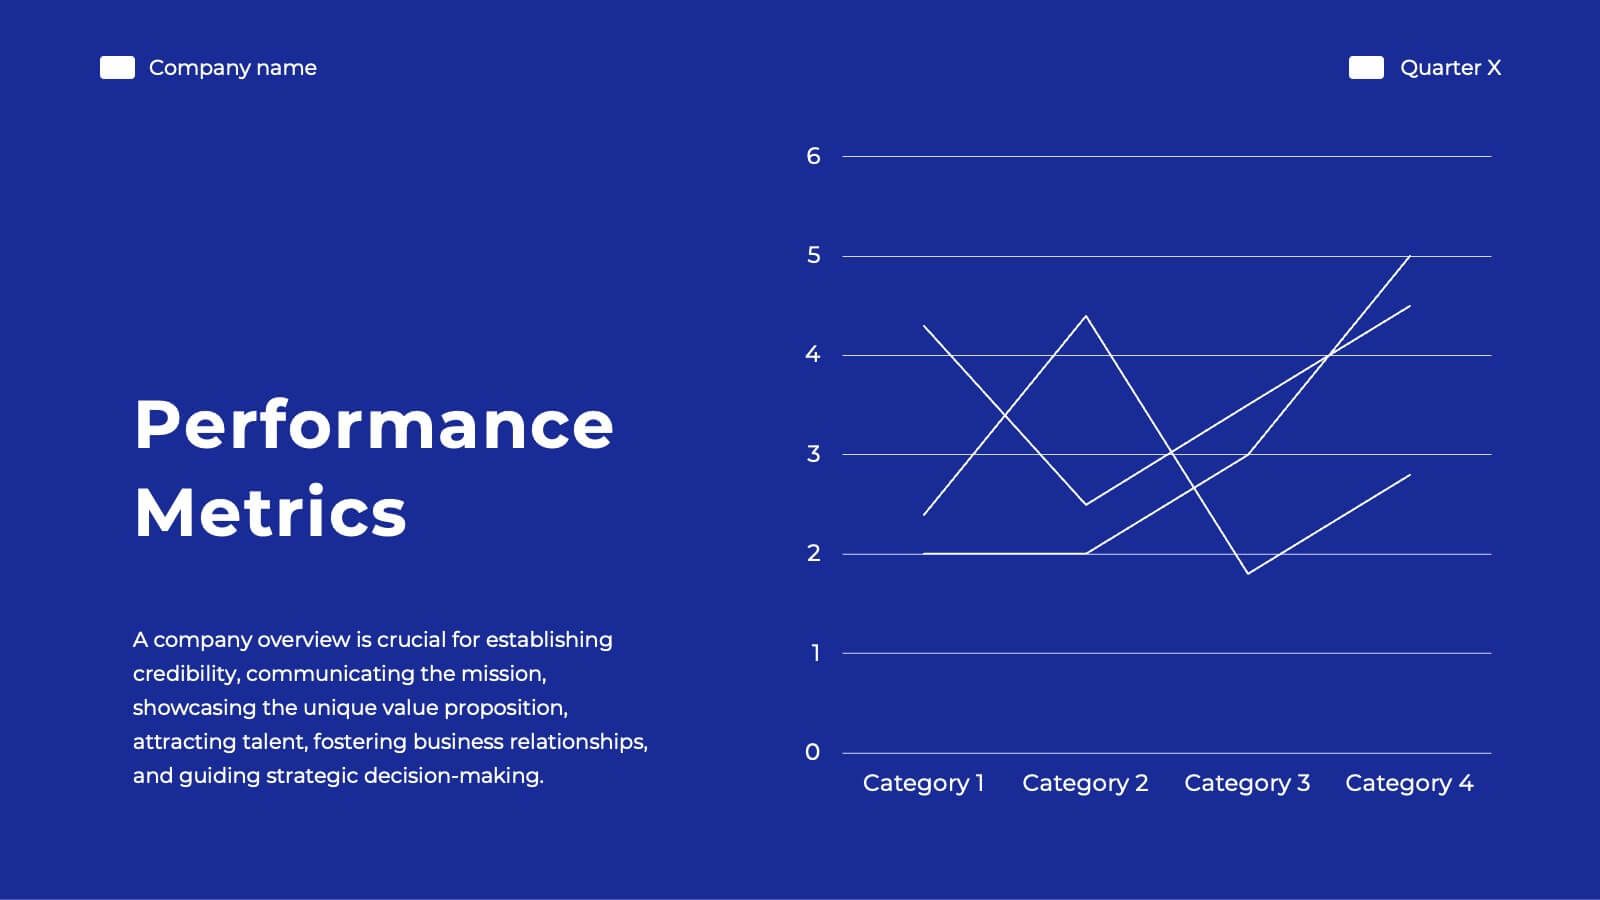
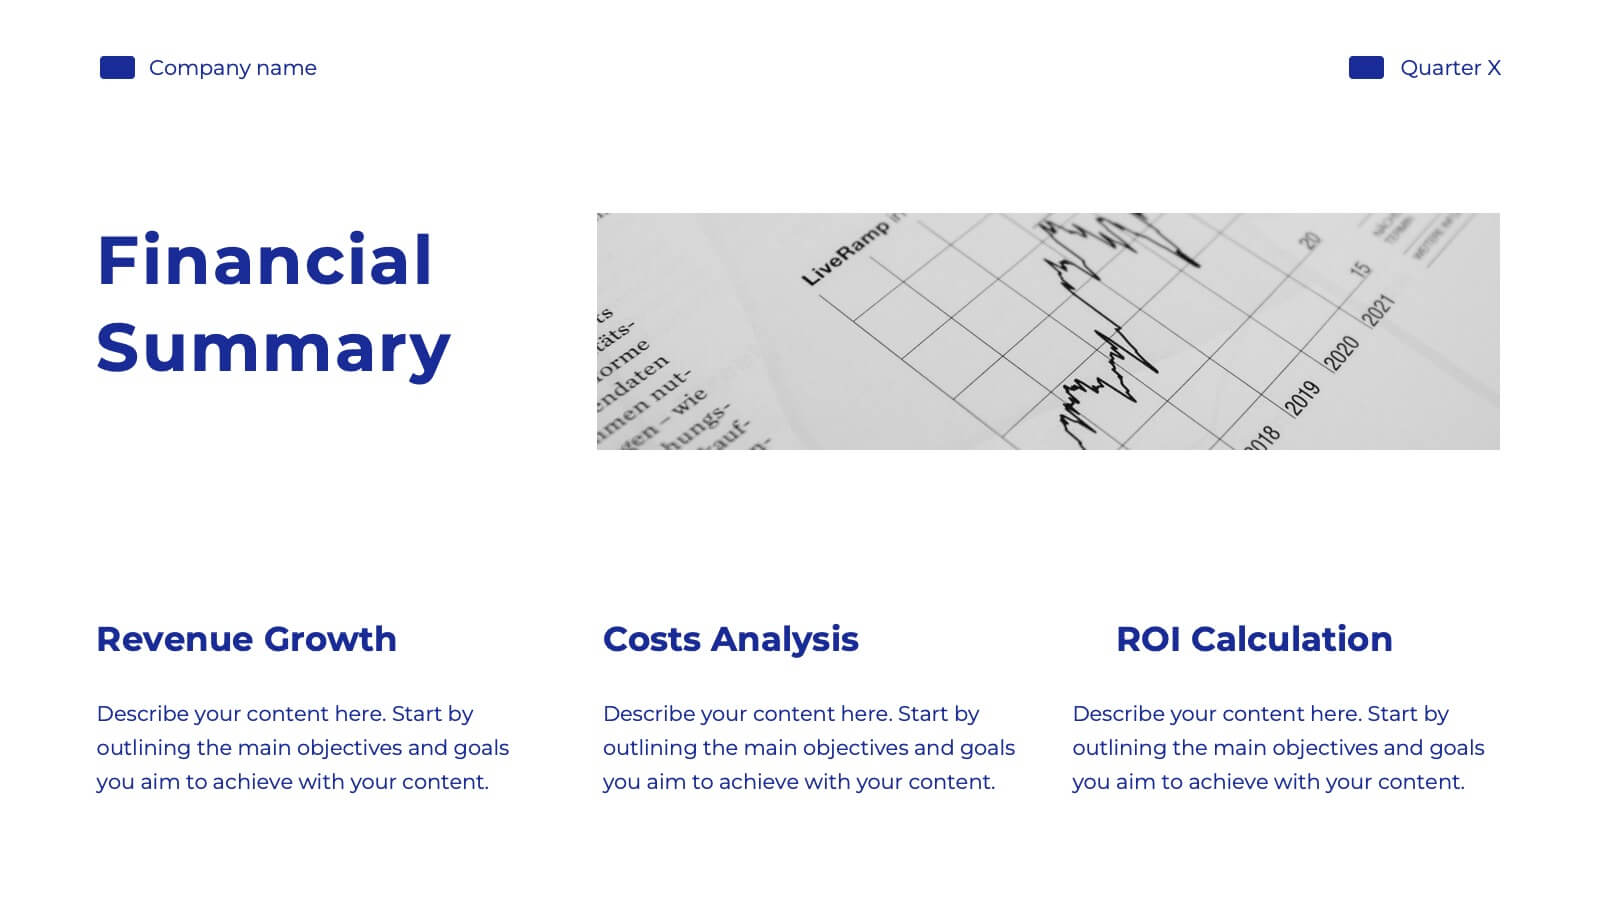
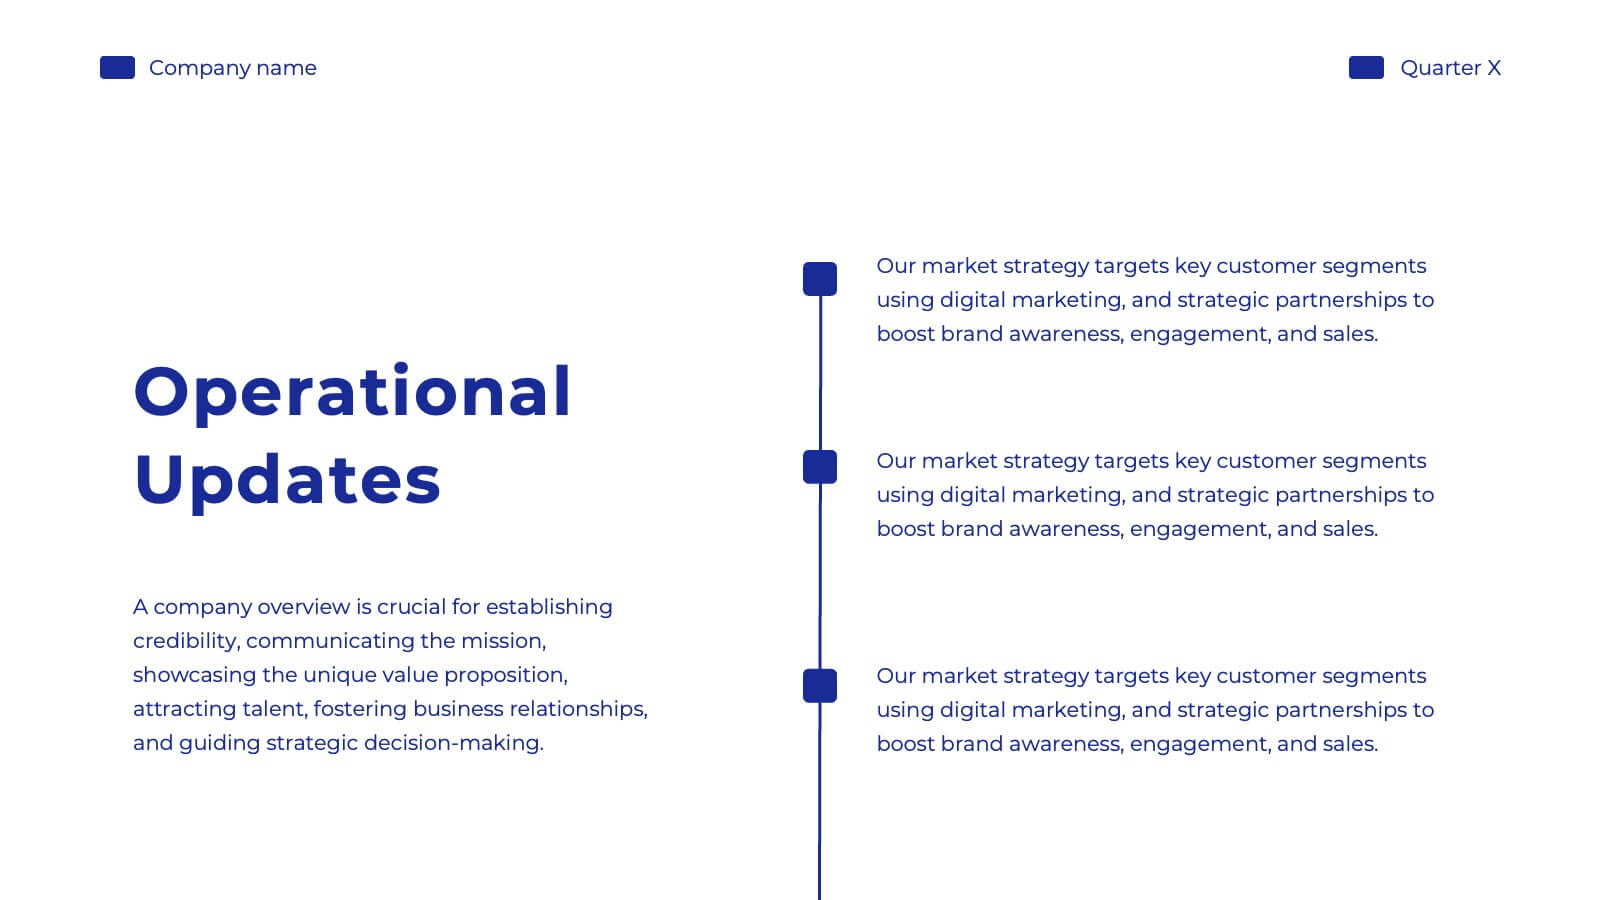
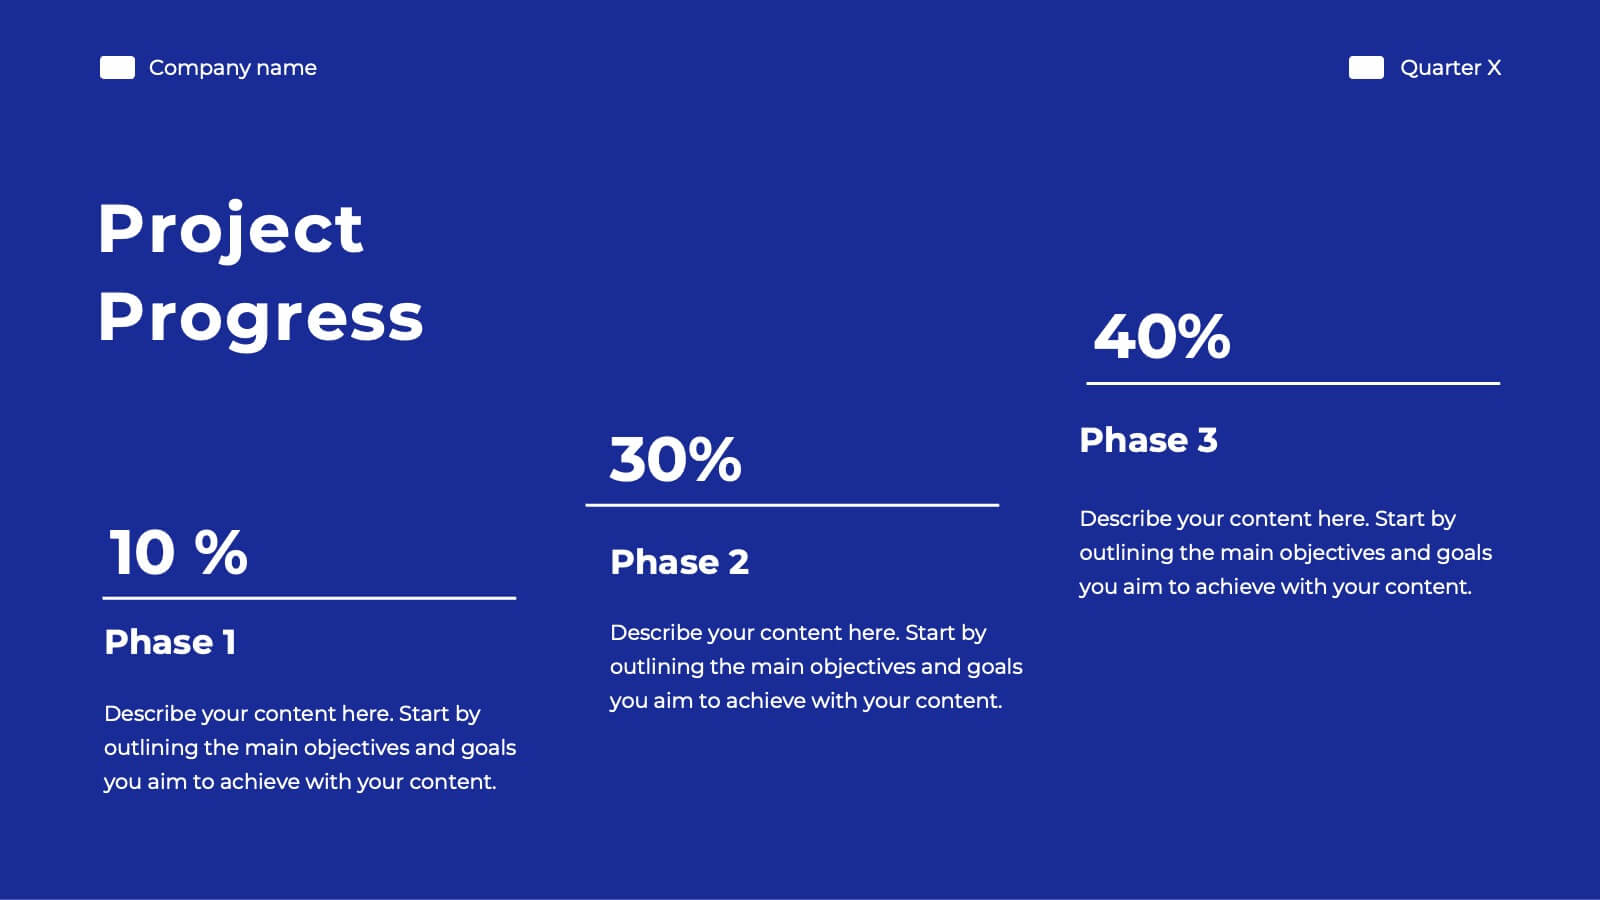
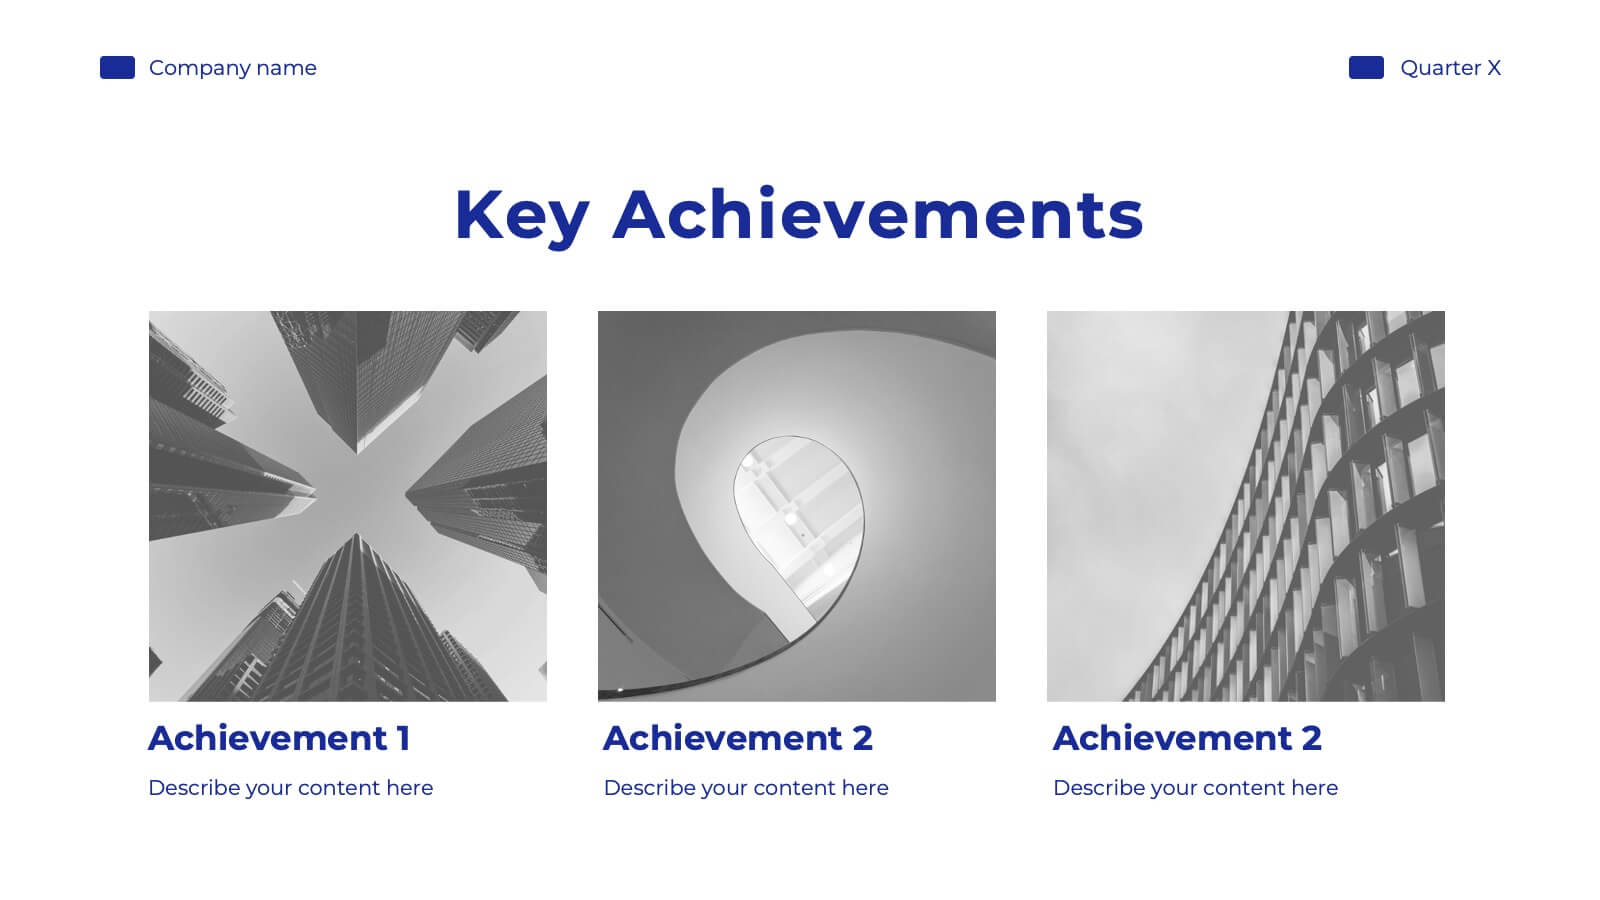
Frost Financial Report Presentation
Transform your brand with this comprehensive rebranding project template! Perfect for presenting brand identity, market analysis, and strategic positioning, it includes slides for logos, color palettes, and brand guidelines. Engage your audience with visually striking designs and detailed content. Compatible with PowerPoint, Keynote, and Google Slides for easy, professional presentations on any platform.


4 diapositivas
Employee Training and Development
Train smarter, not harder—with this bold funnel-style visual that maps your employee development journey from initial training to measurable impact. It's perfect for illustrating progress, performance shifts, or development stages across teams or roles. Fully customizable in PowerPoint, Keynote, and Google Slides for smooth integration into any professional presentation.


5 diapositivas
Business Process Workflow Presentation
Make your business processes crystal clear with this streamlined, modern layout. Designed to visualize every stage from start to success, this presentation helps communicate progress, efficiency, and key actions with precision. Perfect for business planning or reporting, it’s fully compatible with PowerPoint, Keynote, and Google Slides for easy customization.


3 diapositivas
Business Ethics and Legal Guidelines Presentation
Navigate the complexities of corporate governance with the "Business Ethics and Legal Guidelines" template, designed to simplify and clarify the presentation of legal standards and ethical expectations in business environments.This visually engaging layout helps emphasize the progression and importance of each principle, ensuring clarity in communication. Ideal for training modules, compliance meetings, or strategic planning sessions, it's compatible with PowerPoint, Keynote, and Google Slides.


5 diapositivas
Banking Services Infographics
Banking Services refer to the financial and investment services provided by banks to individuals, businesses, and other organizations. These Infographics are visual representations of information about different types of banking services provided by various financial institutions. This infographic provides an overview of the key features, benefits, and drawbacks of each service, such as checking/saving accounts, credit cards, and online banking. Included are statistics, charts, and other visual aids to convey data more effectively. The aim is to help individuals make informed decisions about the right banking services for their needs.


6 diapositivas
Financial Forecasting and Numerical Analysis Presentation
Visualize your financial insights with clarity using this clean and modern bar chart template. Designed for presenting financial projections, budget analysis, and performance metrics, this slide breaks down six key categories for easy comparison. Ideal for financial reviews, business updates, or investment pitches. Fully editable in PowerPoint, Keynote, and Google Slides.


4 diapositivas
Data Breach Prevention Planning Deck Presentation
Stop breaches before they start with this clean, visual data protection slide. Designed to help teams outline risks, access controls, and mitigation steps, this template makes complex security workflows easy to present. A great fit for compliance reviews or cybersecurity briefings. Compatible with PowerPoint, Keynote, and Google Slides.


7 diapositivas
Environment United States Map Infographic
An Environment United States Map refers to a map that displays various environmental aspects or features across the United States. This template is a powerful tool for visualizing sustainability initiatives and environmental data across the diverse landscapes of the United States. With a combination of insightful graphics, this template enables you to present a compelling narrative about the nation's environmental efforts. This Infographic is a call to action to protect and preserve our planet, highlighting the efforts that are shaping a more sustainable and harmonious coexistence with nature.


6 diapositivas
Project Summary and Final Thoughts Presentation
Wrap up your presentation with clarity using the Project Summary and Final Thoughts Presentation. This clean, structured layout helps you highlight key milestones, insights, and takeaways across six points—perfect for recapping project goals and outcomes. Fully customizable and compatible with PowerPoint, Keynote, and Google Slides.


4 diapositivas
Target Audience Slide Deck Presentation
Make your message click instantly with a bold, puzzle-style slide that brings your audience insights to life. This presentation helps you break down key segments, user needs, and demographic details in a clear, engaging format that supports strategic decision-making. Fully compatible with PowerPoint, Keynote, and Google Slides.


6 diapositivas
Industry Analysis Porter's 5 Forces Presentation
Analyze industry competition with this Porter's Five Forces template! This structured layout visually breaks down key factors like buyer power, supplier influence, competitive rivalry, new market entrants, and substitution threats, making it ideal for strategic planning and market assessments. Fully customizable and compatible with PowerPoint, Keynote, and Google Slides.