


Características


¿Tienes alguna pregunta?
Recomendar


6 diapositivas
E-Learning Company Infographics
The "E-Learning Company" infographic template is a contemporary and dynamic tool, designed for PowerPoint, Keynote, and Google Slides. It's an excellent resource for e-learning companies, educational technology firms, and online educators looking to showcase their services and methodologies. This template includes key elements such as online course offerings, interactive learning tools, and student engagement strategies. Its layout is specifically tailored to highlight the features and benefits of e-learning, making it perfect for presentations that aim to showcase the effectiveness and innovation of digital education. The design is vibrant and tech-savvy, with an energetic color scheme that reflects the lively nature of digital learning environments. This not only makes the template visually appealing but also aligns with the modern and interactive nature of e-learning. Whether you're presenting to potential clients, educators, or investors, this template ensures that your e-learning services and strategies are displayed in a clear, engaging, and professional manner.


10 diapositivas
Business Model Hexagon Infographic
Break down your strategy into clear, modular components with the Business Model Hexagon Infographic Presentation. This visually engaging layout features five interlinked hexagons, each labeled and icon-marked for easy segmentation of your business pillars—such as value propositions, customer channels, key partners, and revenue streams. The vertical stack ensures a logical flow while keeping your message structured and professional. Fully editable in PowerPoint, Keynote, and Google Slides, allowing you to tailor icons, text, and colors to match your business theme.


6 diapositivas
Business Performance Pie Chart Presentation
Showcase key business insights with the Business Performance Pie Chart Presentation template. Designed for professionals, this fully editable slide deck allows you to present performance metrics, financial data, and strategic analysis using visually appealing pie charts. Ideal for business reports, investor meetings, and corporate presentations, it ensures clarity and engagement. Compatible with PowerPoint, Keynote, and Google Slides.


5 diapositivas
Growth and Expansion Scale Model Presentation
Visualize your business growth with the Growth and Expansion Scale Model presentation. This template is designed to illustrate strategic progress, scaling efforts, and key milestones in business development. Ideal for executives, entrepreneurs, and business strategists, it offers customizable elements to align with your objectives. Fully compatible with PowerPoint, Keynote, and Google Slides.


21 diapositivas
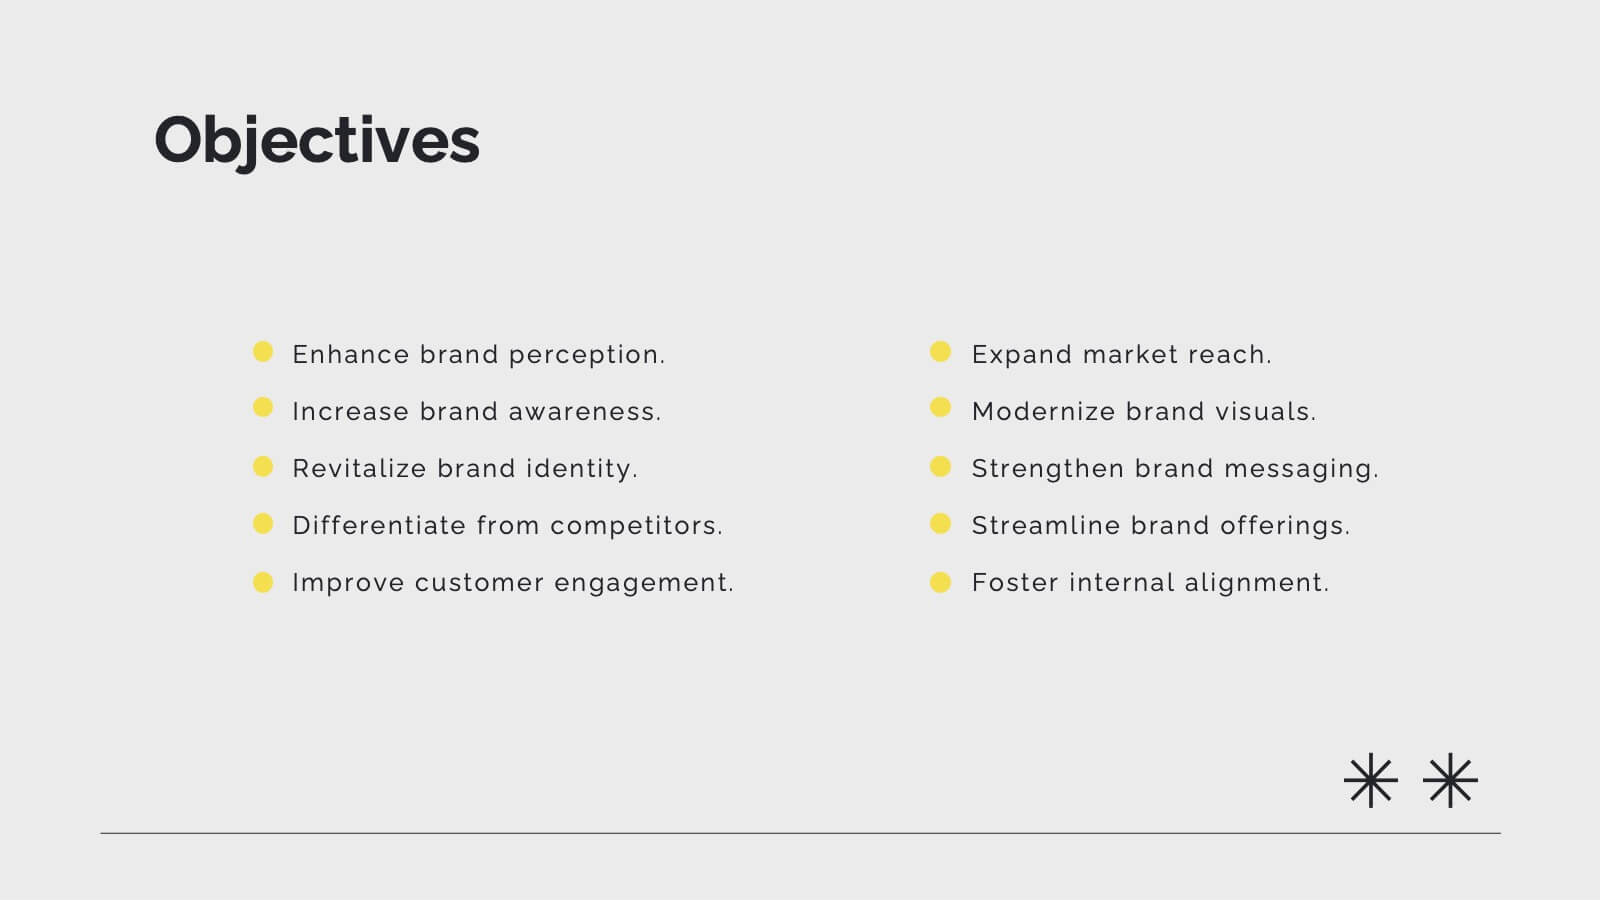
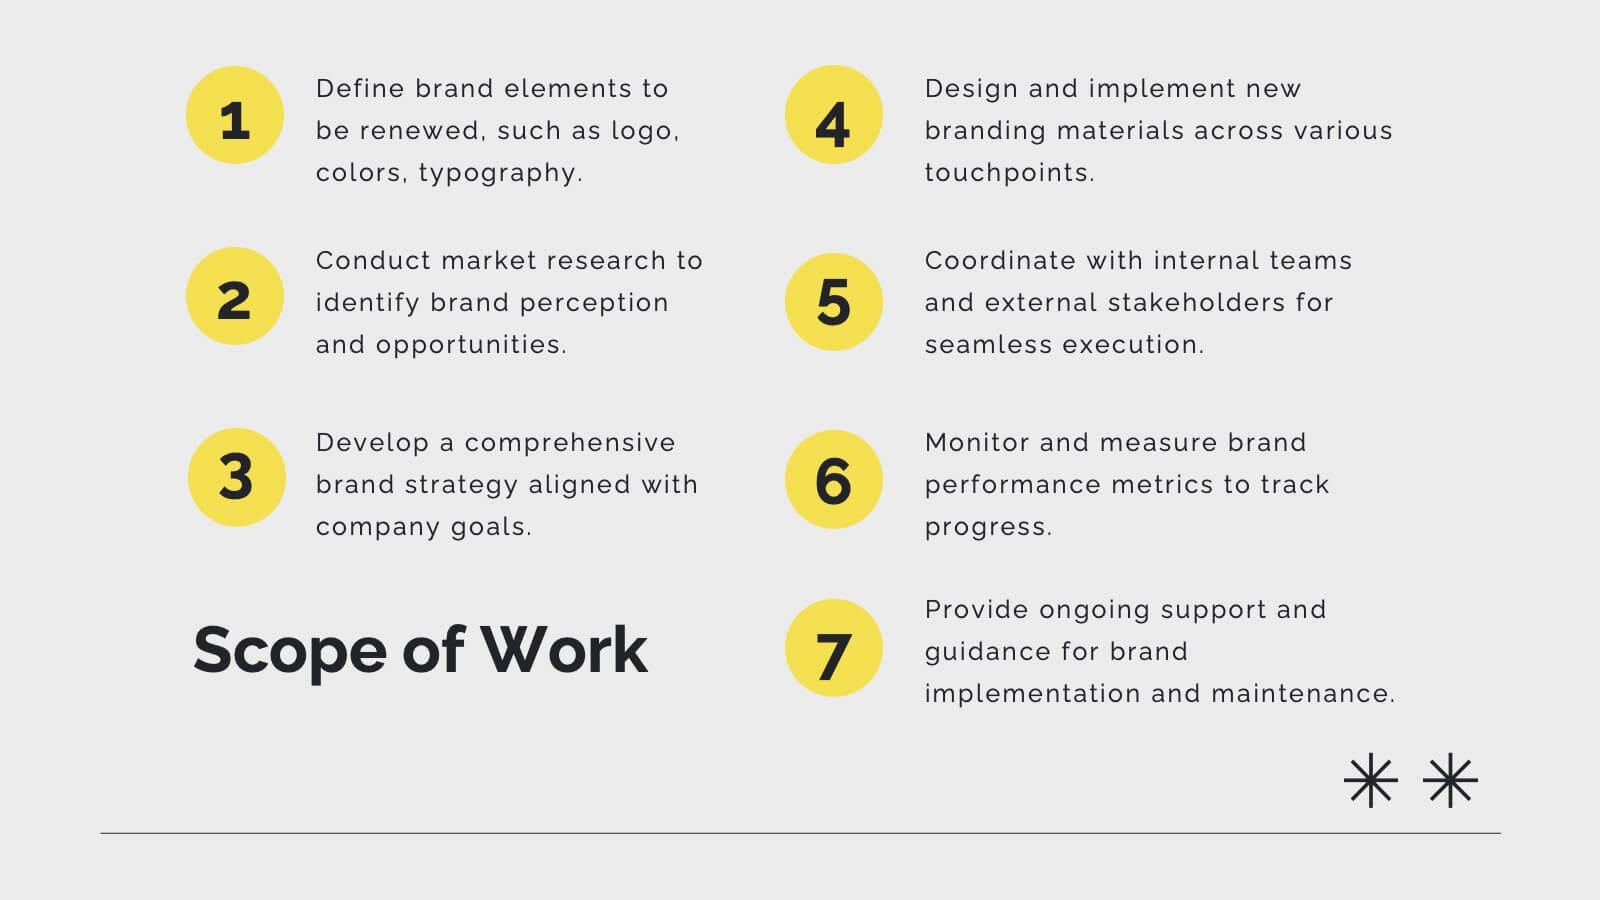
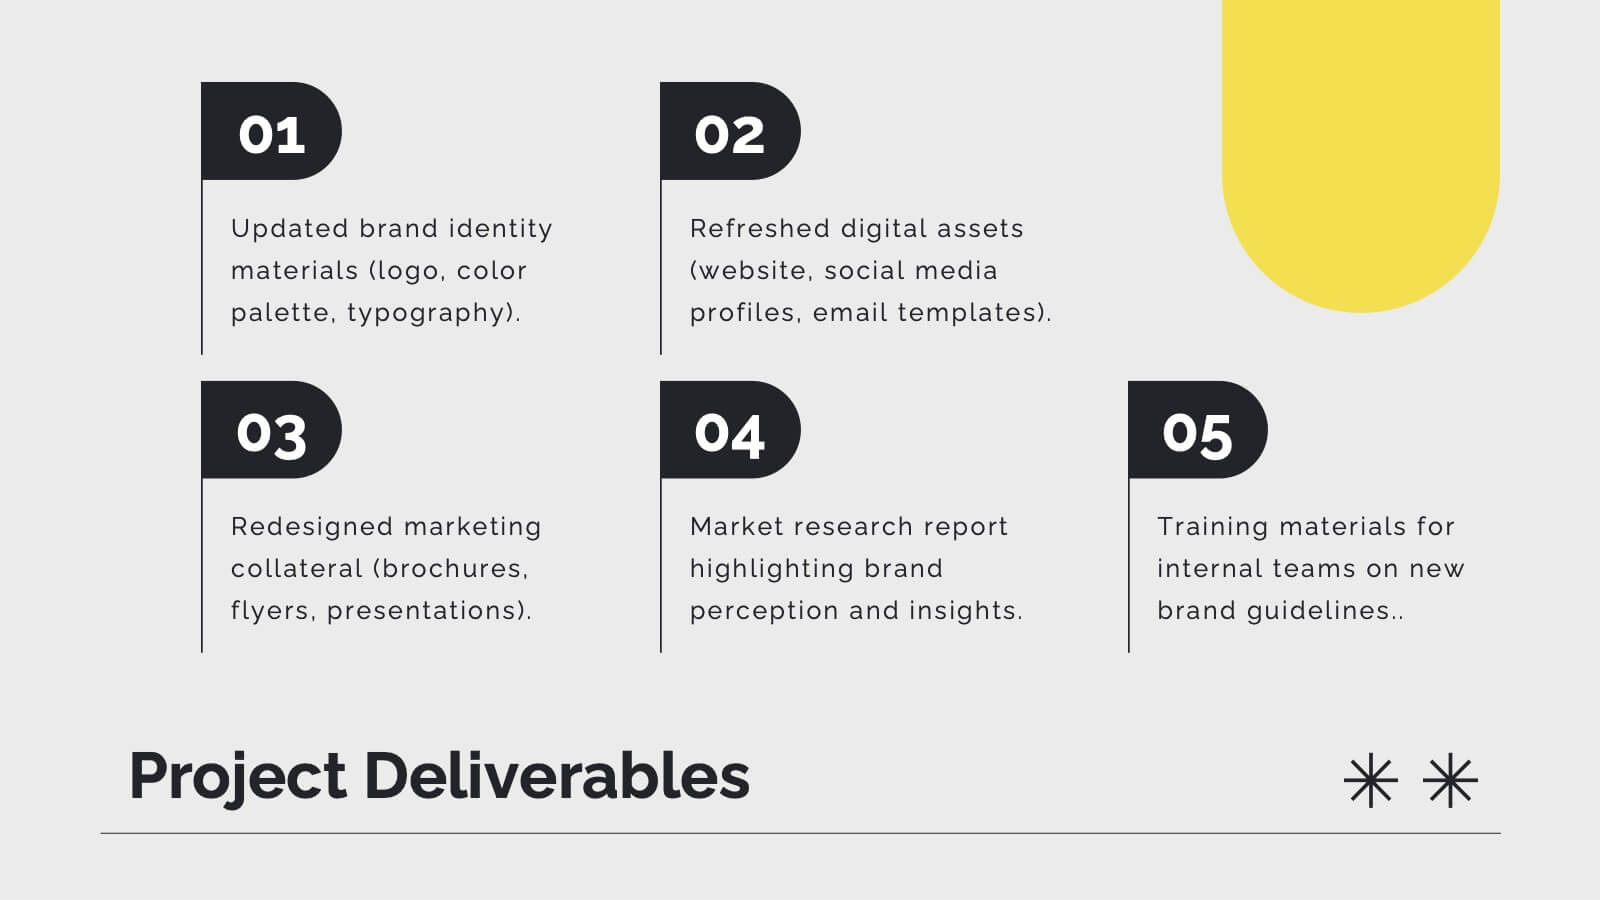
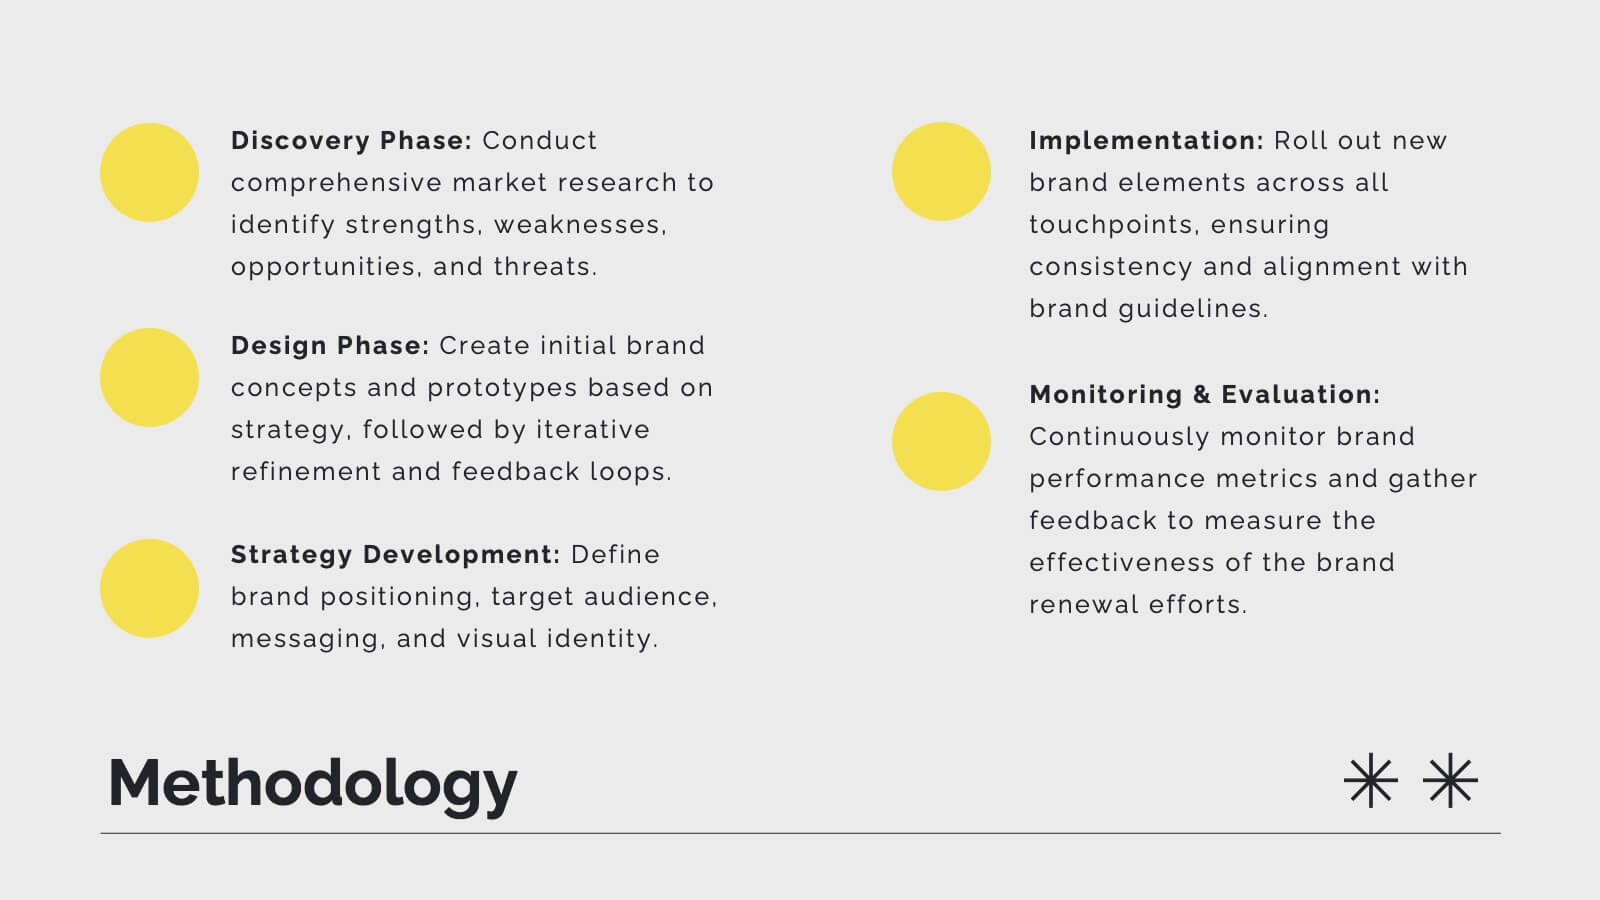
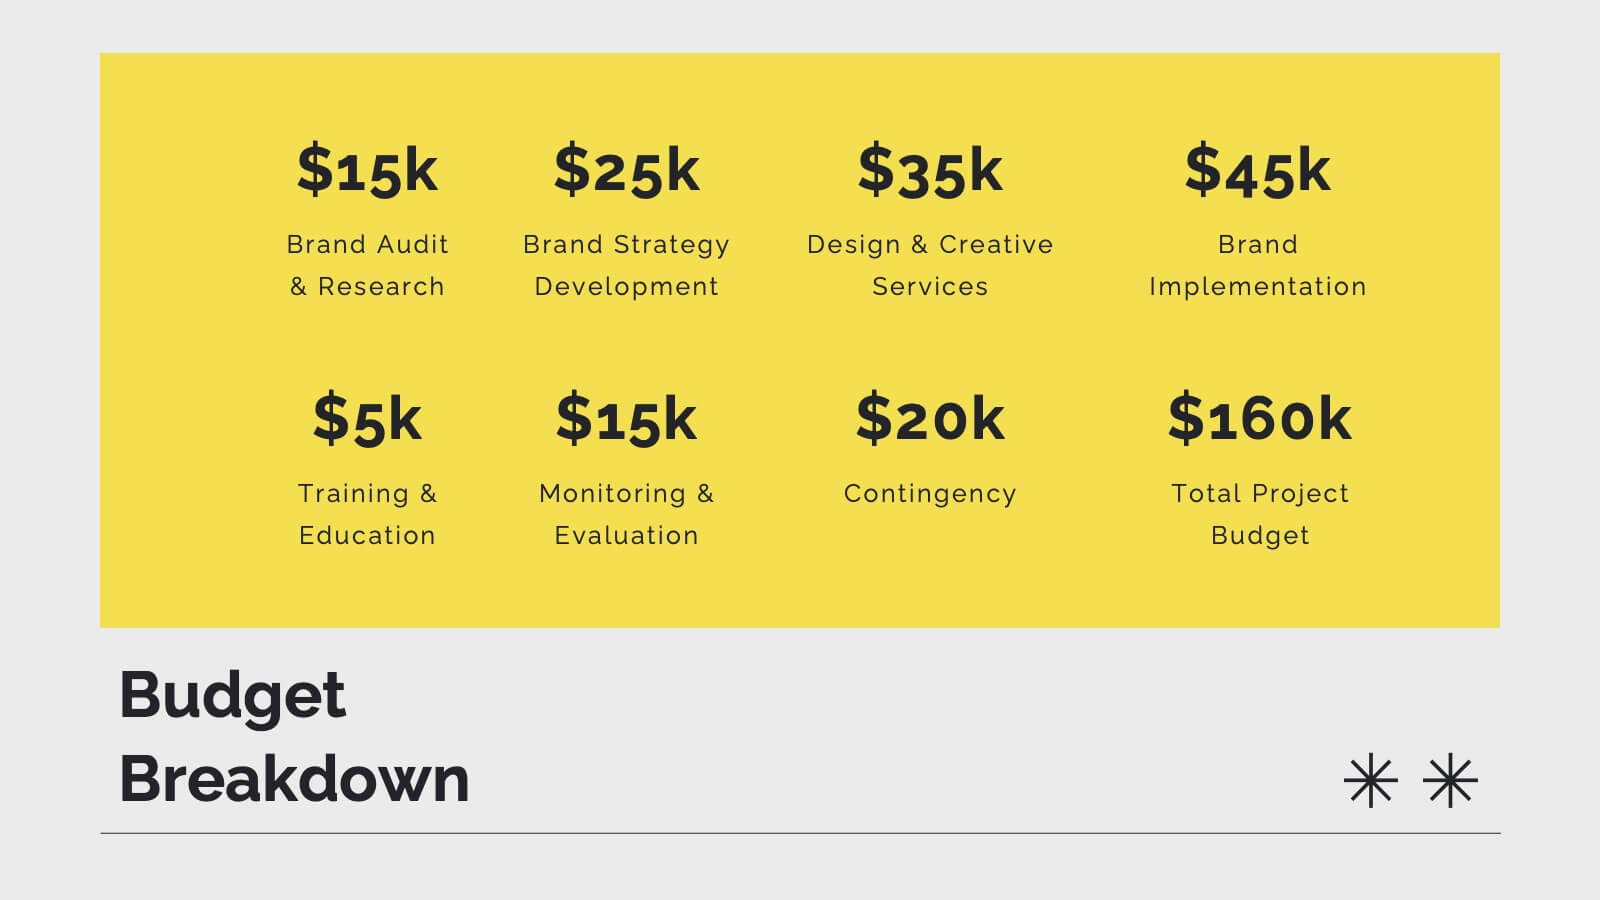
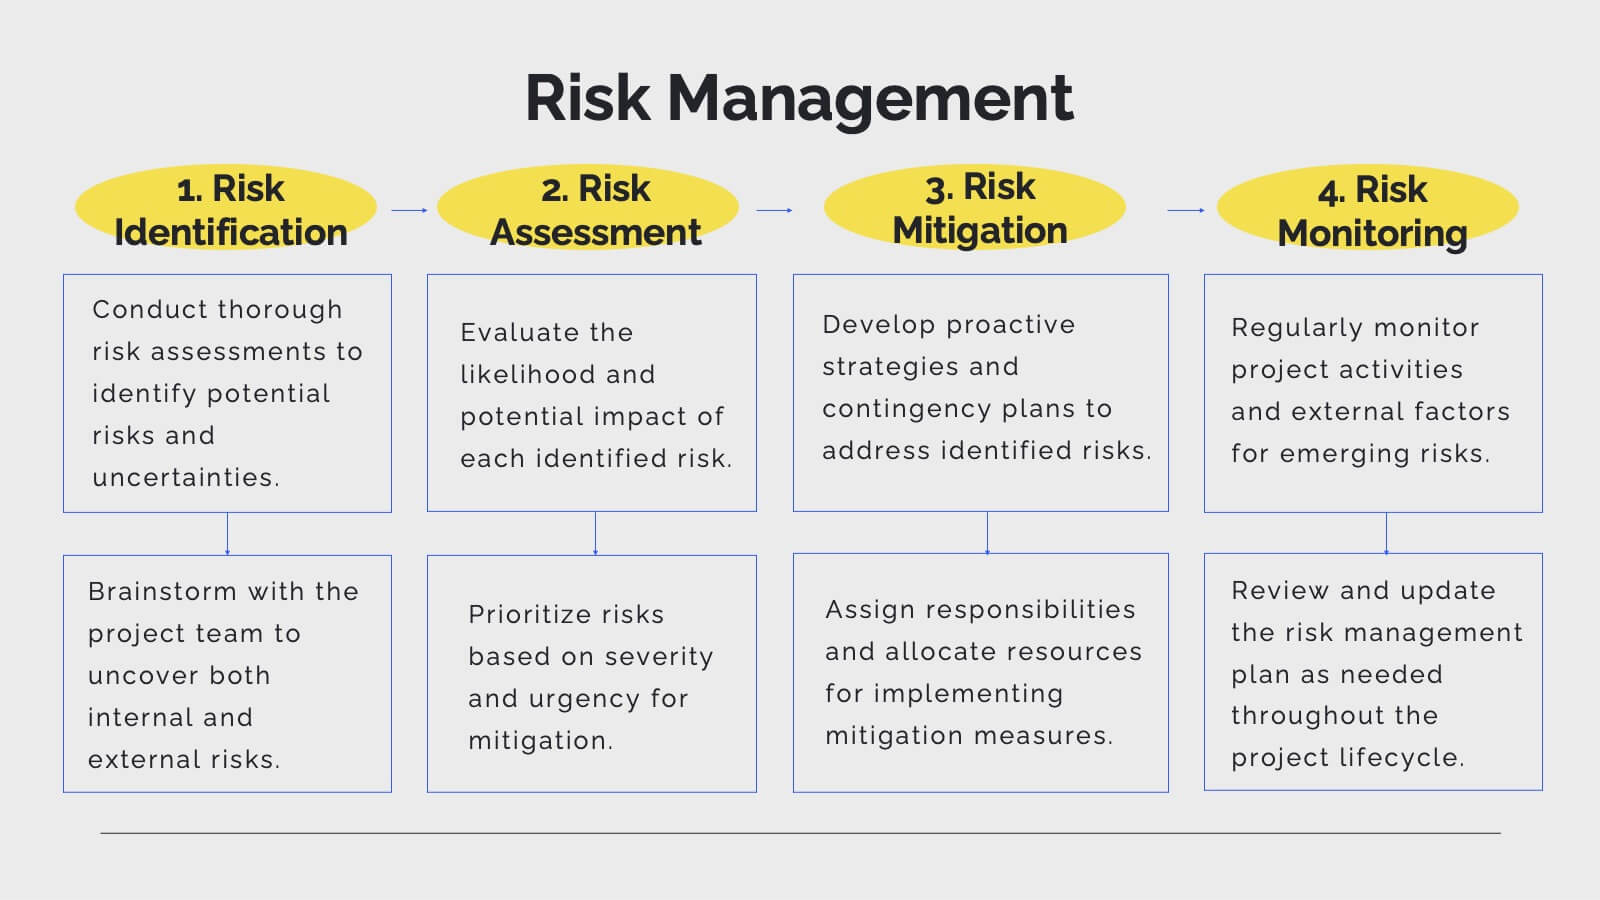
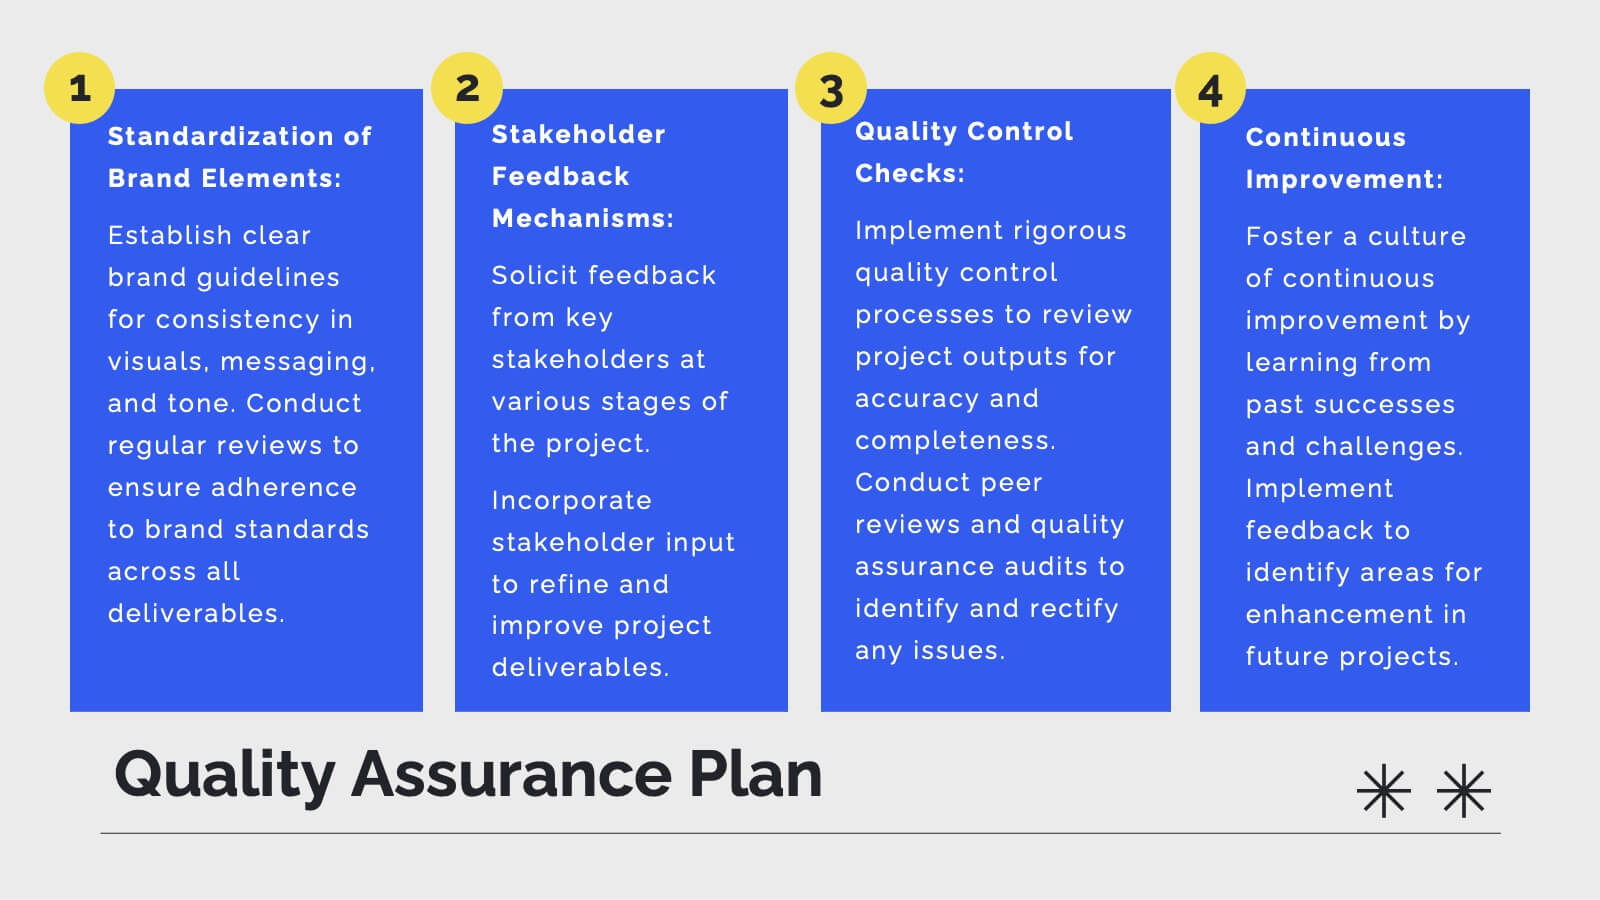
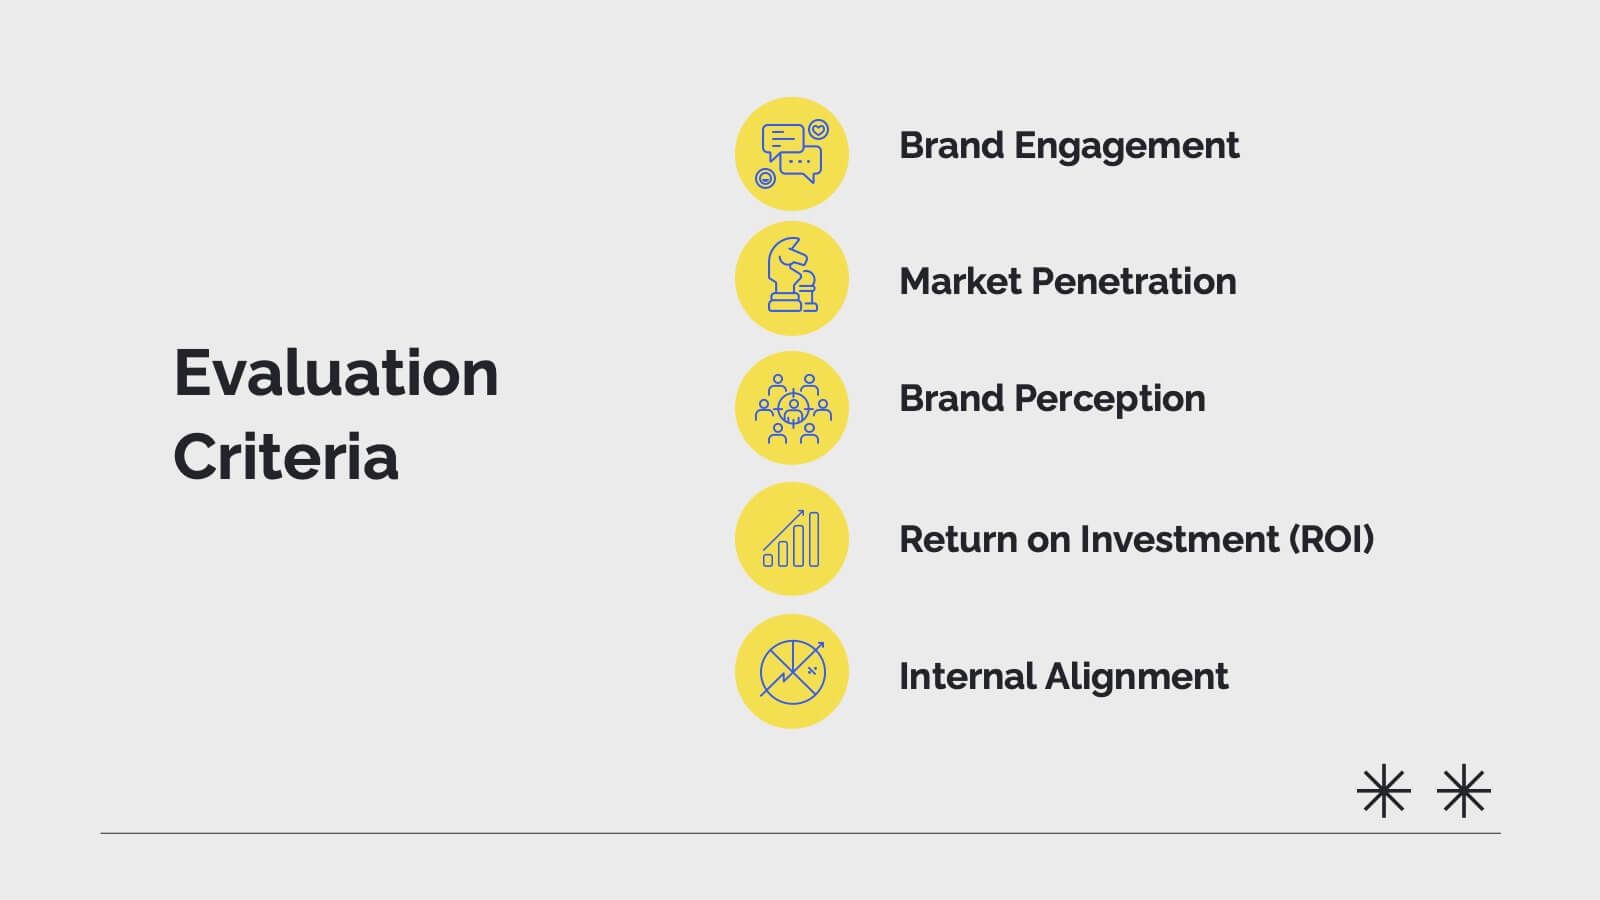
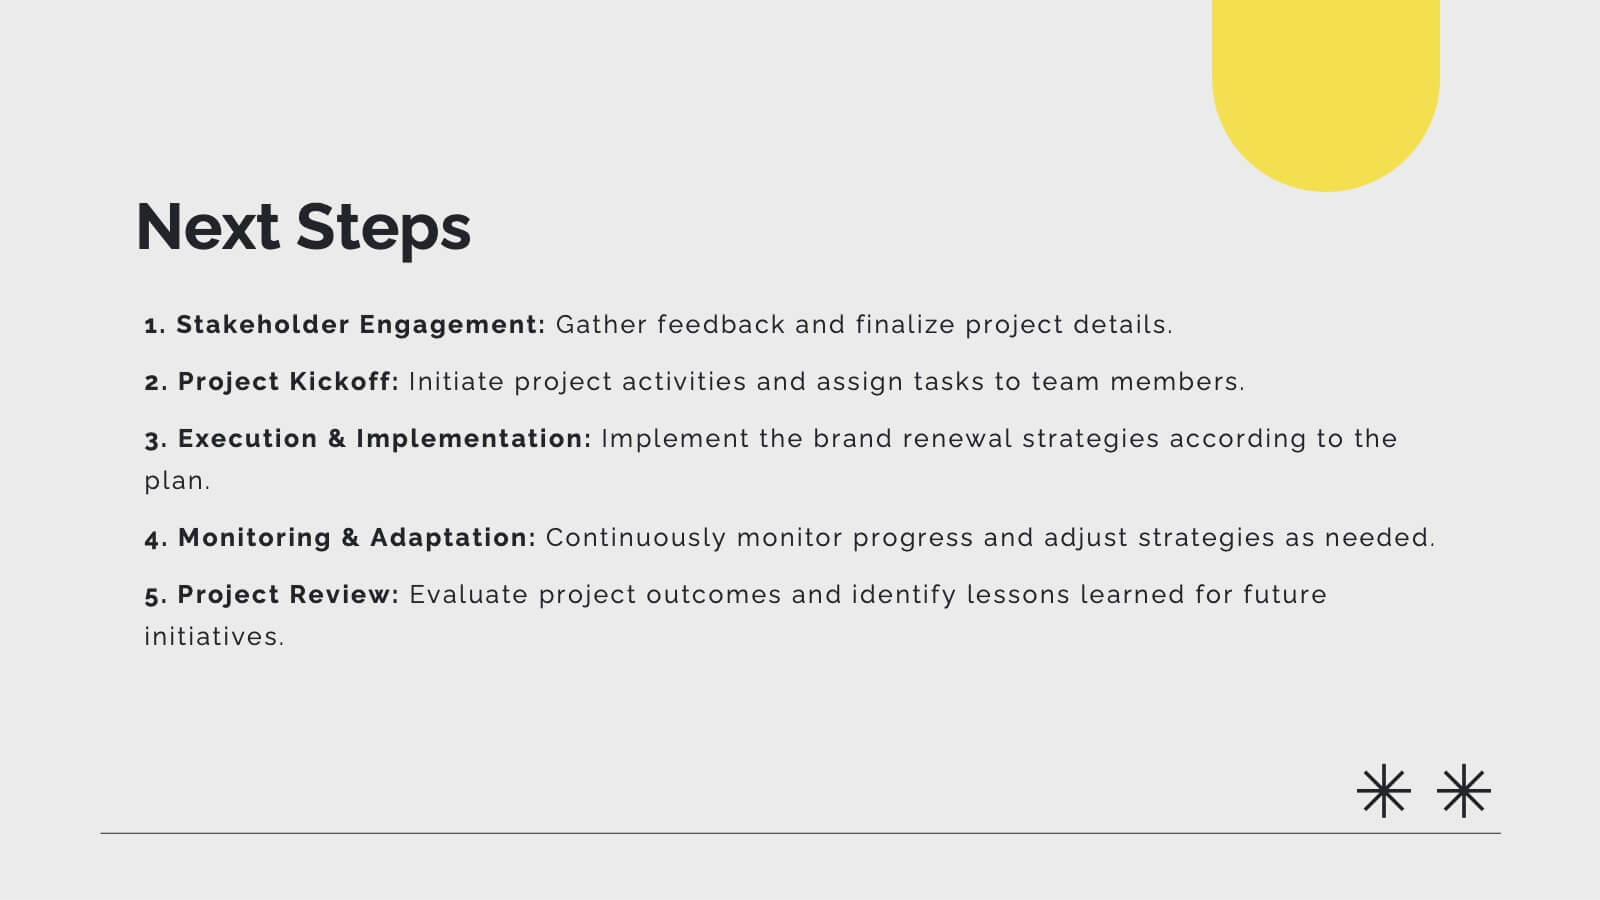
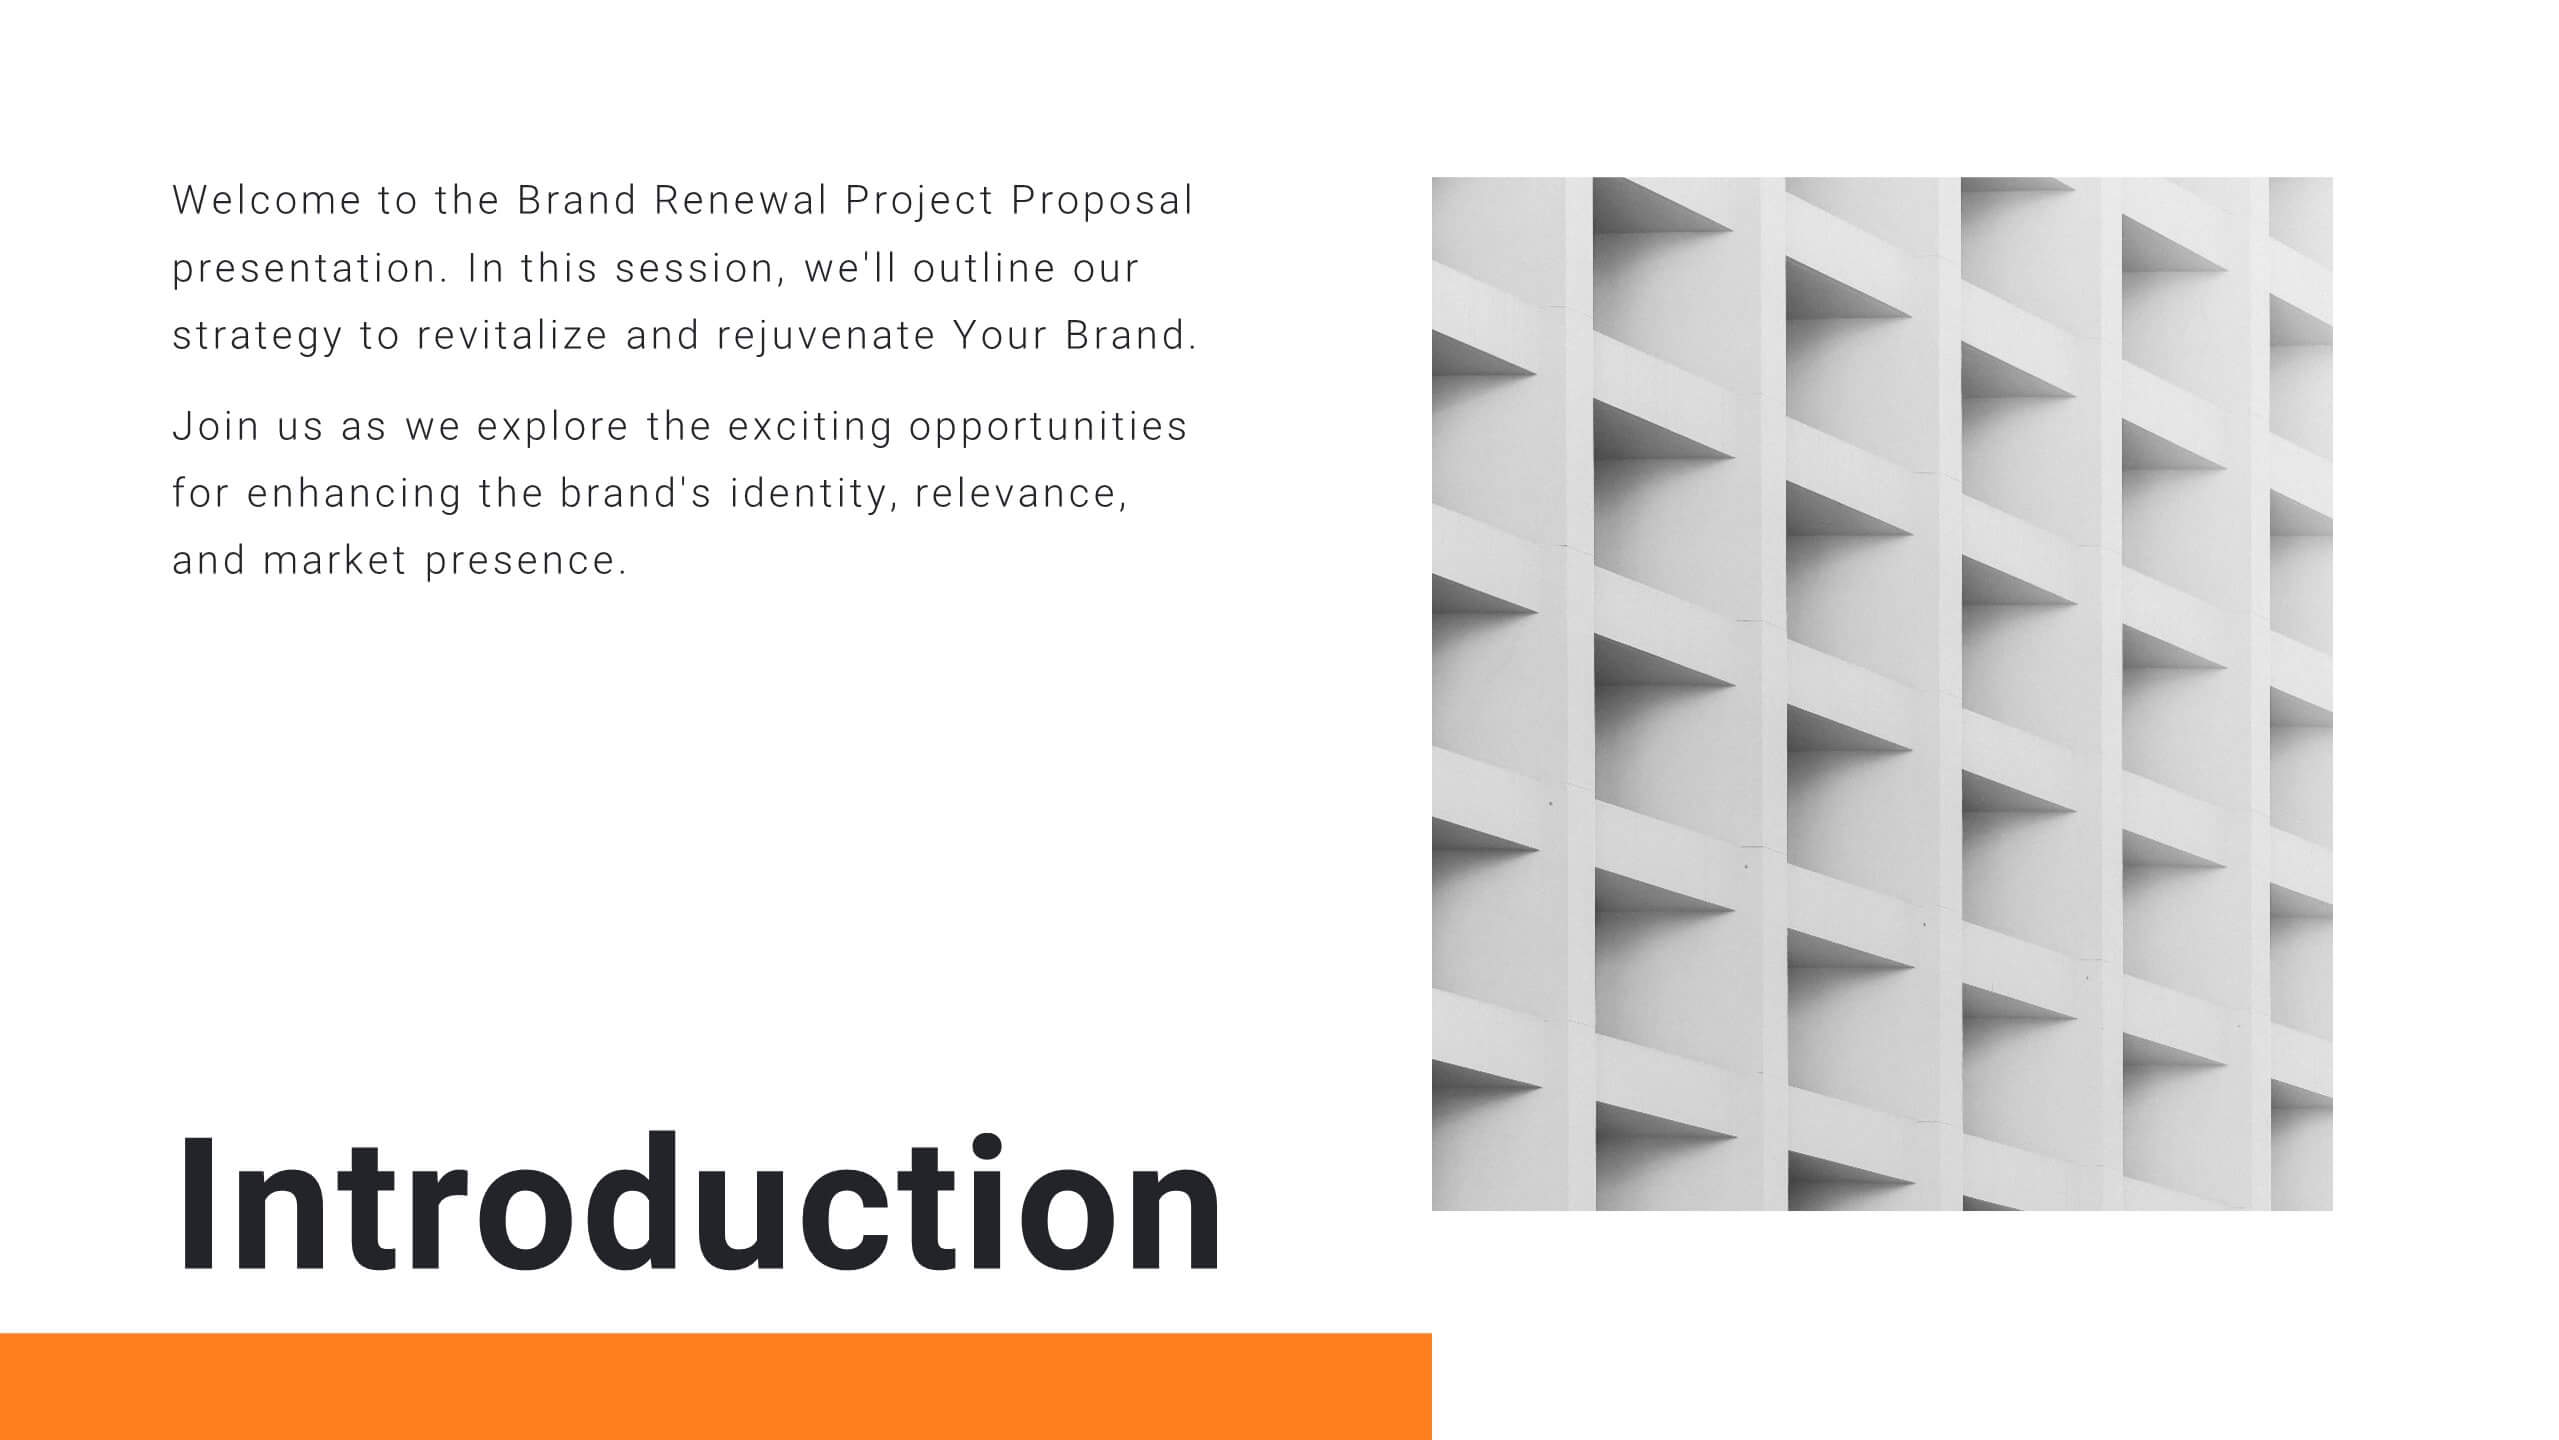
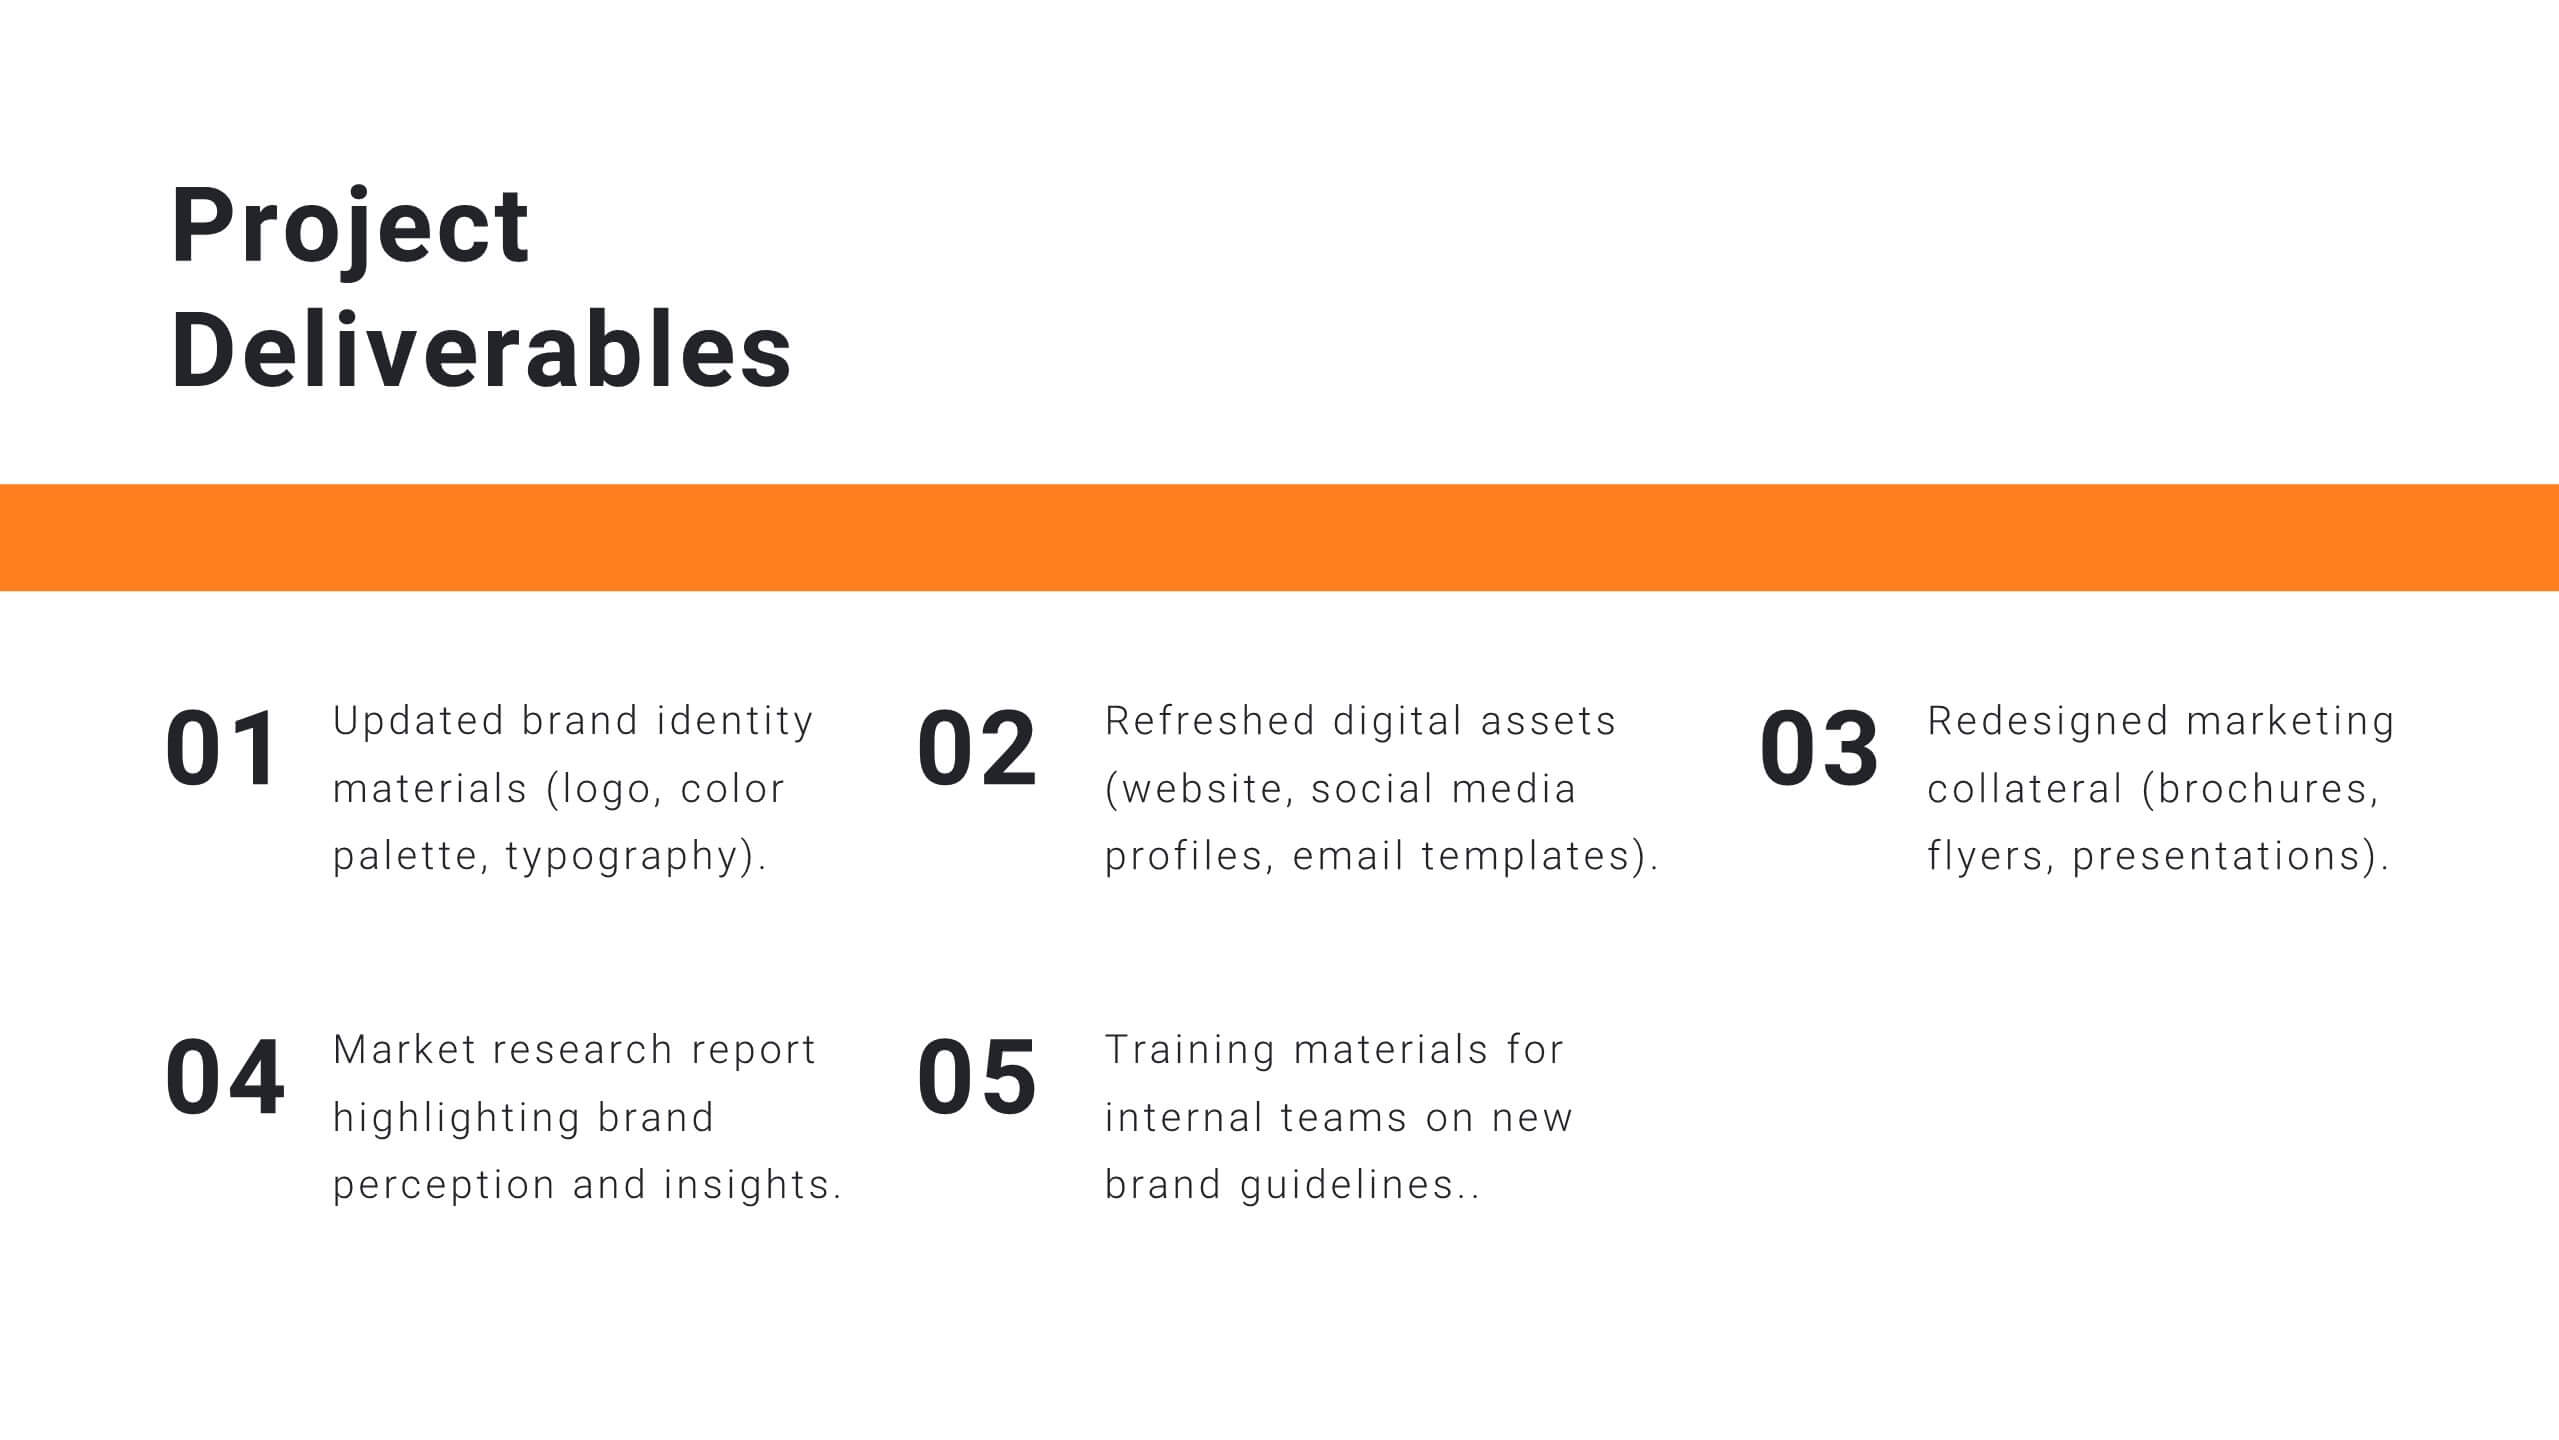
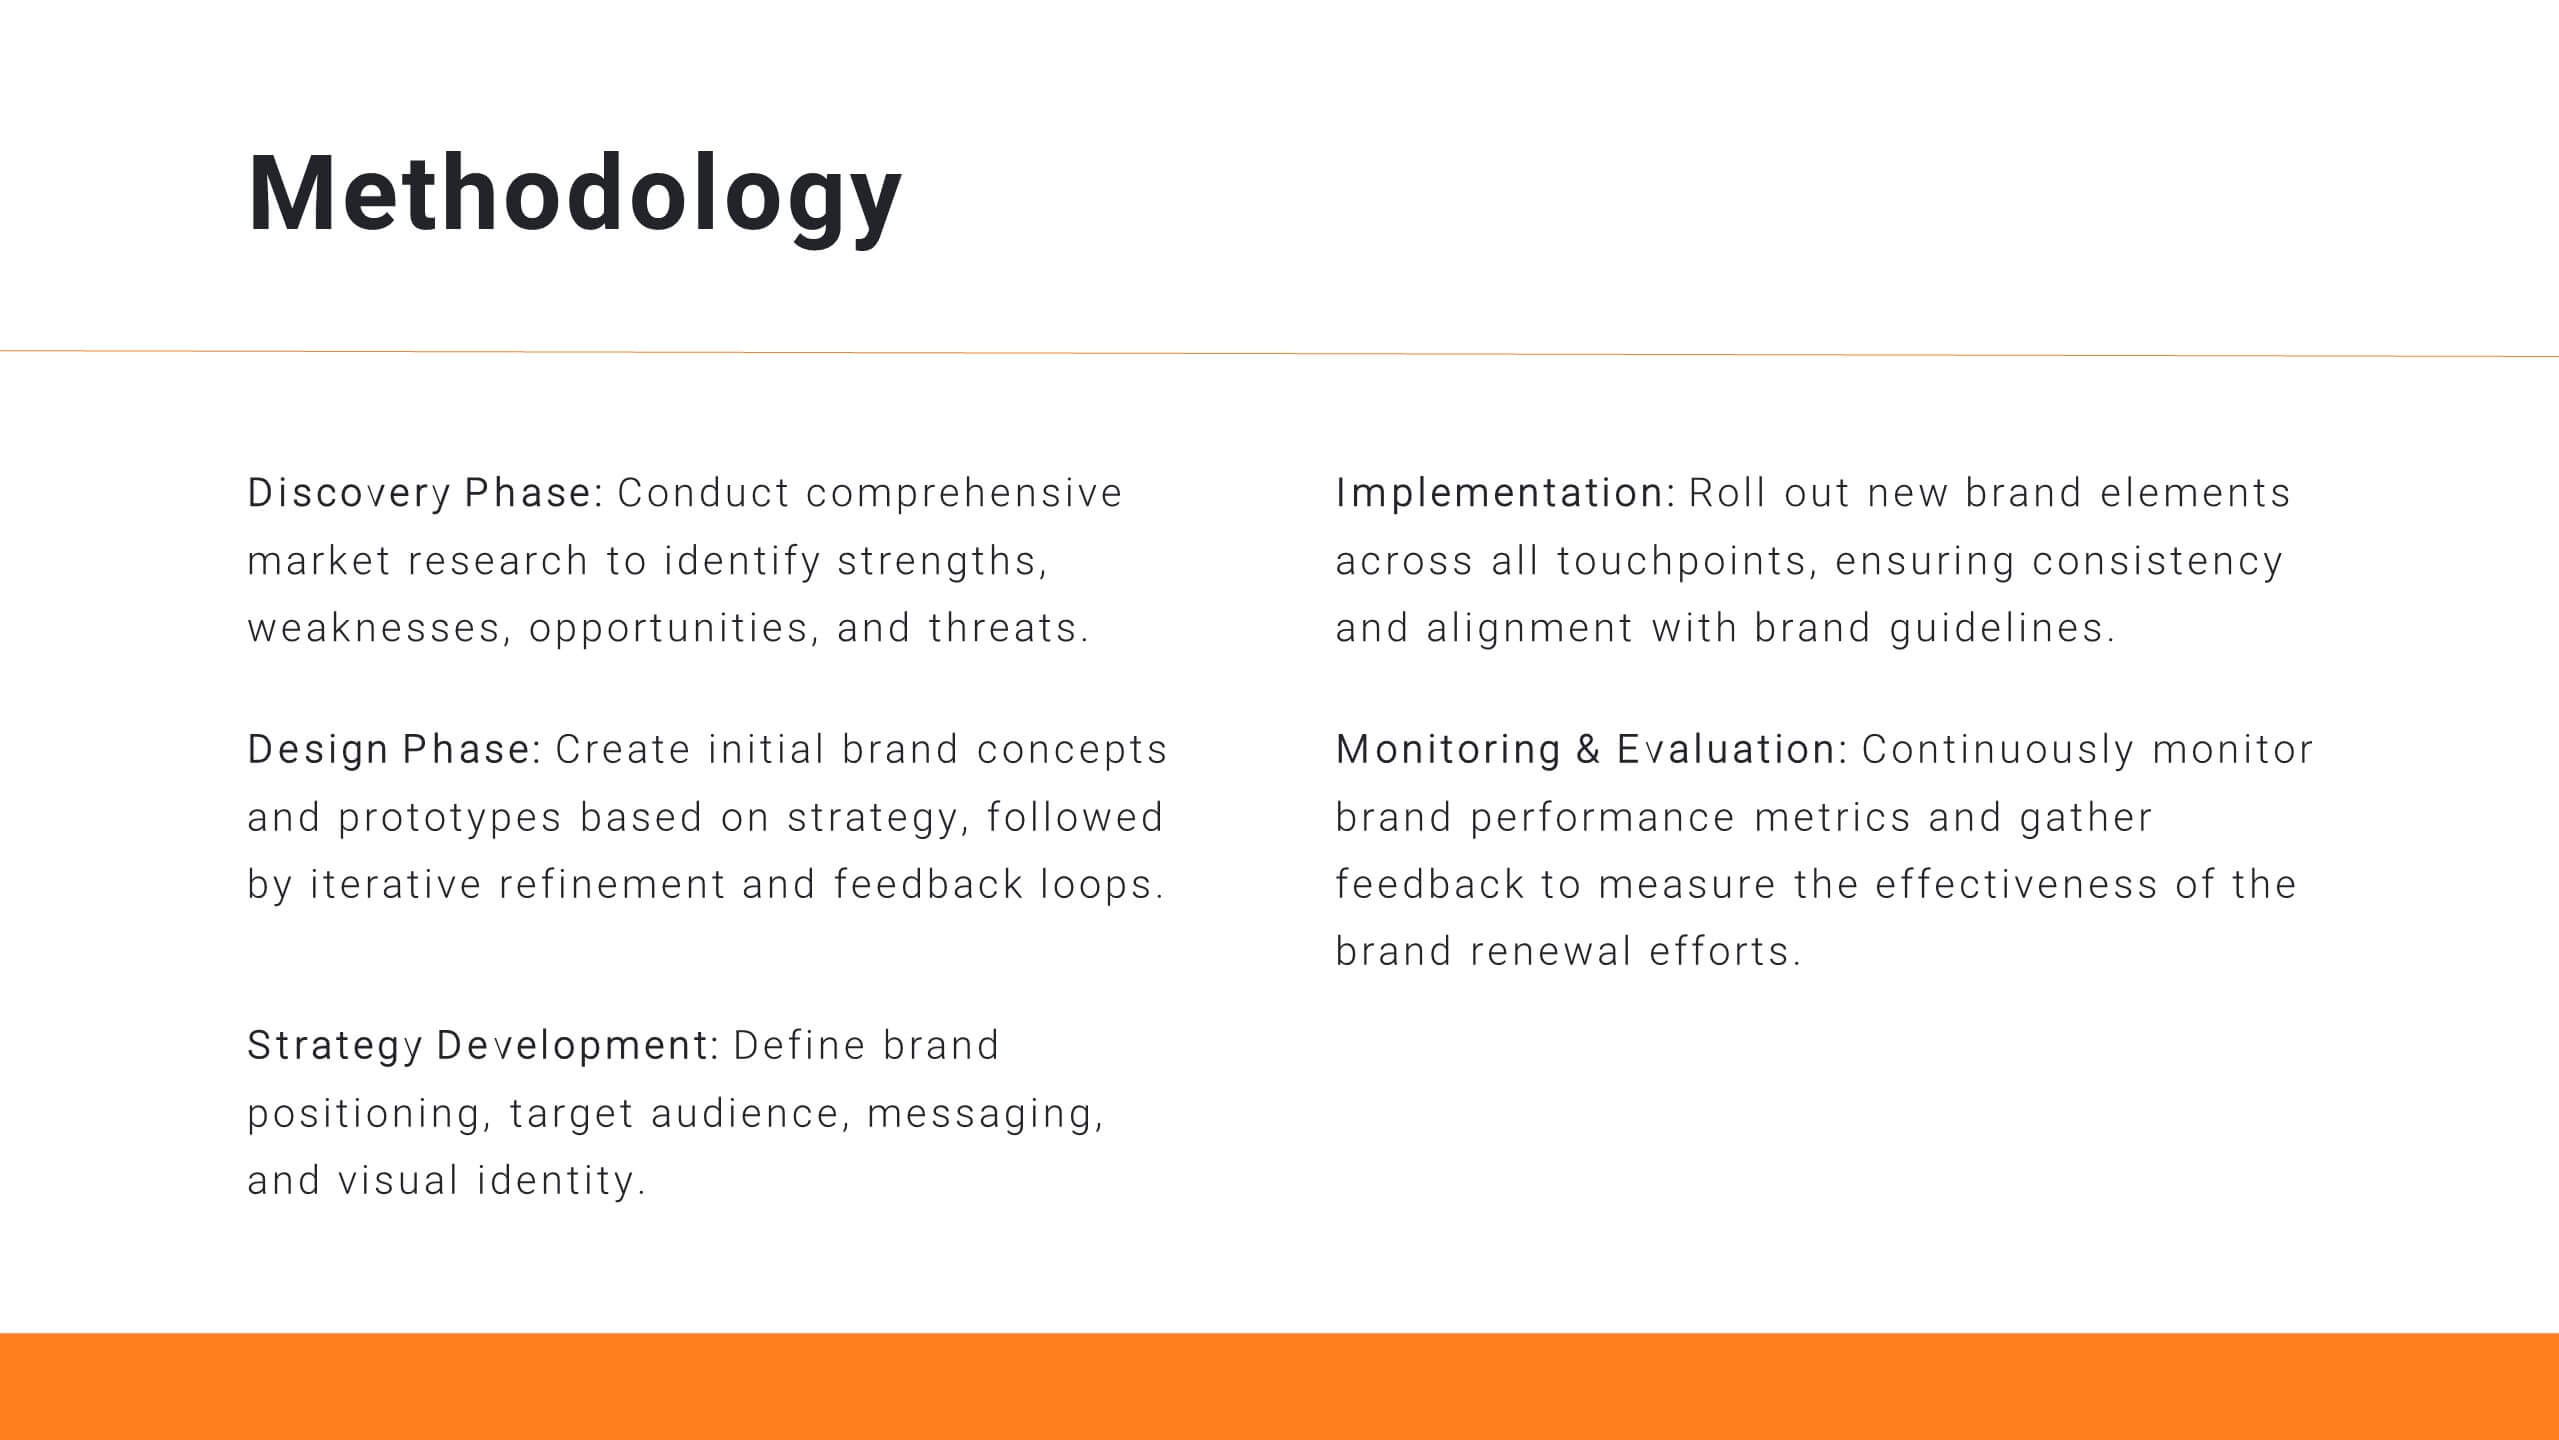
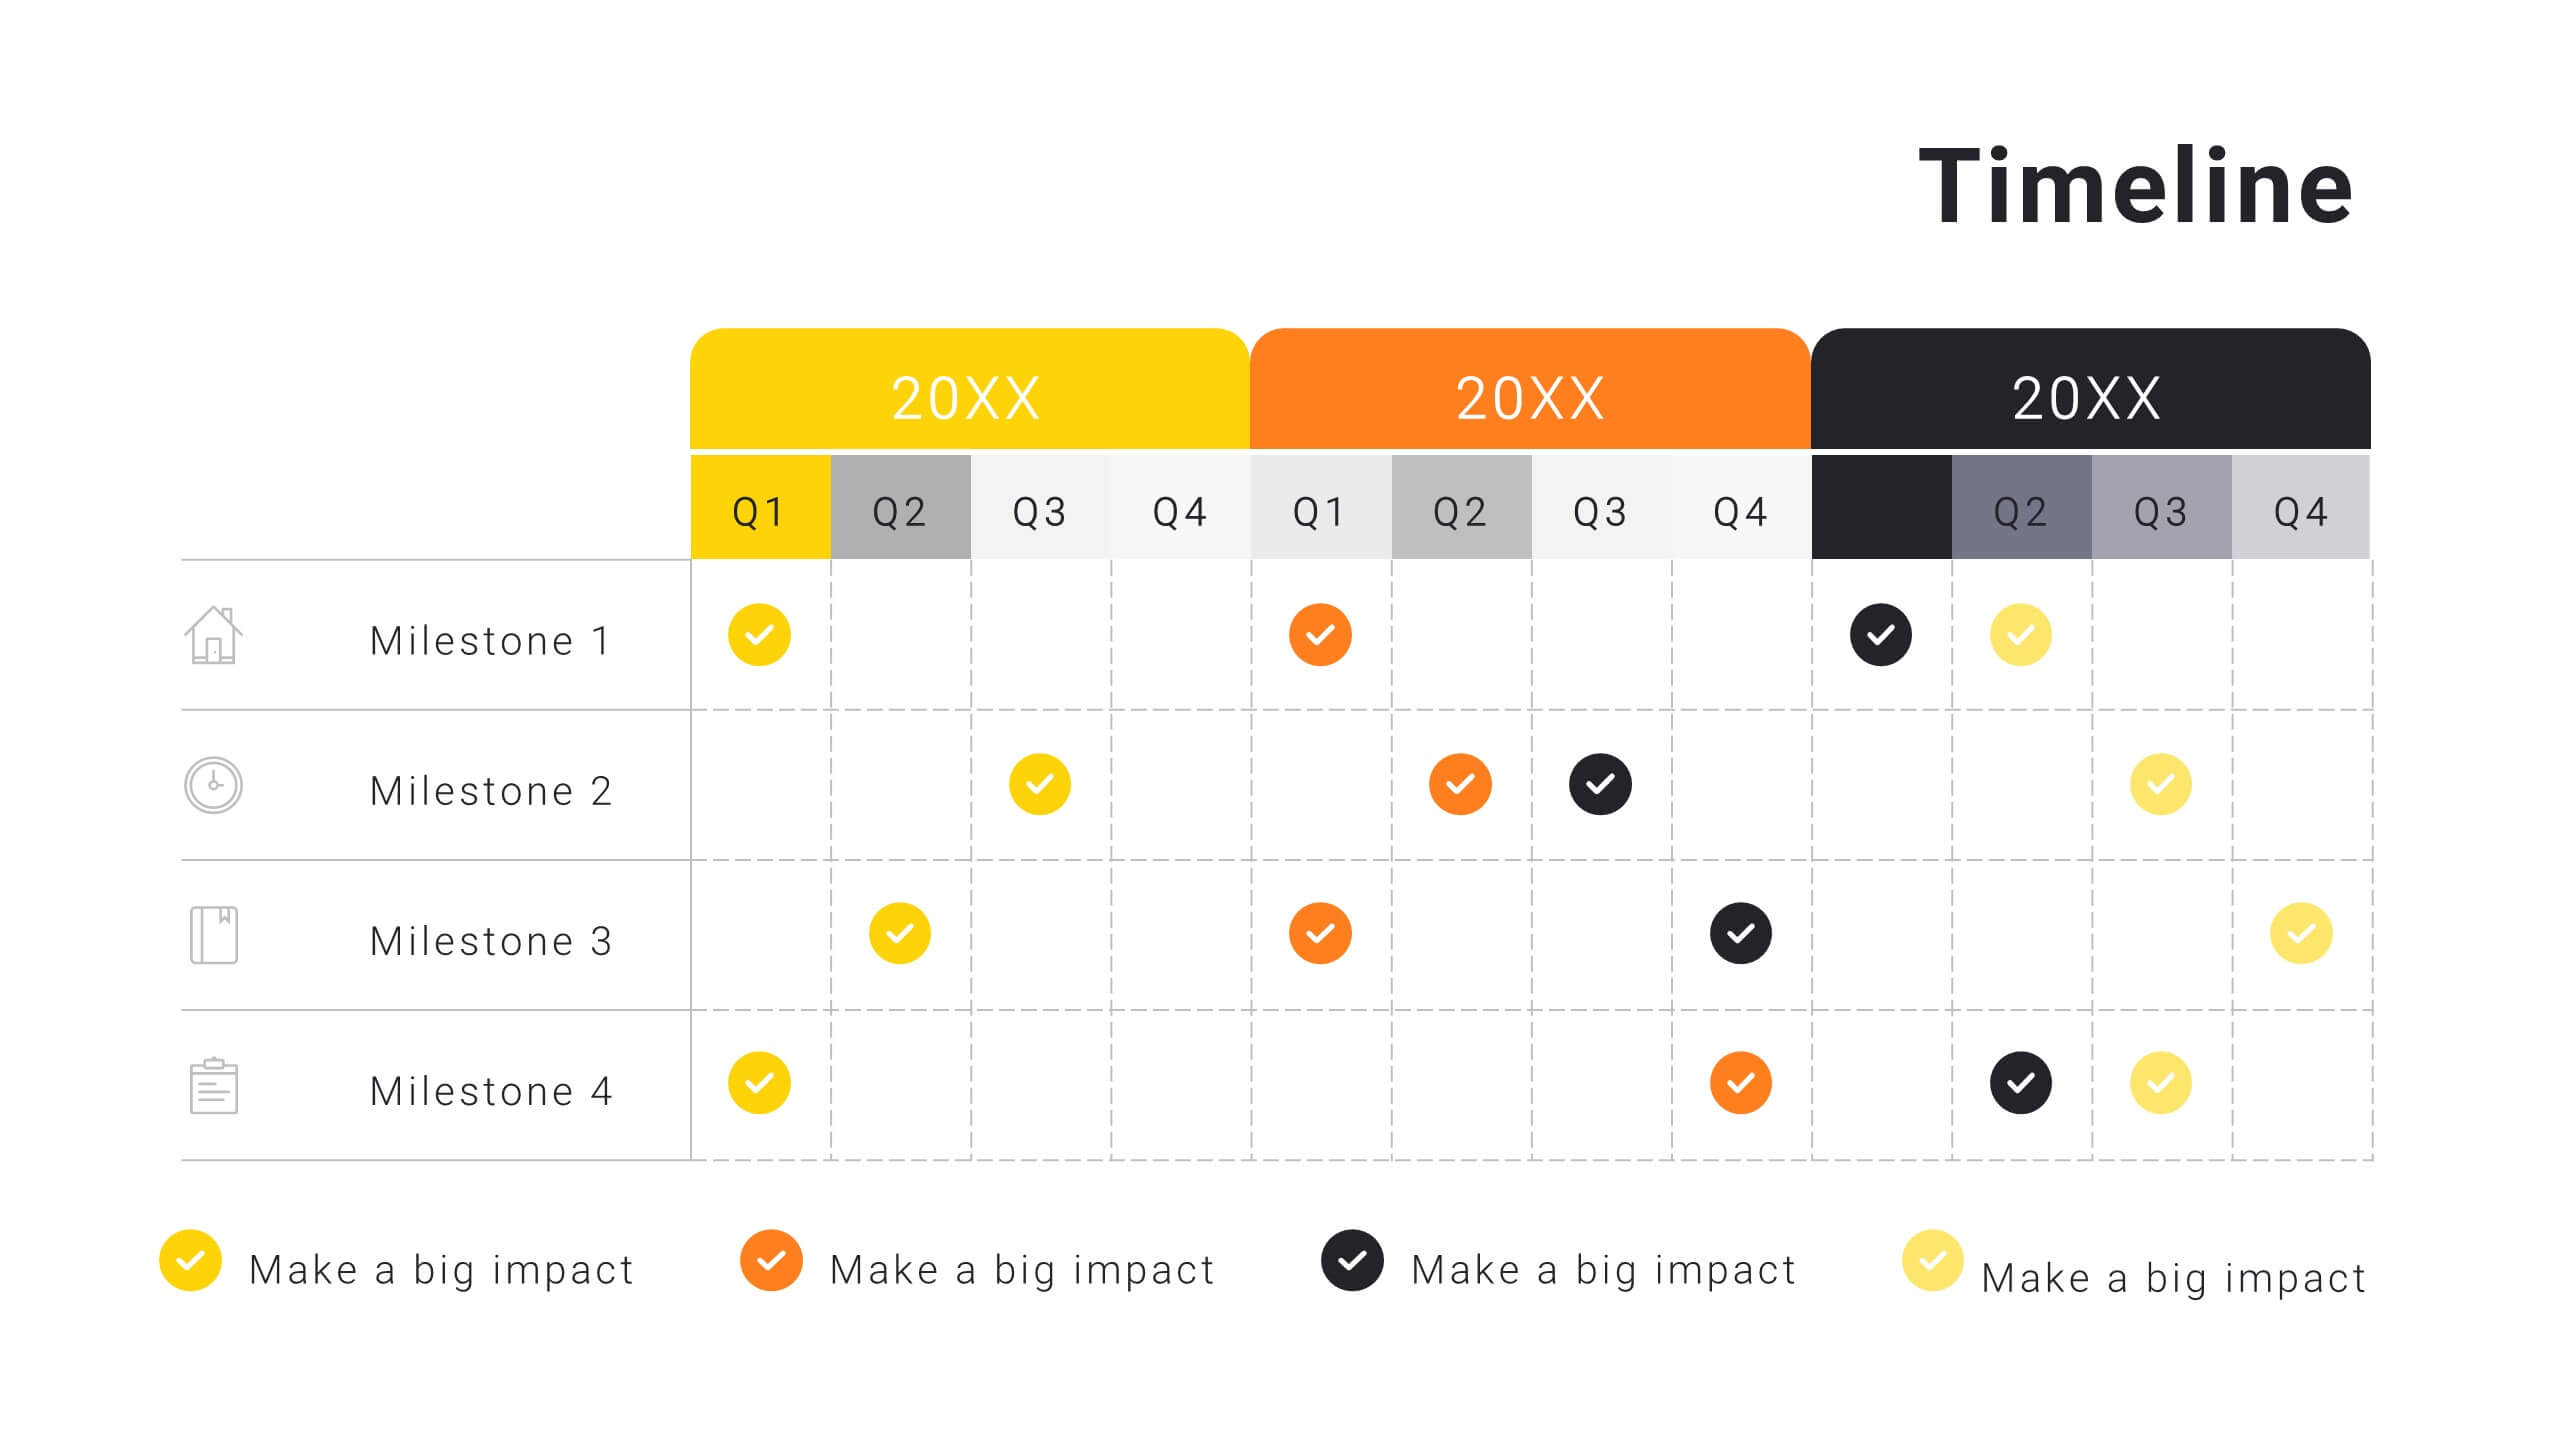
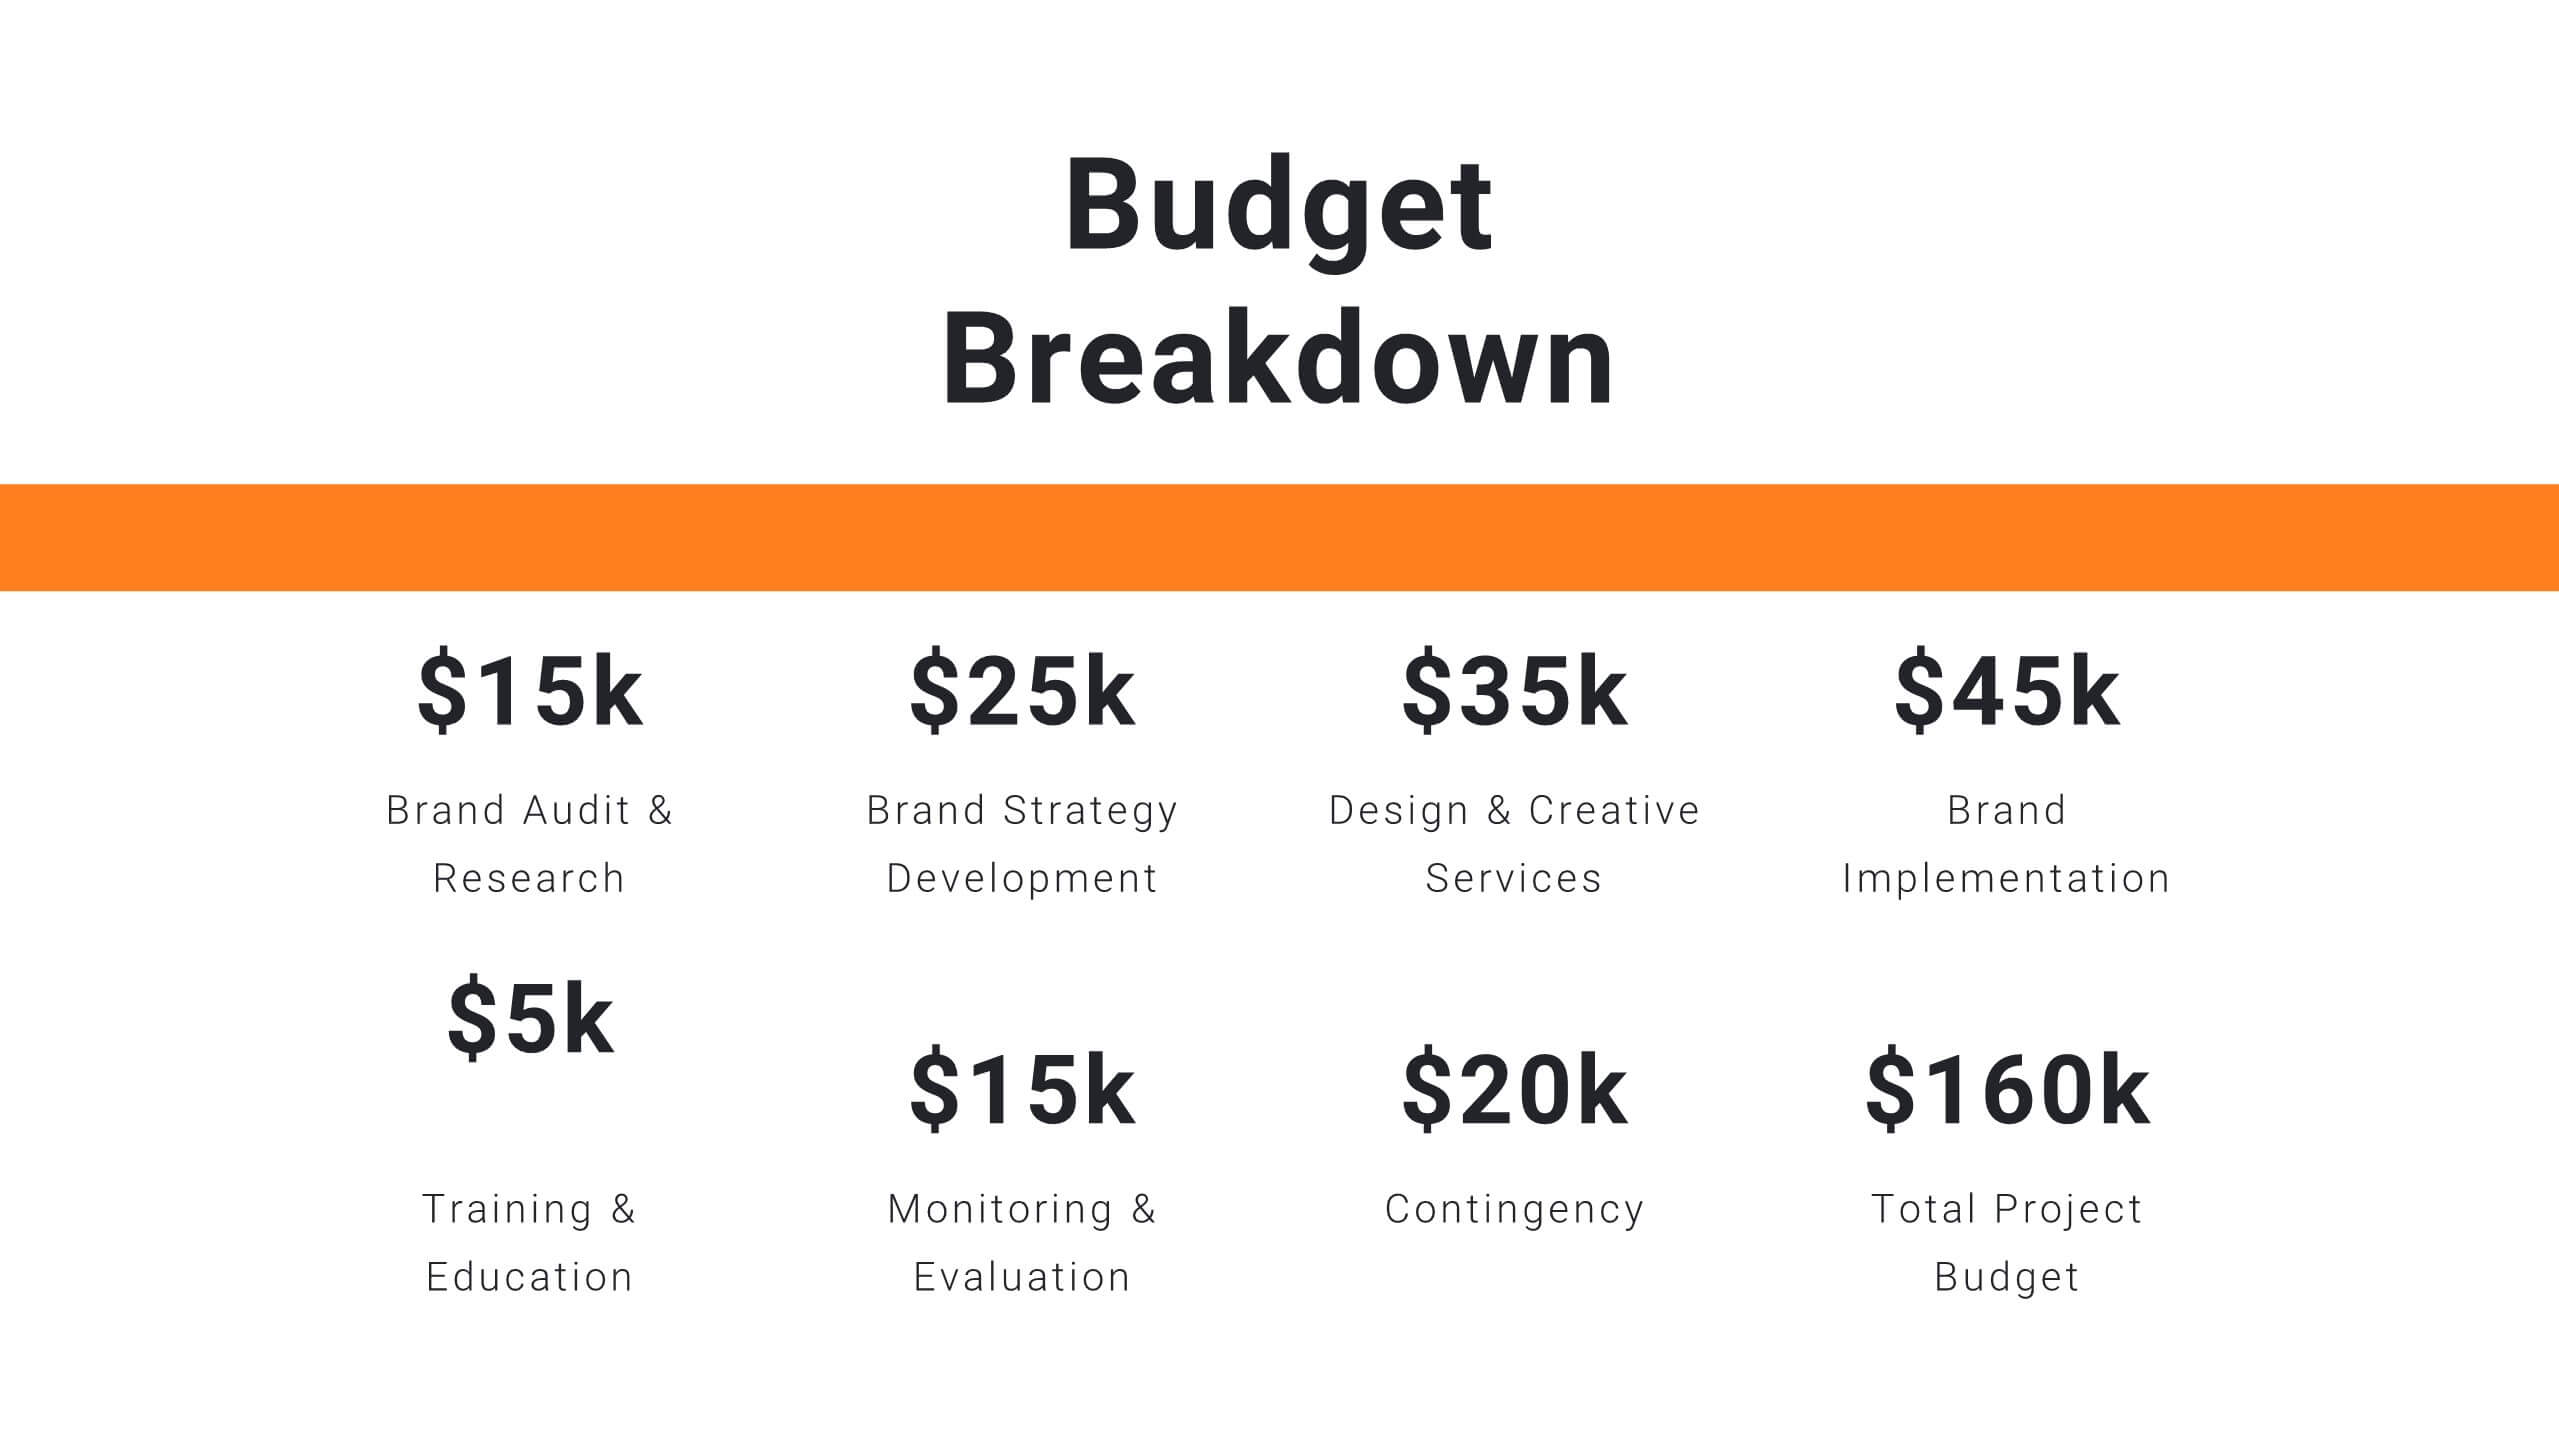
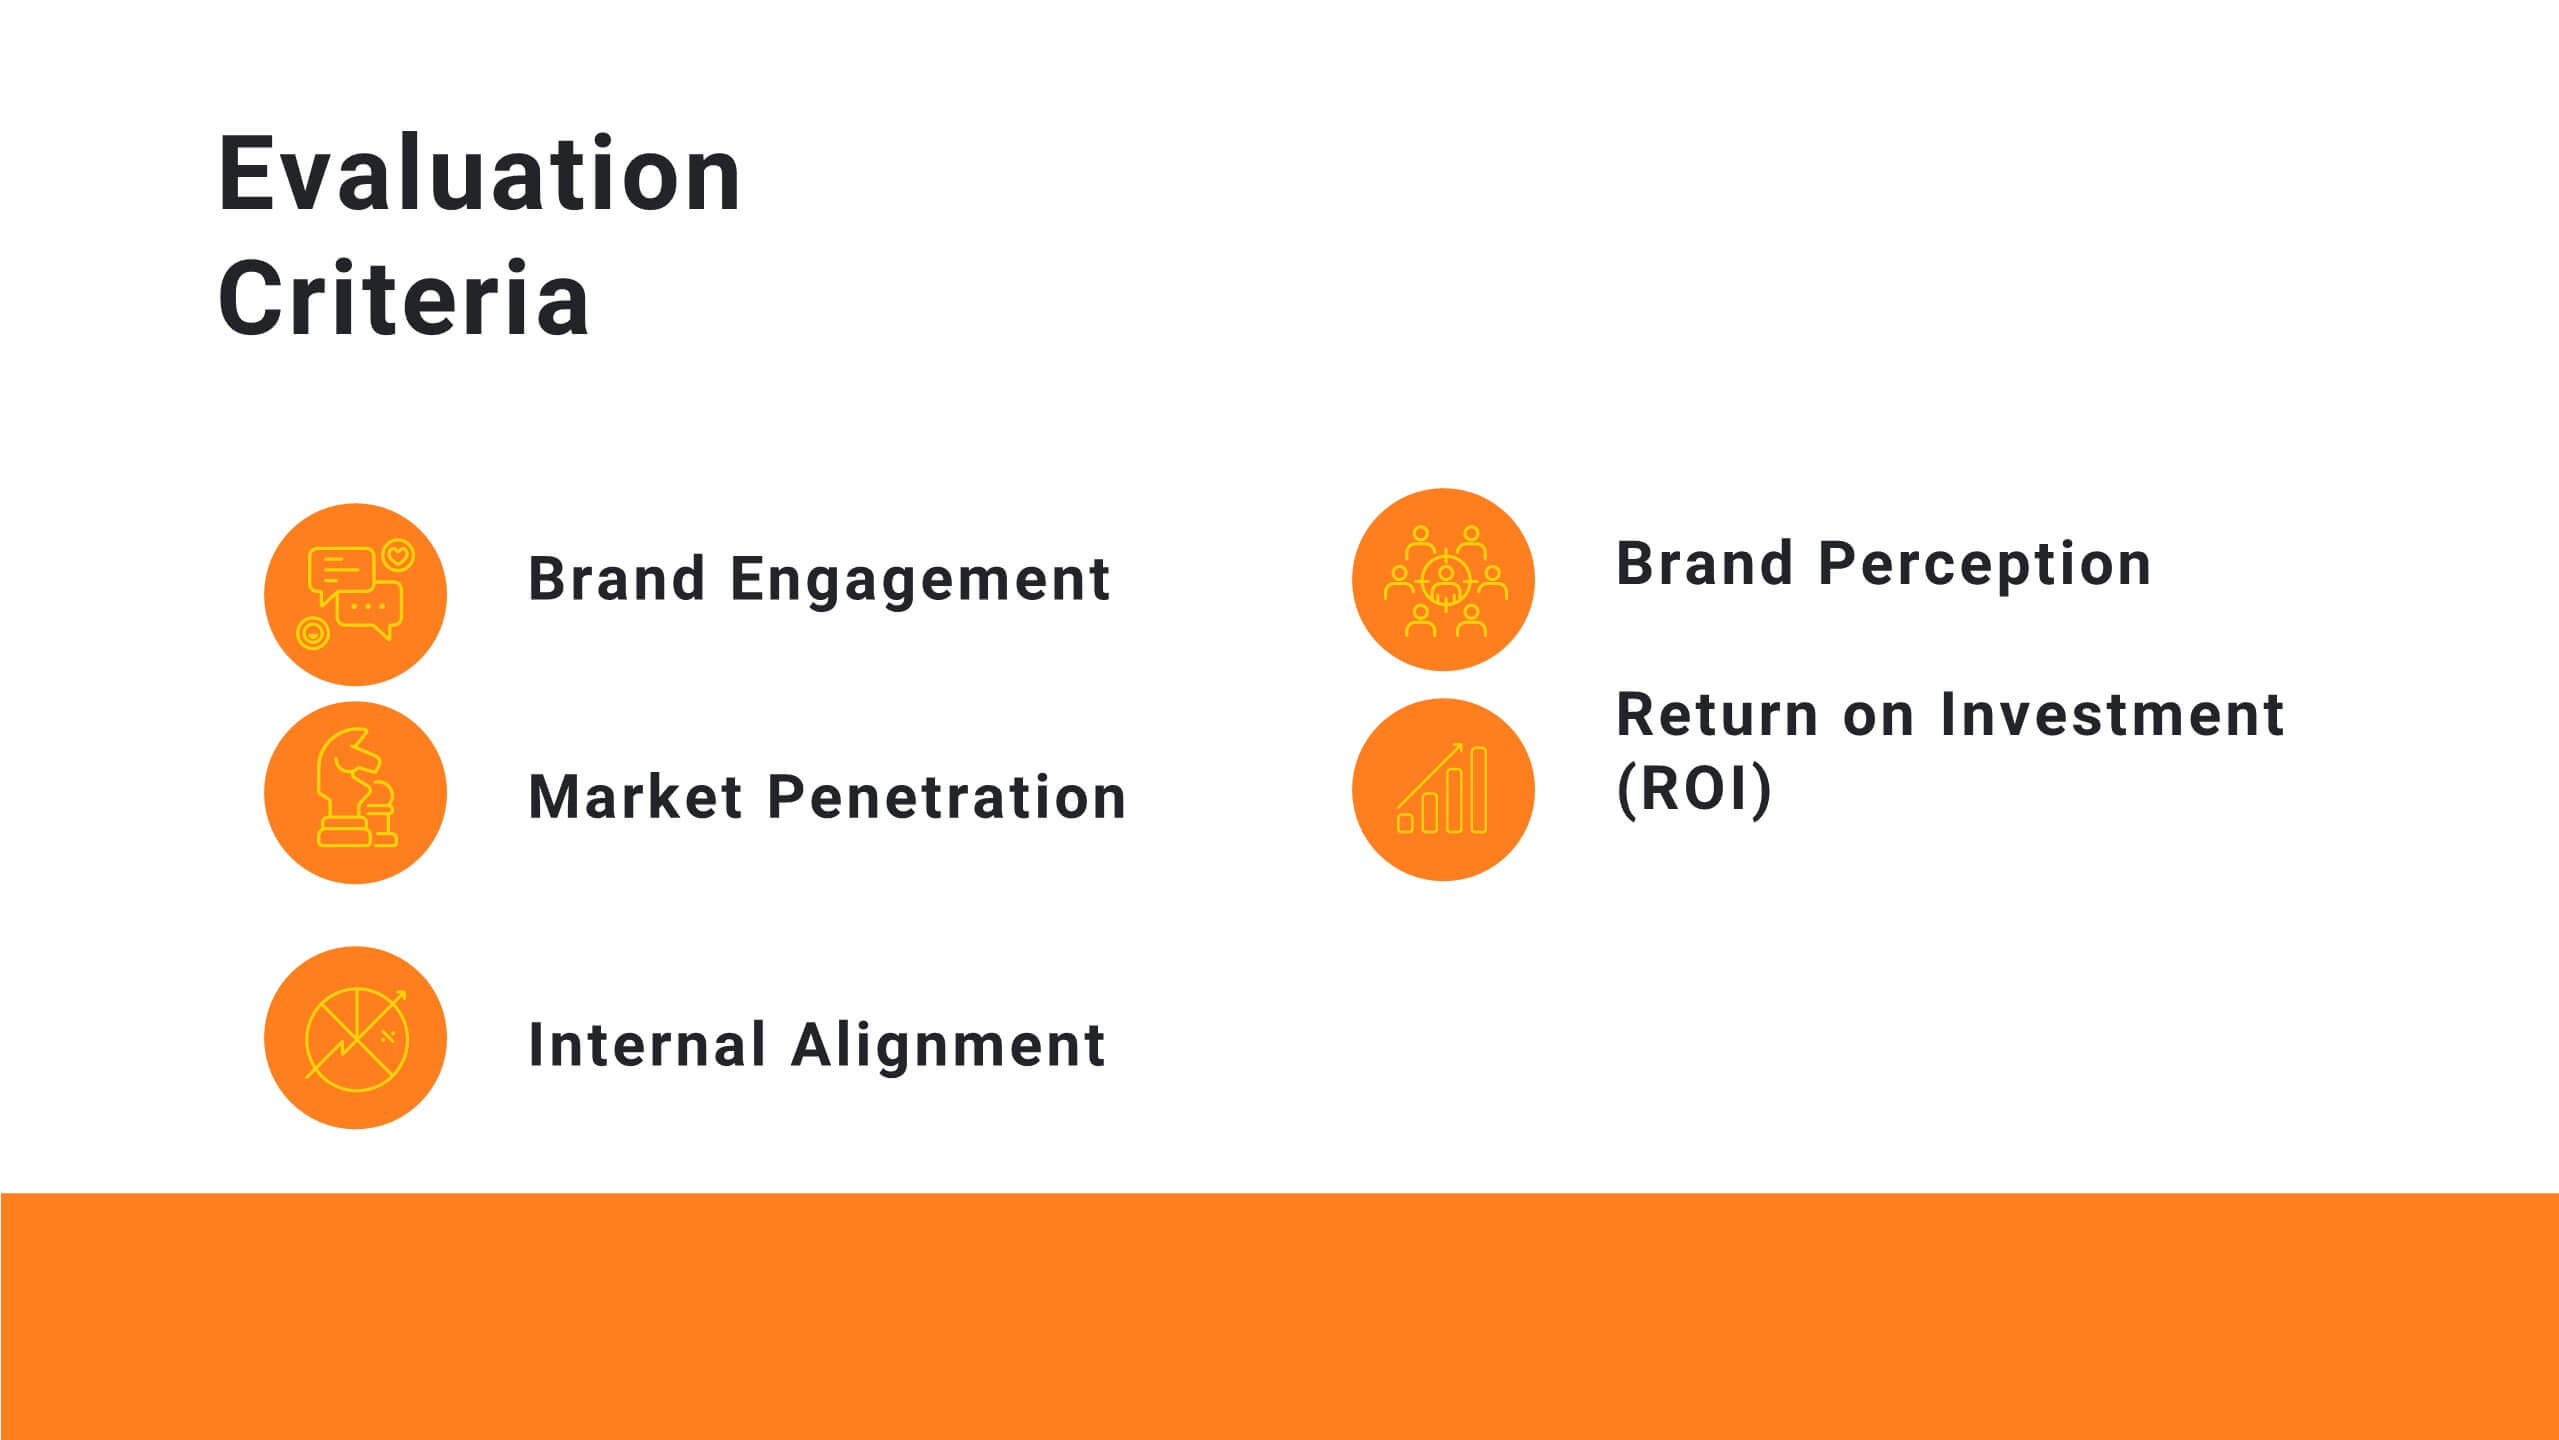
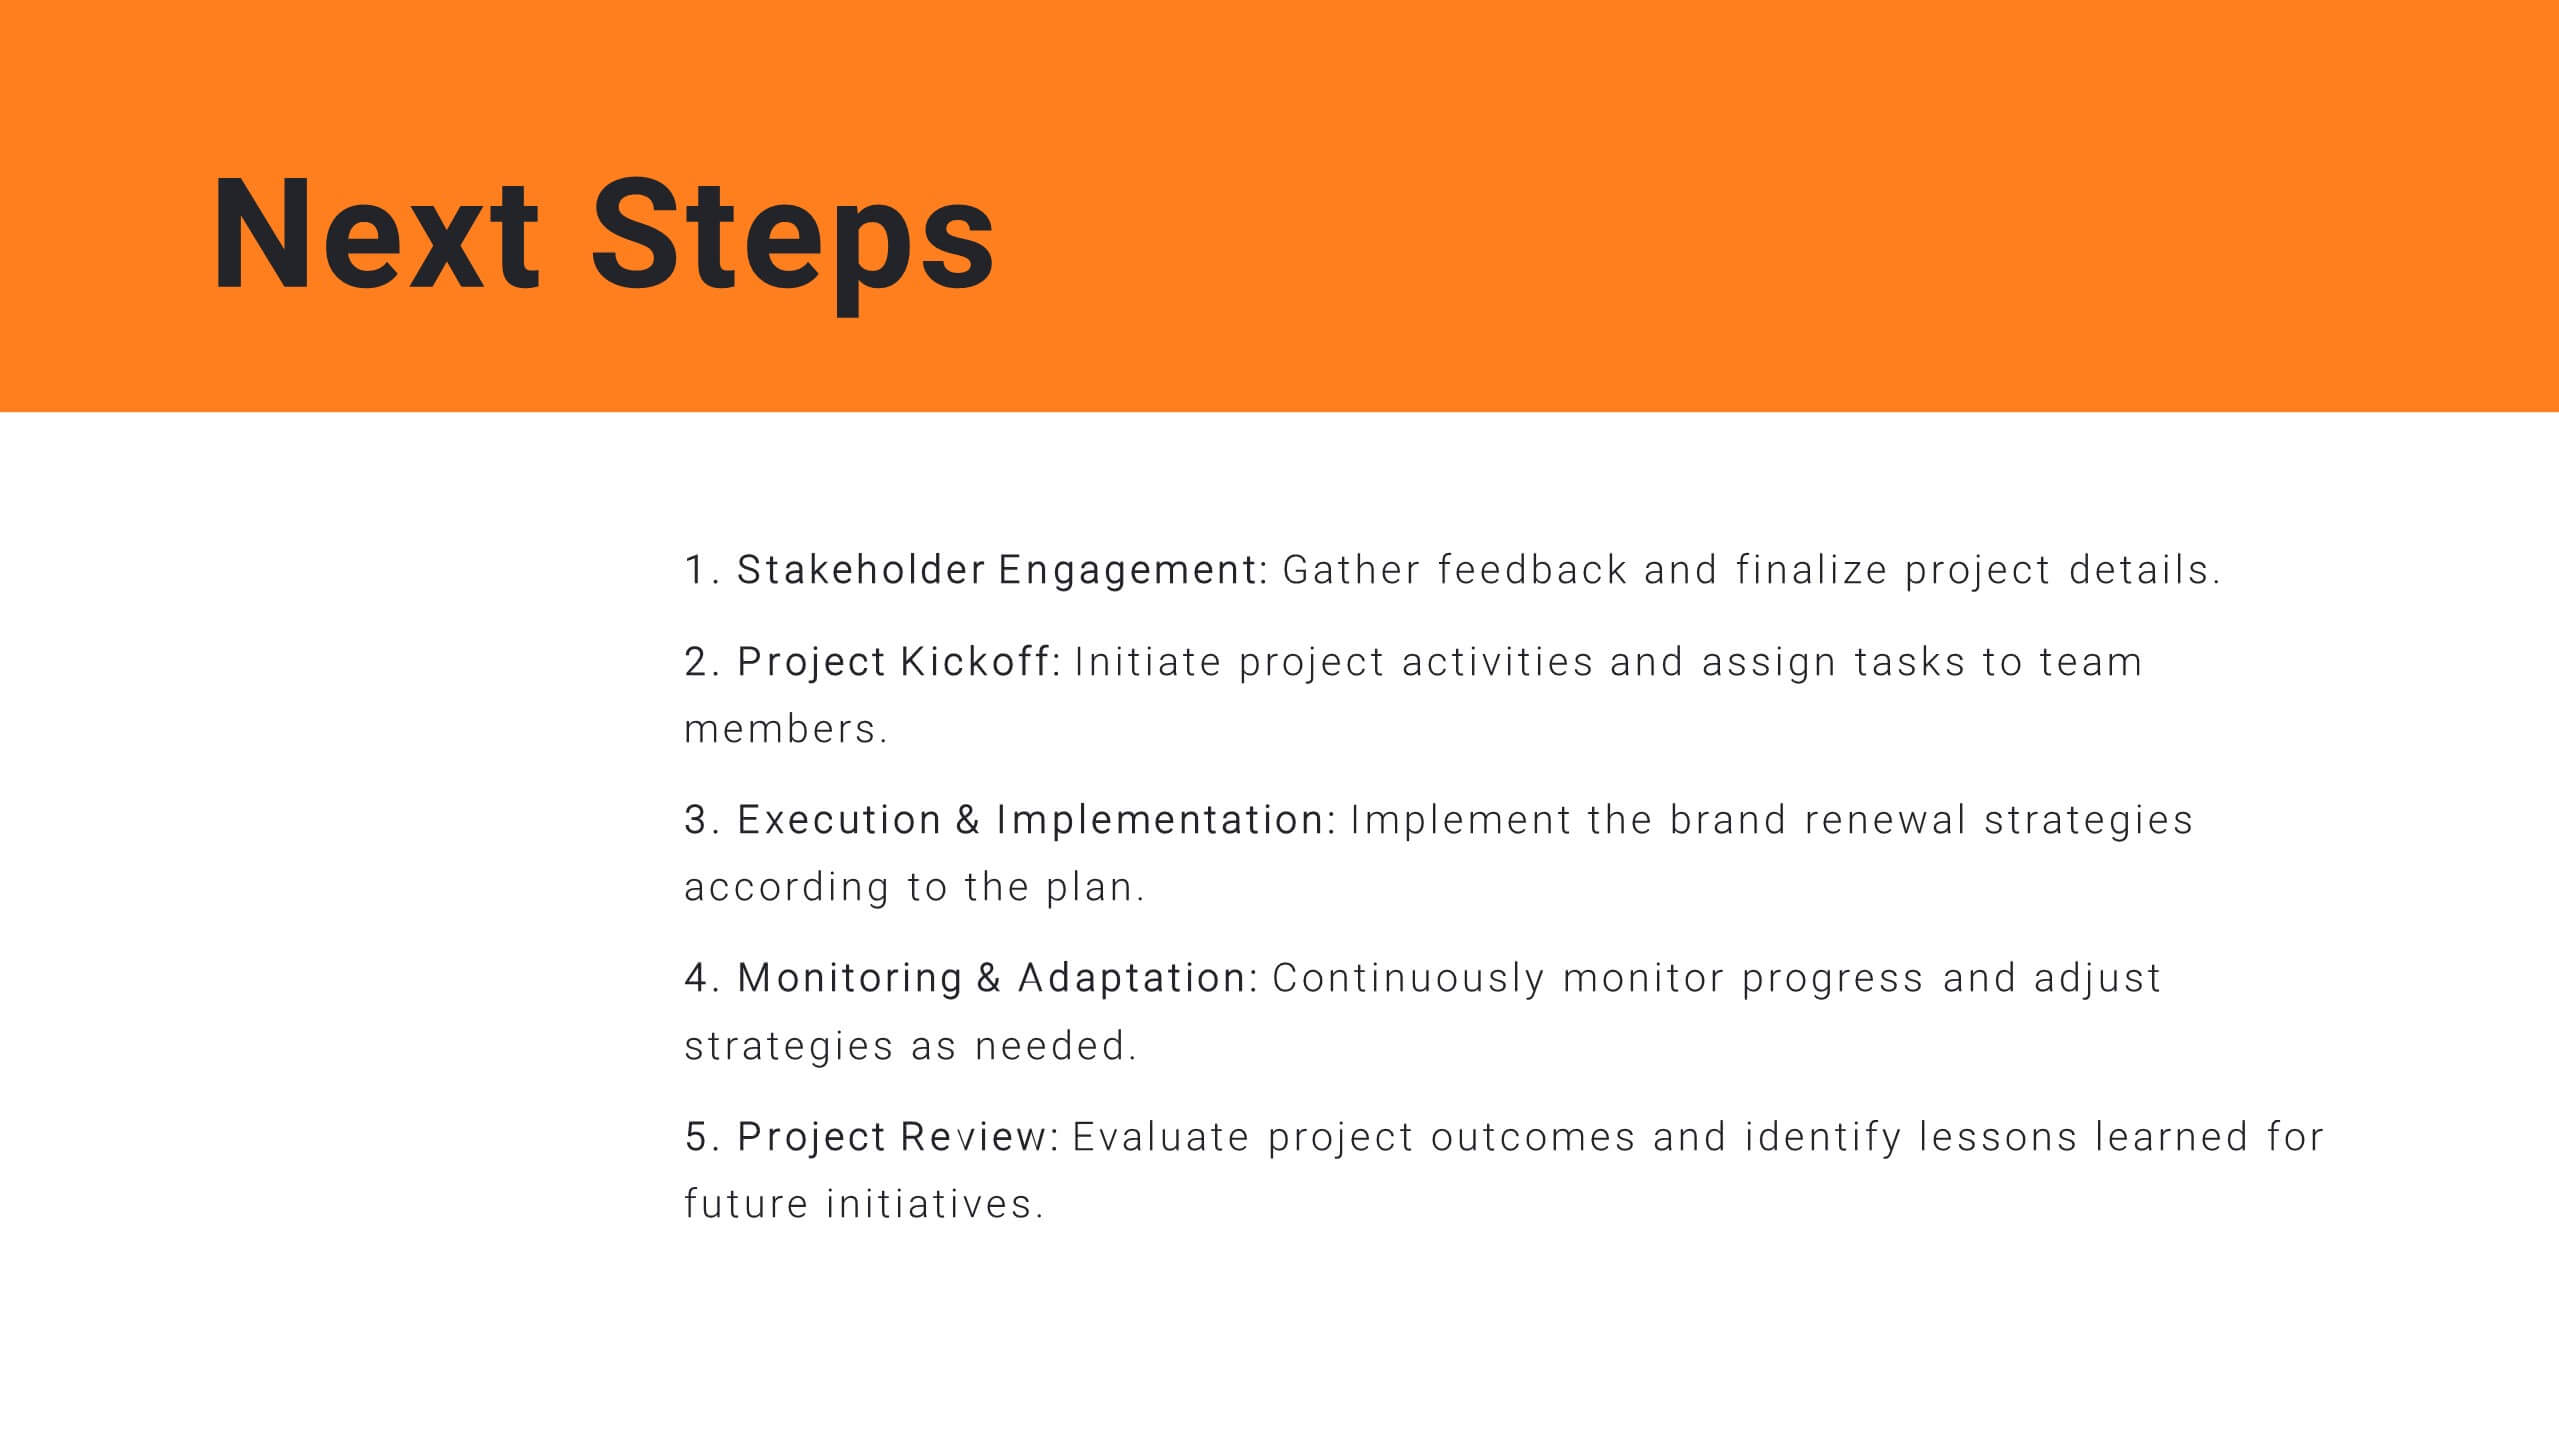
Pulse Project Management Plan Presentation
Streamline your project management with this vibrant template. It covers project overview, objectives, deliverables, methodology, timeline, budget, and risk management. Perfect for clear and engaging presentations. Compatible with PowerPoint, Keynote, and Google Slides for seamless customization.


6 diapositivas
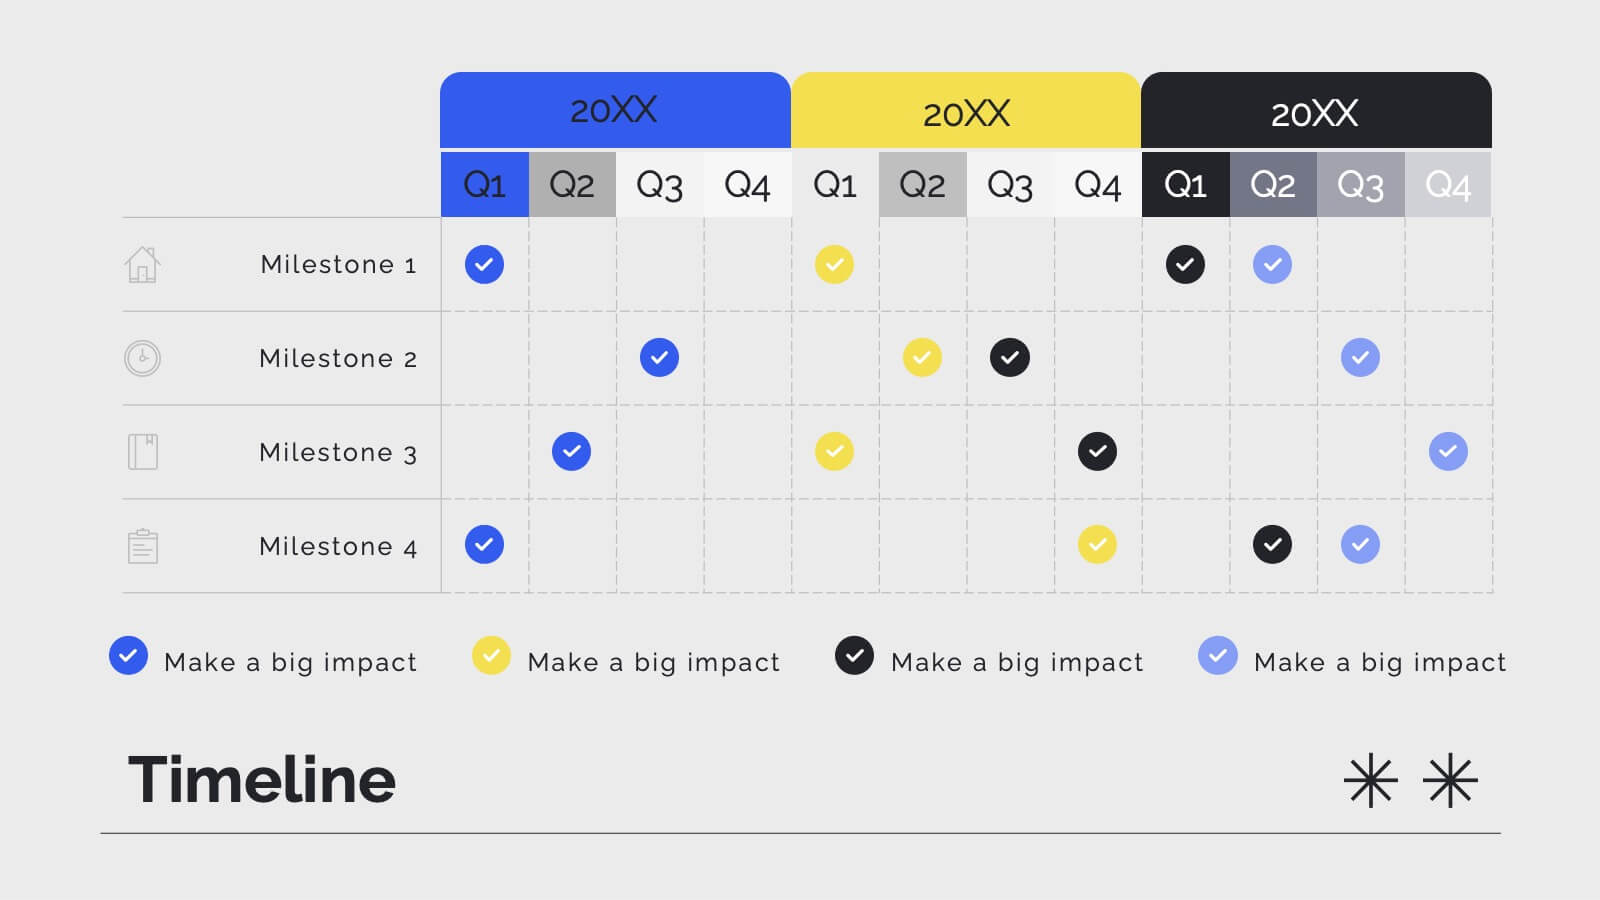
Project Proposal Timeline Infographic
Effectively manage and present the timelines of your projects with our Project Proposal Timeline Templates. Designed for clarity and impact, these templates aid project managers, planners, and coordinators in outlining the key milestones and phases of projects, ensuring all stakeholders are aligned with the project schedule. Each slide in the collection features a streamlined design, utilizing shades of green to emphasize different stages and important dates. The templates are equipped with intuitive layouts that include Gantt charts, timelines, and lists, making it easy to visualize the sequence of activities, dependencies, and deadlines. Customizable for various types of projects, these timeline slides allow for detailed specifications, enabling you to adjust durations, update tasks, and refine objectives as your project evolves. Whether used for internal planning or external presentations, these templates help convey your project's scope and schedule in a professional and easily understandable manner.


7 diapositivas
Watercolor Strategy Infographic
Dive into a cascade of strategic insights with our watercolor strategy infographic. Presented on a crisp white canvas, the splash of yellow, green, and blue emanates a fluidity that mirrors the dynamic nature of business strategies. Each hue merges seamlessly to provide a visual treat while retaining the core informational value. Tailored for Powerpoint, Keynote, and Google Slides, this template is embellished with customizable graphics, intricate icons, and flexible image placeholders, making it an ideal choice for any strategic visualization. Let your strategy flow, vivid and vibrant, just like watercolors on paper.


6 diapositivas
Supply Chain Management Strategy Presentation
Enhance your logistics planning with the Supply Chain Management Strategy template. This visually structured design simplifies key supply chain components, from procurement to distribution, making it ideal for analysts and operations teams. Fully customizable and compatible with PowerPoint, Keynote, and Google Slides for a seamless and professional presentation experience.


21 diapositivas
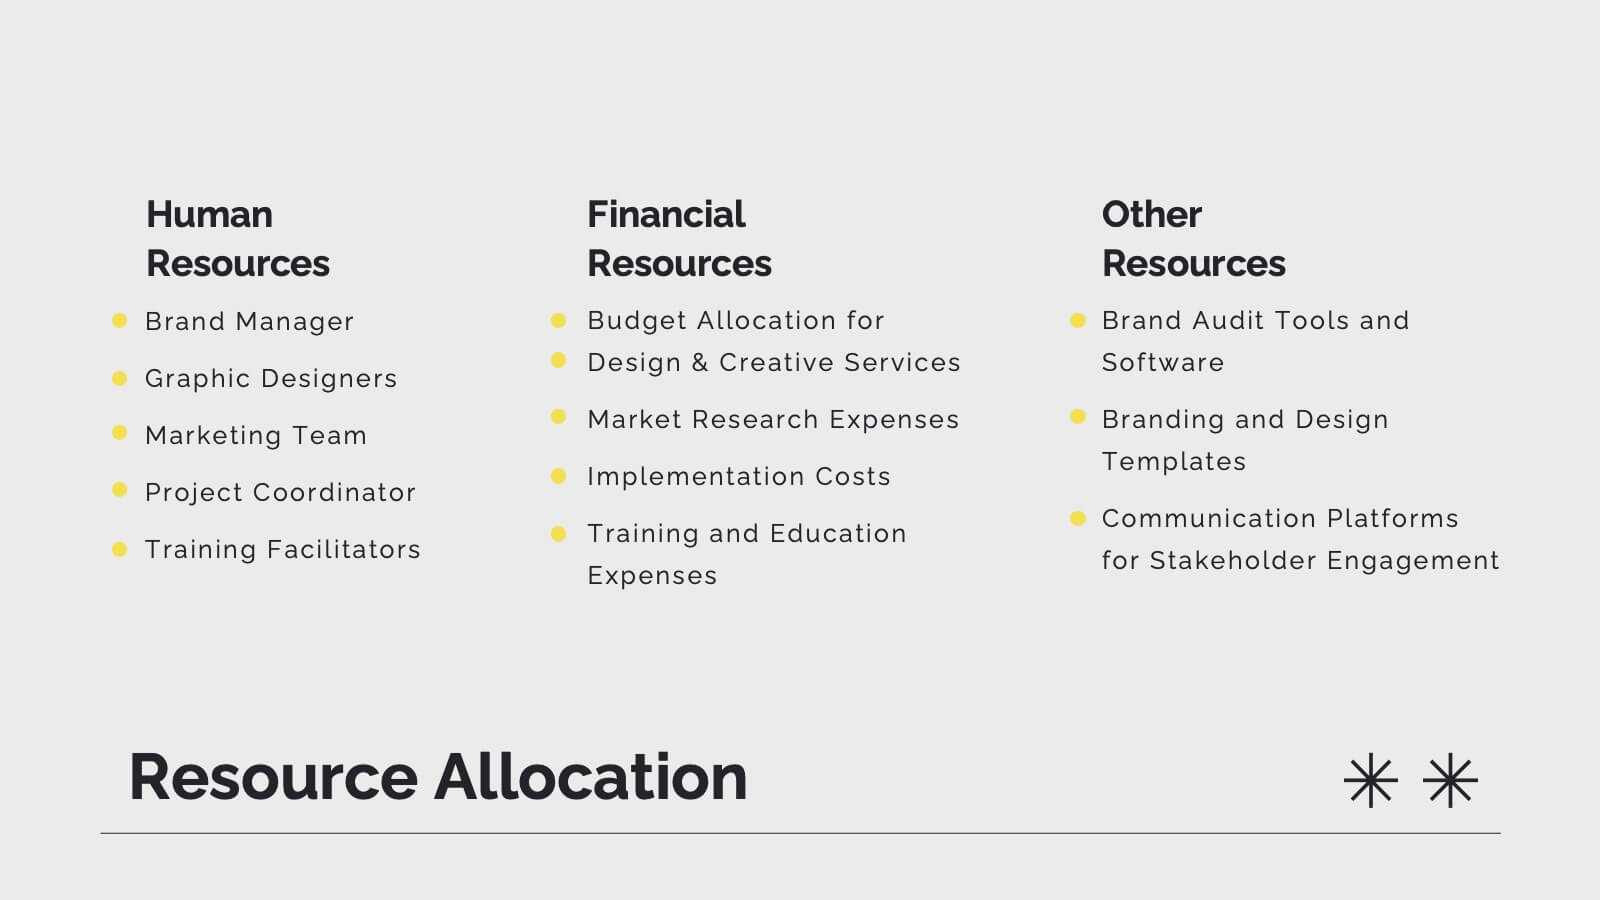
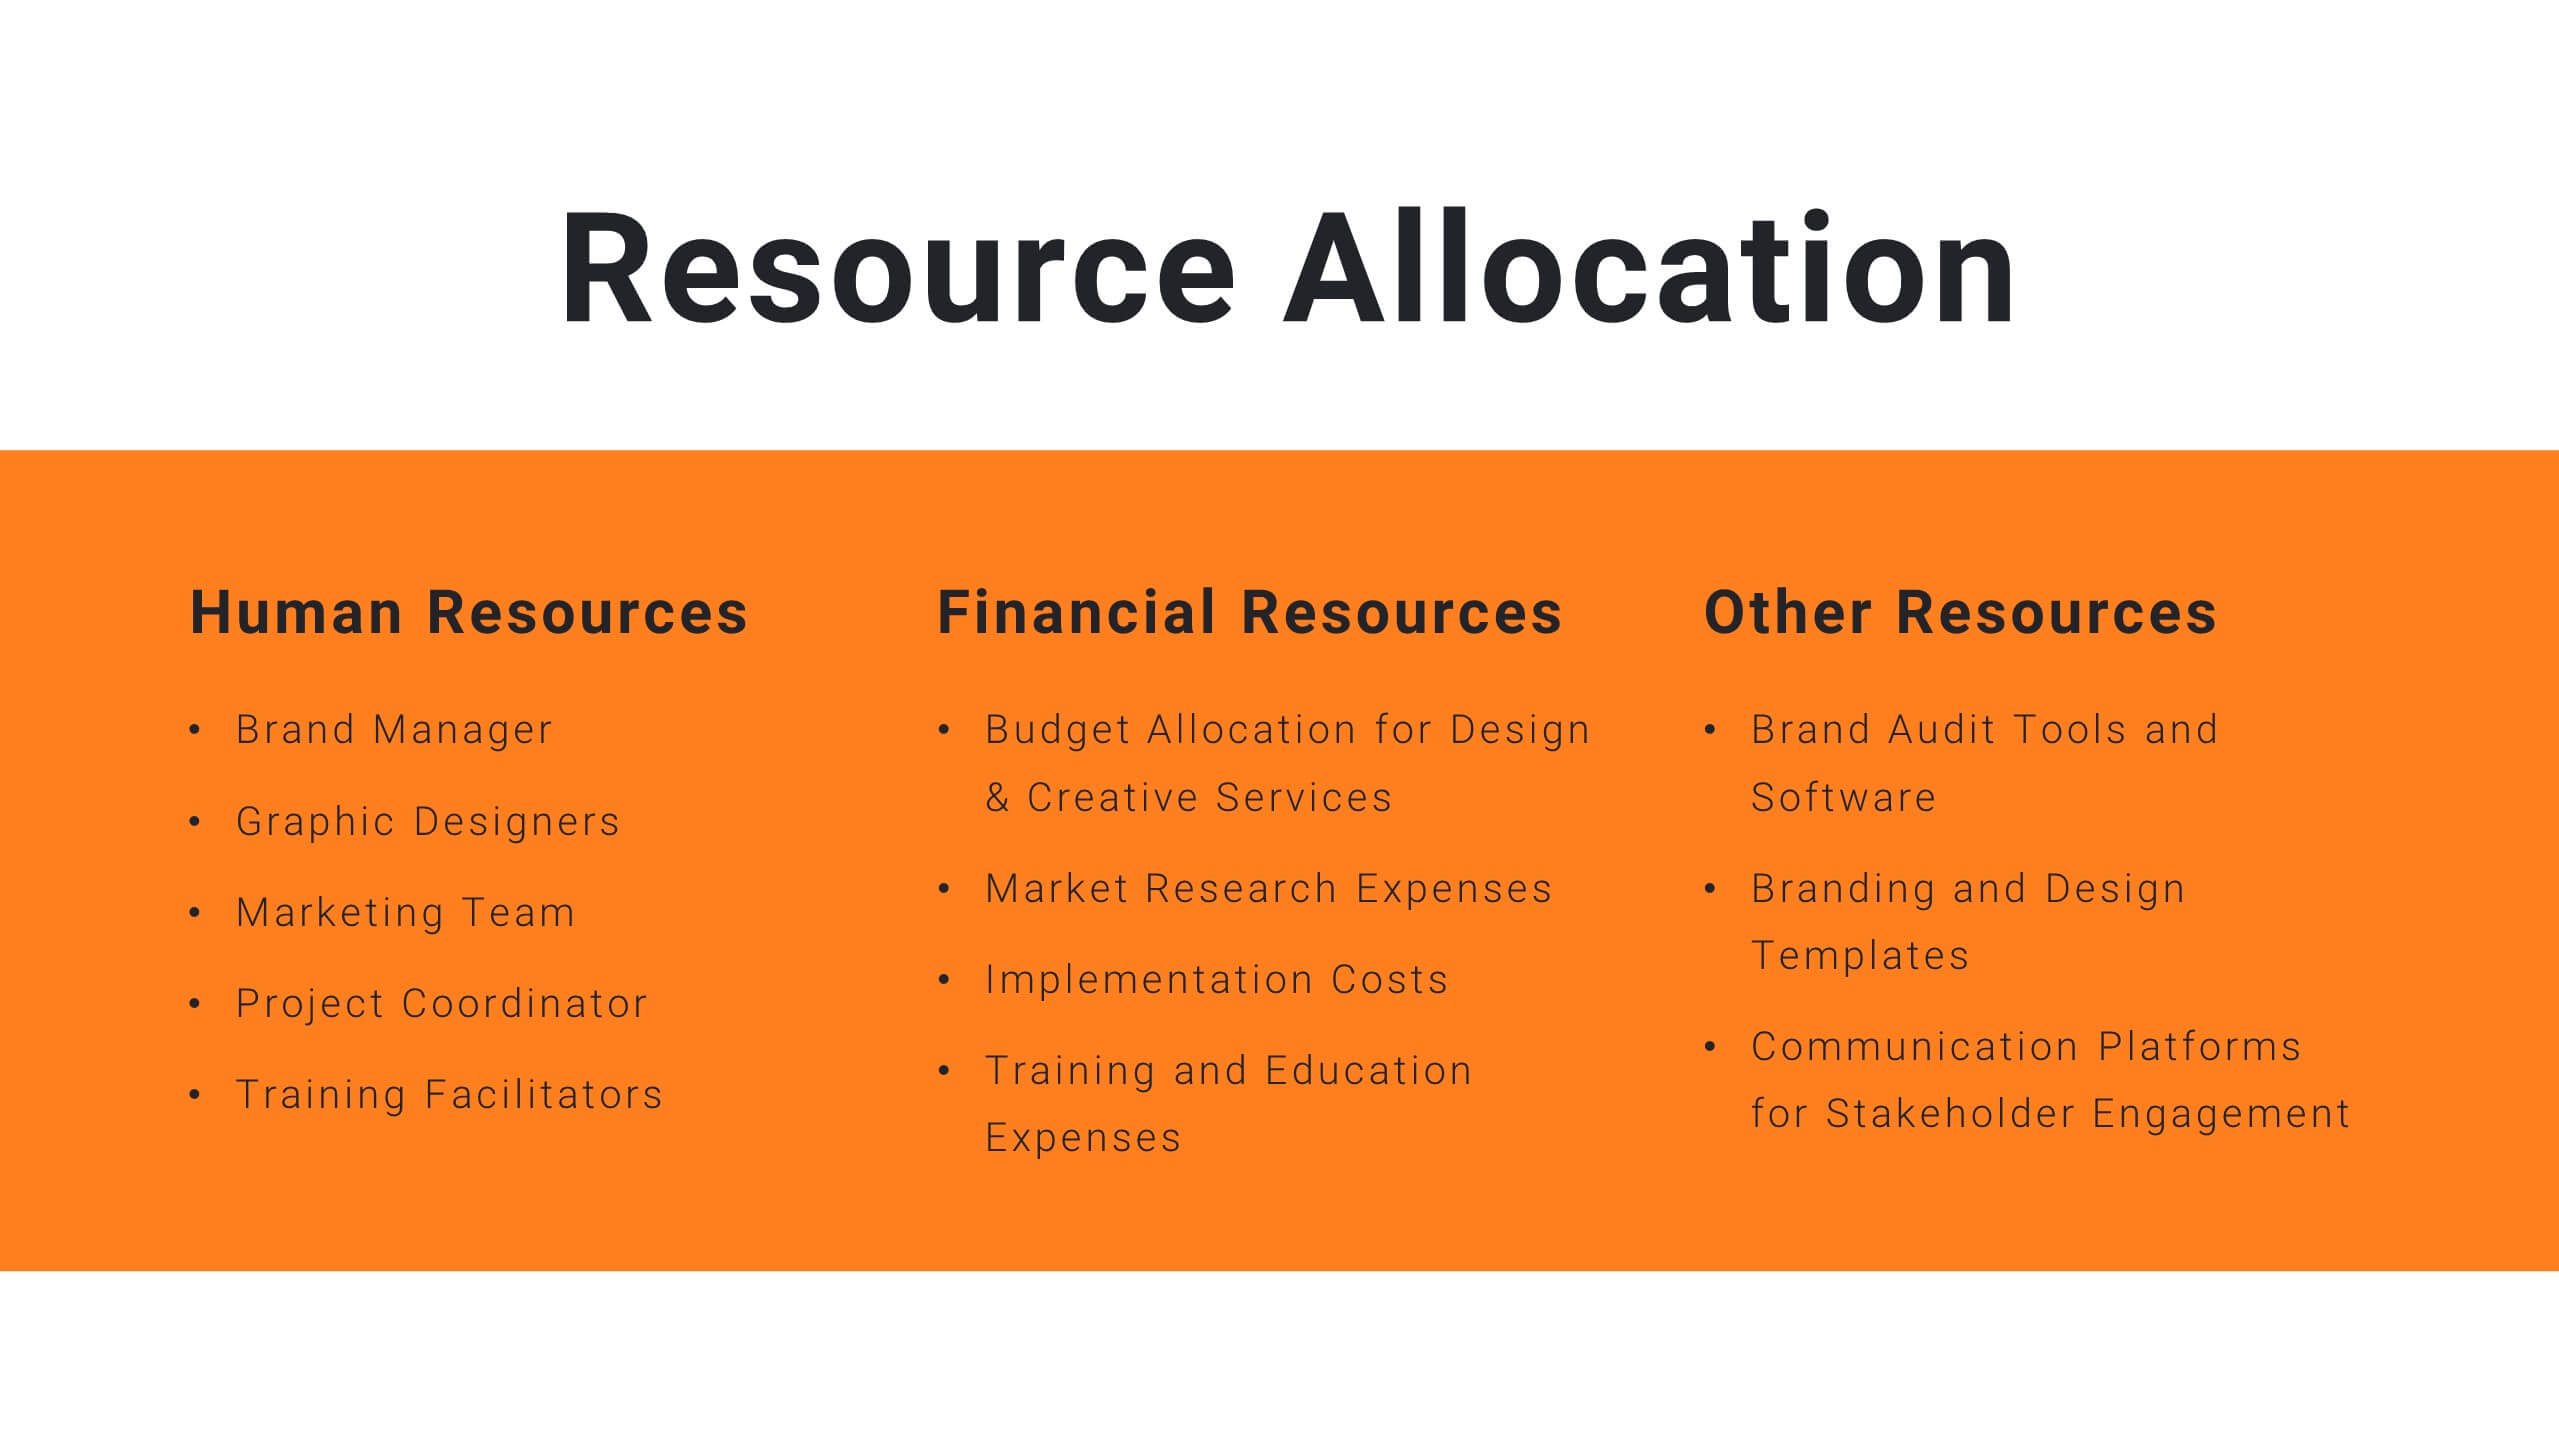
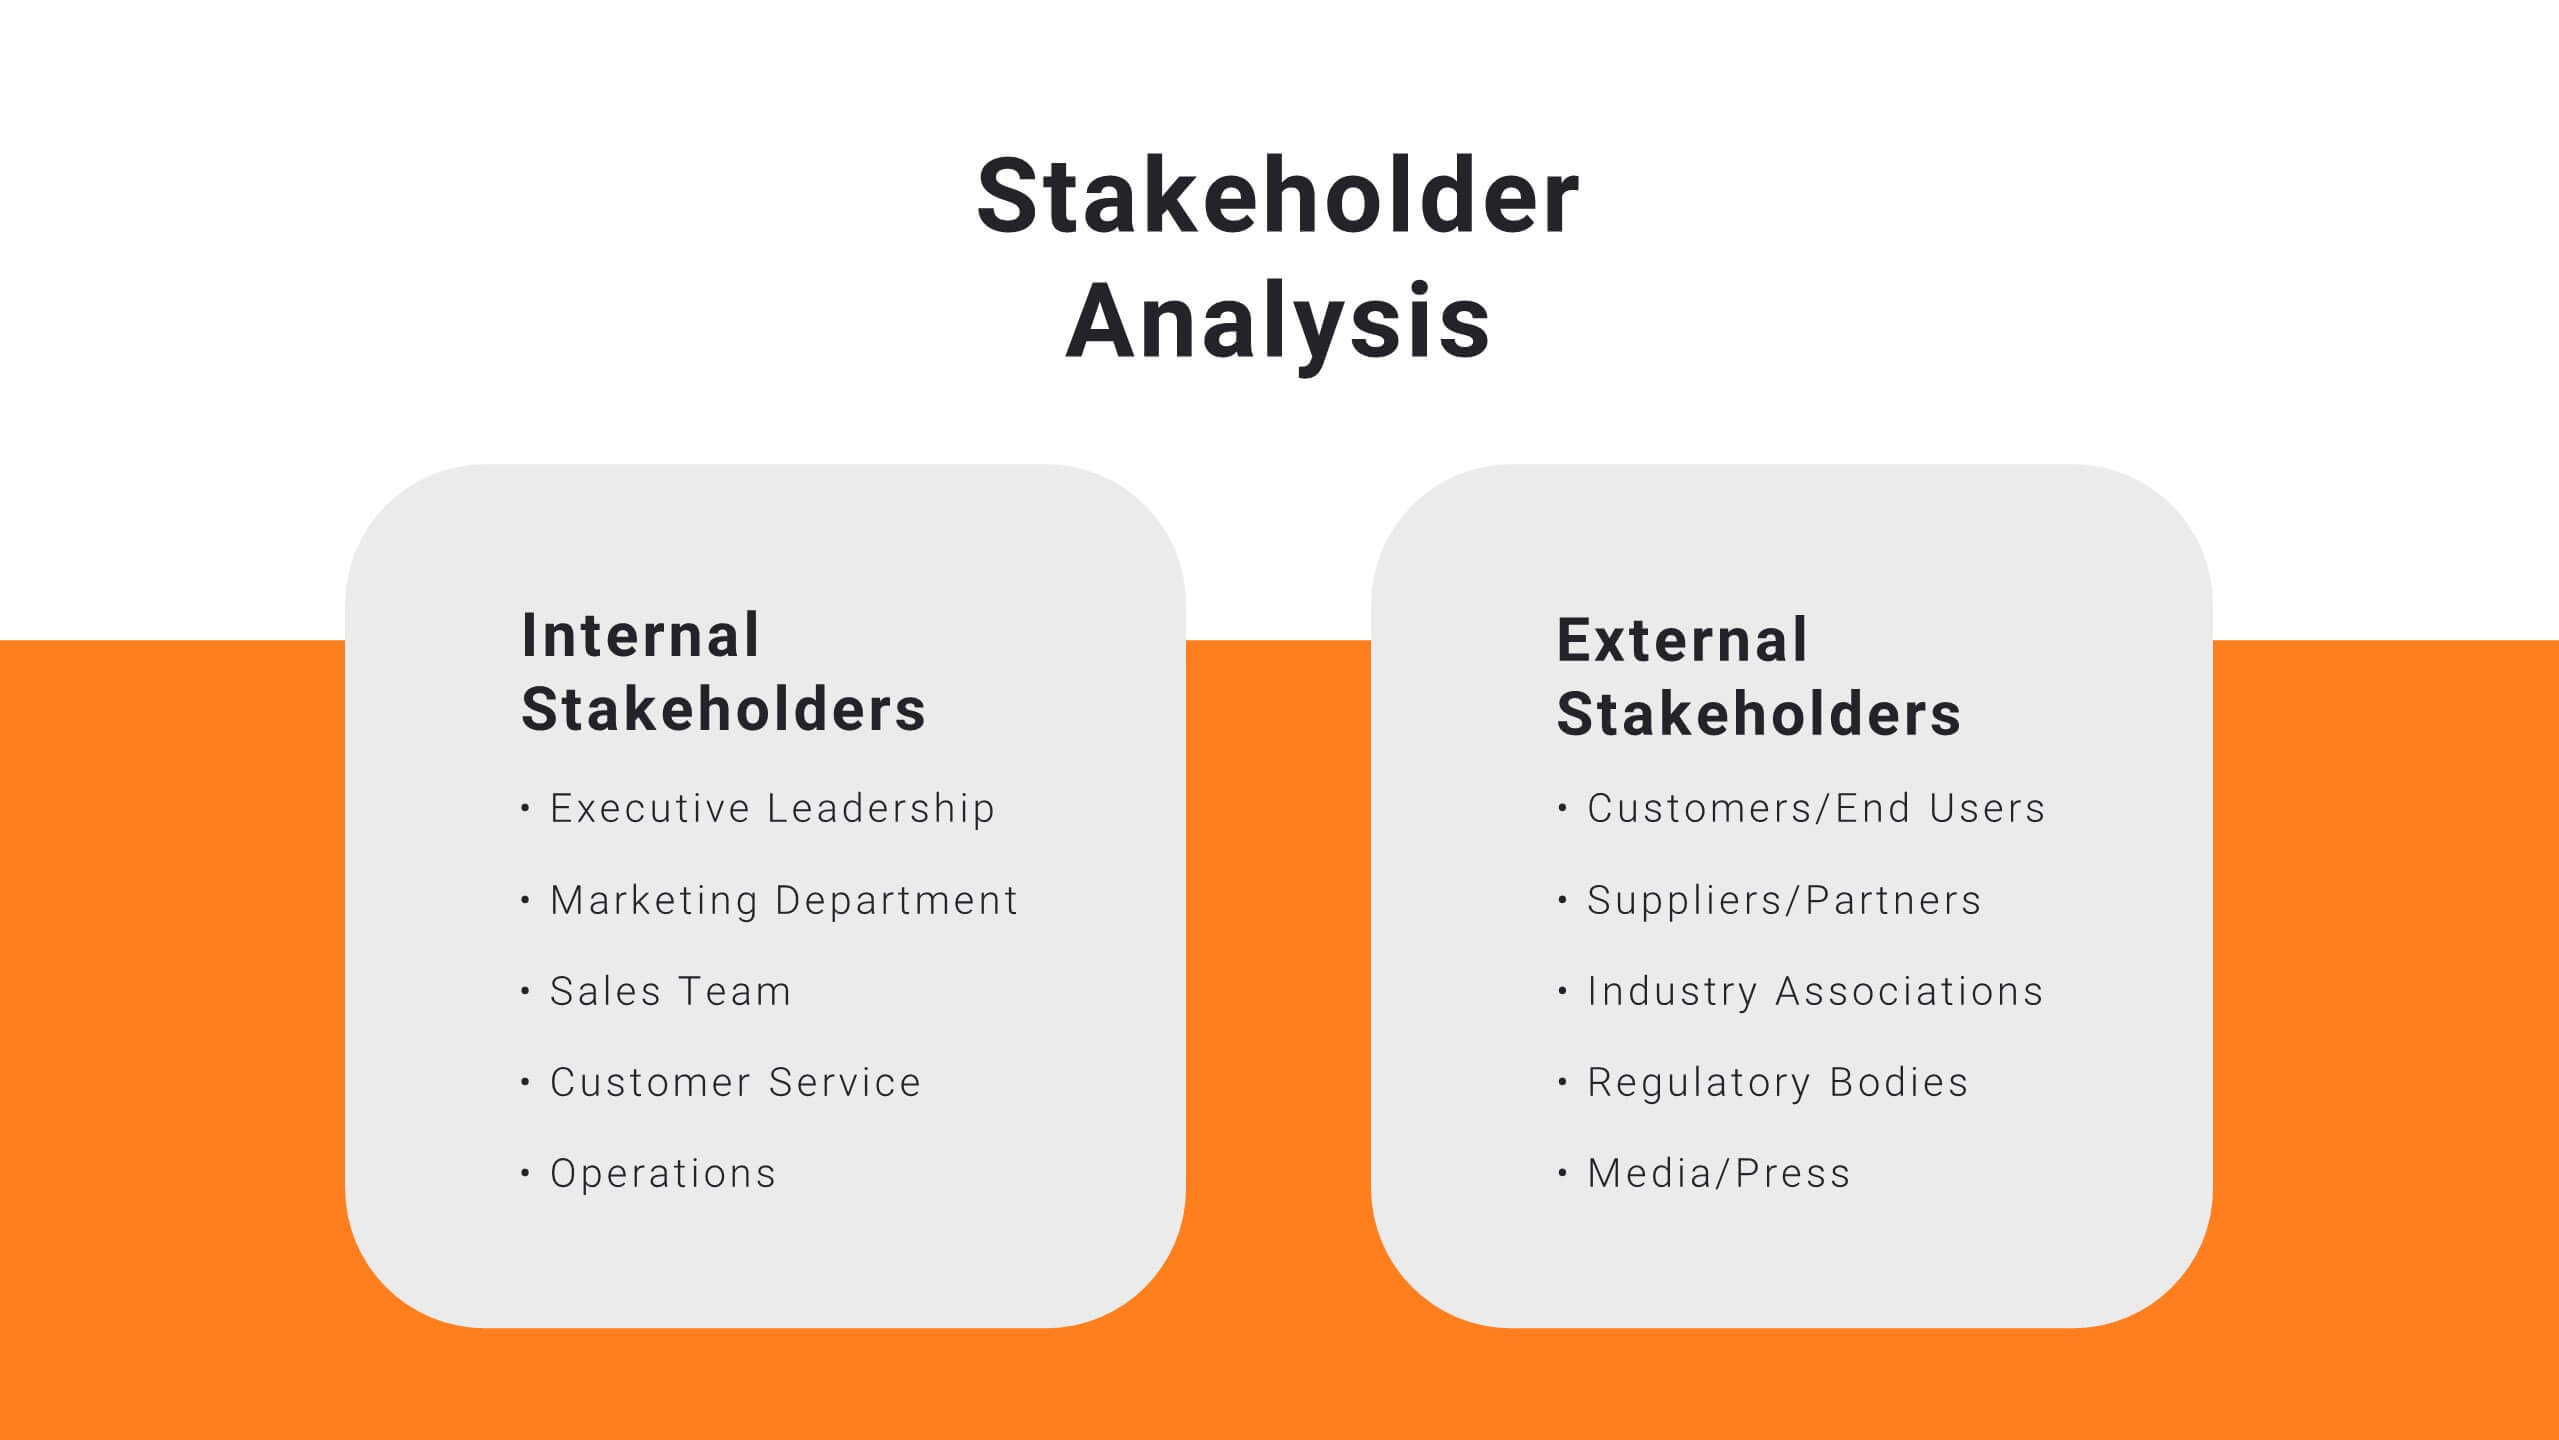
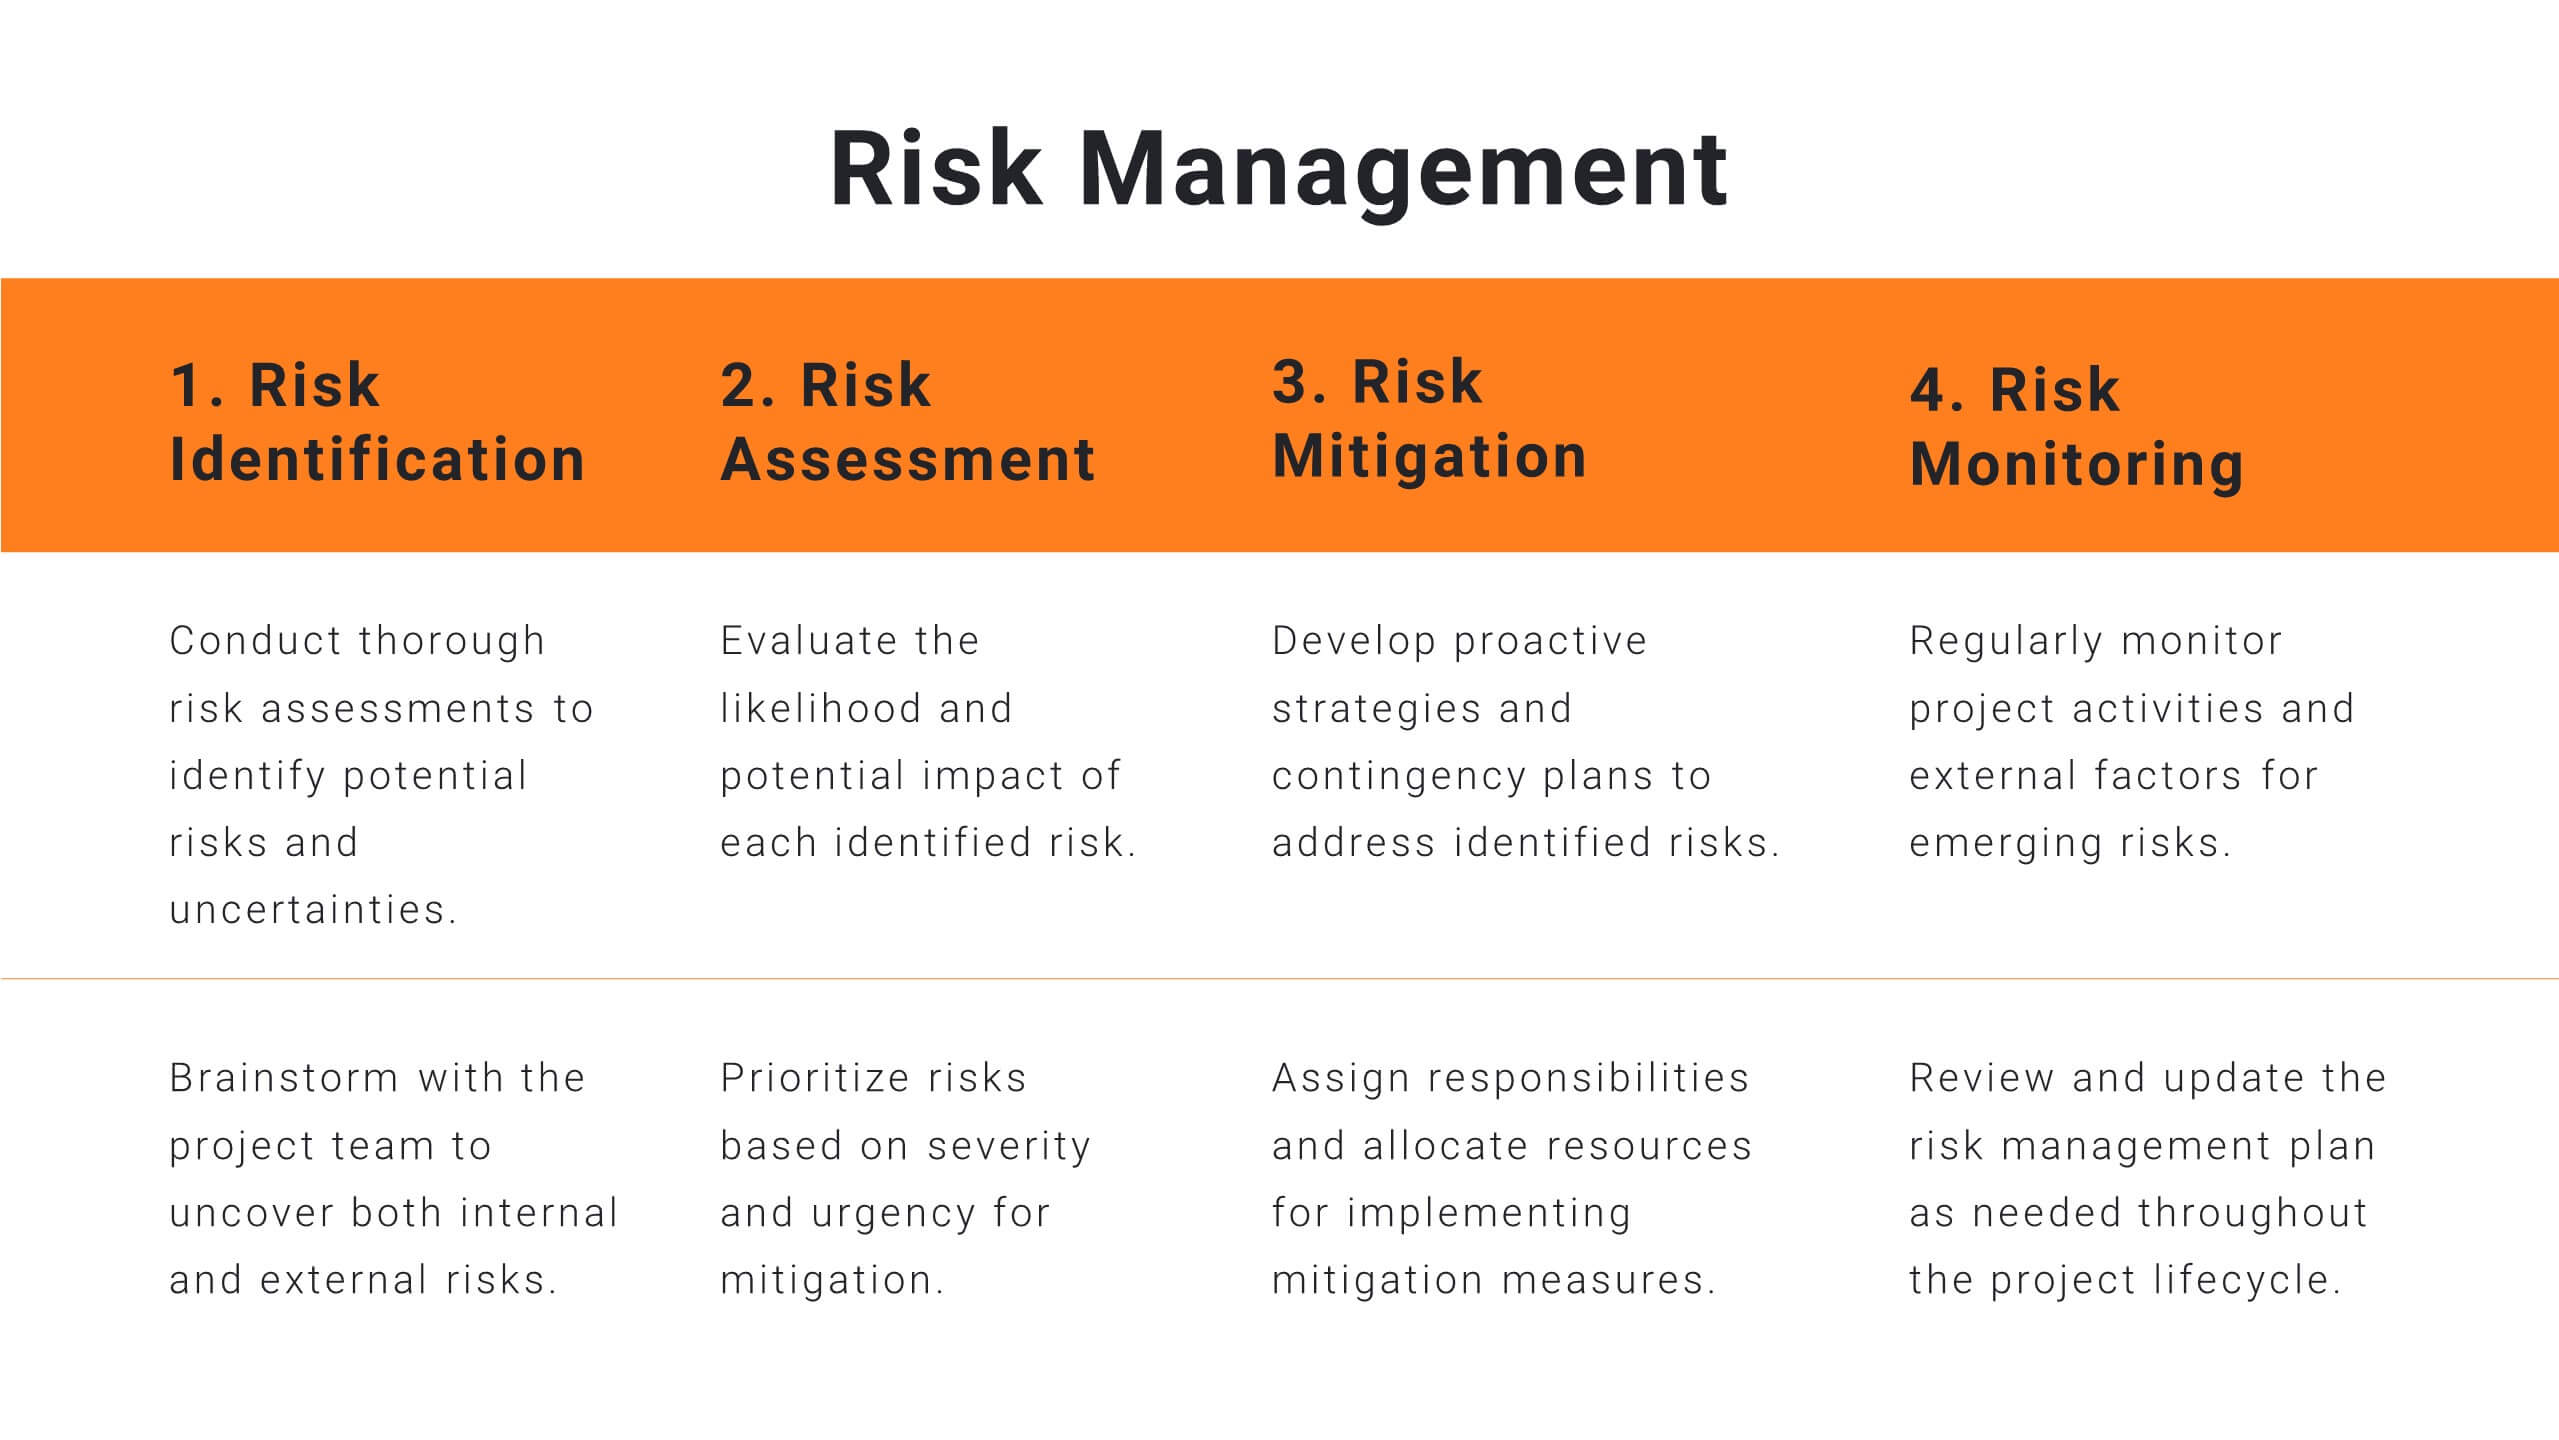
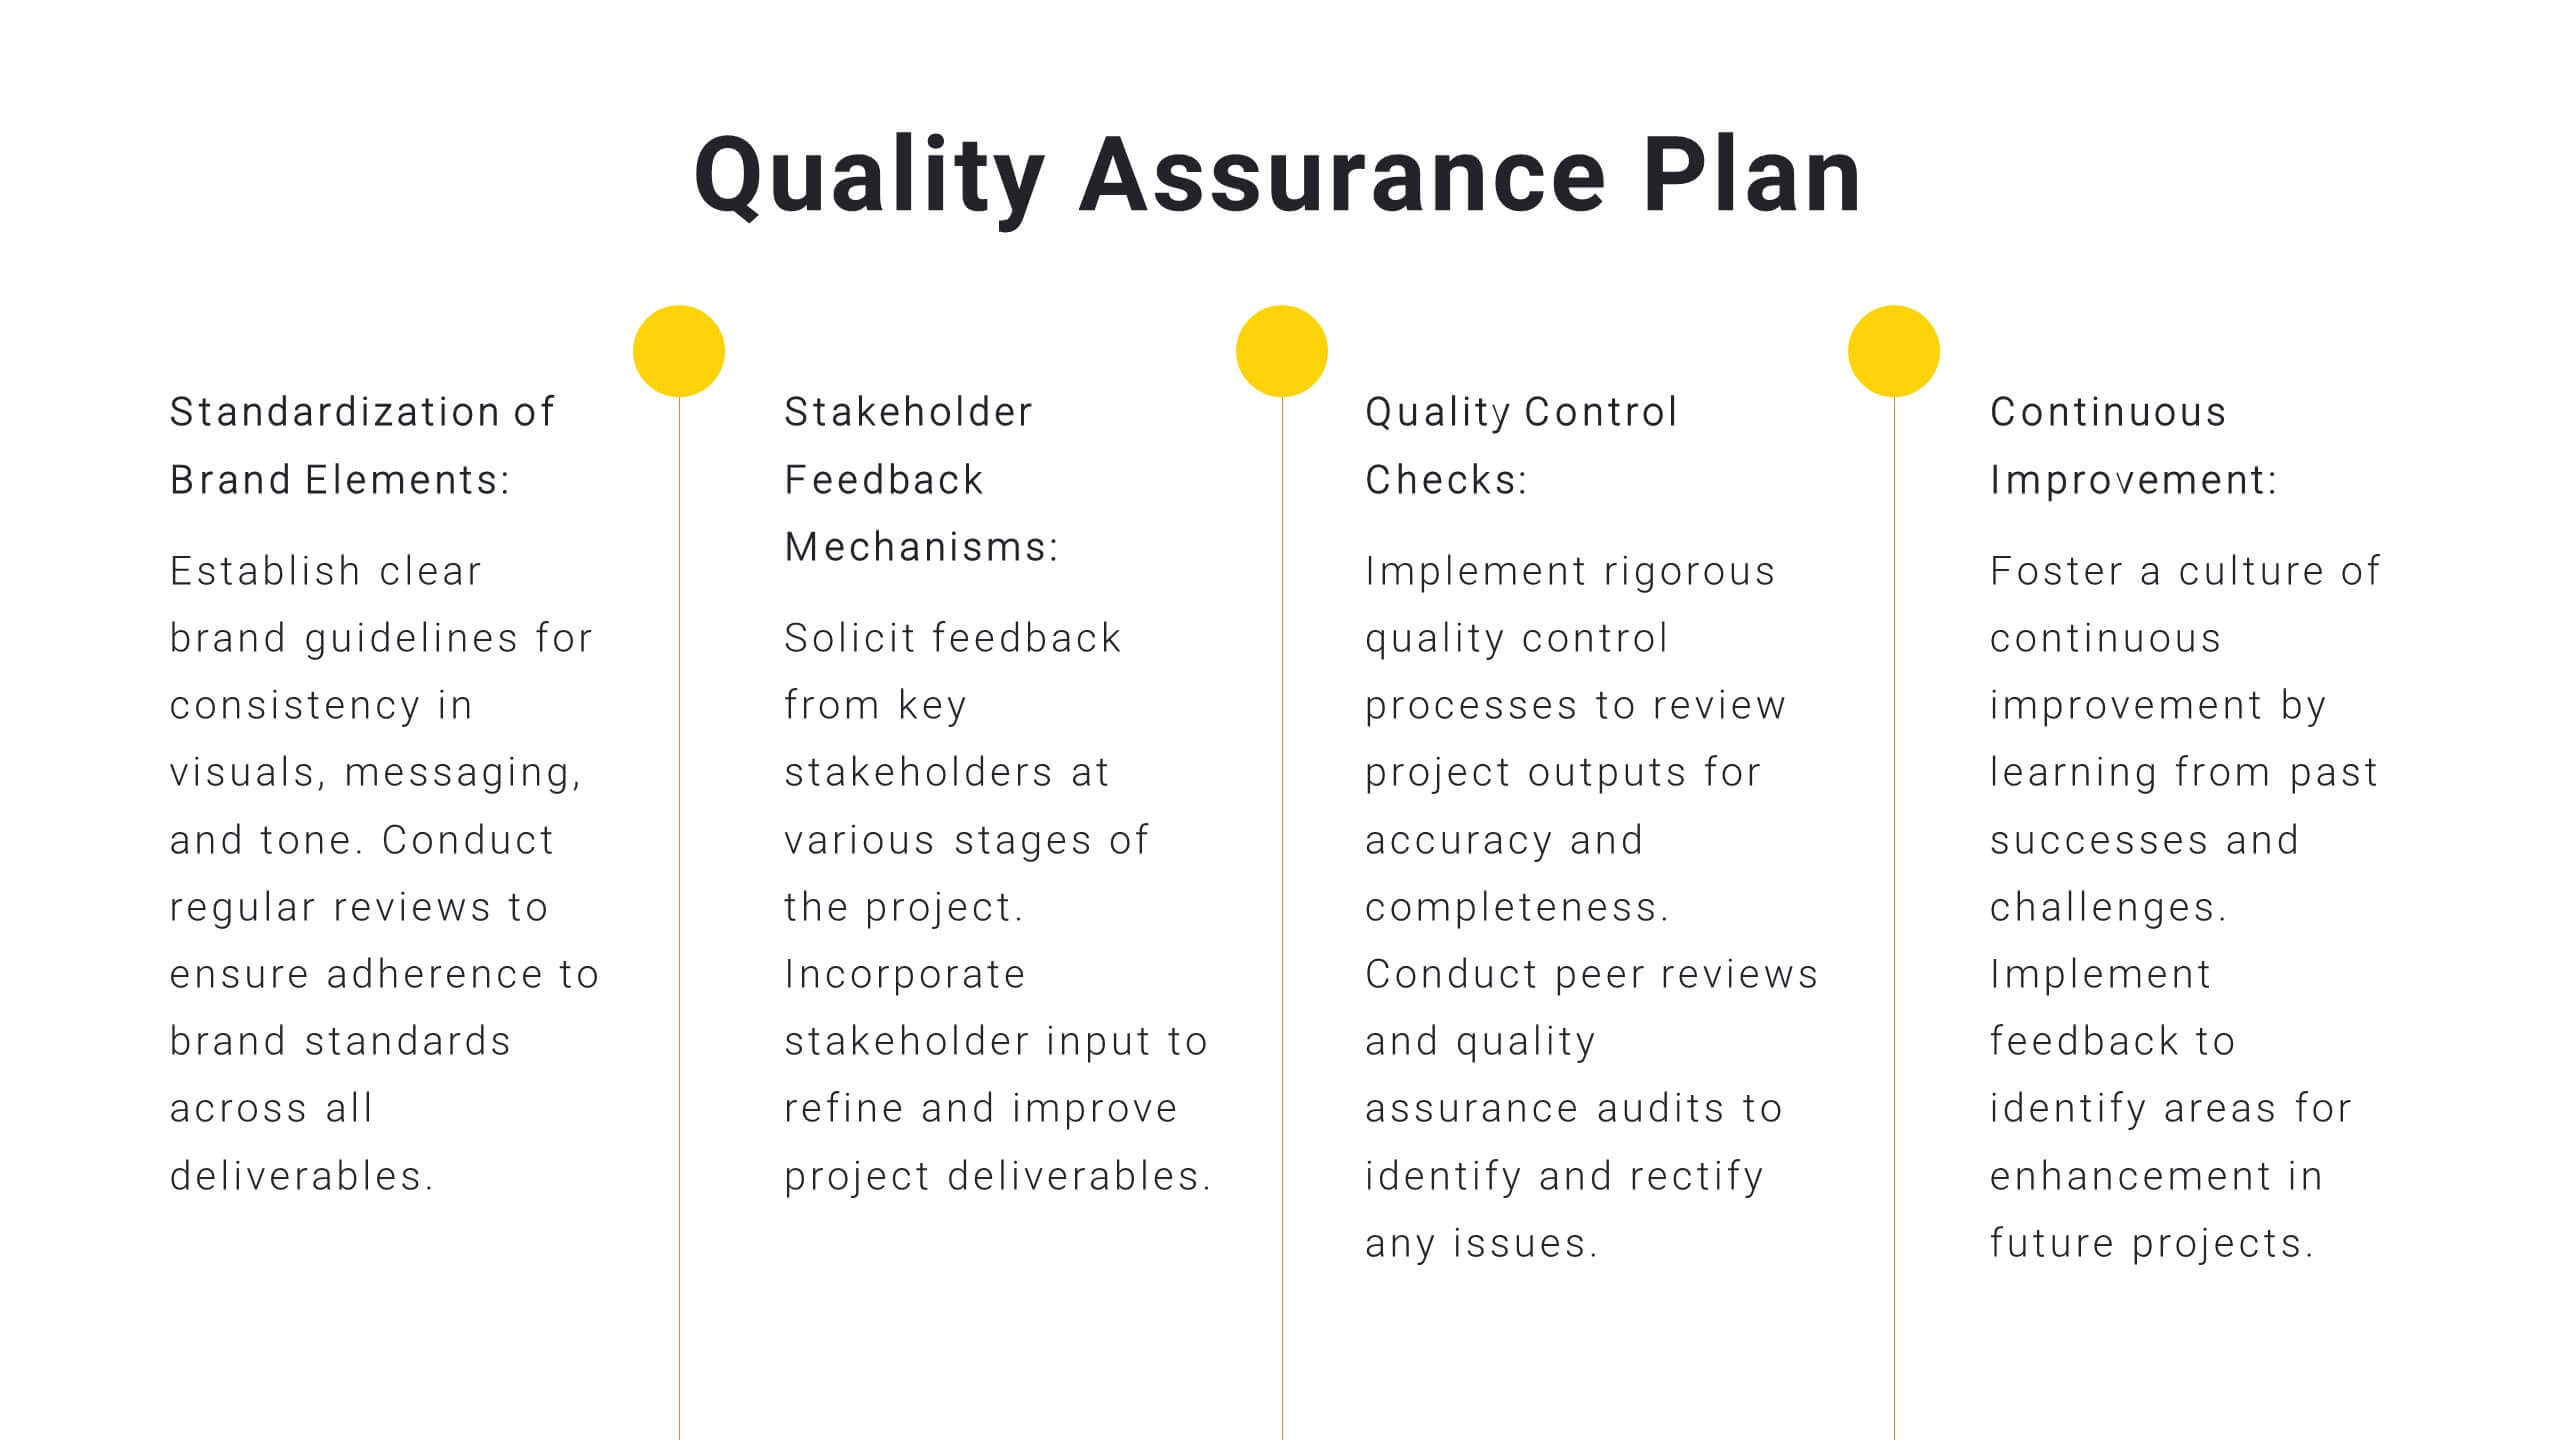
Harmony Project Management Plan Presentation
Plan your project efficiently with this comprehensive project management plan template! It covers all essential aspects including timeline, budget, resource allocation, and risk management. Ensure smooth project execution and achieve your objectives. Compatible with PowerPoint, Keynote, and Google Slides, it's designed to streamline your project planning and management process.


24 diapositivas
Wanderra UX Design Presentation
Elevate your user experience strategy with this comprehensive presentation template. Covering key aspects such as personas, wireframes, usability guidelines, and design systems, this template helps you create engaging and intuitive experiences. Fully customizable and compatible with PowerPoint, Keynote, and Google Slides.


7 diapositivas
Design Process Infographic Presentation
A Process Infographic is a visual representation of a series of steps or stages in a particular process. Get inspired by this hands-on Design Process Infographic. Featuring the process from identifying to management and success. This template is perfect for sharing your story by showing the steps and creating a portfolio. In this template icons and other visual elements are included to help convey your complex information in an easy-to-understand format. Communicate your process clearly and make this your starting point just change the text, colors and fonts to fit your needs in only minutes.


4 diapositivas
Business Model Value Stream Design Presentation
Clarify complex operations with the Business Model Value Stream Design Presentation. This slide template is perfect for mapping out your business model, identifying value streams, and aligning teams around critical workflows. Its grid-style layout makes it easy to categorize key areas like customer segments, operations, and financial drivers—ideal for strategic planning sessions or executive overviews. Fully editable and compatible with PowerPoint, Keynote, and Google Slides, this design is a smart choice for consultants, business analysts, and operations leaders.


21 diapositivas
Stellar Content Marketing Pitch Deck Presentation
The Stellar Marketing Pitch Deck template is designed to make your marketing strategies shine like never before! This template is perfect for showcasing your business's potential and engaging your audience with sleek, modern designs that capture attention. Start with a powerful introduction, leading into an in-depth industry overview that highlights key trends and consumer behaviors. With dedicated sections for emerging technologies, content marketing trends, and data-driven marketing, you'll have everything you need to present your innovative approach. The template also includes slides for social media strategies, influencer marketing, and SEO trends, ensuring you're covering all the bases. Personalization trends and video marketing evolution are featured to show your forward-thinking approach, while the customer experience focus slide emphasizes your commitment to quality. Finish strong with insights into e-commerce trends, brand storytelling, and sustainability in marketing. This template is fully compatible with PowerPoint, Keynote, and Google Slides, making it versatile and easy to use for any marketing presentation.


6 diapositivas
3D Infographic Design
Visualize data like never before with this bold 3D block diagram layout. Designed to break down complex figures into three key segments, it’s perfect for presenting percentages, growth areas, or metric comparisons. Easily editable in PowerPoint, Keynote, and Google Slides.


5 diapositivas
Causes of Poaching Infographics
Poaching refers to the illegal hunting, capturing, or killing of wildlife, typically for commercial or personal gain. These infographic templates are designed to raise awareness about the underlying drivers of poaching activities and the need for concerted efforts to combat this illegal and harmful practice. The text boxes and illustrations included can be used to highlight the causes and factors contributing to the issue of poaching. Present the complex factors driving this issue, and empower your audience to support conservation efforts, advocate for stricter regulations, and contribute to the protection of wildlife.


6 diapositivas
Modern Science Report Presentation
Bring your findings to life with a clean, dynamic layout designed to make scientific insights easy to follow. This presentation highlights key data, research points, and lab observations in a structured, visually engaging format that supports clarity and accuracy. Fully compatible with PowerPoint, Keynote, and Google Slides.


6 diapositivas
Business Mission Statement Presentation
Here is a vivid "Business Mission Statement" presentation template tailored to elucidate your company's core objectives and strategic goals. This template features a unique brain-design interface that symbolizes thought leadership and innovative thinking, ideal for sharing insights that resonate deeply with your team or stakeholders. Compatible with PowerPoint, Keynote, and Google Slides, it's the perfect tool for broadcasting your mission with clarity and impact.