


Características


¿Tienes alguna pregunta?
Recomendar


5 diapositivas
Hydrological Cycle Explained Presentation
Break down complex water systems with ease using the Hydrological Cycle Explained Presentation. This clean and modern slide illustrates each phase of the cycle—from precipitation to collection—with intuitive icons and a pipeline layout. Ideal for educational, environmental, or sustainability content. Fully editable in Canva, PowerPoint, Keynote, and Google Slides.


4 diapositivas
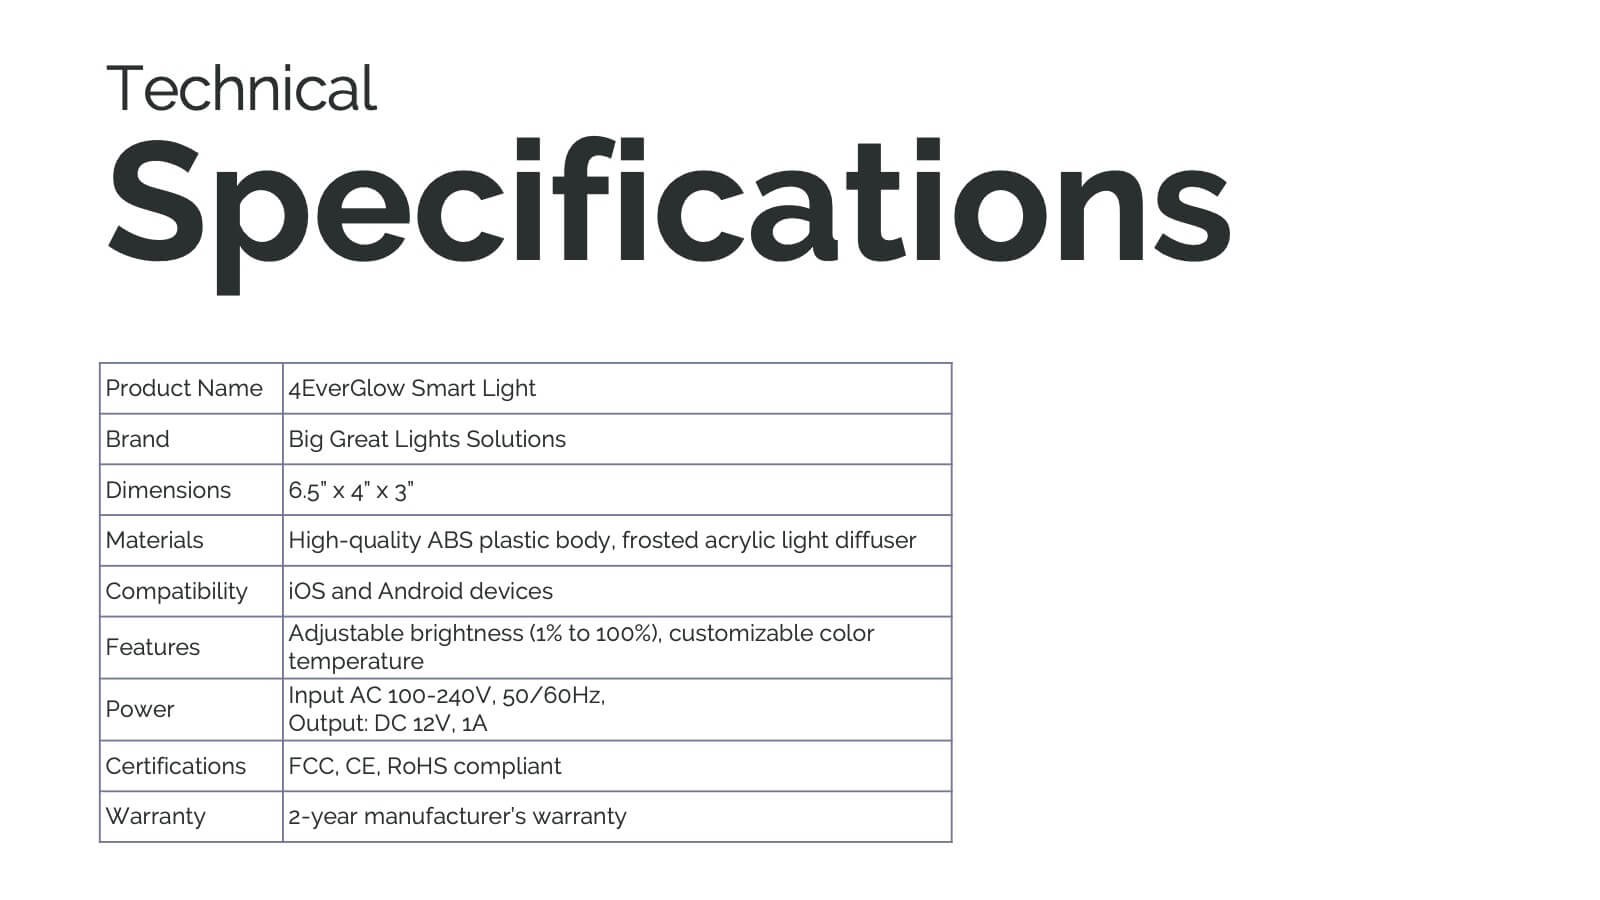
Cost Breakdown Table Presentation
Make your numbers speak with style using a clean, structured layout that simplifies pricing and cost analysis. This presentation is perfect for comparing plans, budgets, or expenses in a clear and visually engaging way. Fully editable and compatible with PowerPoint, Keynote, and Google Slides.


26 diapositivas
Company Profile and Accomplishments Presentation
A company profile is a document that provides an overview of a business entity. This template serves as a company introduction, presenting essential information about company history, products or services, achievements, goals, and other relevant details. This template showcases the milestones and capabilities of a company. This presentation is perfect for businesses, startups, or organizations looking to highlight their success, growth, and overall expertise in their industry. The clean layout, engaging visuals, and comprehensive information, will help your presentation leave a lasting impression on your audience and enhance your company's reputation.


5 diapositivas
Asia Geographic and Business Analysis Map Presentation
Gain a strategic edge with the Asia Geographic and Business Analysis Map template, designed to visualize market trends and demographic data across the region. Ideal for businesses, investors, and academics, it supports PowerPoint, Keynote and Google Slides. This adaptable template is perfect for presenting geographic data analyses and exploring regional business potentials.


6 diapositivas
Problem Solving and Innovation Solution Presentation
Unlock creative thinking with the Problem Solving and Innovation Solution Presentation. This puzzle lightbulb diagram helps visualize key components of innovative strategies—ideal for brainstorming sessions, business development plans, or process improvement meetings. Editable in PowerPoint, Keynote, and Google Slides.


5 diapositivas
Startup Business Plan Presentation
Launch your ideas with clarity using this Startup Business Plan slide template. The rocket-inspired visual guides your audience through five strategic stages, each labeled with editable icons and titles—perfect for pitching goals, financials, timelines, or key operations. Ideal for entrepreneurs and early-stage companies, this slide is easy to customize in PowerPoint, Keynote, or Google Slides.


6 diapositivas
Circular Wheel Diagram Presentation
Bring motion and balance to your ideas with this clean, circular design that connects every element in a seamless flow. Ideal for showcasing continuous processes, team dynamics, or strategic cycles, it keeps your message clear and engaging. Fully compatible with PowerPoint, Keynote, and Google Slides for easy editing.


6 diapositivas
Demographic and Psychographic Segmentation Presentation
Bring your audience insights to life with a clear, data-driven design that highlights who your customers are and what drives their decisions. This presentation helps you analyze audiences by lifestyle, behavior, and demographics. Fully customizable and compatible with PowerPoint, Keynote, and Google Slides for effortless professional presentations.


4 diapositivas
Sequential Roadmap Planning Timeline Presentation
Guide your audience through each milestone with the Sequential Roadmap Planning Timeline Presentation. This sleek layout is perfect for showing linear progress over time—ideal for strategic plans, product rollouts, or project phases. Each step is clearly marked with editable years and titles, ensuring clarity and easy customization. Fully compatible with PowerPoint, Google Slides, and Canva.


12 diapositivas
Health and Safety Compliance Strategy Presentation
Ensure your organization meets regulatory standards with the Health and Safety Compliance Strategy presentation. This sleek, diamond-based layout breaks down key safety elements into five visually engaging segments, ideal for outlining compliance measures, emergency protocols, training requirements, risk assessments, and inspection plans. Each icon-based section includes editable titles and text boxes for quick customization. Designed to keep information clear and actionable, this template is perfect for corporate safety briefings, internal audits, or HR presentations. Fully compatible with PowerPoint, Keynote, and Google Slides.


6 diapositivas
Business Security Compliance Presentation
Visualize your security framework with this clear and modern infographic layout. This slide is ideal for presenting compliance steps, risk assessments, or regulatory requirements, featuring a shield-centered hub with 5 editable sections. Customize easily in PowerPoint, Keynote, or Google Slides.


7 diapositivas
Puzzle Piece Infographic Presentation Template
A puzzle piece infographic is a visual representation of information that uses puzzle pieces as a metaphor to show how different pieces of information fit together to form a complete picture. The puzzle pieces are usually arranged in a specific pattern. This template It's great for explain process or systems, or showing how different pieces of data or information are related to one another. It's compatible with Powerpoint, Keynote, and Google Slides, so you can use it on any device. This template It's perfect for anyone who wants to make their presentations more engaging and interactive.


12 diapositivas
Real Estate House Market Trends Presentation
Analyze Real Estate House Market Trends with this insightful presentation template. Featuring a house-shaped hexagonal layout, this design helps illustrate key factors such as market demand, property values, investment opportunities, and housing policies. Ideal for real estate professionals, investors, and analysts looking to present market insights with clarity and impact. Fully customizable and compatible with PowerPoint, Keynote, and Google Slides.


6 diapositivas
IT Operations Workflow Presentation
Visualize your IT processes with a sleek, structured flow that highlights every operational step from start to finish. Ideal for presenting systems management, network operations, or support frameworks, this presentation brings clarity to technical workflows. Fully compatible with PowerPoint, Keynote, and Google Slides for easy customization and seamless presentation delivery.


21 diapositivas
Solaris Business Operations Plan Presentation
Organize and streamline your operations with this comprehensive business operations plan presentation! It includes sections like objectives, session breakdowns, networking opportunities, and panel discussions, ensuring a clear and actionable framework. Perfect for conferences, team workshops, or strategic meetings, this template works seamlessly with PowerPoint, Keynote, and Google Slides.


4 diapositivas
Governance Policy Overview Presentation
Set the foundation for transparency and accountability with this visually engaging presentation design. Perfect for outlining organizational rules, compliance standards, and policy frameworks, it turns complex governance details into clear, structured visuals. Fully customizable and compatible with PowerPoint, Keynote, and Google Slides for effortless professional presentations.


20 diapositivas
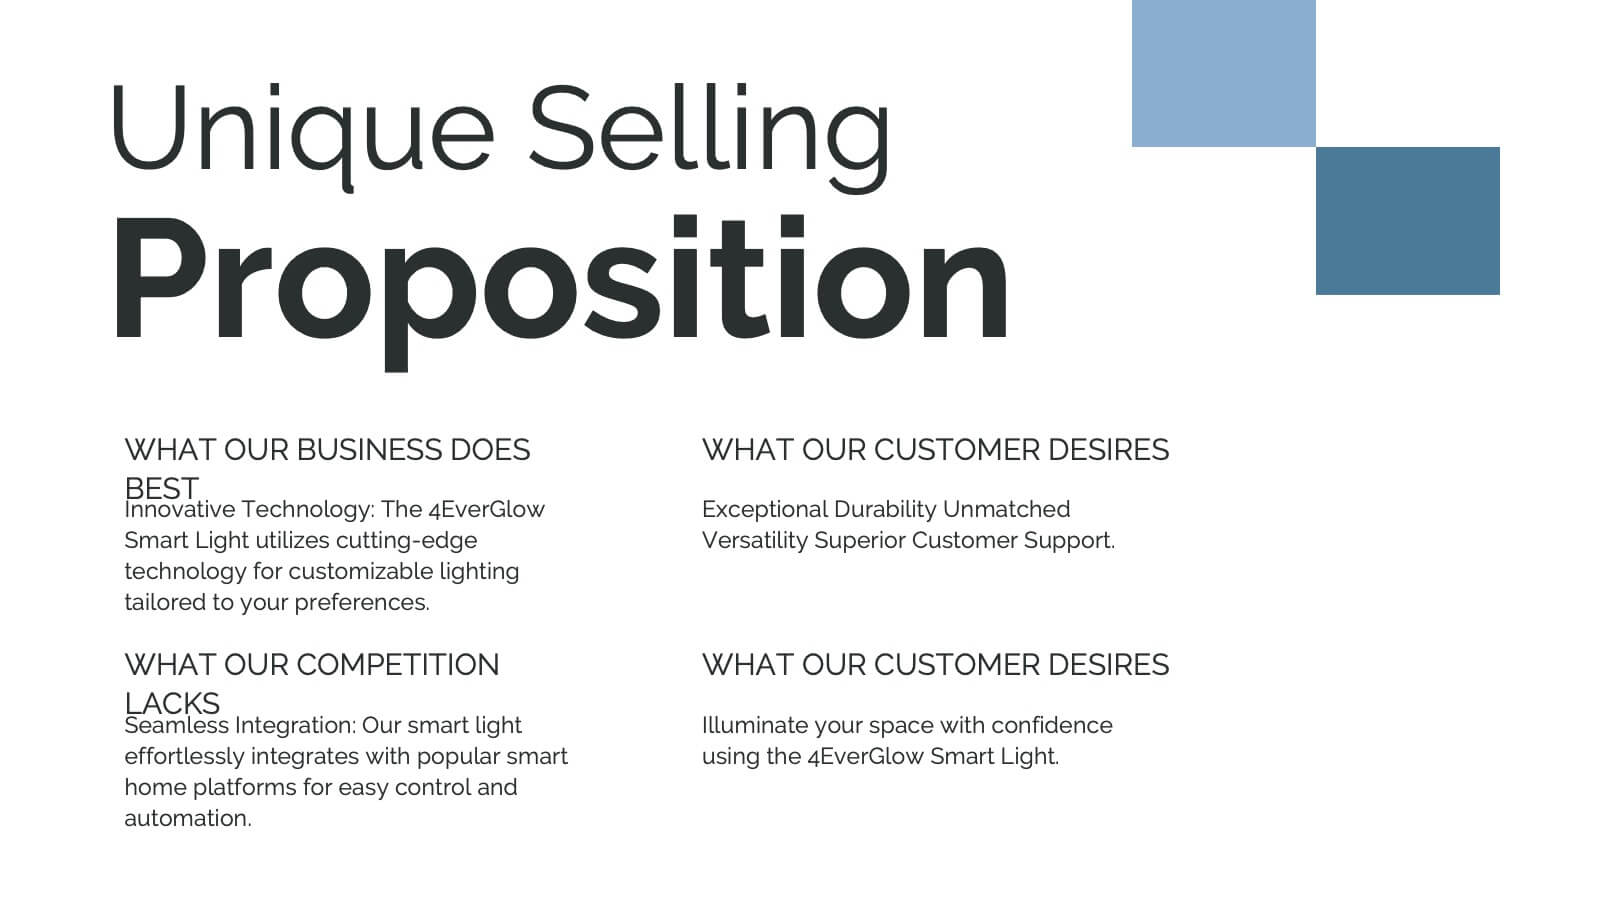
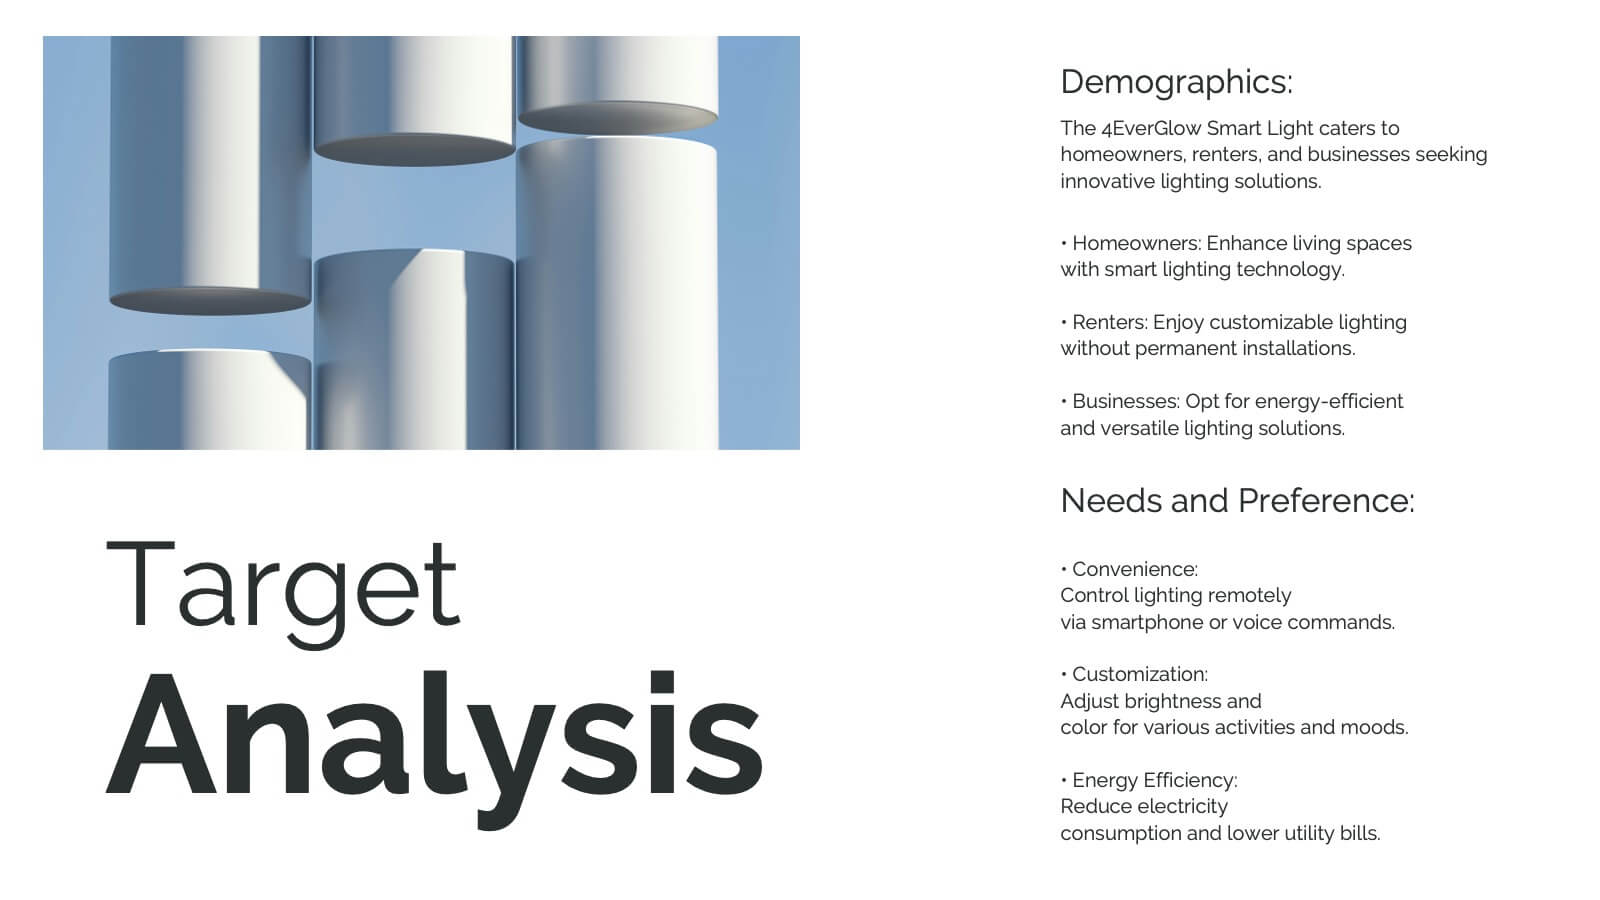
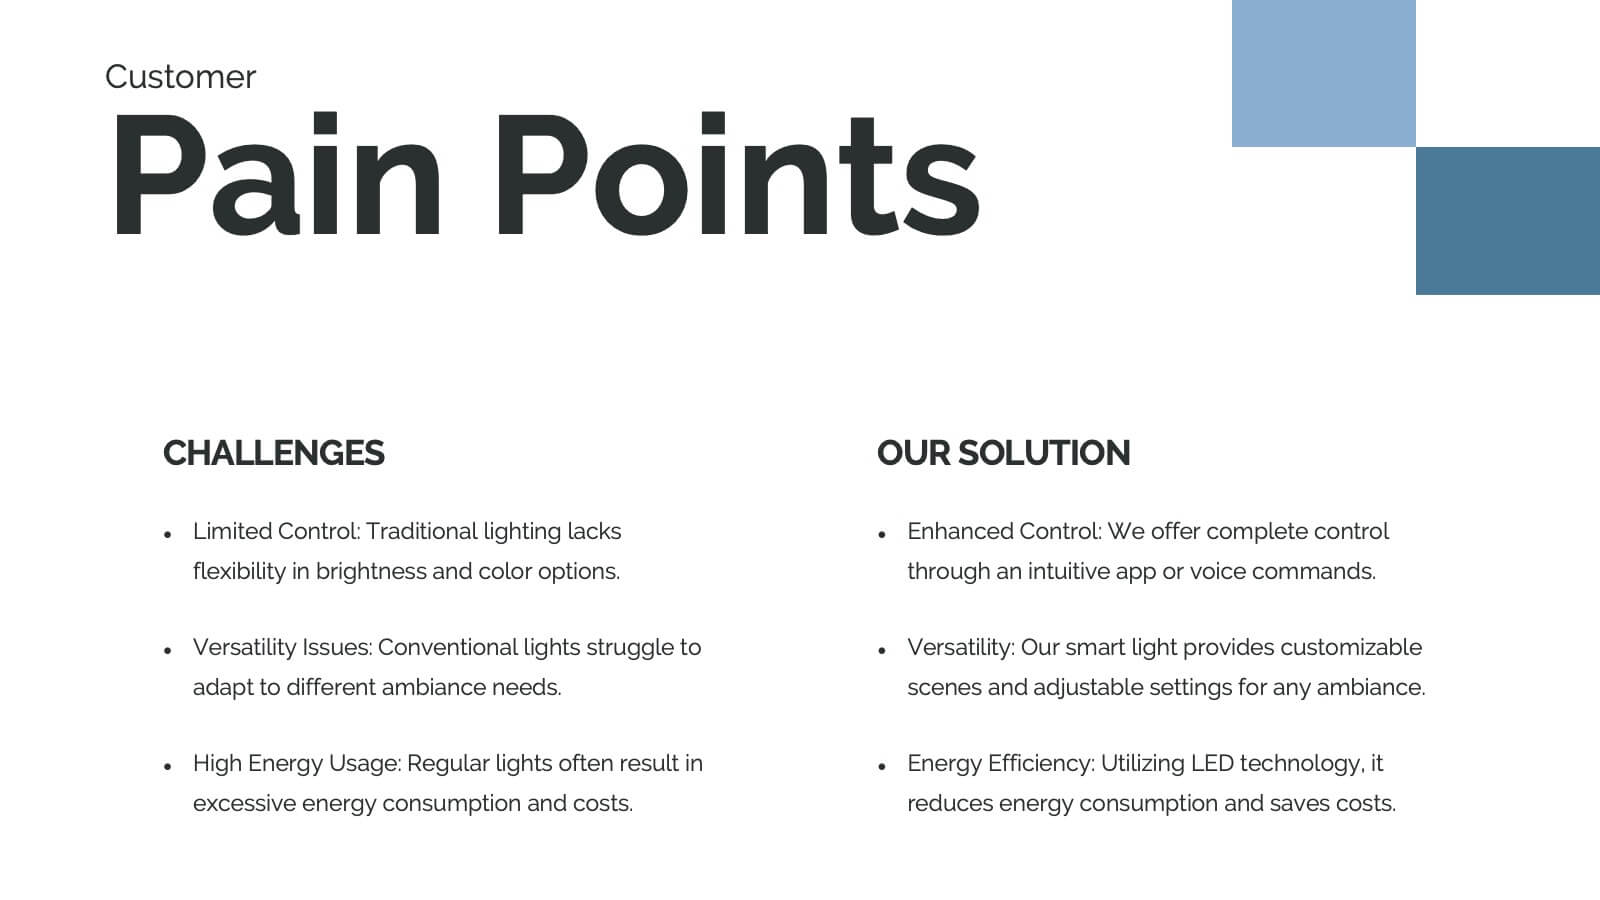
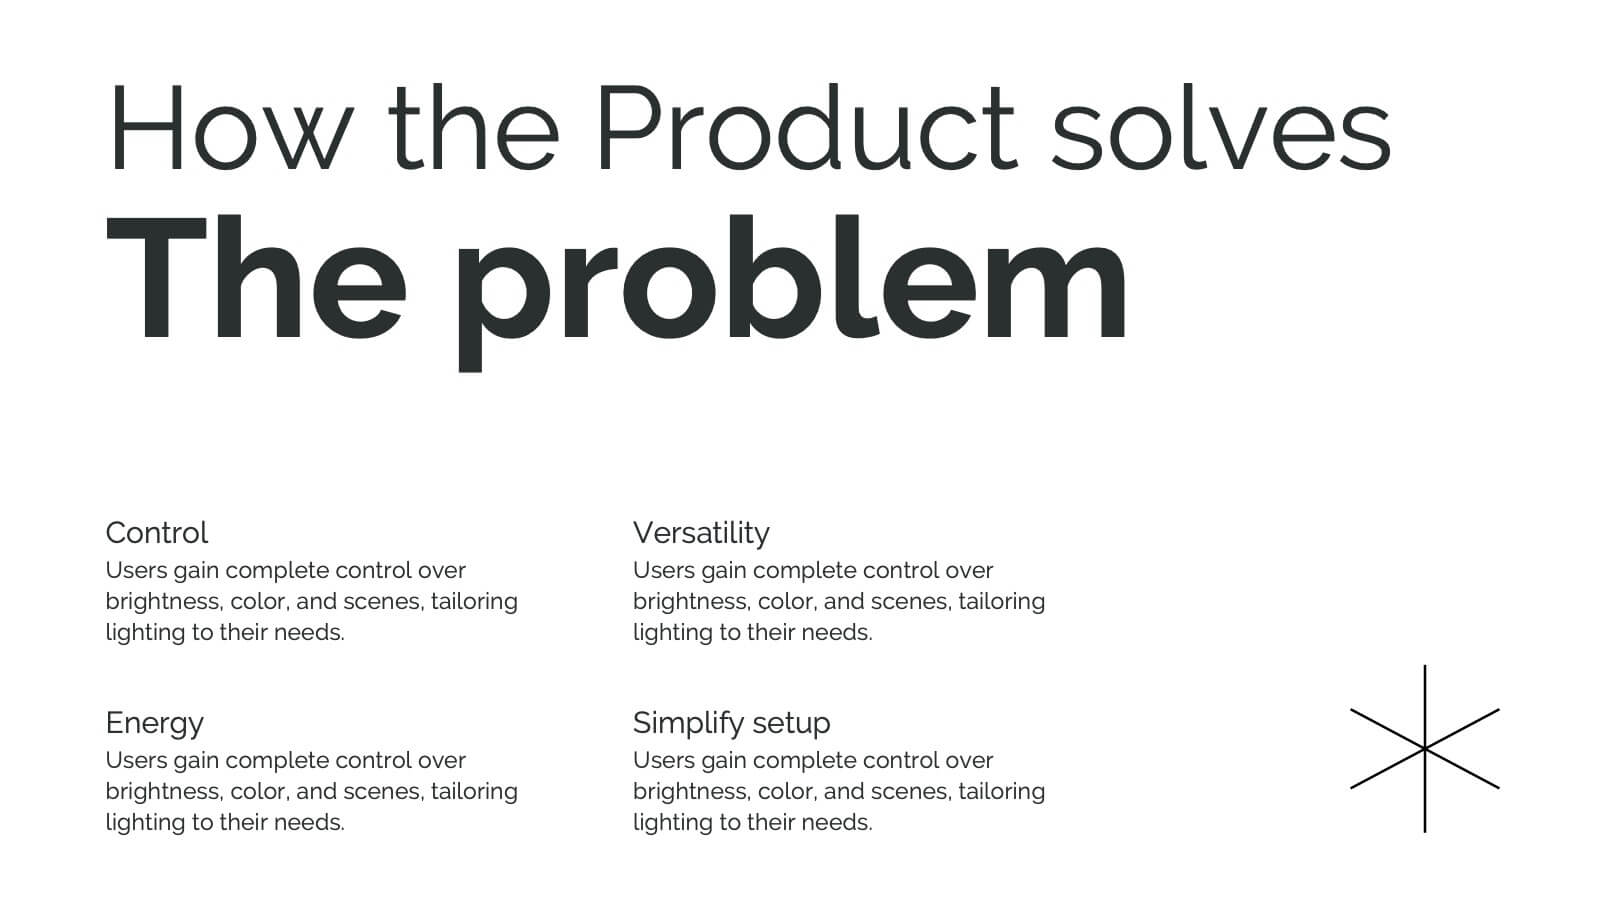
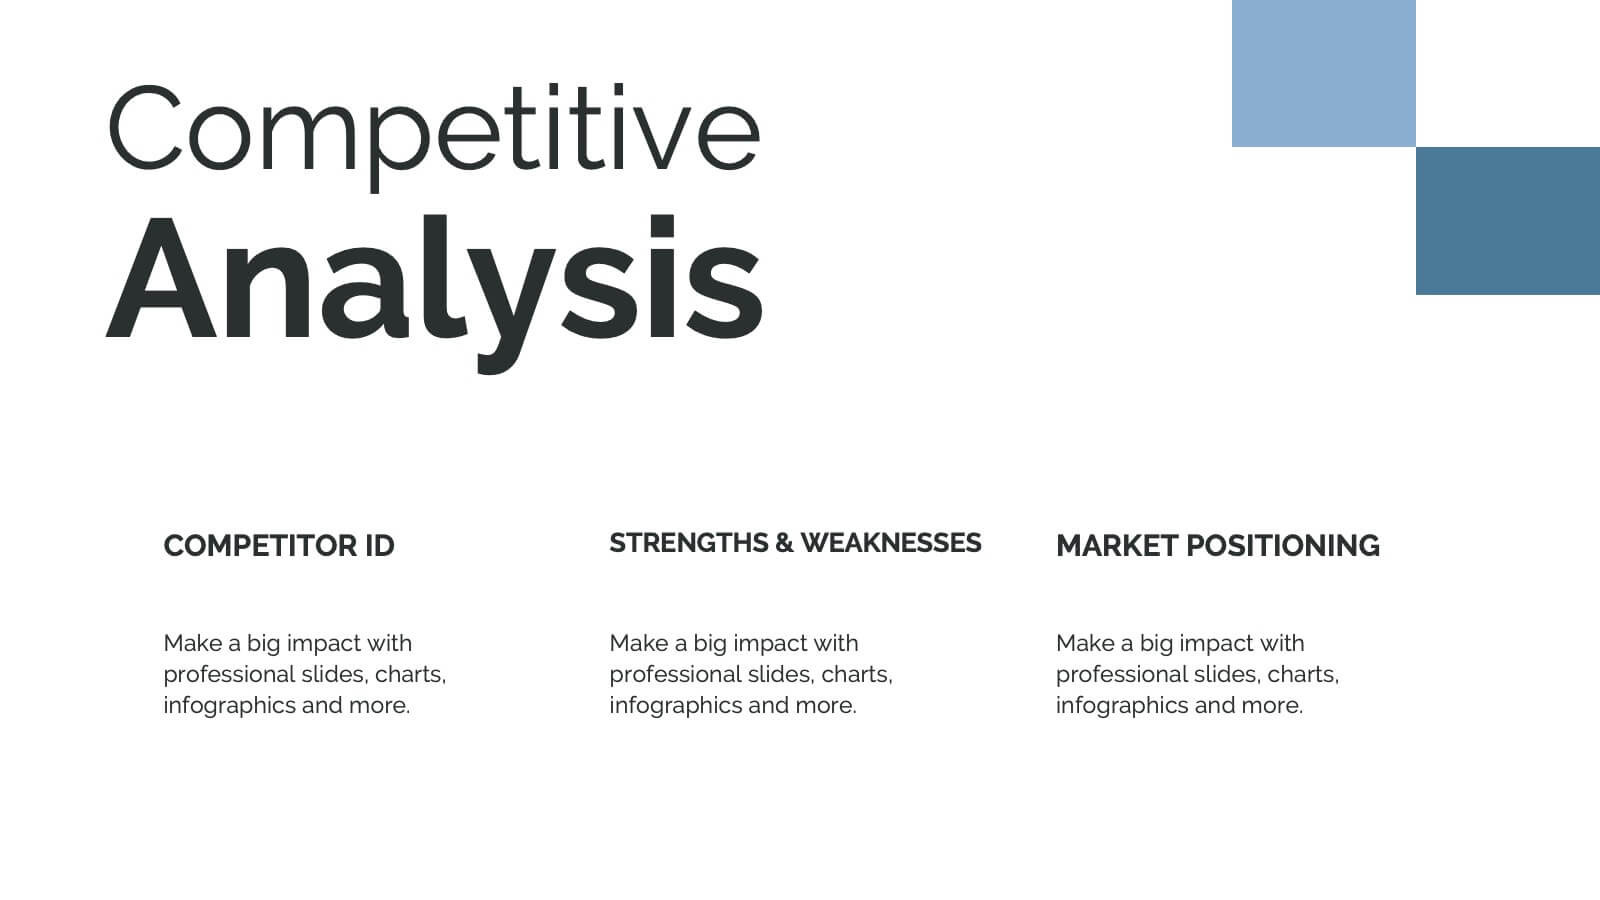
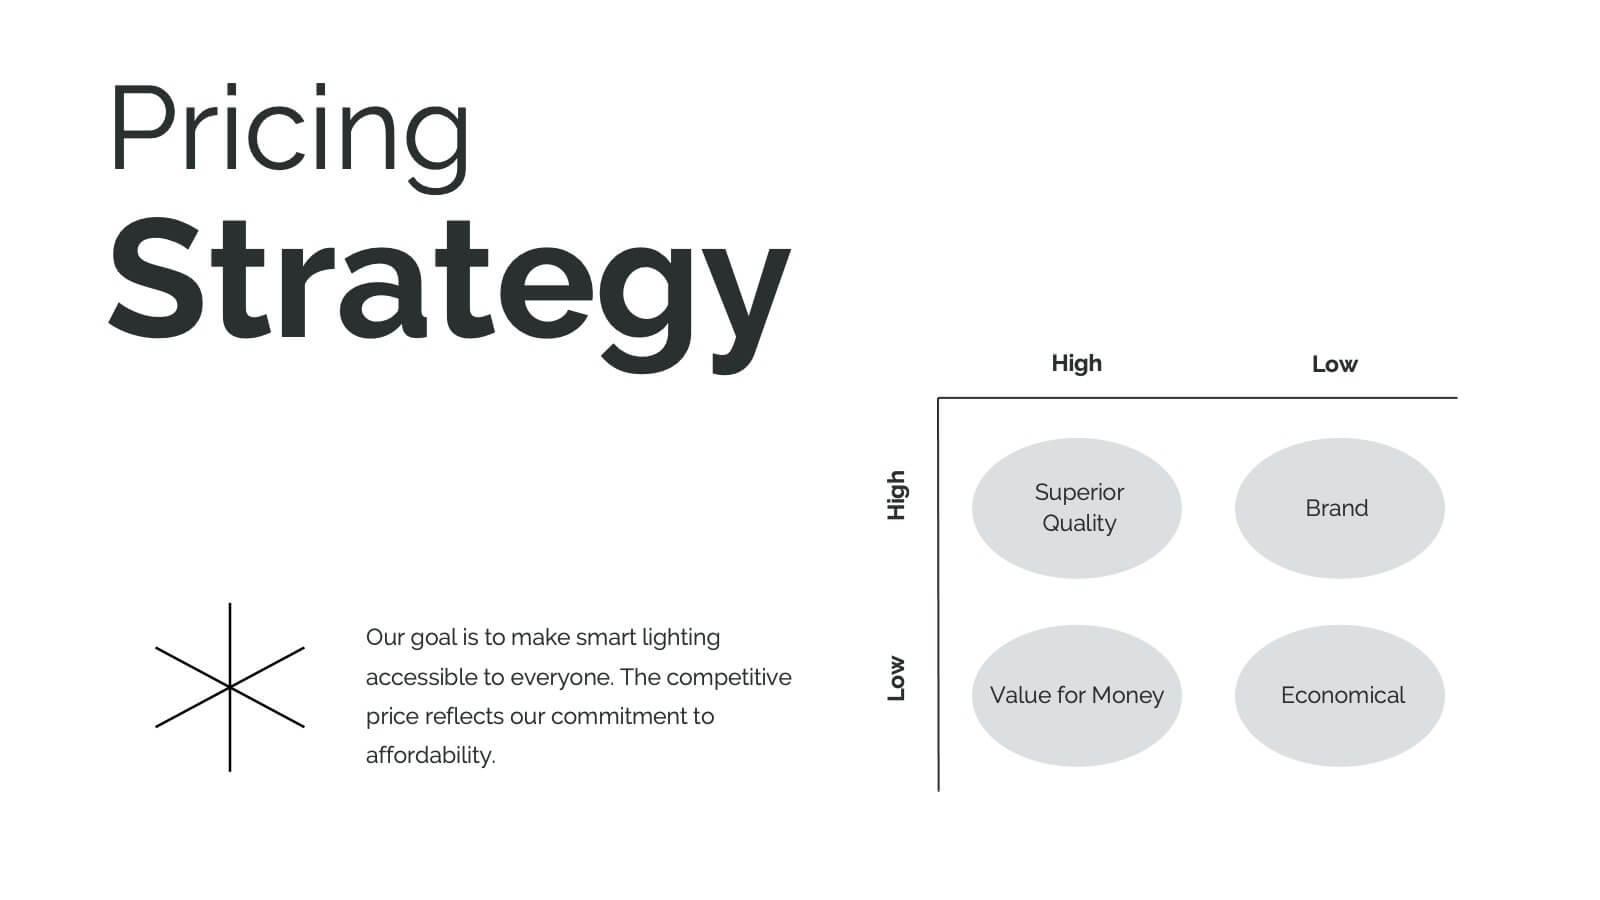
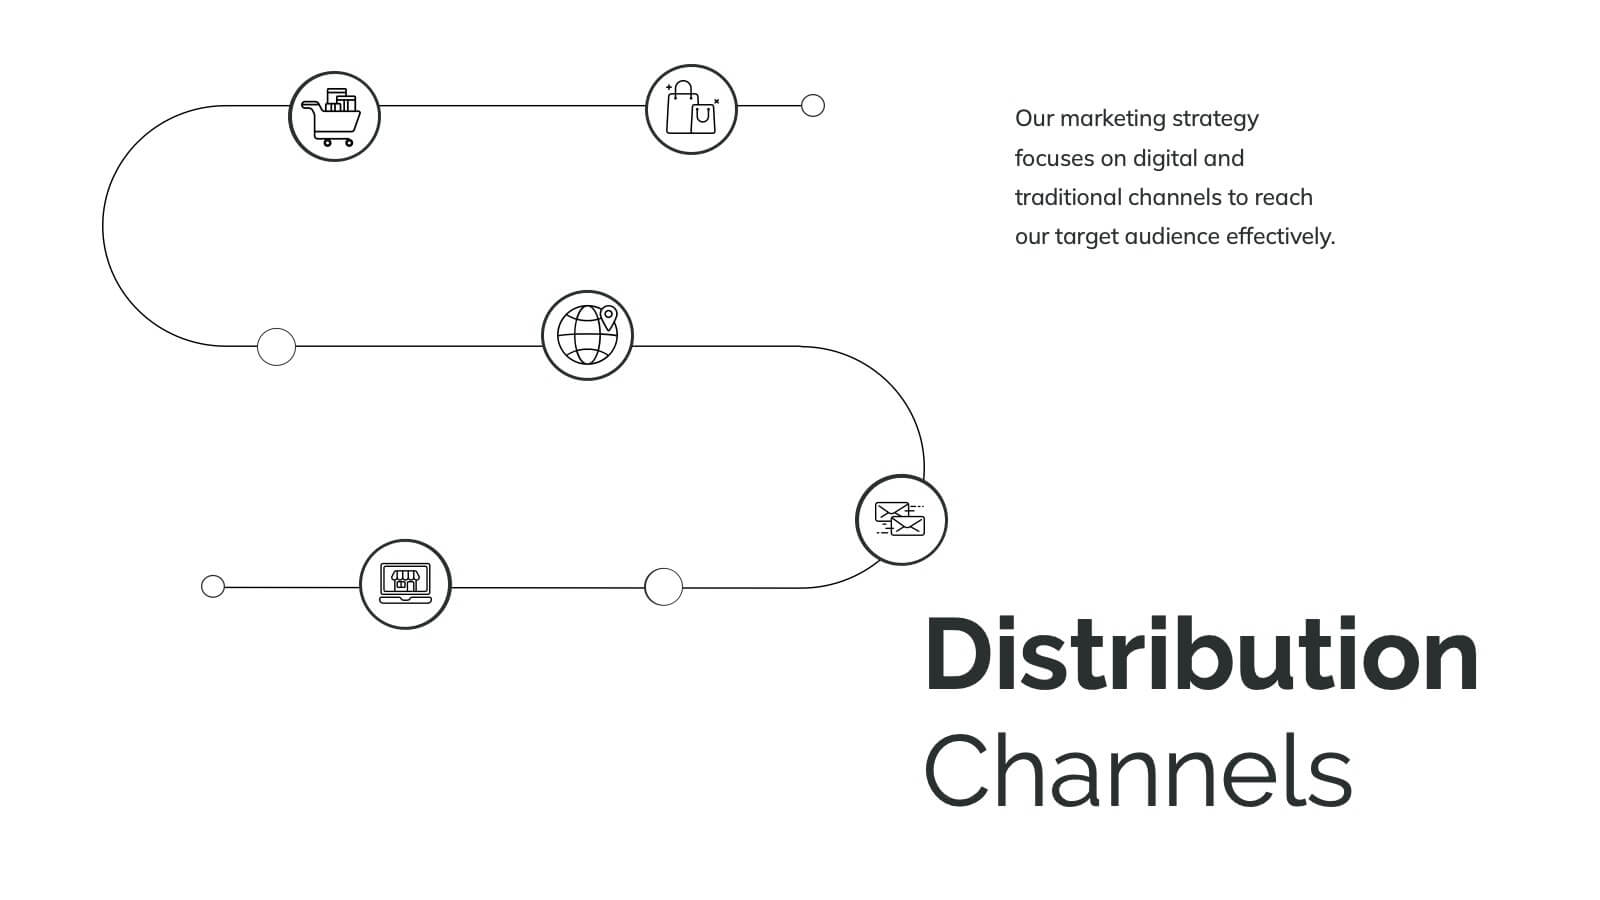
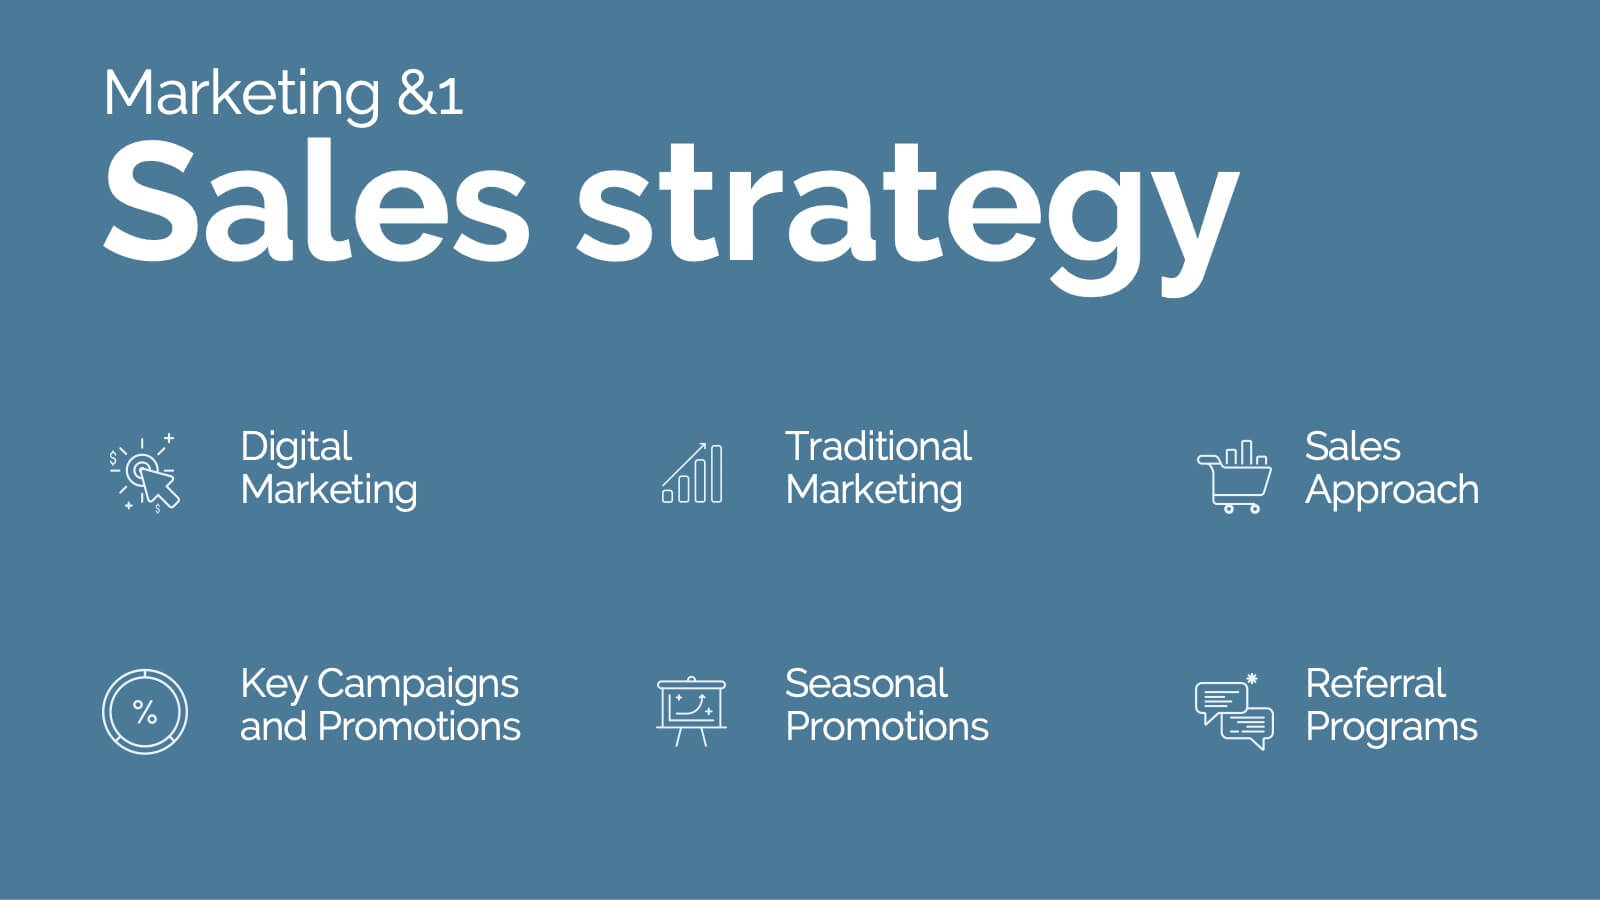
Hydra Product Launch Presentation
Unveiling your latest product has never been easier or more captivating! This comprehensive presentation template covers every aspect of your product's journey—from launch to competitive analysis. Engage your audience with detailed slides on features, target analysis, and pricing strategy. Seamlessly compatible with PowerPoint, Keynote, and Google Slides for maximum flexibility and impact.