


Características


¿Tienes alguna pregunta?
Recomendar


5 diapositivas
Architecture and Construction Strategy Presentation
Lay the foundation for success with this clean, construction-inspired presentation design. Ideal for showcasing project strategies, development phases, or architectural plans, it helps you communicate structure and vision with clarity. Fully customizable and compatible with PowerPoint, Keynote, and Google Slides for effortless editing and professional results.


7 diapositivas
Value Chain Infographic Presentation Template
The five primary activities of the value chain are: inbound logistics, operations, outbound logistics, marketing and sales, service. It is made up of four secondary activities: firm infrastructure, human resource management, technology development and procurement. The value chain is a tool for evaluating how a business operates. With this value chain template, you'll be able to identify various links in the value chain, and determine where an opportunity for product differentiation exists. This template helps lay out your actual value chain and identify where opportunities exist to improve.


6 diapositivas
Stock Market Investment and Analysis Presentation
Showcase your market insights with this dynamic zigzag arrow diagram—perfect for highlighting bullish vs. bearish trends, financial analysis, and investment milestones. The slide features a split-path layout with icons and editable text areas to clearly compare strategies or illustrate turning points. Fully customizable in PowerPoint, Keynote, and Google Slides.


5 diapositivas
Professional Business Proposal Presentation
Make your pitch stand out with a polished, minimal design that highlights every key stage of your business strategy. This clean visual layout is perfect for outlining project phases, services, or data-driven insights with clarity and impact. Fully compatible with PowerPoint, Keynote, and Google Slides for easy customization.


6 diapositivas
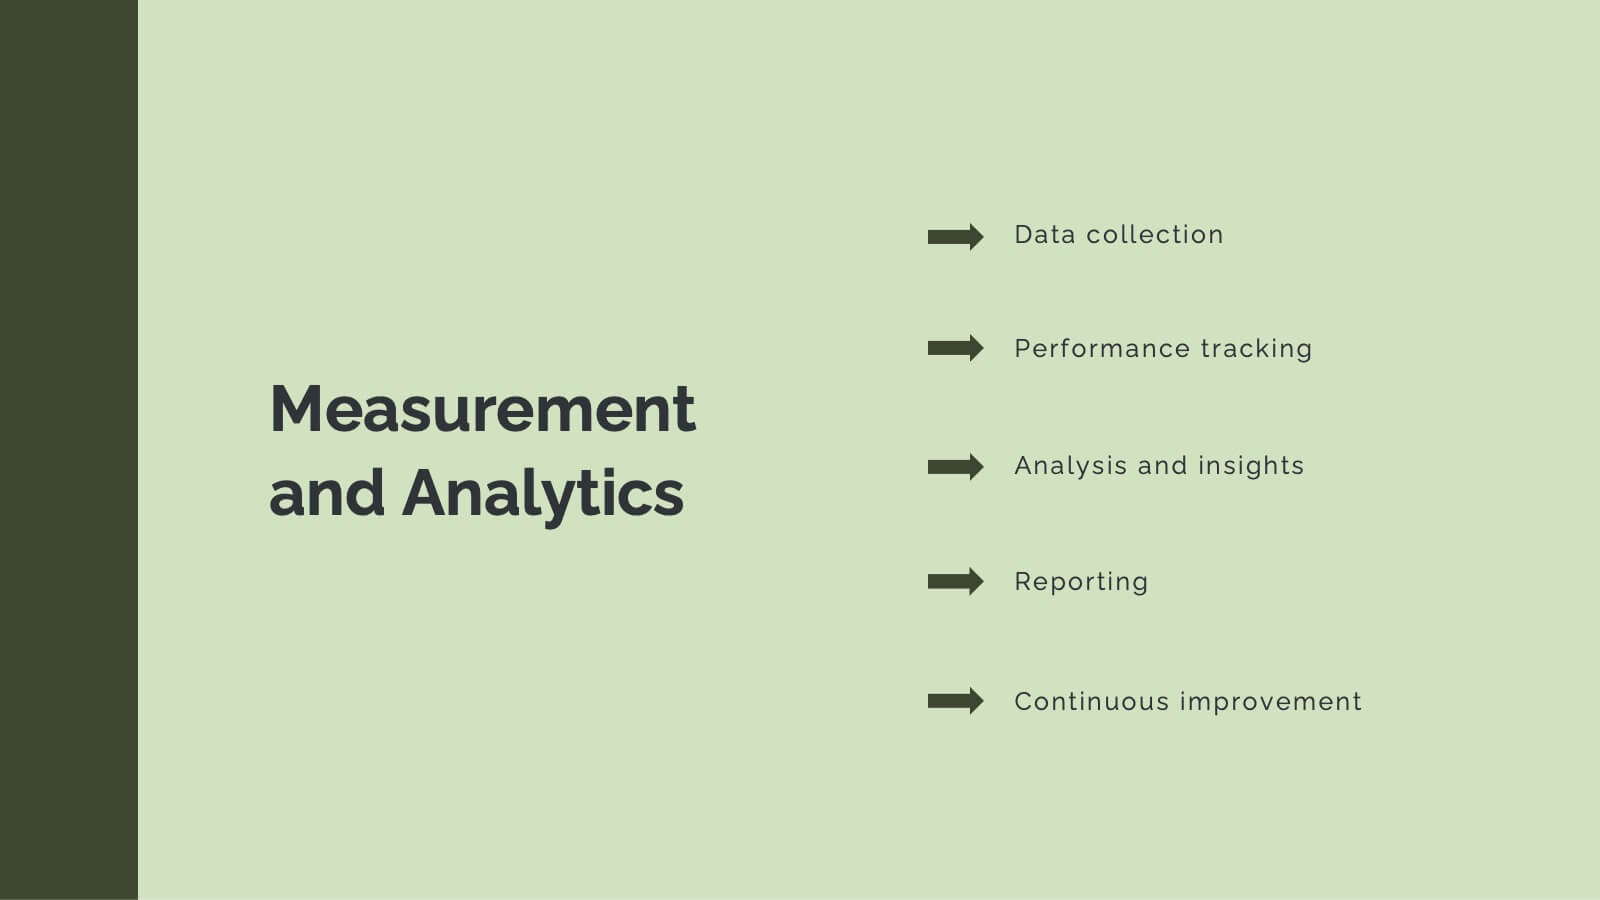
Digital Marketing Campaign Strategy Presentation
Present your marketing flow with clarity using the Digital Marketing Campaign Strategy Presentation. This dynamic arrow-style layout is ideal for outlining five key phases of a digital campaign—from planning and promotion to tracking results. Fully customizable in Canva, PowerPoint, Keynote, and Google Slides to fit your campaign strategy.


7 diapositivas
Artificial Intelligence Education Infographic Presentation
Artificial Intelligence is an important field of study and development that has the potential to revolutionize many aspects of modern life. A great way to display your ideas in a visual manner, this AI Infographic Template can be used by businesses and corporations who want to communicate their team vision in a clear and dynamic way. This template is completely editable, allowing you to customize it with your own information and photos. It includes icons and graphs to illustrate your points, as well as text boxes and slide titles. It is compatible with Powerpoint, Keynote and Google Slides.


6 diapositivas
RAPID Responsibility Matrix Infographics
Efficiently manage responsibilities and tasks with our RAPID Responsibility Matrix infographic template. This template is fully compatible with popular presentation software such as PowerPoint, Keynote, and Google Slides, allowing you to easily customize it to meet your specific project needs. The RAPID Responsibility Matrix infographic template offers a structured framework for defining roles and responsibilities within your team or organization. Whether you're a project manager, team leader, or simply looking to streamline workflows, this template provides a user-friendly platform to create clear and concise matrices for your projects. Optimize your project management processes with this SEO-optimized RAPID Responsibility Matrix infographic template, thoughtfully designed for clarity and ease of use. Customize it to assign and communicate responsibilities effectively, ensuring smooth collaboration and project success. Start crafting your personalized infographic today!


7 diapositivas
Mind Map Project Infographic
A mind map is a visual representation of information, ideas, or concepts arranged around a central topic or theme. This template is a powerful brainstorming and organizational tool that helps individuals or teams visually connect related ideas, explore new connections, and see the bigger picture. This diagram organizes information around a central theme or idea, with branches extending outwards to represent related concepts or tasks. This infographic is perfect for for capturing ideas, and presenting complex information in a structured and easily manner. This template is customizable and compatible with Powerpoint, Keynote, and Google Slides.


21 diapositivas
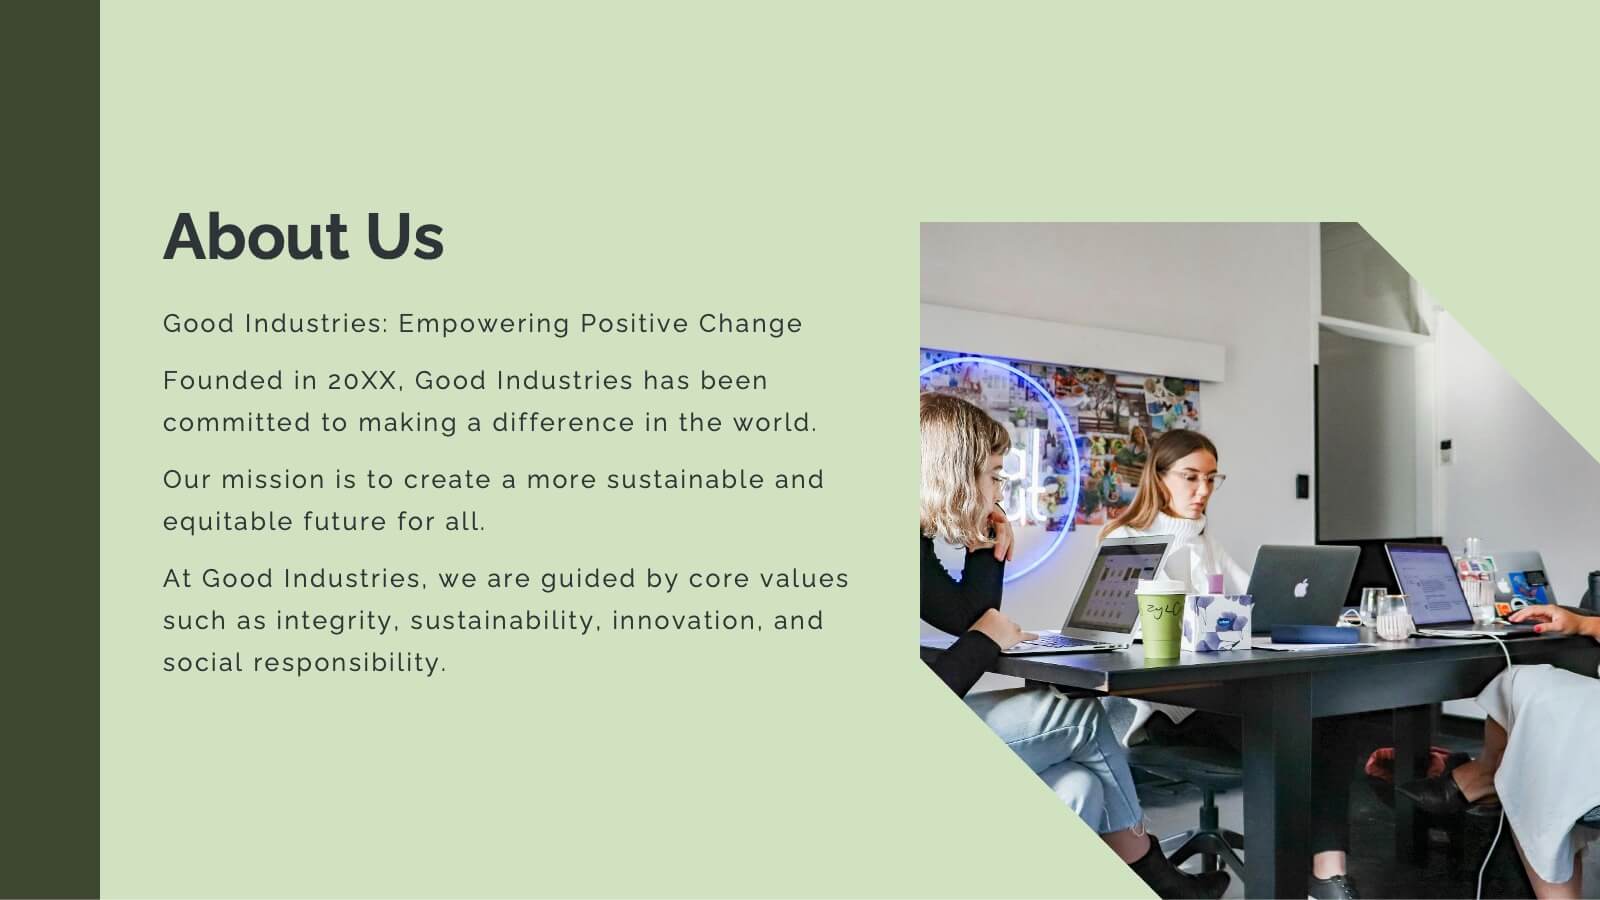
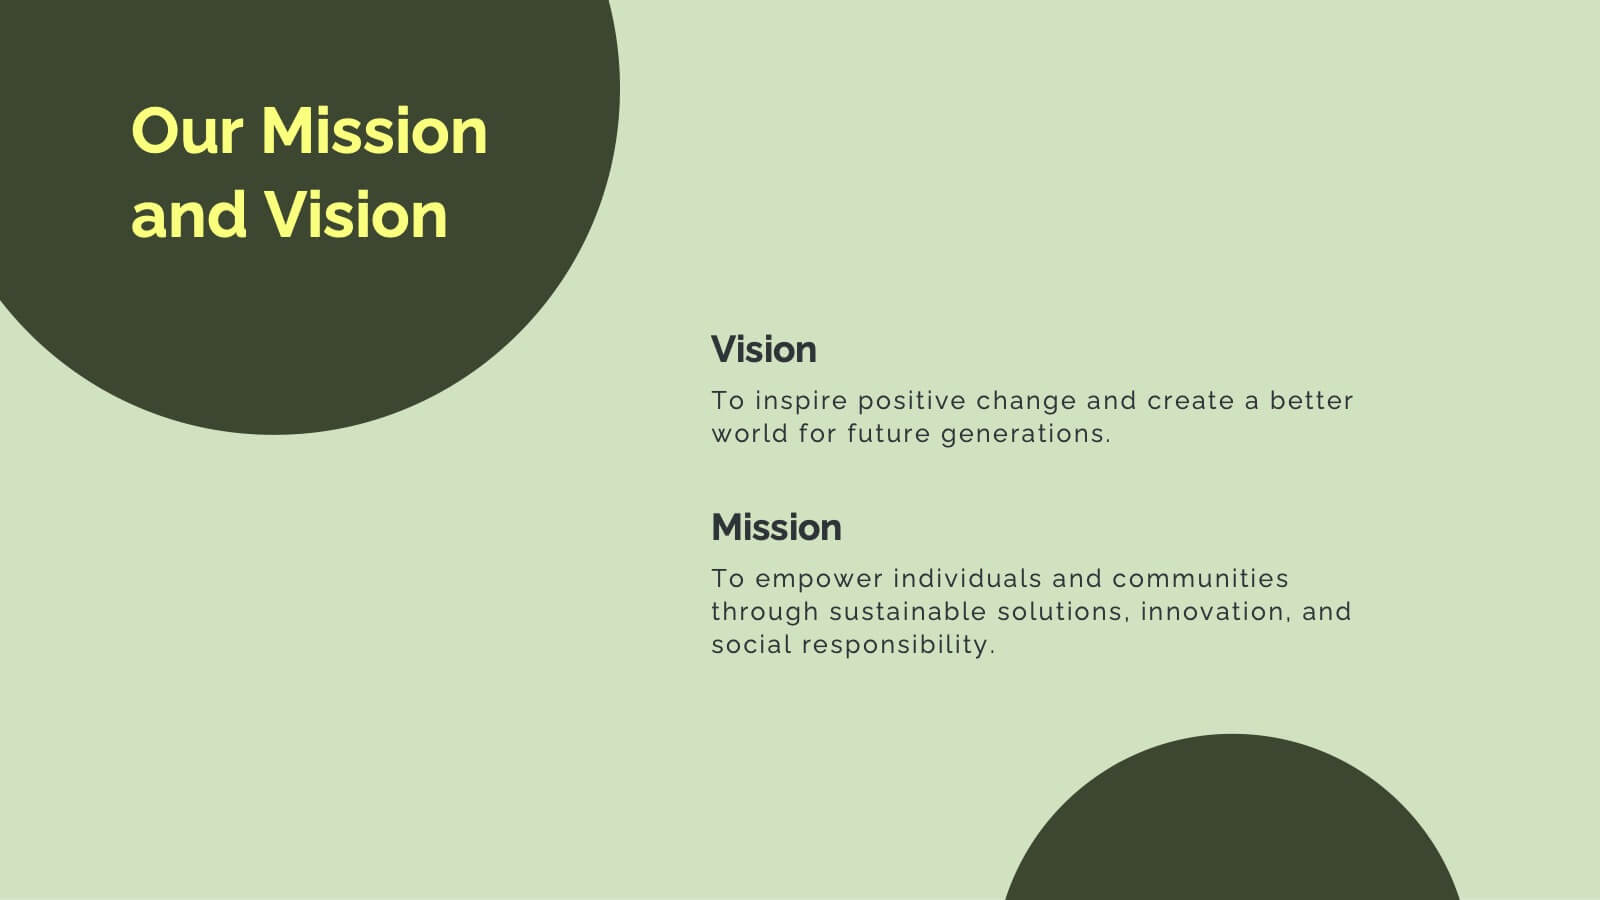
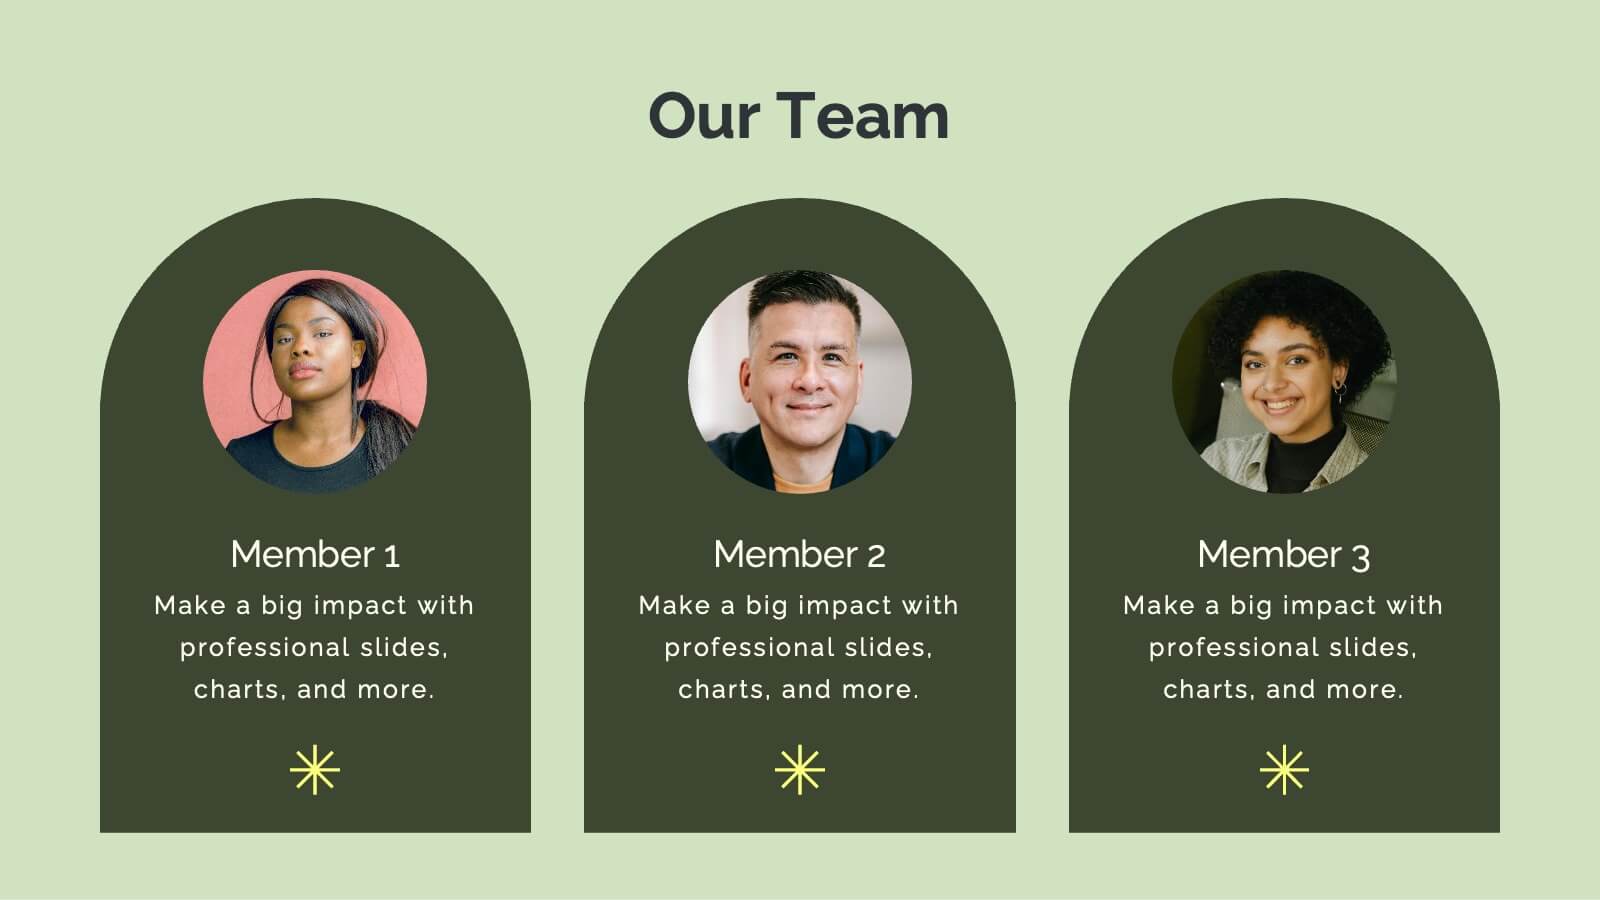
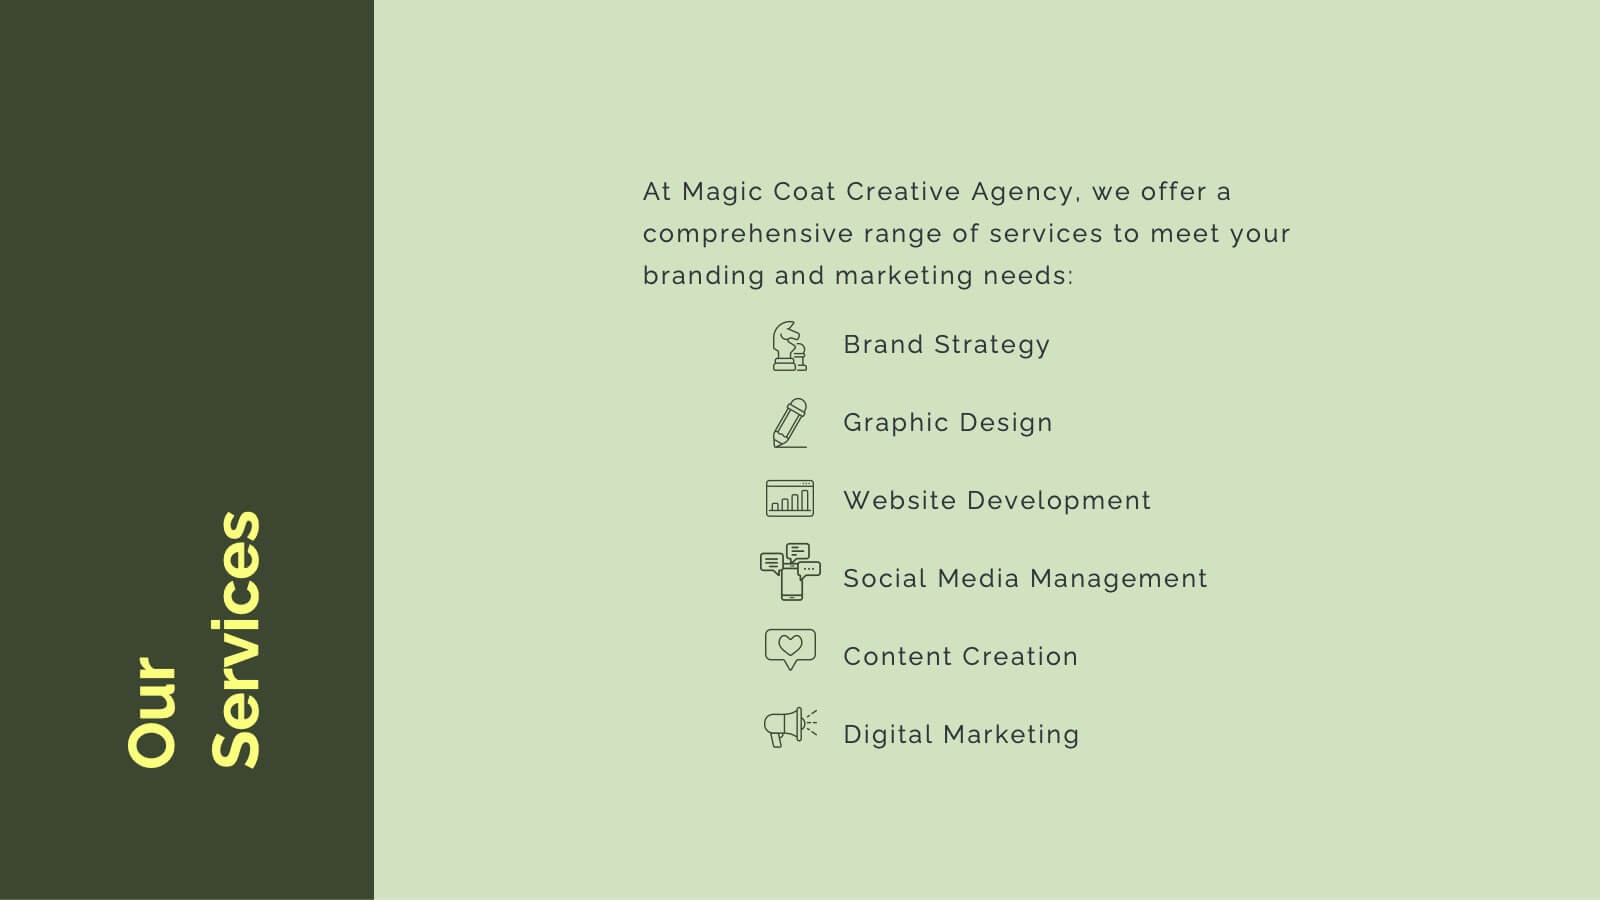
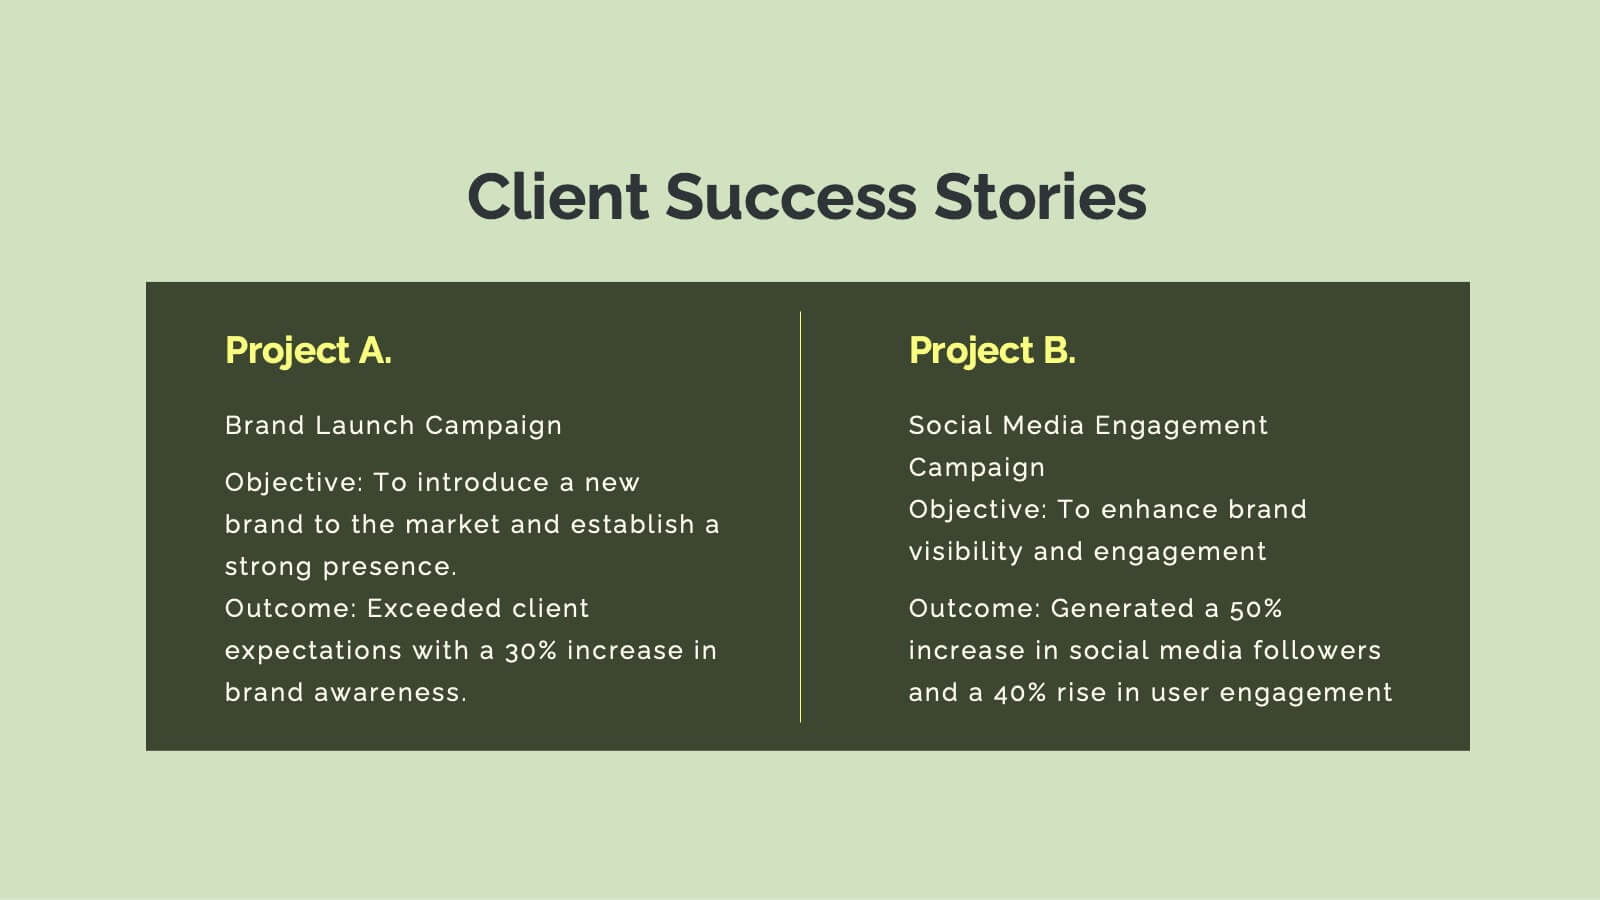
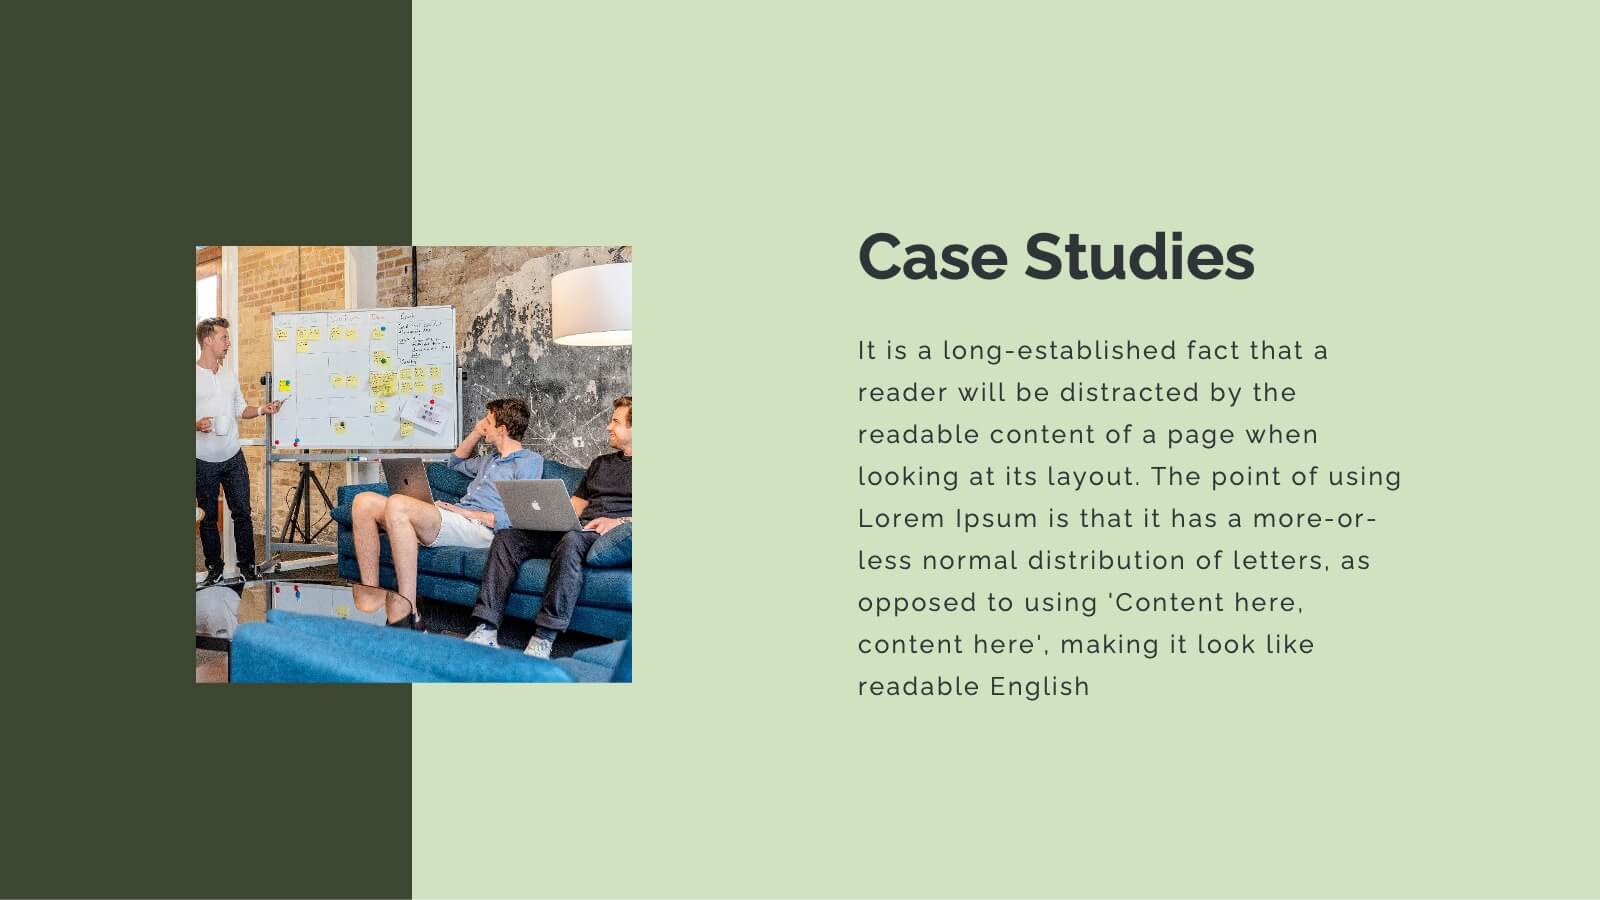
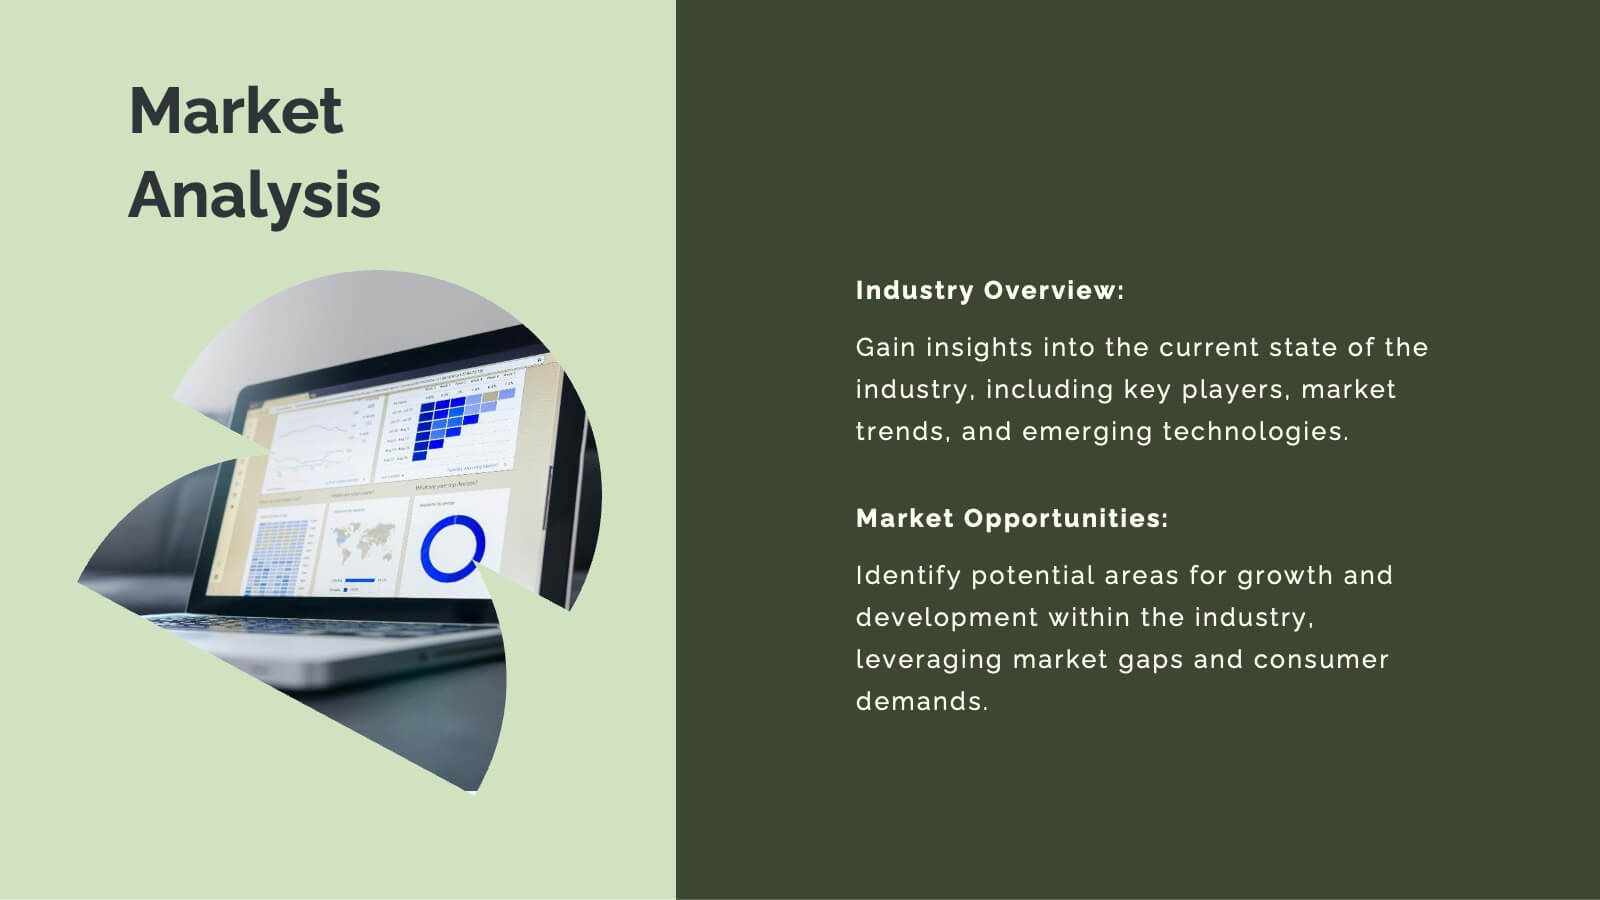
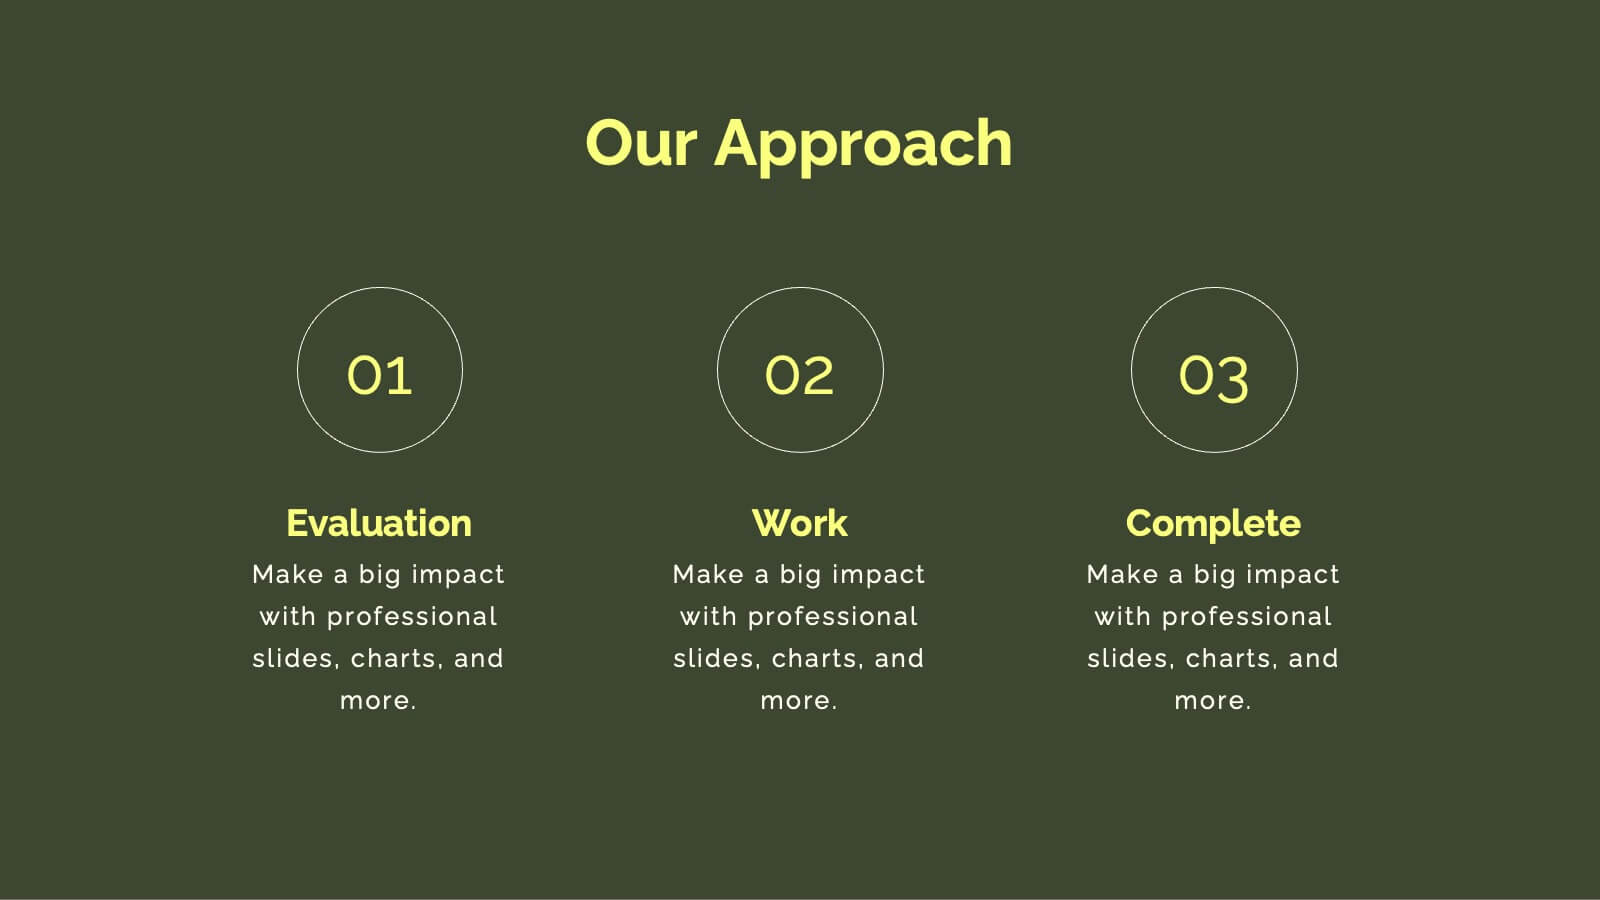
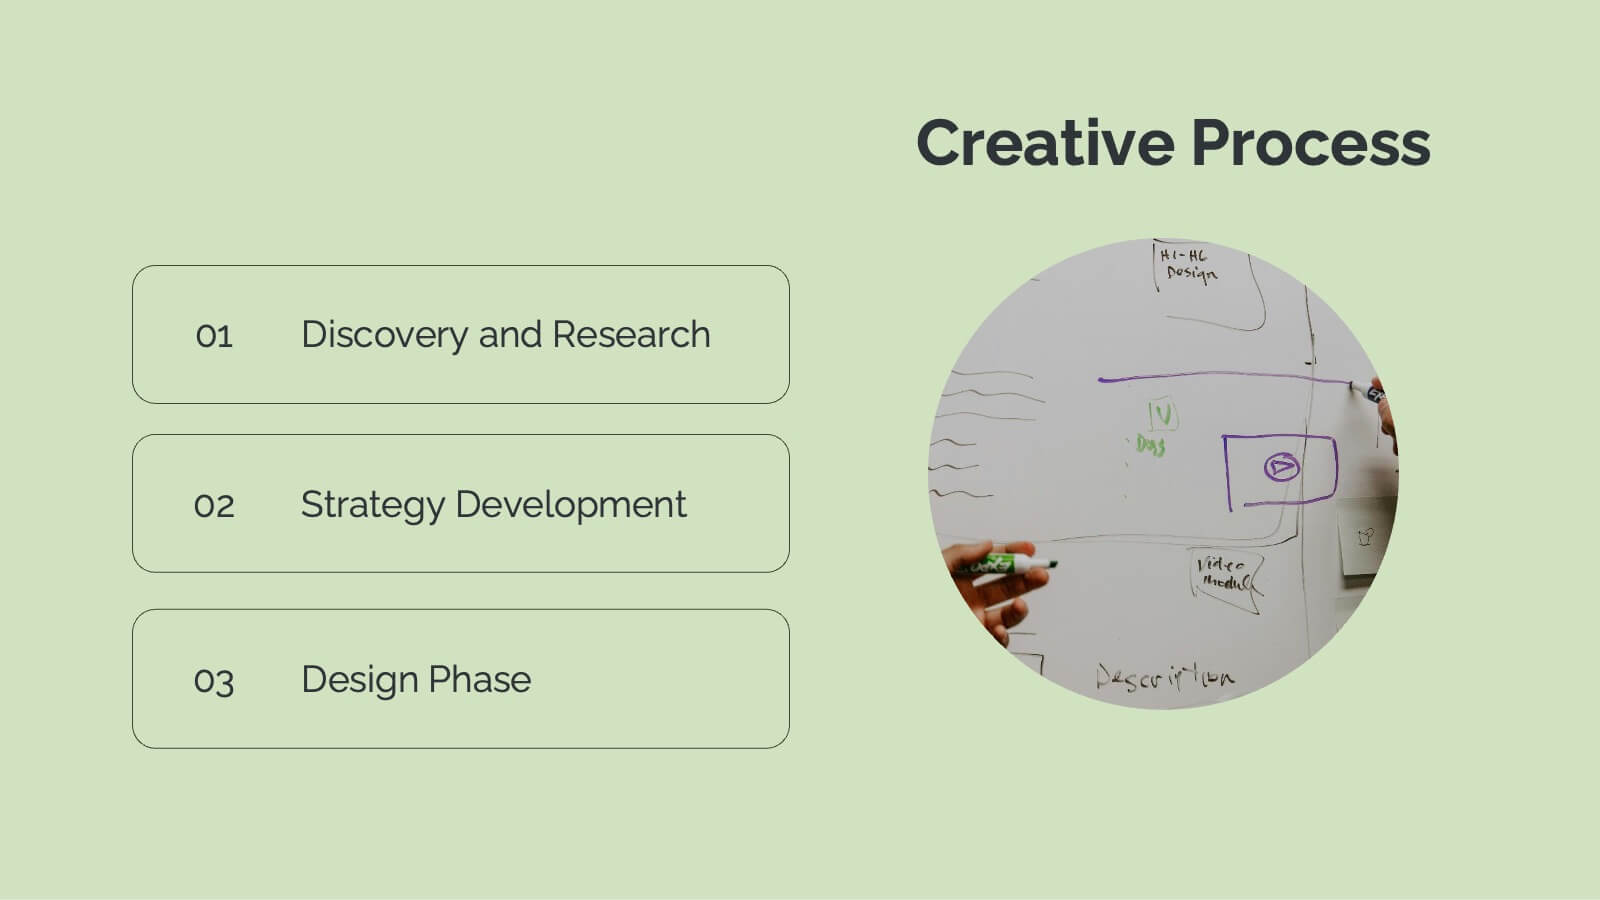
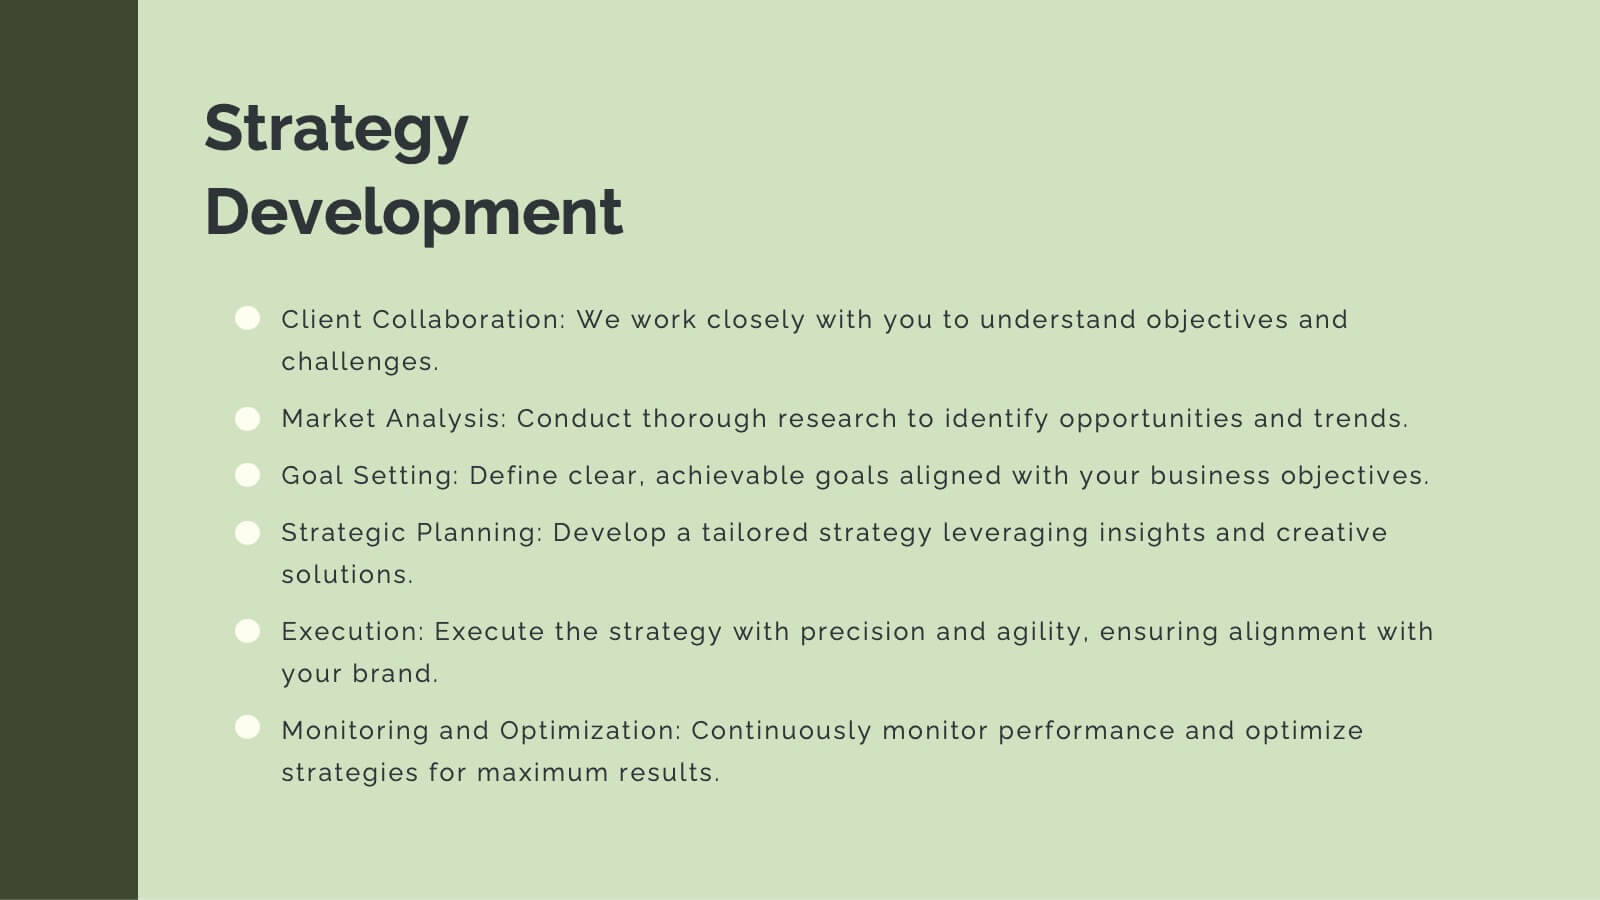
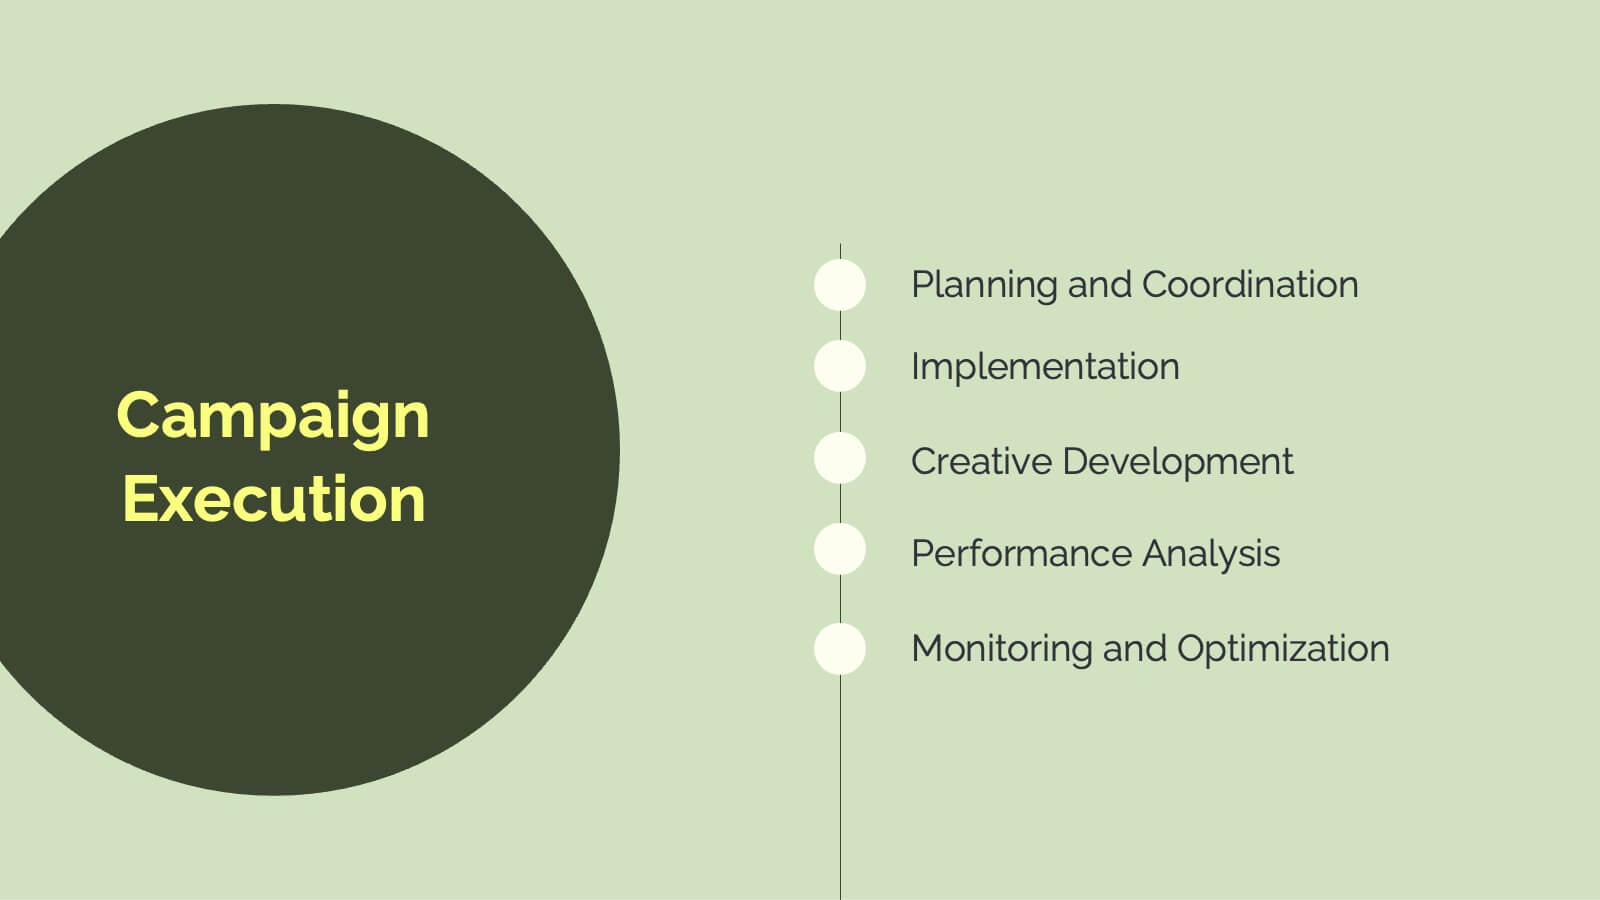
Horizon Advertising Agency Proposal Presentation
Elevate your advertising impact with this comprehensive agency proposal template. It’s meticulously designed to showcase your agency’s capabilities from strategic planning to creative execution, ensuring a persuasive presentation of services like market analysis, campaign strategies, and client success stories. Each slide is formatted to facilitate understanding and engagement, making it perfect for highlighting your team's expertise and unique approach. Compatible with major presentation platforms like PowerPoint, Google Slides, and Keynote, this template supports your efforts to secure new clients and projects seamlessly across various devices.


6 diapositivas
Roadmap Milestones Infographic
Chart your project's progress with our Roadmap Milestones Infographic, optimized for Powerpoint, Google Slides, and Keynote. This infographic is expertly designed to visualize the journey of your project from conception to completion. The roadmap's layout is intuitive and user-friendly, making it simple to customize with your specific project stages, timeframes, and critical tasks. Whether you're outlining a new business initiative, or planning an event, this template helps you lay out a path to success that your team can follow. With this Roadmap infographic, you can keep stakeholders informed and your team aligned on the project's goals and progress.


4 diapositivas
User Experience Flow Presentation
Bring clarity and color to every stage of your user experience process with this clean, structured presentation. It helps you outline steps, explain interactions, and highlight key insights in a visually intuitive flow. Easy to customize and fully compatible with PowerPoint, Keynote, and Google Slides.


26 diapositivas
Corporate and Investment Company Profile Presentation
A corporate and investment company profile is a comprehensive document that provides detailed information about a company engaged in corporate and investment services. This presentation template is an effective way to introduce your company's services, capabilities, and track record to your audience. This template can be used to reflect your company's professionalism, expertise, and value proposition. This presentation is fully customizable and compatible with Powerpoint, Keynote, and Google Slides. This allows you to incorporate your company logo, brand colors, and relevant images that reflect your corporate identity.


6 diapositivas
Credit Card Features Overview Presentation
Bring your audience into the world of smart spending with a clean, visual layout that explains key credit card features in a simple, engaging way. This presentation helps you break down benefits, terms, and essential details with clarity and confidence. Fully editable and compatible with PowerPoint, Keynote, and Google Slides.


6 diapositivas
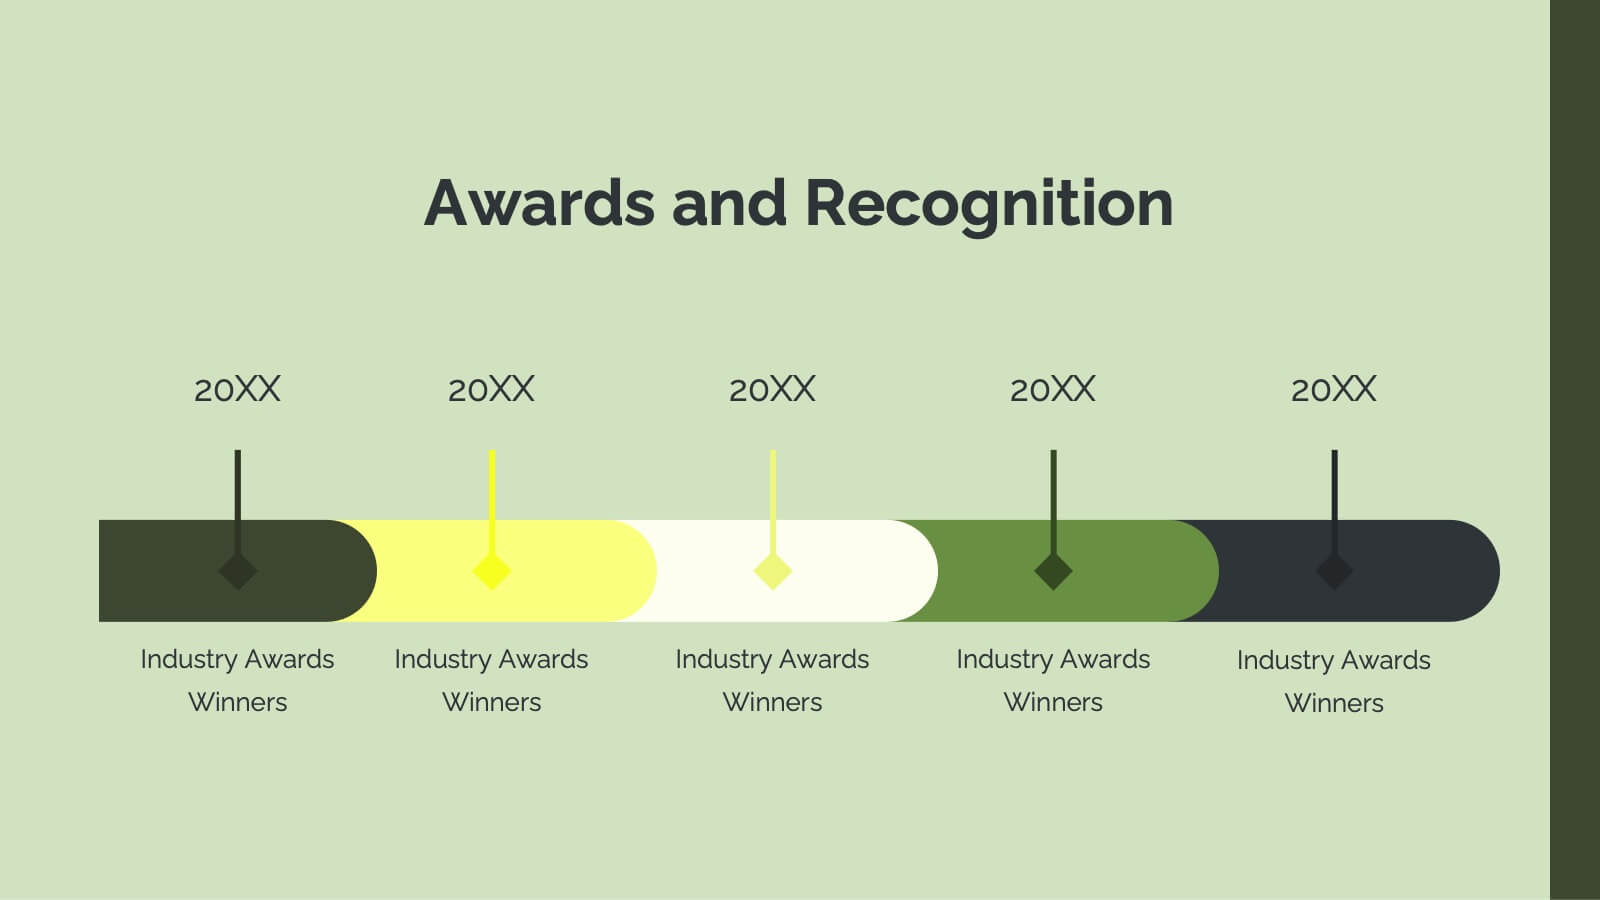
Revenue Growth Sales Slide Presentation
Showcase your business success with this Revenue Growth Sales Slide Presentation. The upward-curved arrow design highlights five key milestones, each with customizable titles, icons, and color accents. Perfect for illustrating sales performance, growth metrics, or financial forecasts. Easy to edit in PowerPoint, Keynote, or Google Slides—ideal for sales teams, analysts, and executives.


6 diapositivas
Managing Transition in Business Presentation
Make your next strategy session visually unforgettable with this clean, step-by-step layout. Designed to help explain transitional phases in business, this infographic template simplifies complex change processes into digestible segments. Ideal for professionals presenting transformation strategies. Fully editable and compatible with PowerPoint, Keynote, and Google Slides for easy use.


7 diapositivas
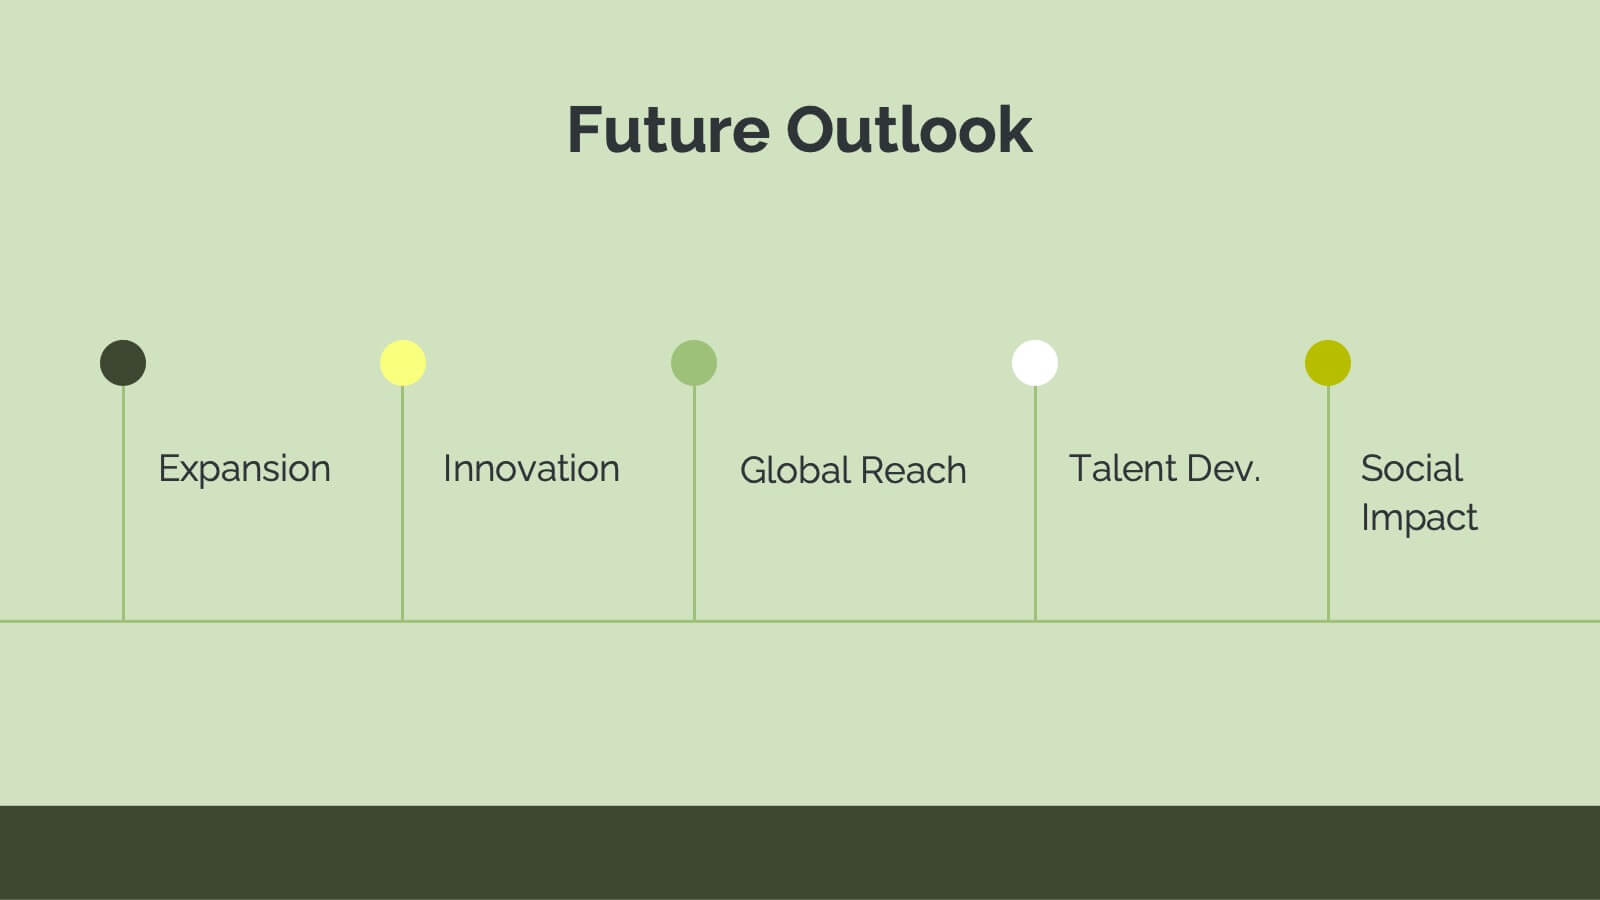
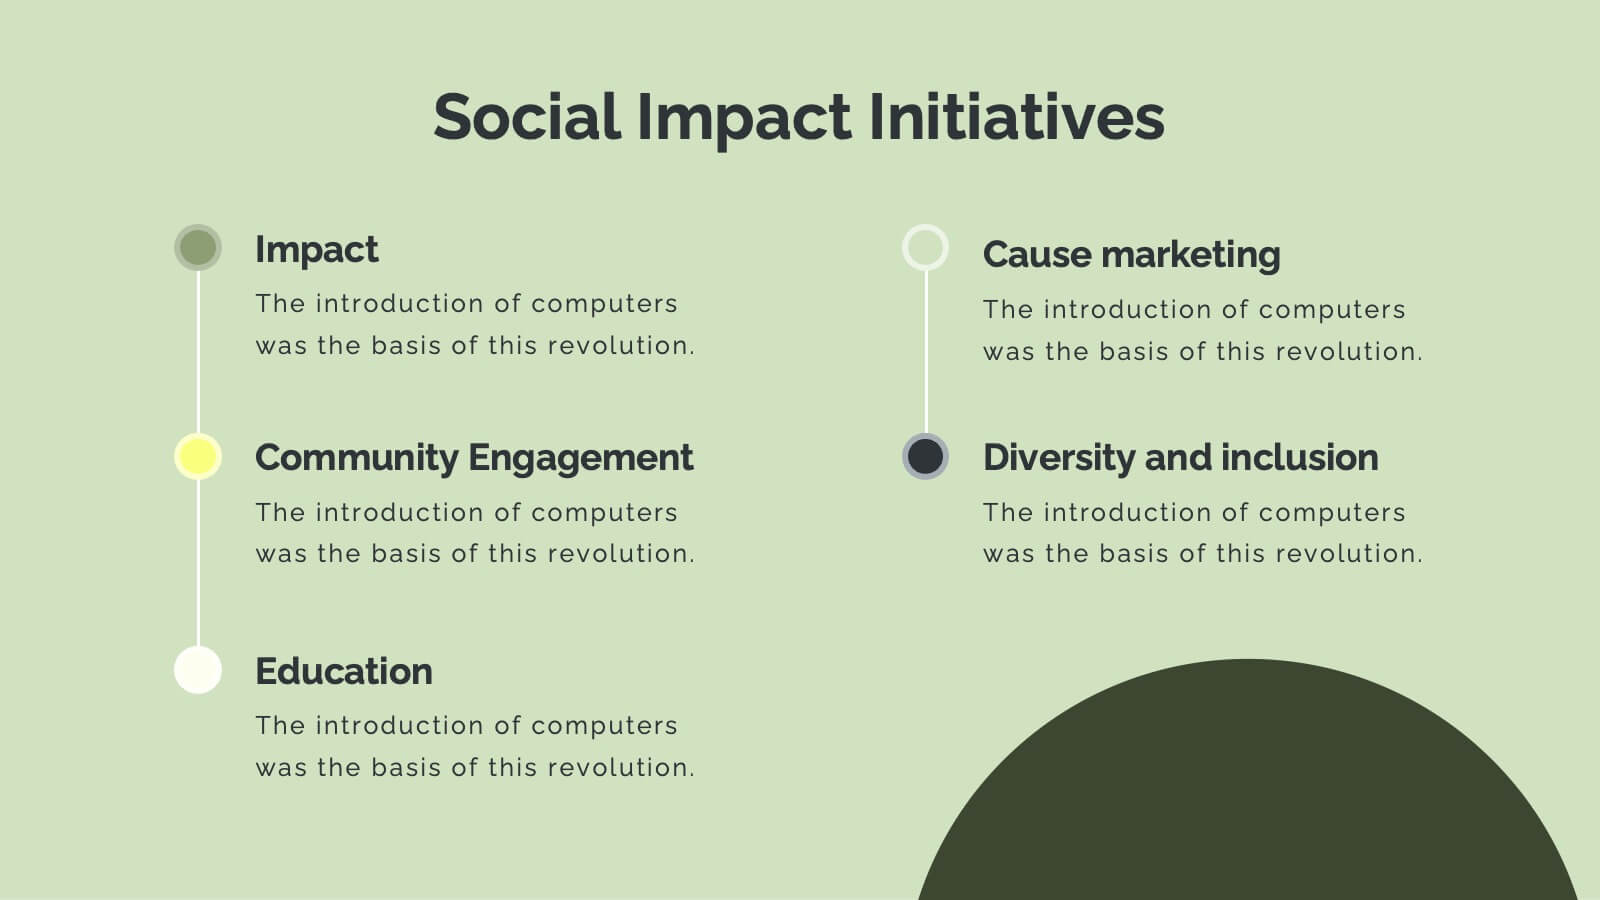
Vision Infographic
Elevate your presentations with our range of Slide Templates, tailored to showcase long-term objectives and strategies. These designs vary from simple and clean to bold and engaging, ensuring that every slide effectively communicates your forward-looking plans. Each template is crafted for easy customization to suit your brand's style, including areas for essential details, data representation, and motivational elements. They are perfect for aligning your team, engaging stakeholders, and promoting strategic discussions. Ideal for business presentations, team meetings, and motivational sessions, these templates offer a professional way to present your future goals and engage your audience effectively.


2 diapositivas
Modern Business Title Slide Presentation
Step into the future of presentations with the "Modern Business Slide," designed to make your corporate message shine. This template features a sleek, minimalist layout with bold typography and a striking visual of a stylish office setting, perfect for making a professional impact. Ideal for any business presentation, it's compatible with PowerPoint, Keynote, and Google Slides, ensuring versatility across different platforms.