


Características


¿Tienes alguna pregunta?
Recomendar


8 diapositivas
Winning Strategies for Professional Success Presentation
Showcase your top performers, strategic milestones, or ranked insights with this podium-style template. Featuring vibrant visuals and structured layout, it’s ideal for performance reviews, leadership presentations, and competitive analysis. Fully editable in PowerPoint, Keynote, and Google Slides—perfect for professional success stories, rankings, and progress highlights.


6 diapositivas
Onboarding 30-60-90 Day Roadmap Presentation
Get your team excited from day one with this colorful, easy-to-follow visual layout! This presentation template helps clearly map out onboarding goals and key activities across 30, 60, and 90 days. Perfect for HR professionals and team leads, it's fully editable and works with PowerPoint, Keynote, and Google Slides.


6 diapositivas
Statistics and Figures Report Presentation
Present complex data with clarity using the Statistics and Figures Report Presentation template. Featuring scatter plots, radar charts, and key metric highlights, this template is perfect for performance tracking, analytics reports, and business reviews. Fully customizable for PowerPoint, Keynote, and Google Slides, it ensures professional and insightful data visualization.


4 diapositivas
Annual Report Summary Slide
Present key performance metrics with confidence using this Annual Report Summary Slide. Designed with bold percentage visuals and clear titles, it helps break down quarterly or category results in a clean, professional format. Ideal for financial overviews, sales performance, or strategic summaries. Fully editable in PowerPoint, Keynote, and Google Slides.


10 diapositivas
Medical Anatomy Overview Presentation
Bring your audience into the world of medical insight with a slide that makes anatomy feel clear, modern, and easy to follow. This presentation highlights key organs and body systems in a clean visual layout, helping you explain health data with confidence. Fully compatible with PowerPoint, Keynote, and Google Slides.


4 diapositivas
Meet the Business Team Presentation
Ignite curiosity from the start with a clean, modern layout designed to introduce your team with clarity and confidence. This presentation highlights key roles, expertise, and contributions, helping audiences quickly understand who drives the work forward. Fully editable and easy to customize in PowerPoint, Keynote, and Google Slides.


6 diapositivas
Airline Business Strategy and Trends Presentation
Navigate your industry insights with clarity using this sleek aviation-themed slide. Perfect for showcasing five core data points or trends, each positioned along a stylized airplane graphic. This layout is ideal for airline professionals, aerospace consultants, and logistics analysts. Fully customizable in PowerPoint, Keynote, and Google Slides.


6 diapositivas
Biology Tree Diagram Infographic
Tree diagrams in biology are graphical representations that show the hierarchical relationships and evolutionary history of different organisms, species, or biological traits. This infographic template is designed to simplify complex biological information and show the interconnectedness between different biological topics or classifications. This infographic is a visual representation of various biological concepts and relationships in a hierarchical tree structure. This template color codes the different branches to distinguishing between the different categories and make the infographic easier to navigate.


7 diapositivas
Change Management Process Infographic Presentation
Change Management is the process of managing and guiding an organization or individual through a planned and deliberate change. This template is perfect for discussing change management and allows you to customize the design and add your own tips. Designed in Powerpoint, Keynote, and Google Slides it is easy to use with helpful illustrations. Use this change management template to report on current practices, issues and reasons for change, along with how these changes can improve your organization's performance. The perfect tool to share your vision and plan, or align an entire organization!


14 diapositivas
Leadership Training Workshop
Build stronger leaders with a visually engaging puzzle-style layout that maps out each stage of leadership development. This training workshop presentation uses an intuitive, step-by-step format to guide your audience through key growth areas, making it perfect for team-building or executive sessions. Fully compatible with PowerPoint, Keynote, and Google Slides.


4 diapositivas
Comparative Assessment Using Harvey Ball Chart Presentation
Make your evaluations easier to understand with this Harvey Ball chart template. Designed for performance comparison, efficiency scoring, or feature benchmarking, this layout supports up to 4 items and 3 criteria. Each element is clearly visualized for quick decision-making. Fully editable in PowerPoint, Keynote, or Google Slides—ideal for business strategy, operations, or HR presentations.


6 diapositivas
Breast Cancer Effects Infographic
Breast Cancer Awareness Month, is an annual international health campaign organized by various organizations to raise awareness about breast cancer, highlight the importance of early detection and treatment, and provide support for those affected by the disease. This infographic template is a visual representation that provides information about the various effects and impacts of breast cancer on individuals' health, well-being, and daily lives. This infographic can be used to raise awareness, educate, and support individuals who are affected by breast cancer, as well as their families and communities.


7 diapositivas
Technology Innovations Infographic
Technology innovations refer to significant and novel advancements, improvements, or creations in processes, products, services, or systems that introduce new features, functionalities, or approaches. Get ready to ignite the tech world with our technology infographic. This infographic will journey your audience into the cutting-edge world of technology. Prepare your viewers for a mind-blowing showcase of innovation and progress. Compatible with Powerpoint, Keynote, and Google Slides. Inspire action and invite readers to step boldly into a new era of technological innovations.


26 diapositivas
Cassanra Presentation Template
Cassanra is a bold, professional template with a retro look. Its ravishing, modern aesthetic will stand out and grab your attention, while detailed design elements keep it readable. Packed with features like charts, timelines, and easy to edit text blocks, Cassanra is perfect for businesses as well as personal use. A mixture of bold colors are used to help keep the look appealing and easy to read. This template comes with a large amount of features from charts, timelines and an easy to edit text this template is perfect for businesses seeking to make an impression on their audience.


8 diapositivas
Executive Summary Business
Present key insights clearly with this modern Executive Summary slide. Designed for impact, it highlights core data points alongside four strategic pillars—perfect for quarterly updates, board meetings, or business reviews. Fully editable in PowerPoint, Keynote, and Google Slides. Clean layout, customizable icons, and sleek visuals ensure a professional finish.


10 diapositivas
Sustainability Management Metrics Framework
Showcase your environmental KPIs with the Sustainability Management Metrics Framework Presentation. This tree-inspired visual design is perfect for highlighting four key metrics across sustainability, compliance, or ESG reporting. Fully editable in PowerPoint, Keynote, or Google Slides, it’s ideal for eco-conscious business reviews, annual reports, or internal strategy updates.

23 diapositivas
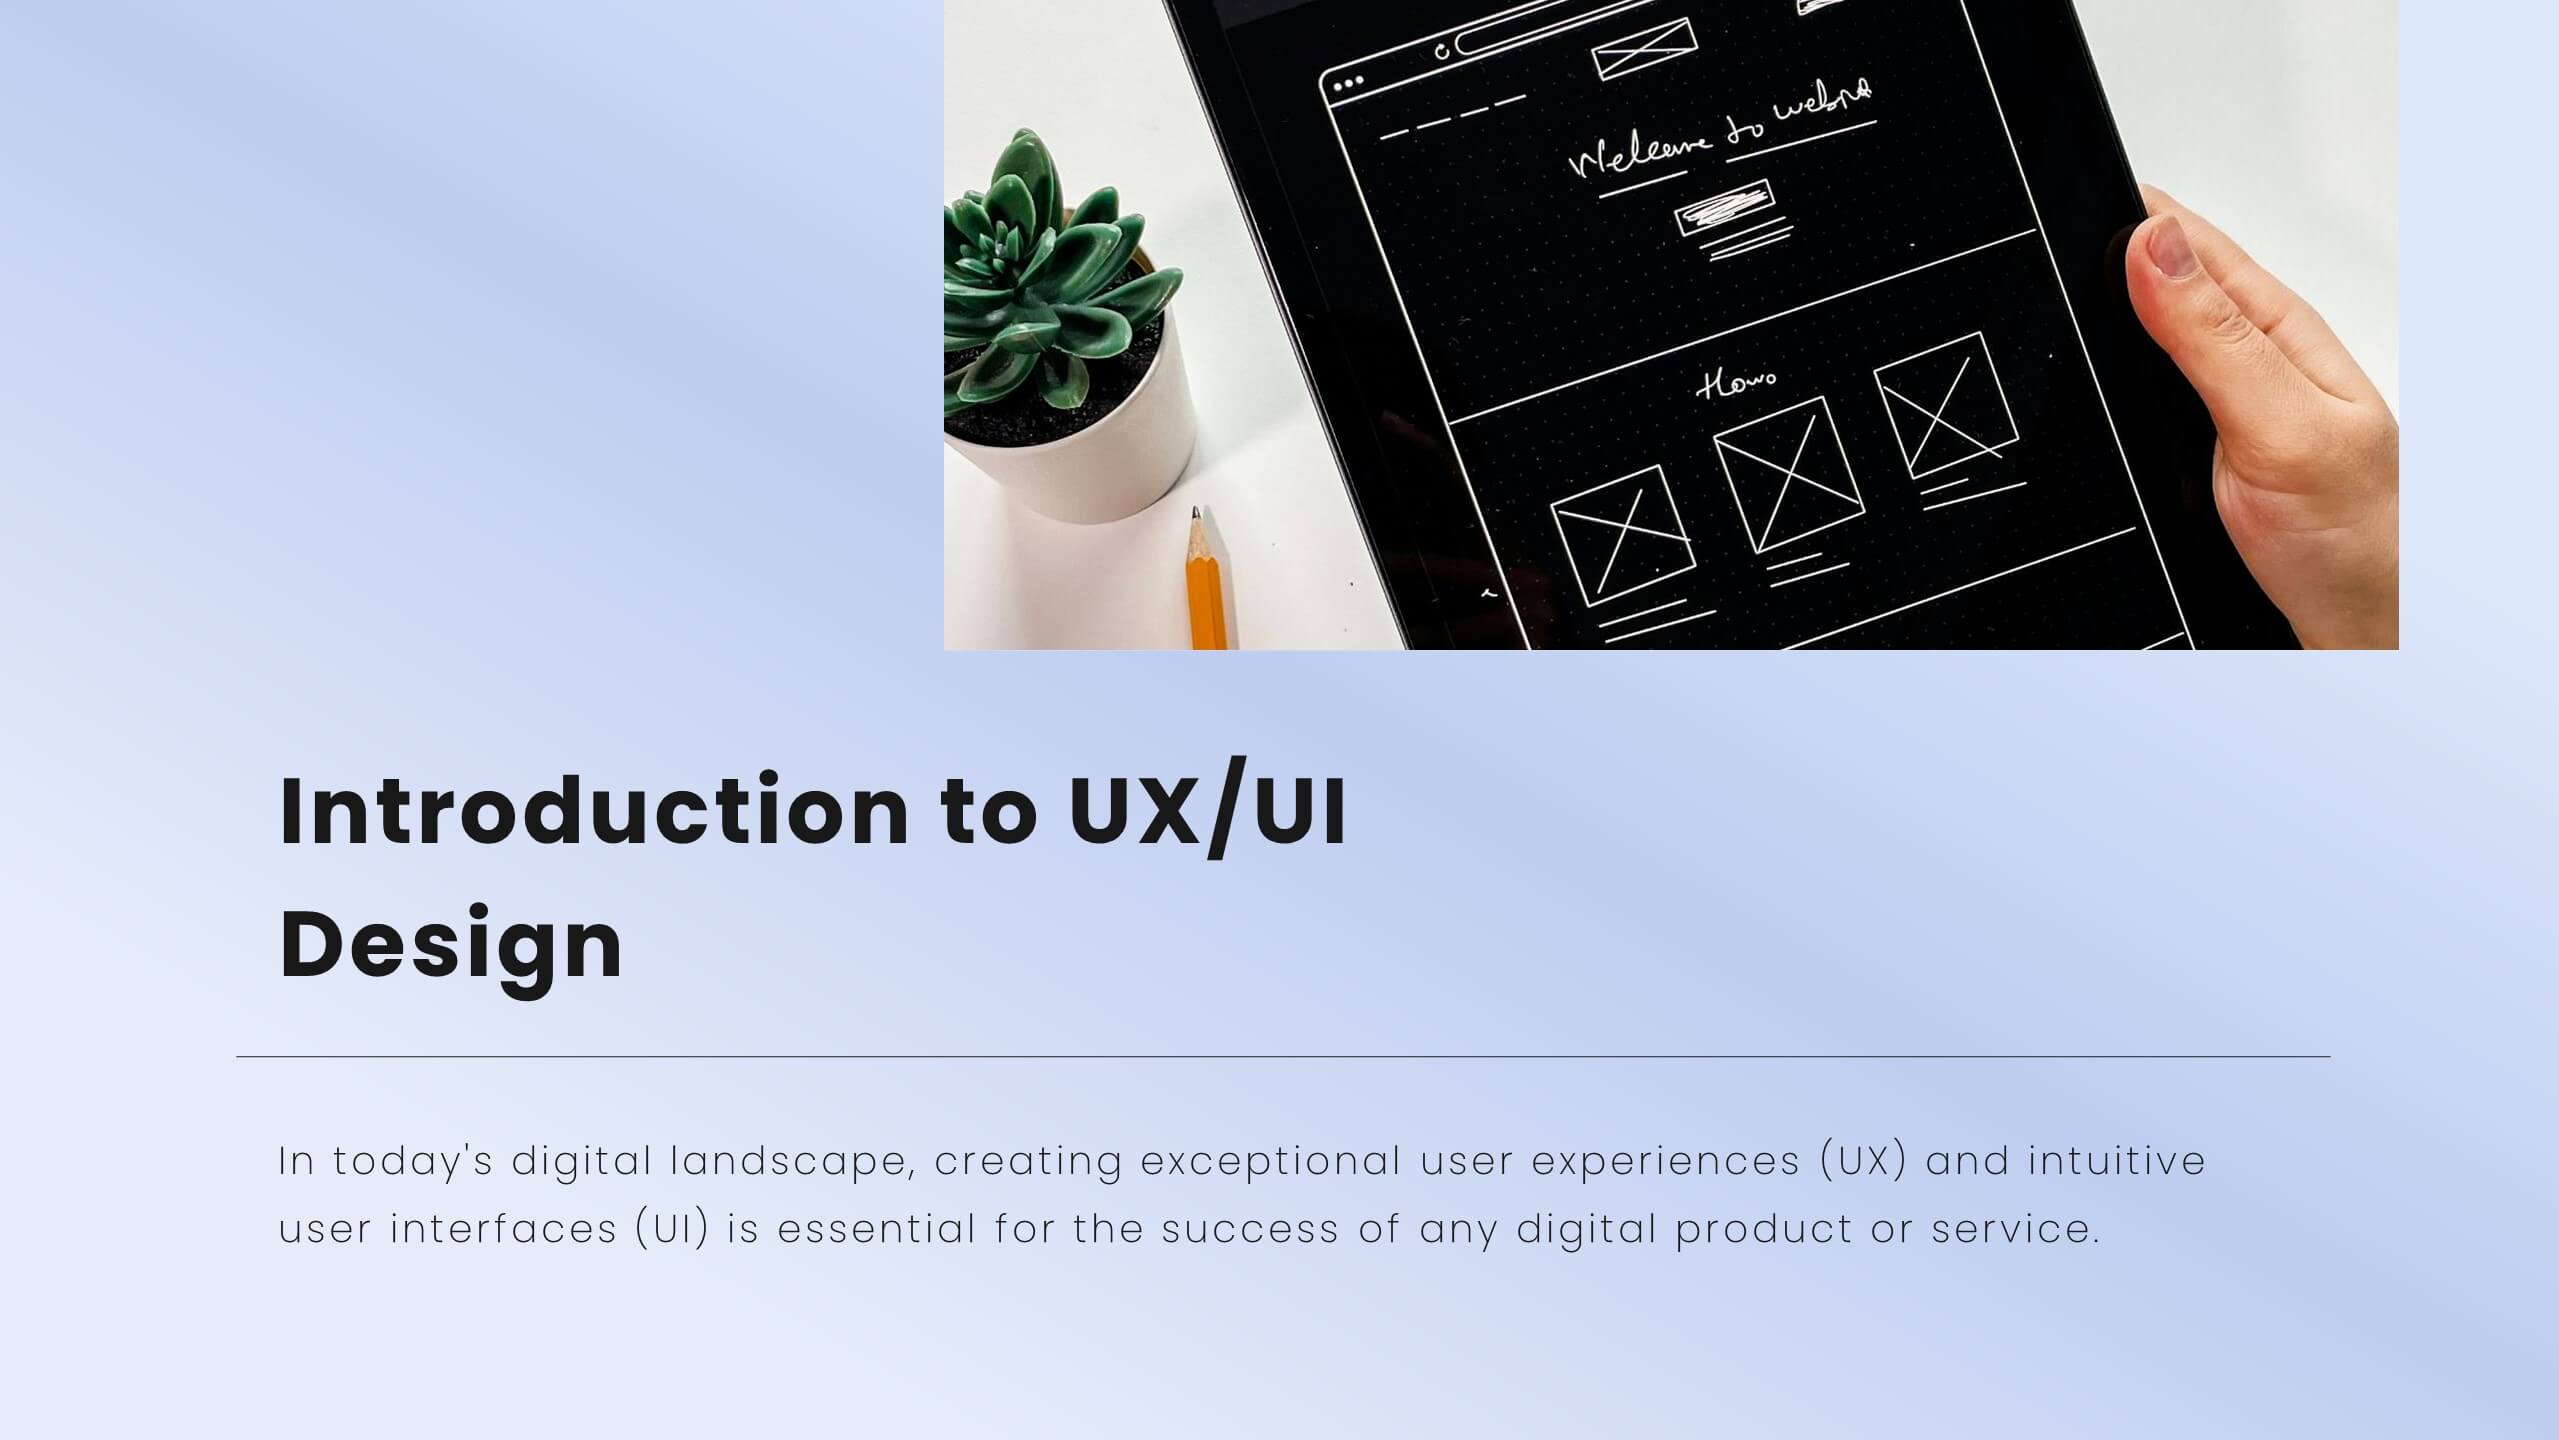
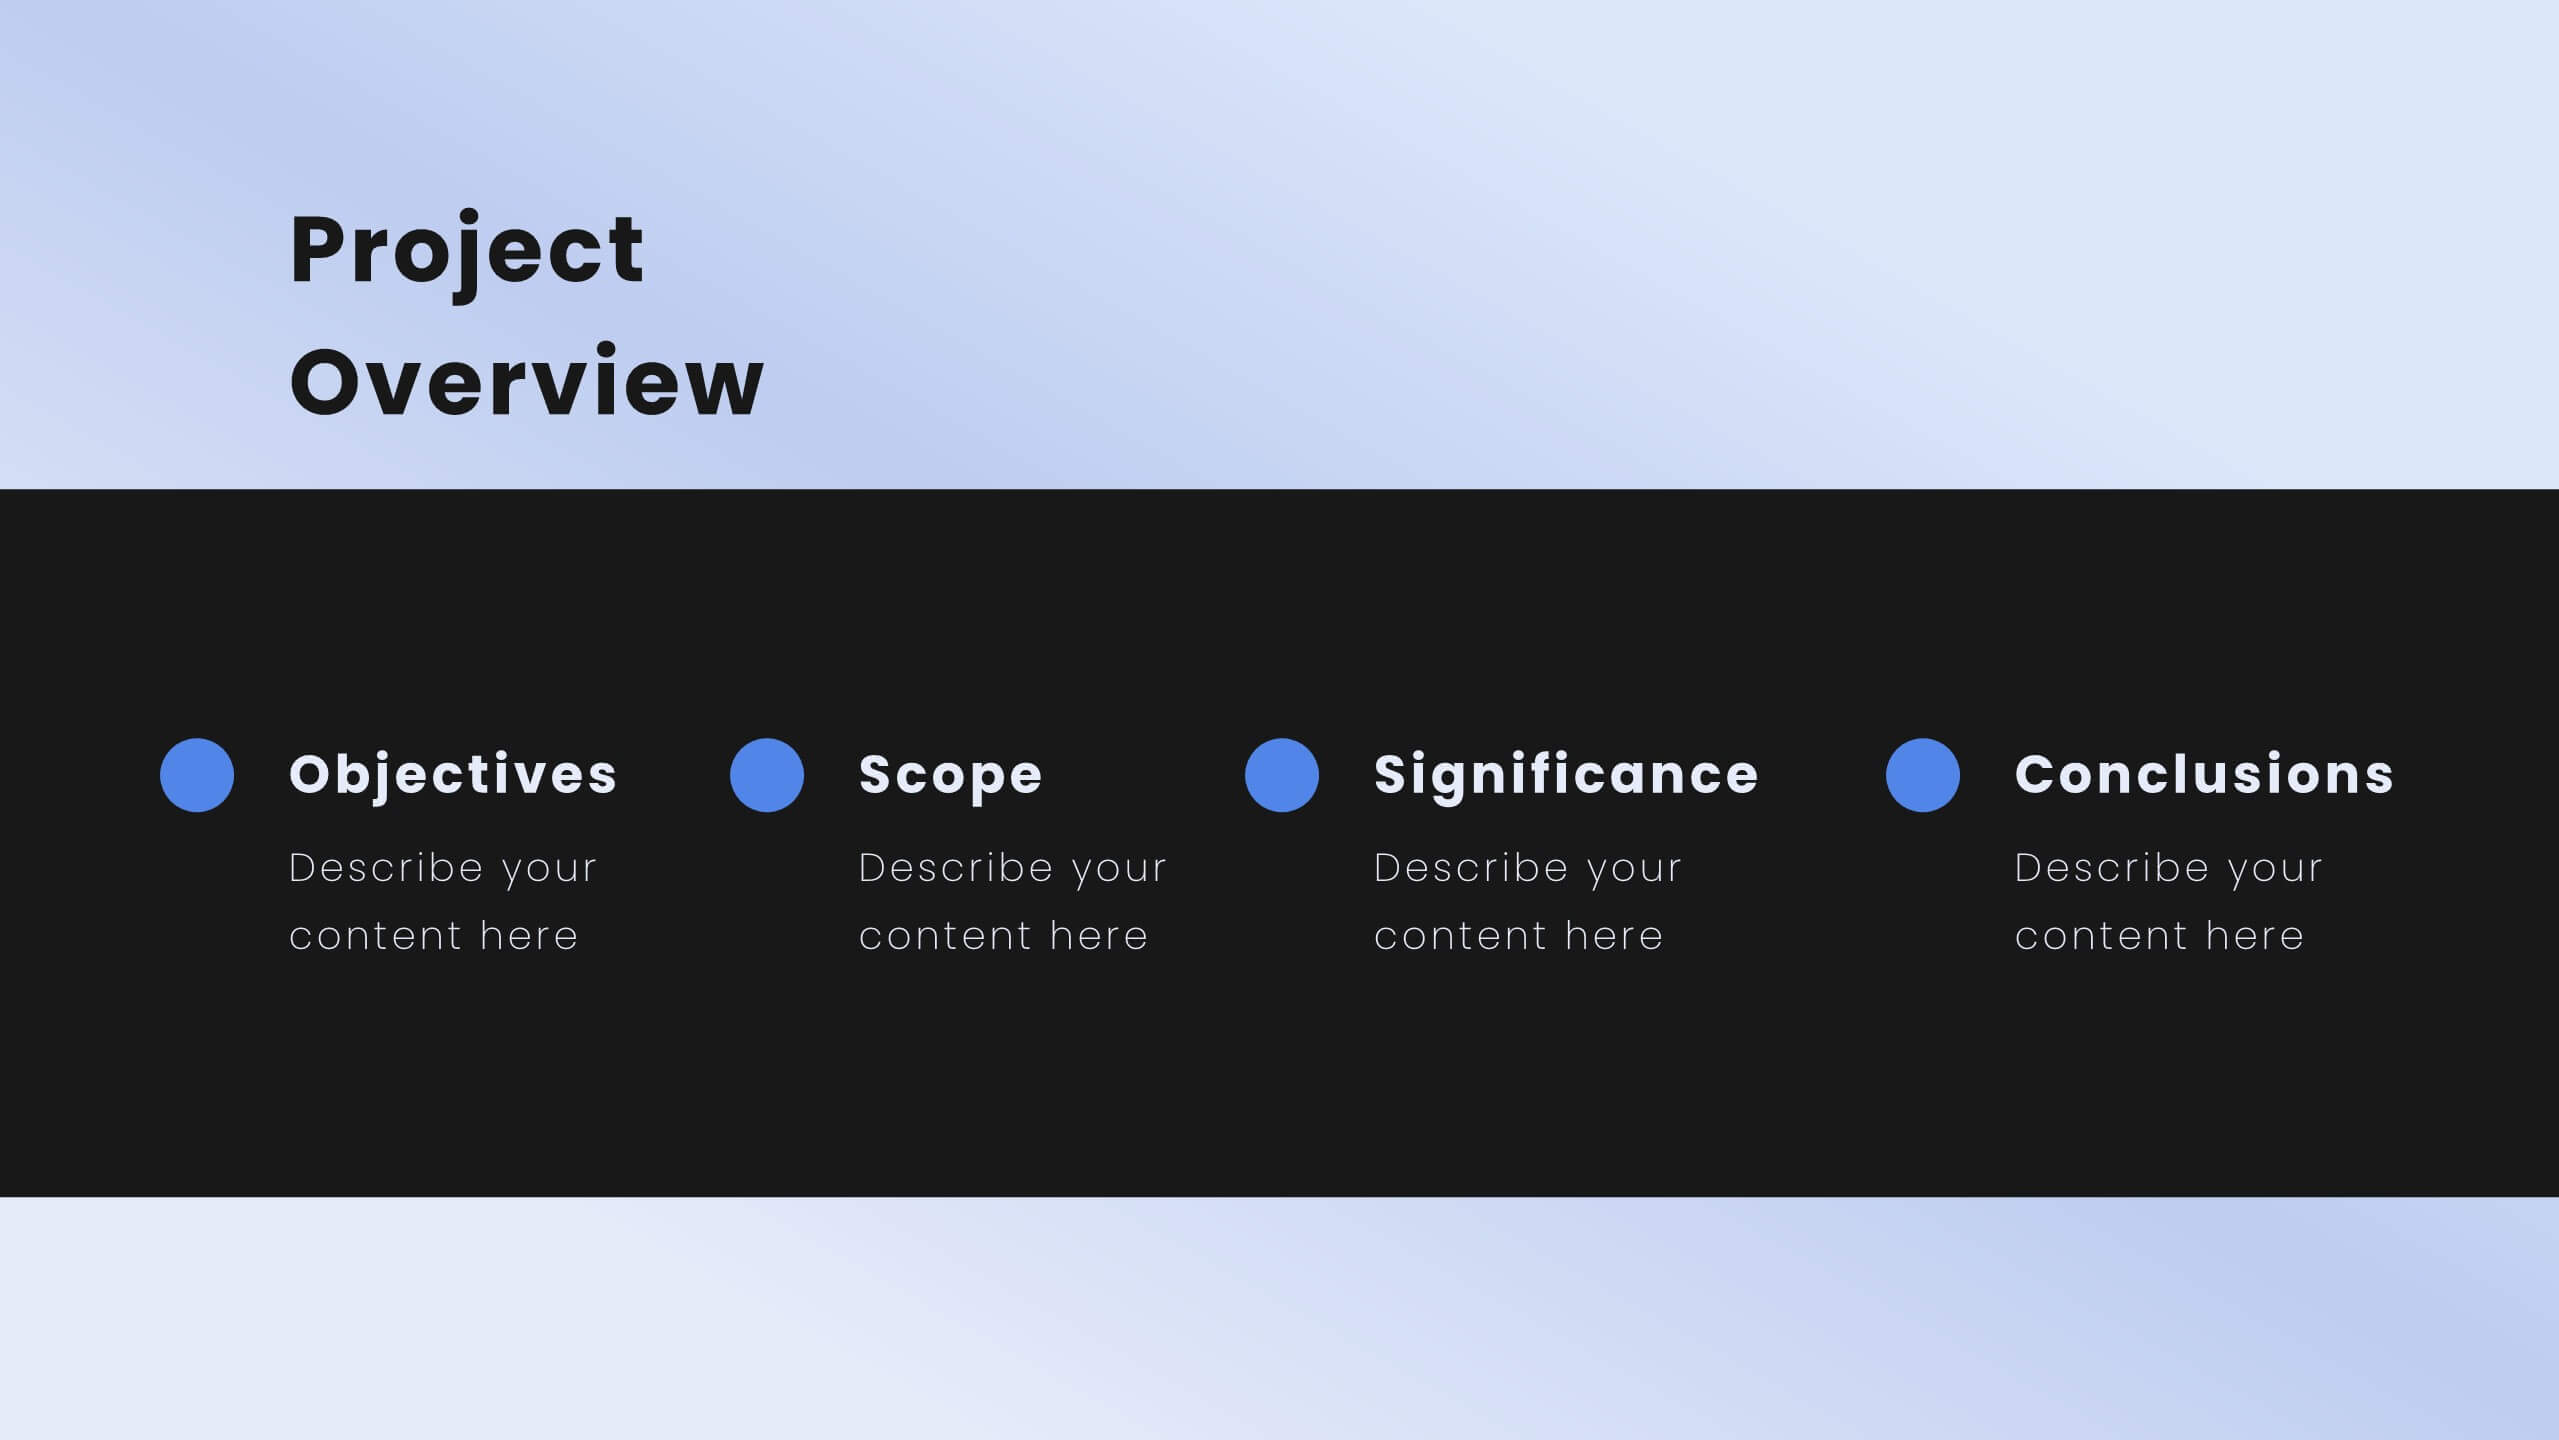
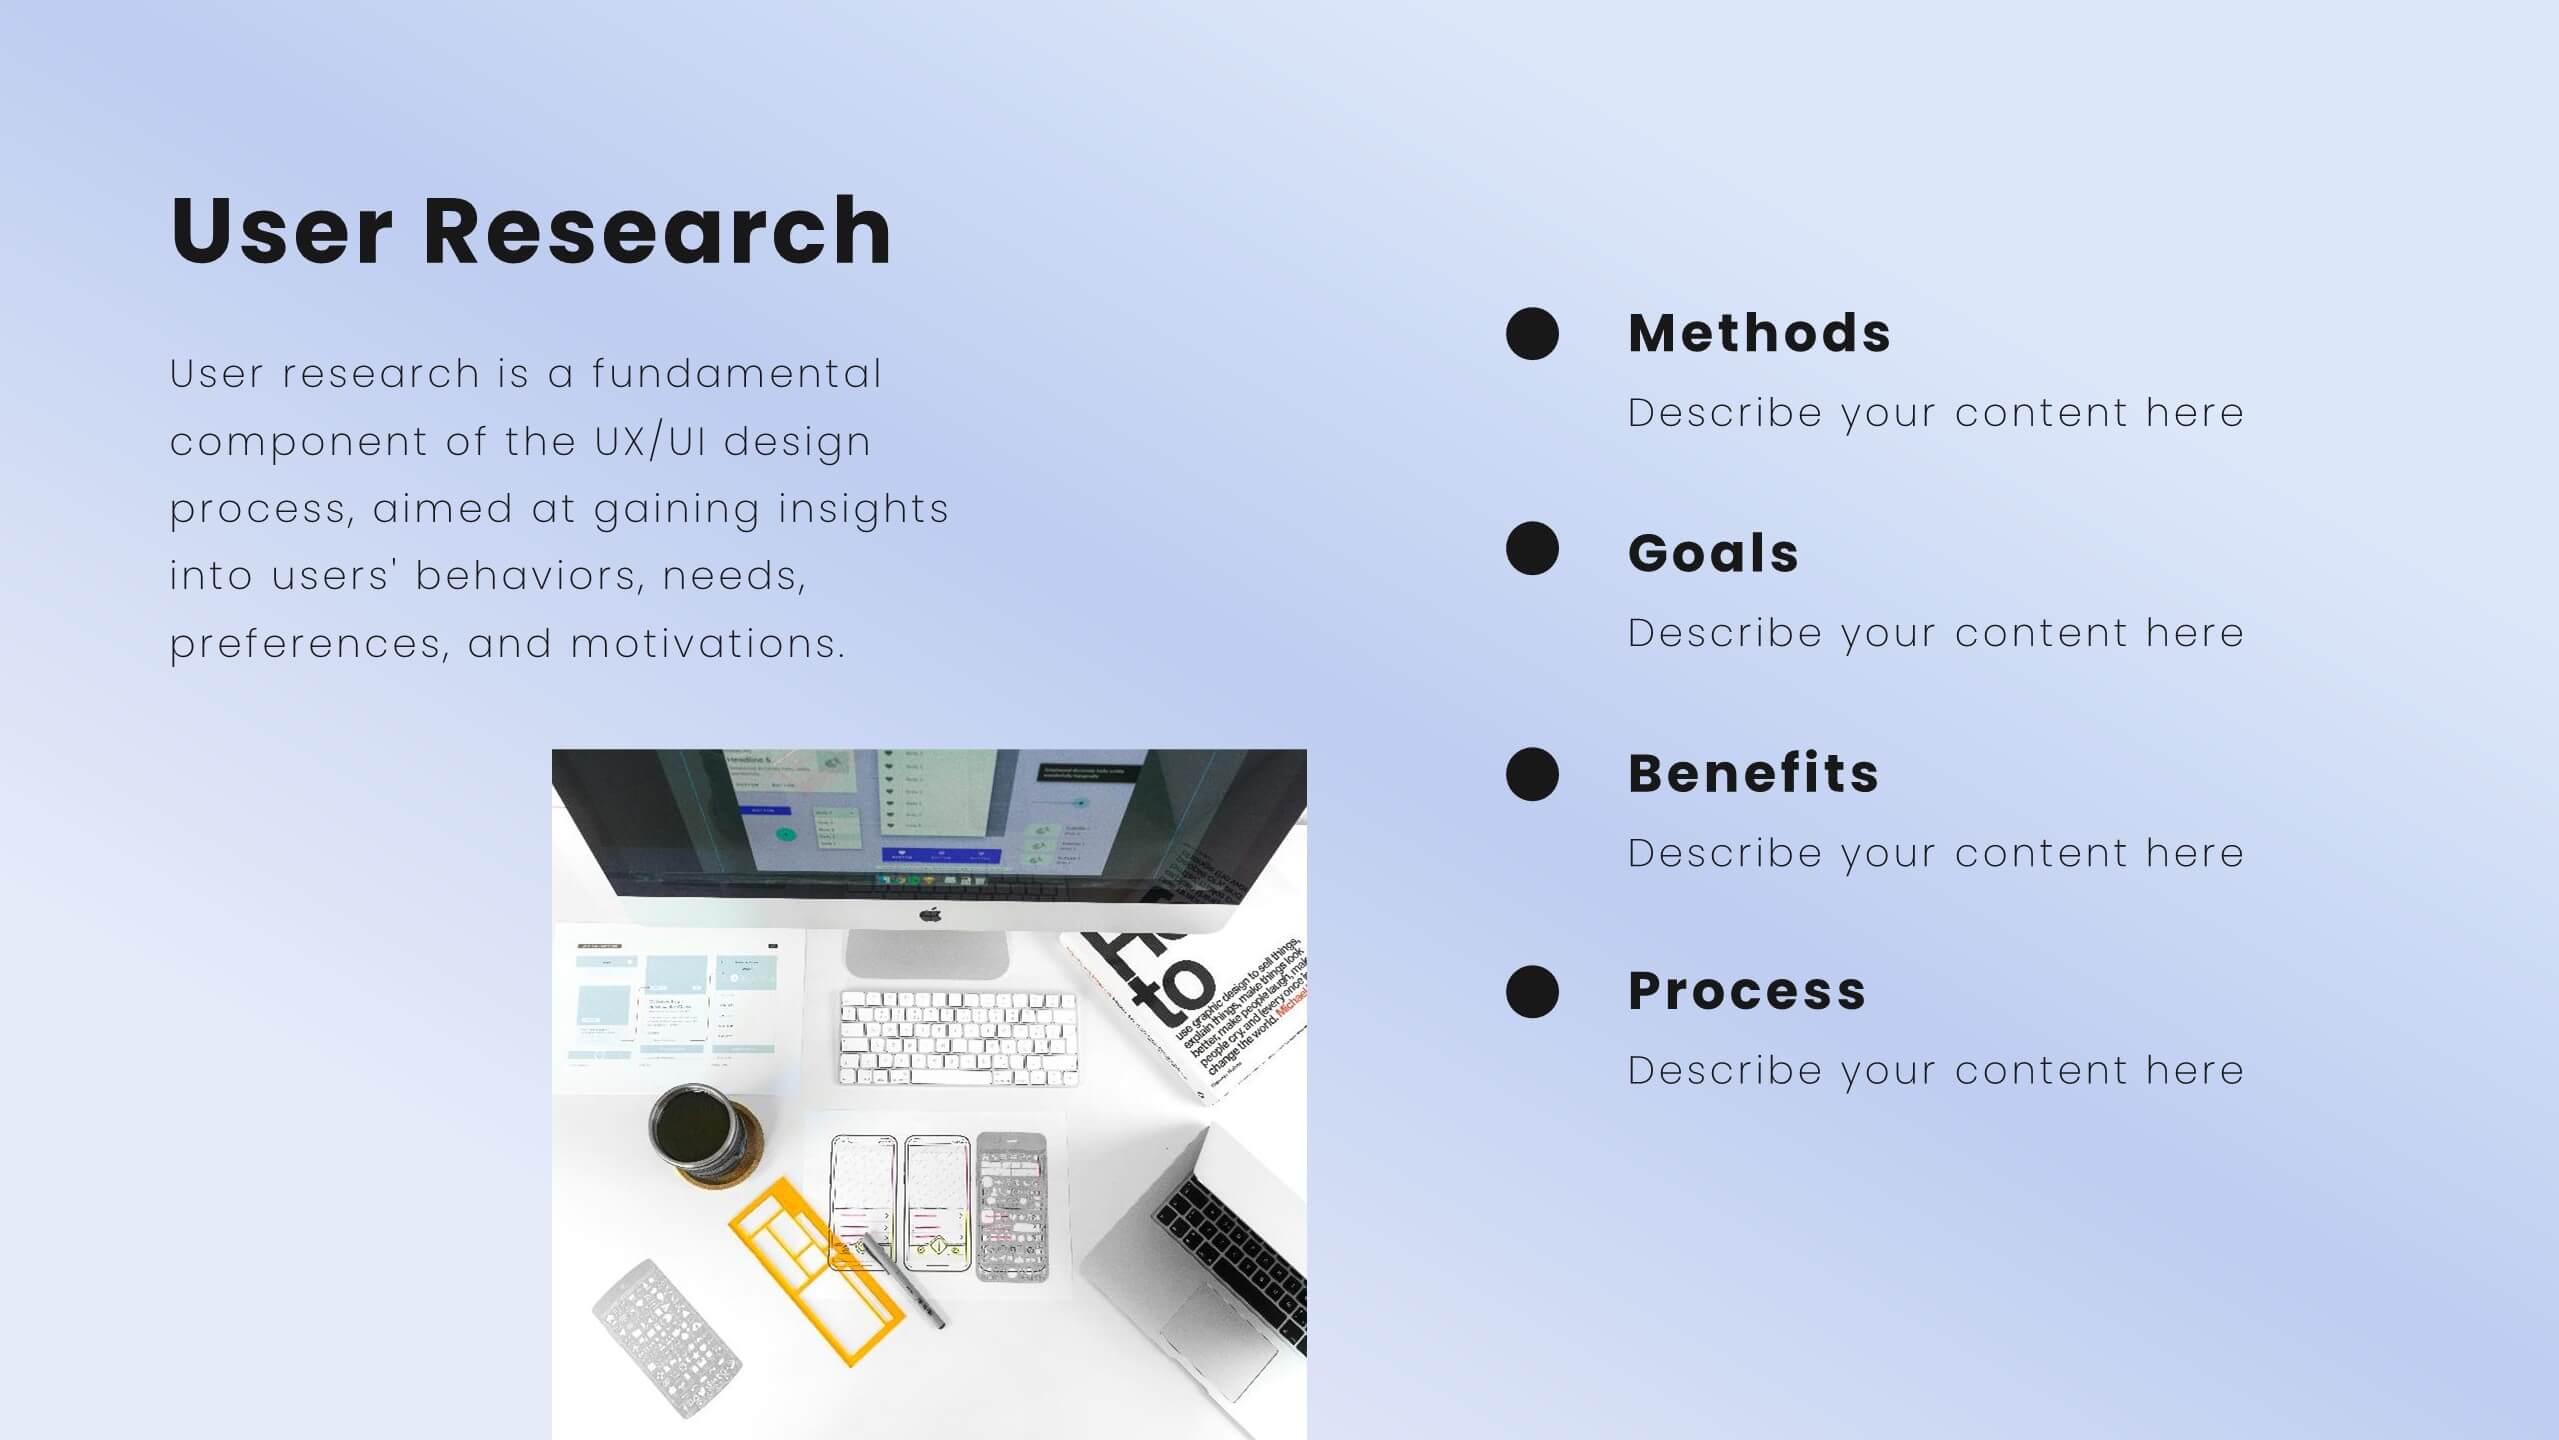
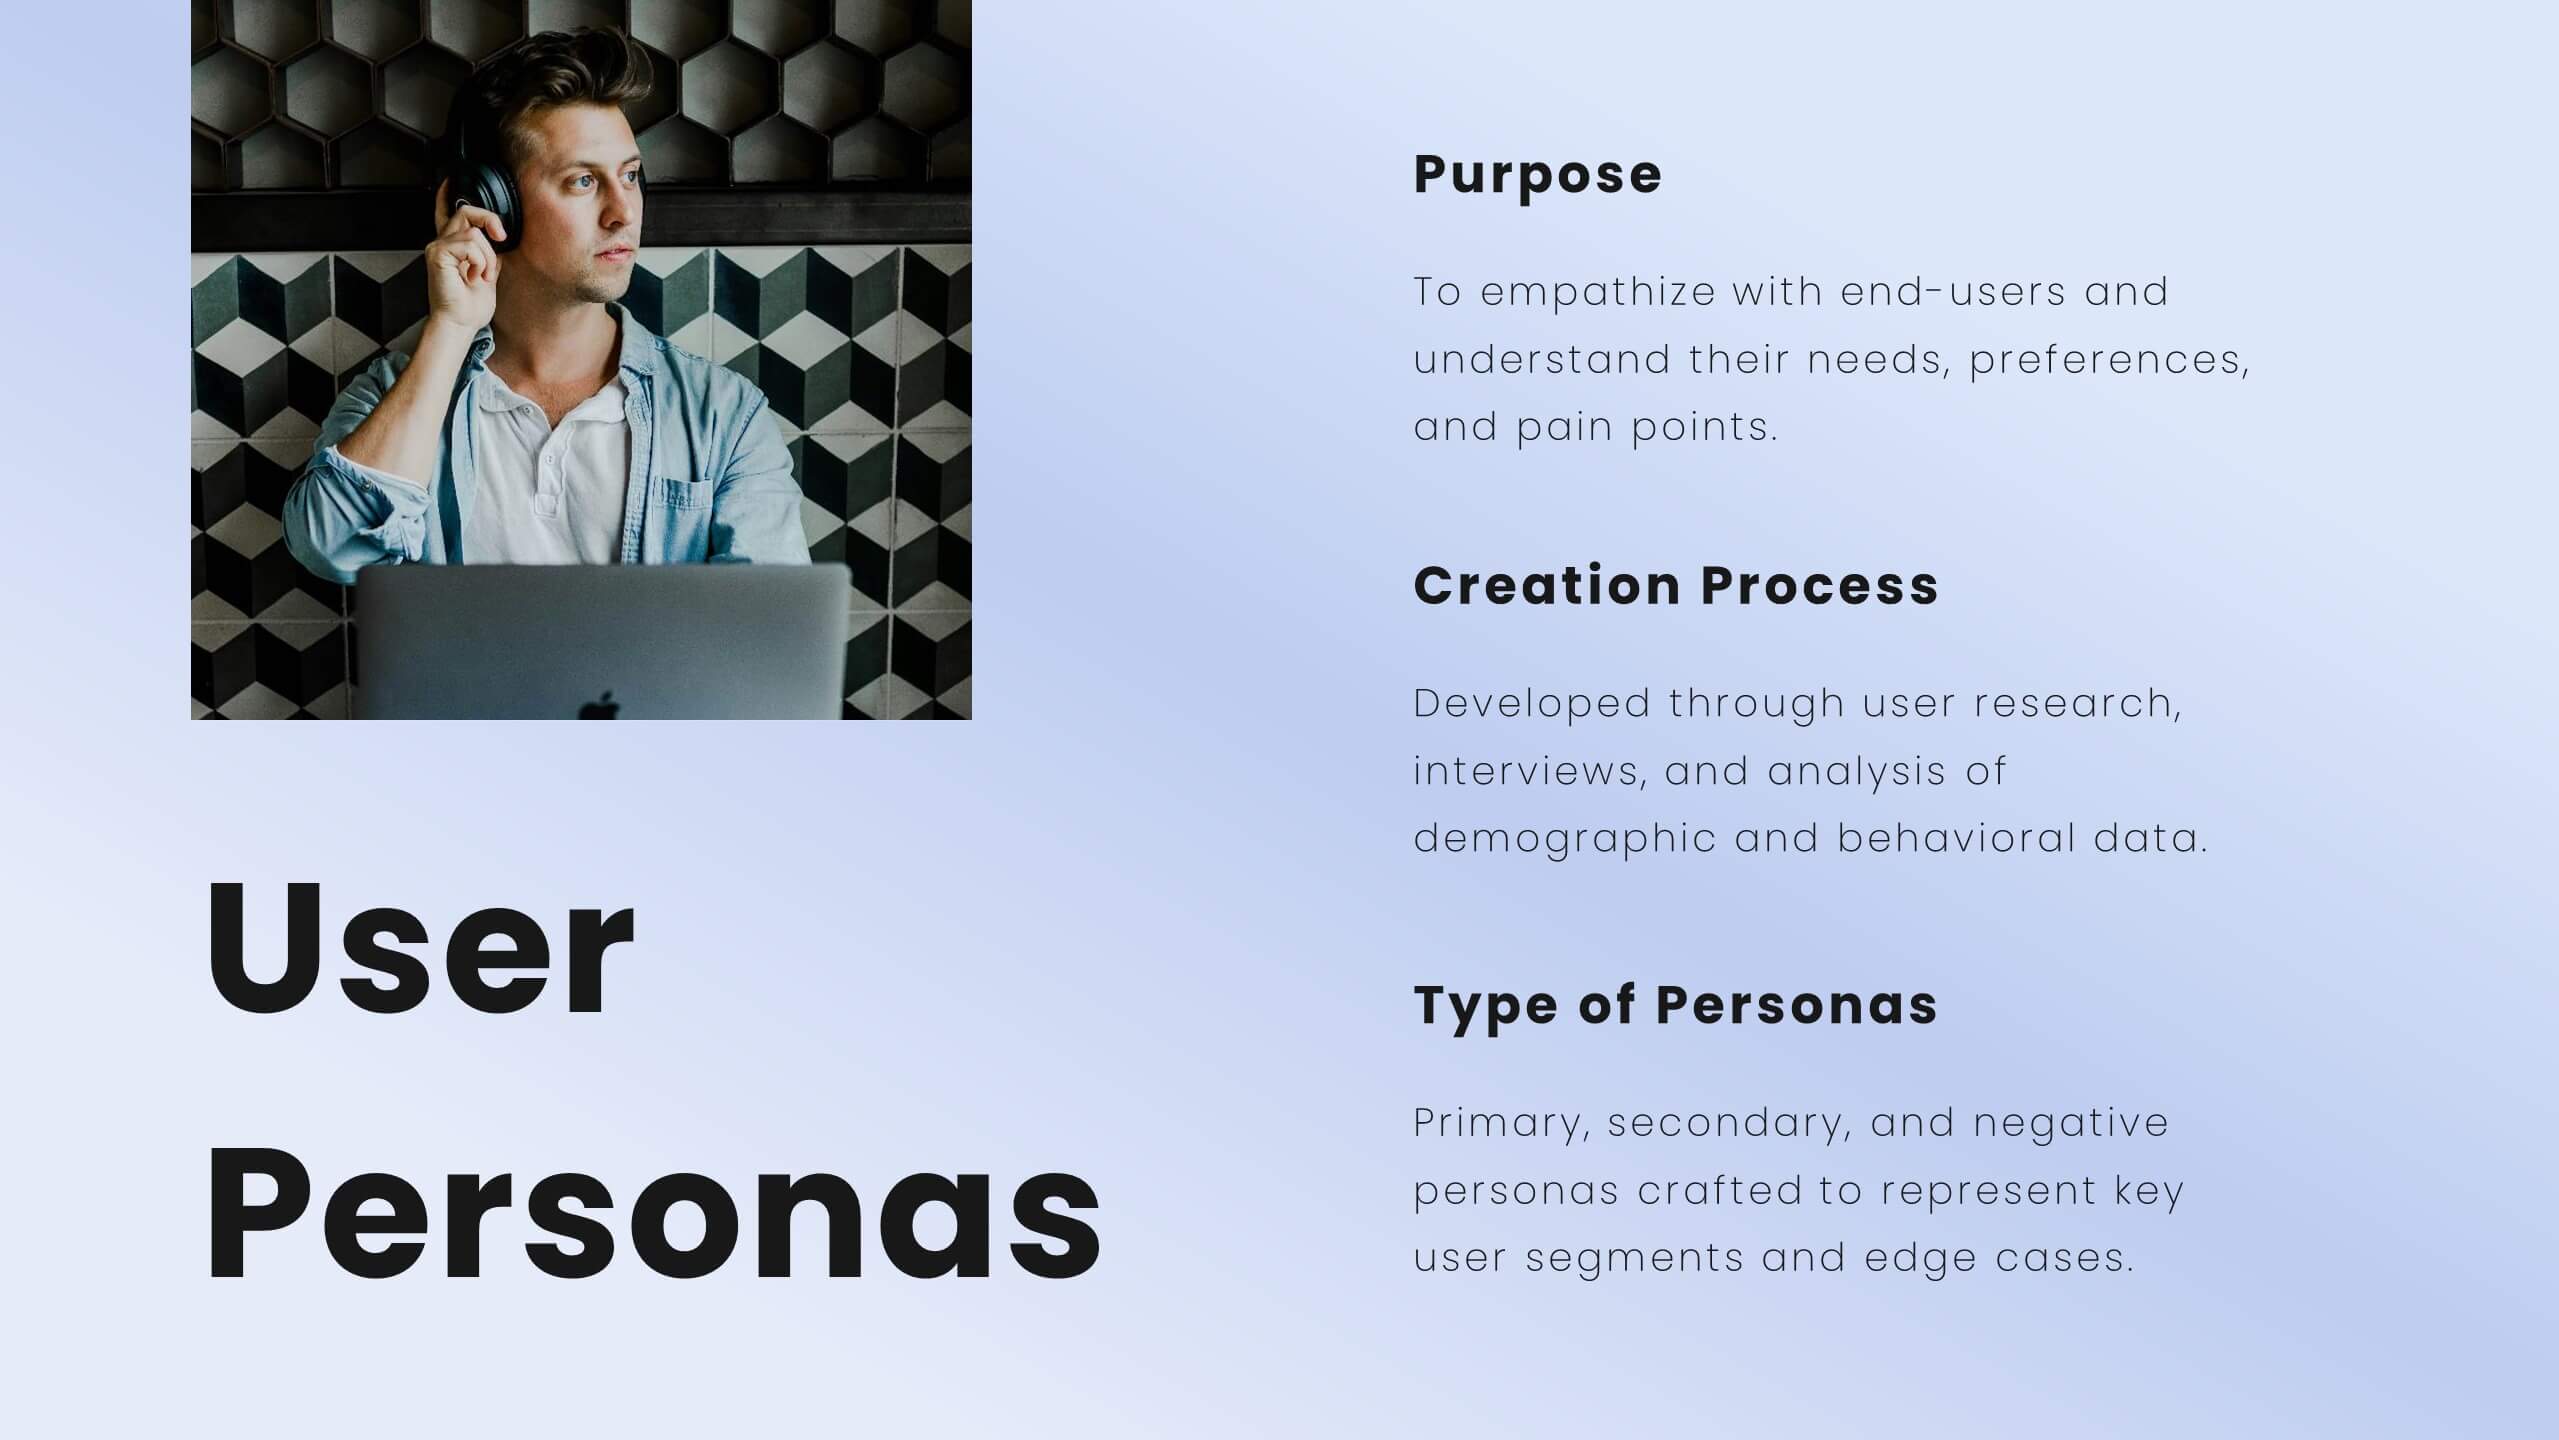
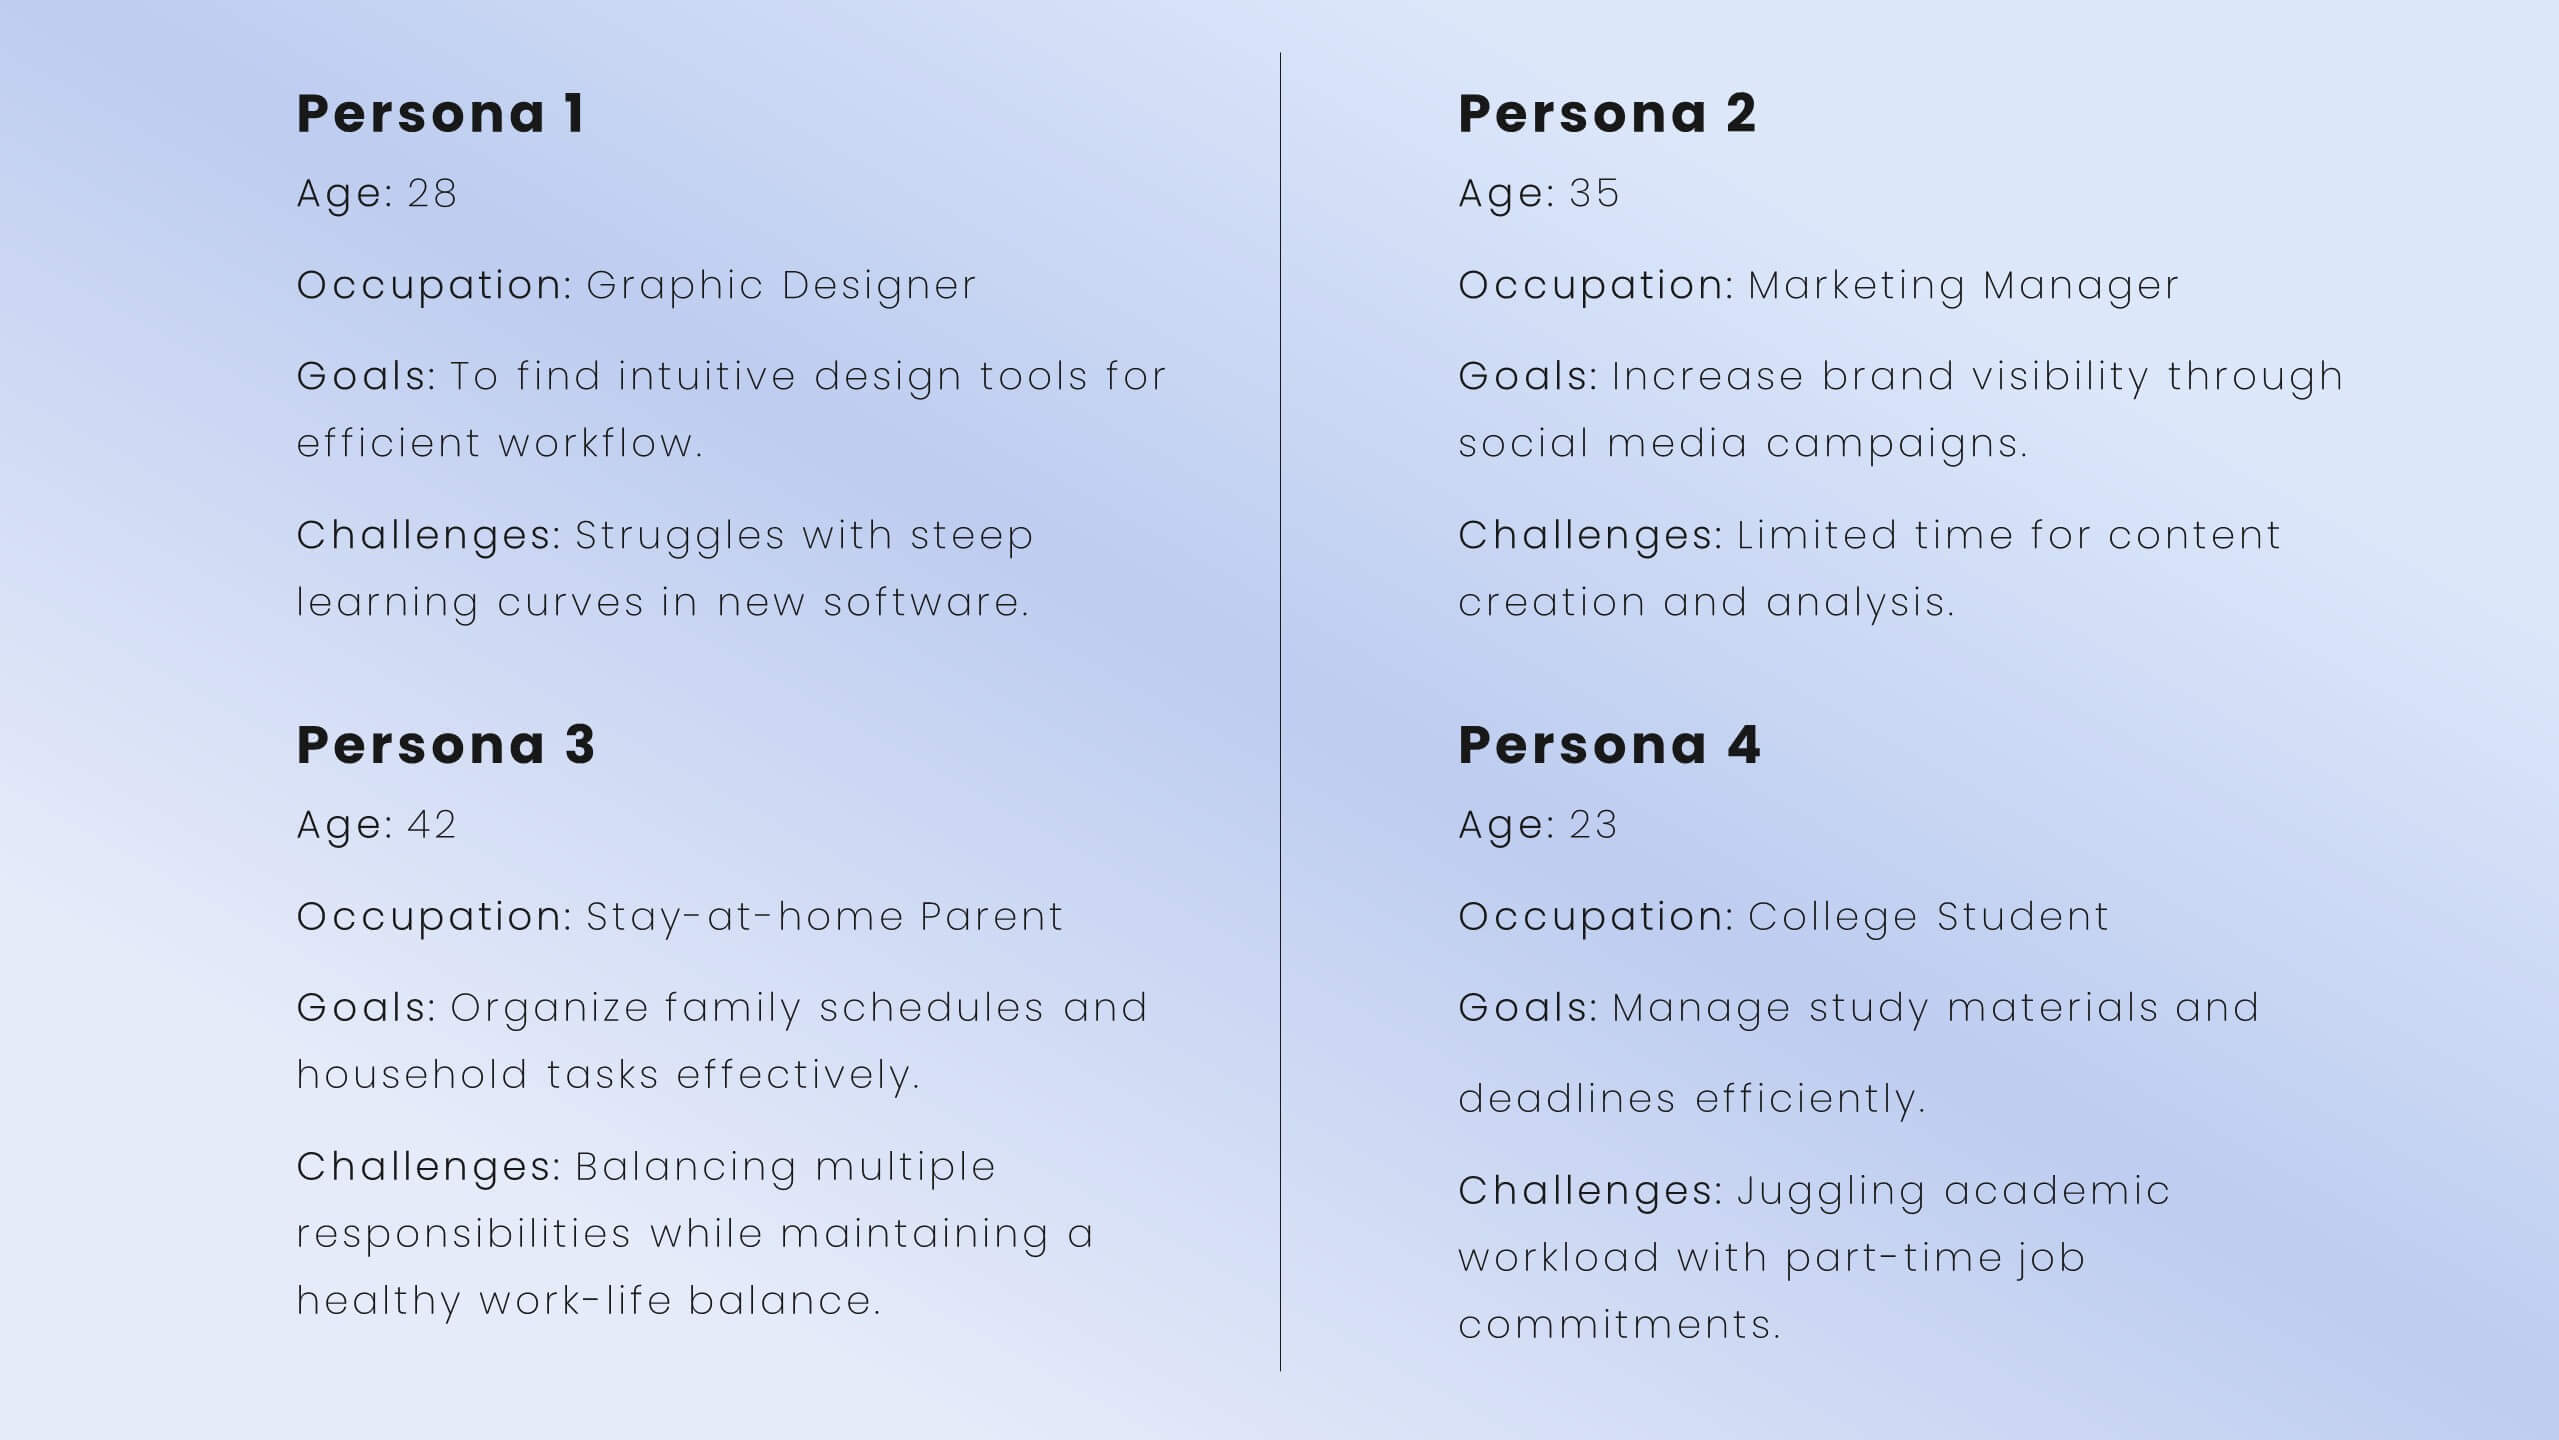
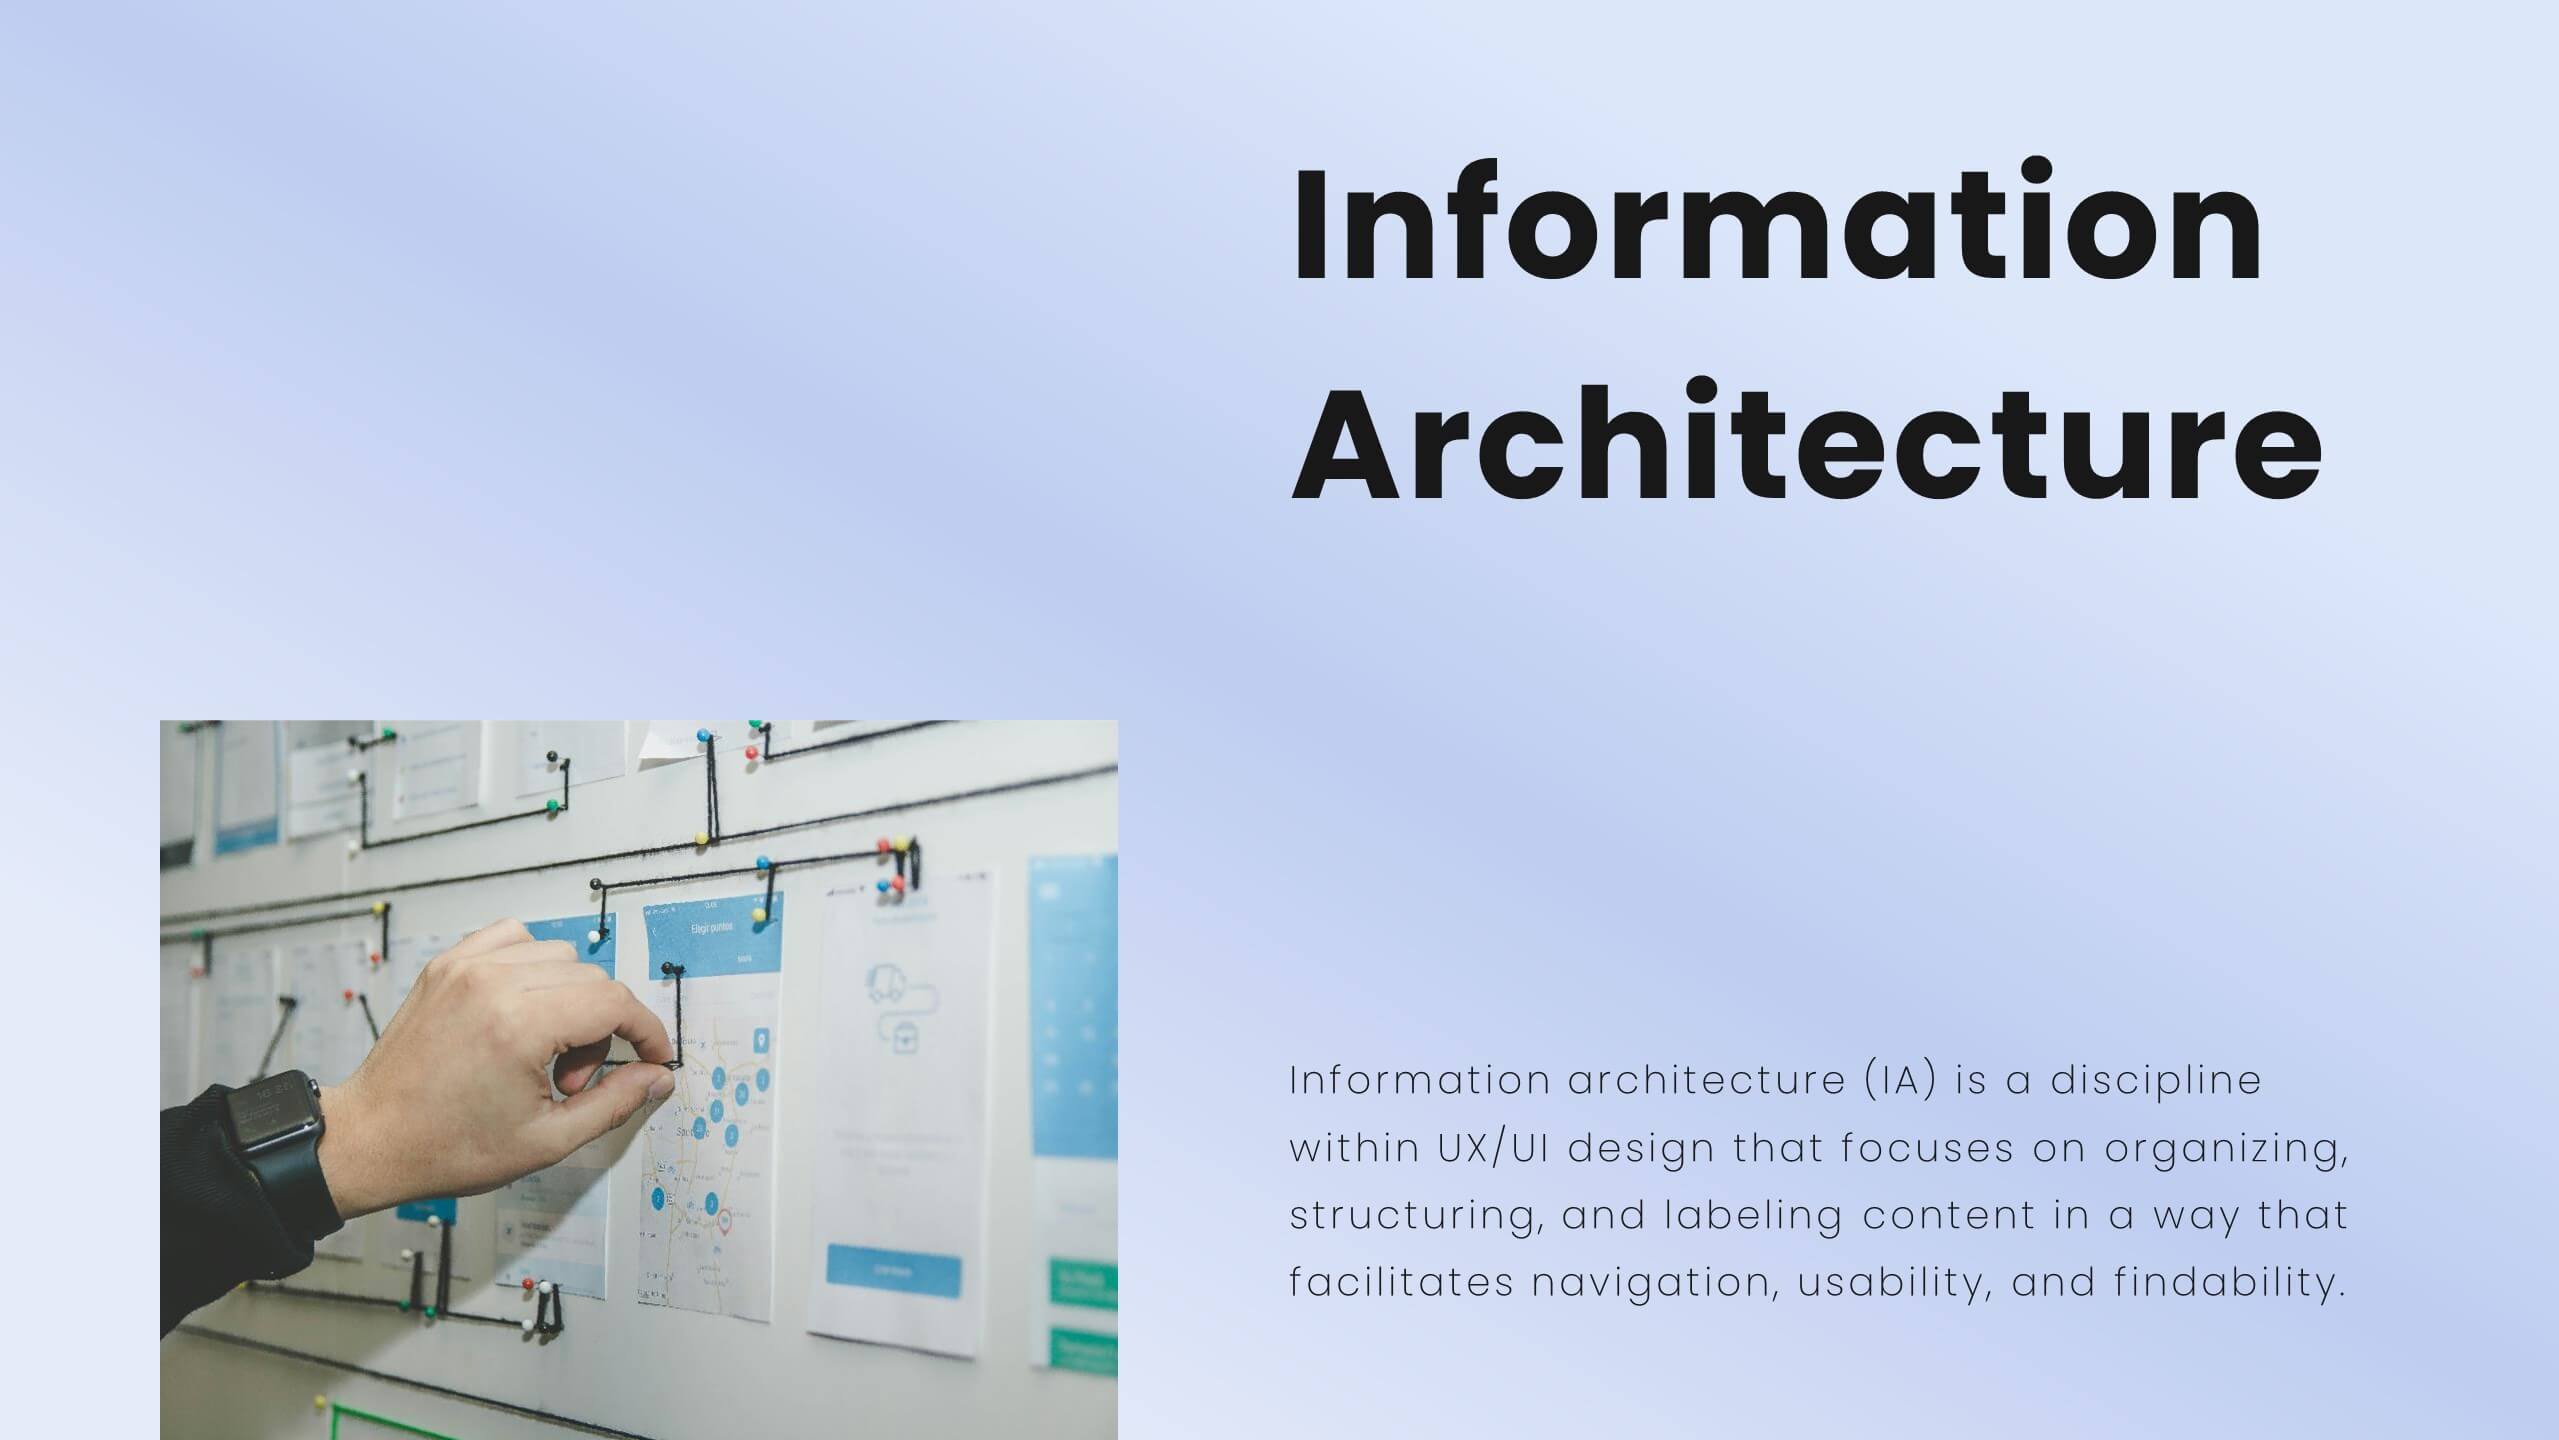
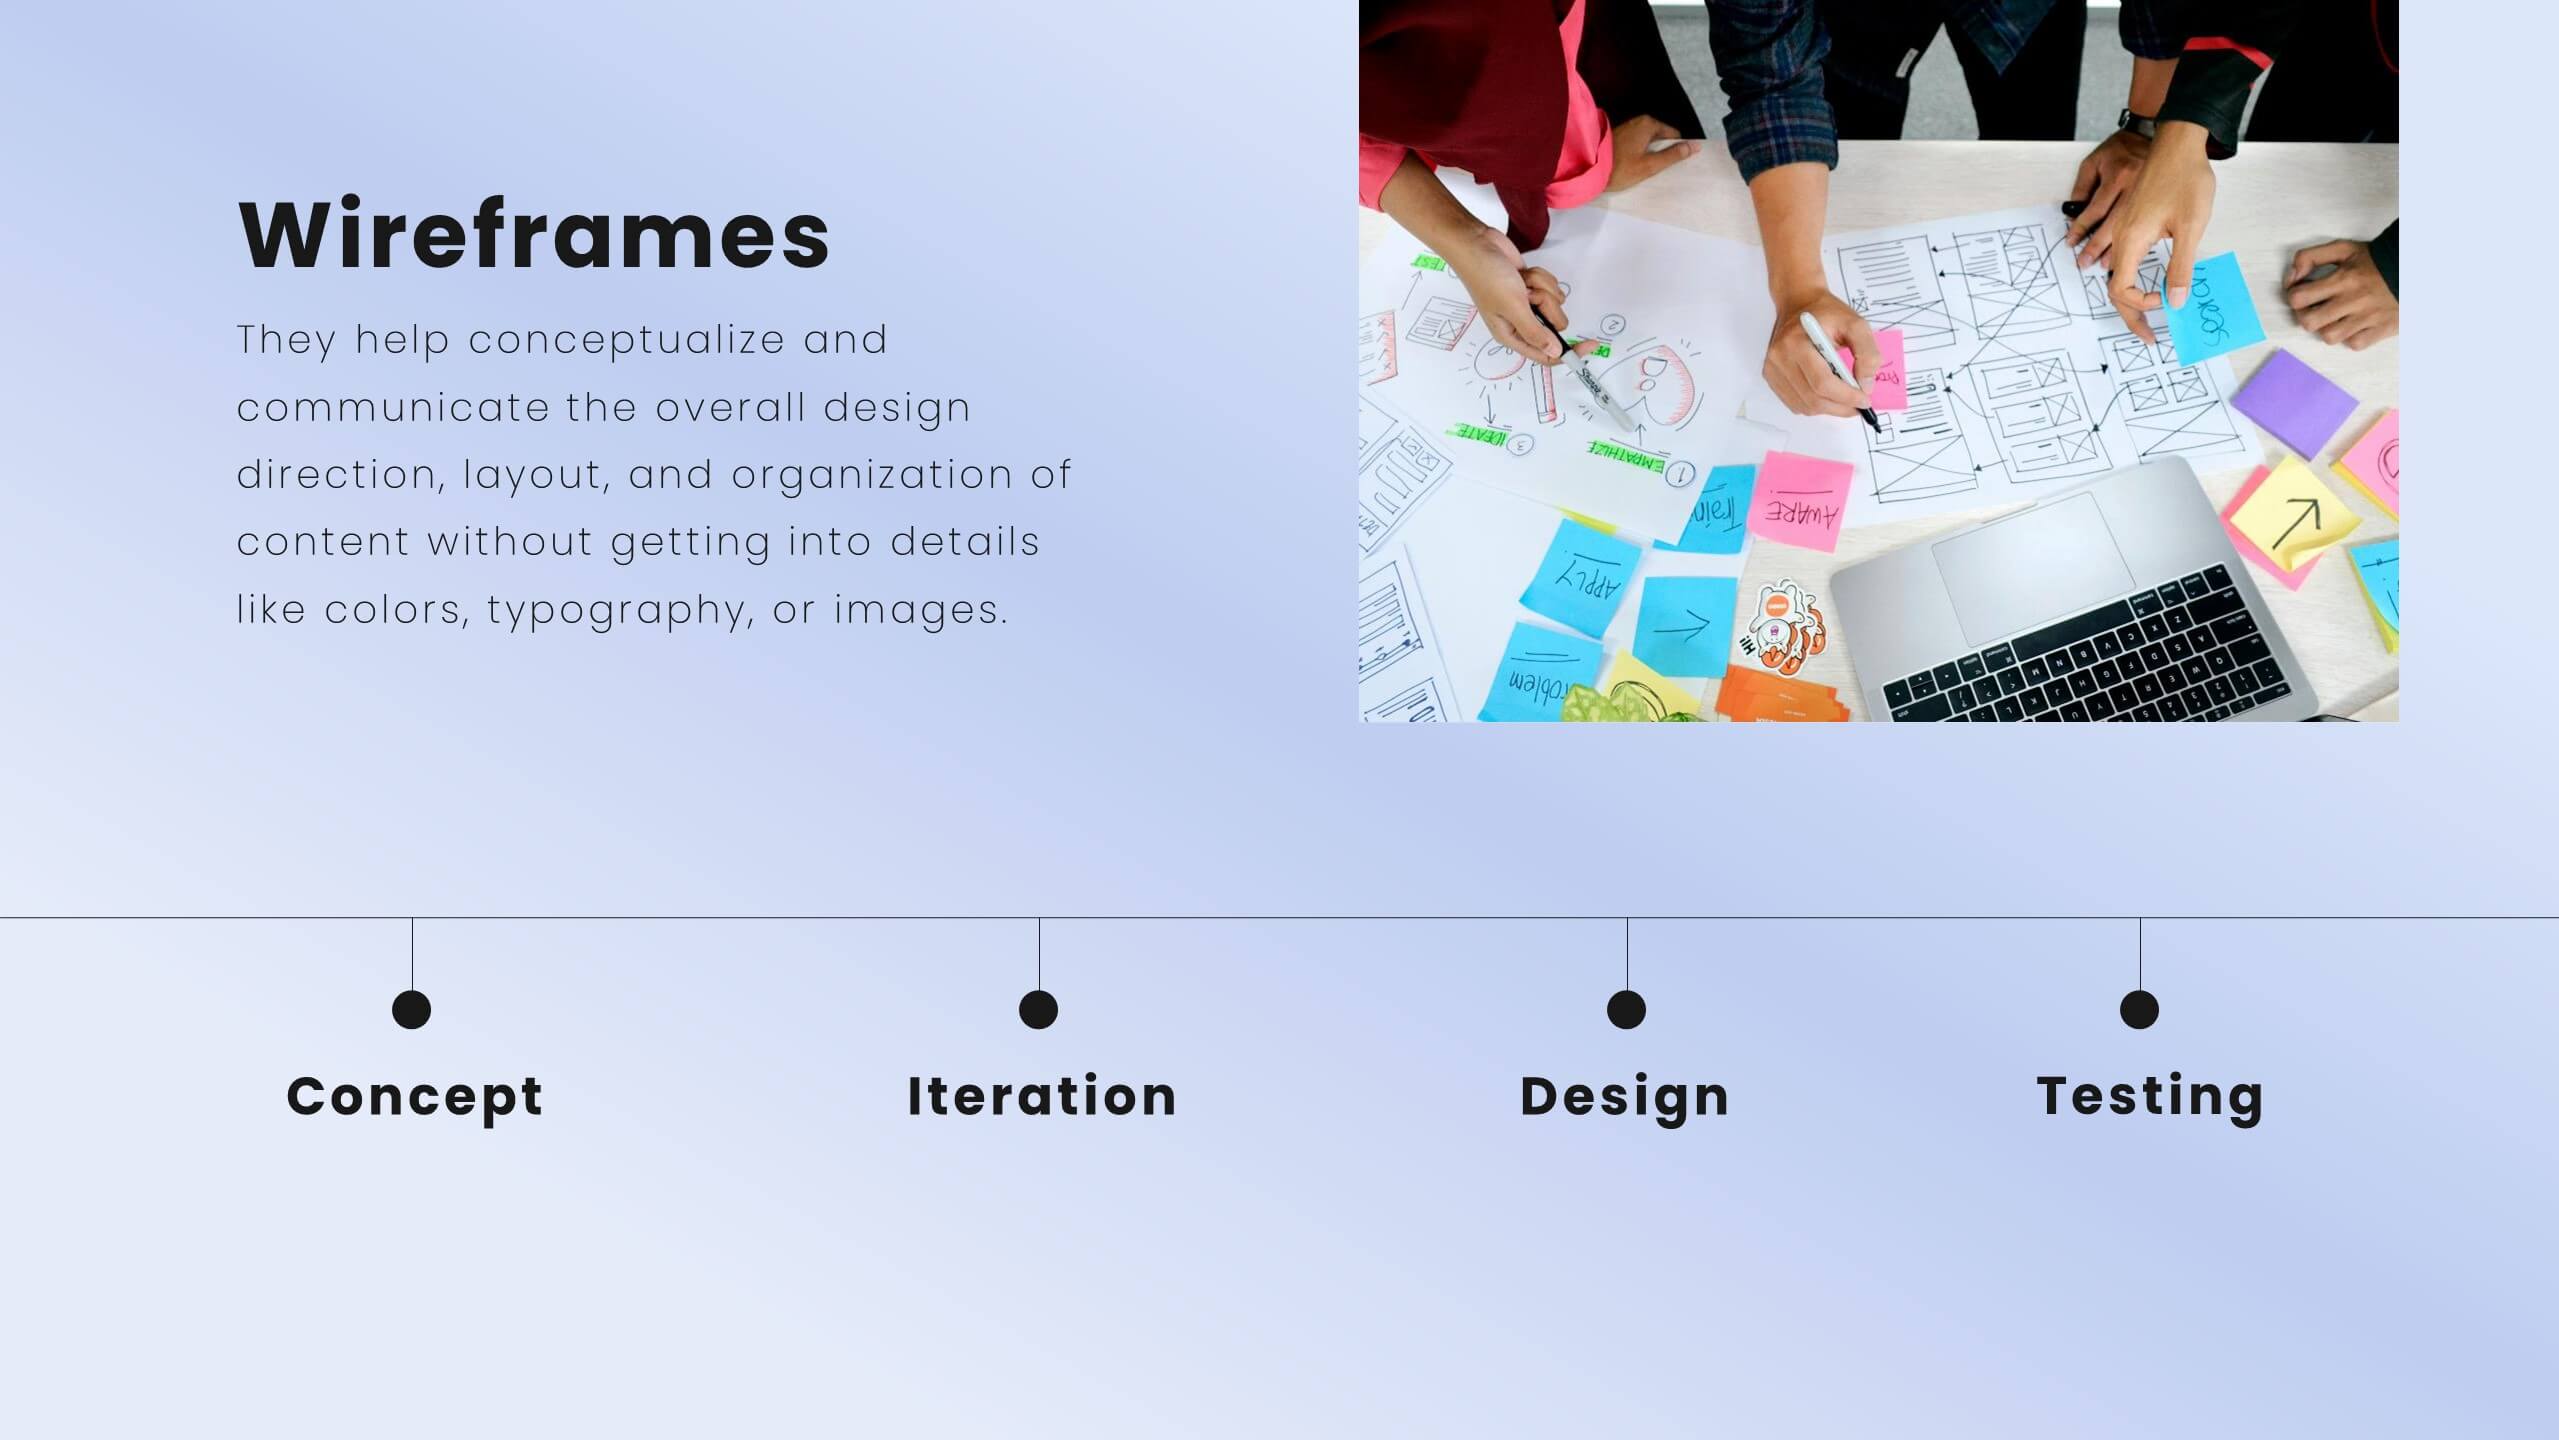
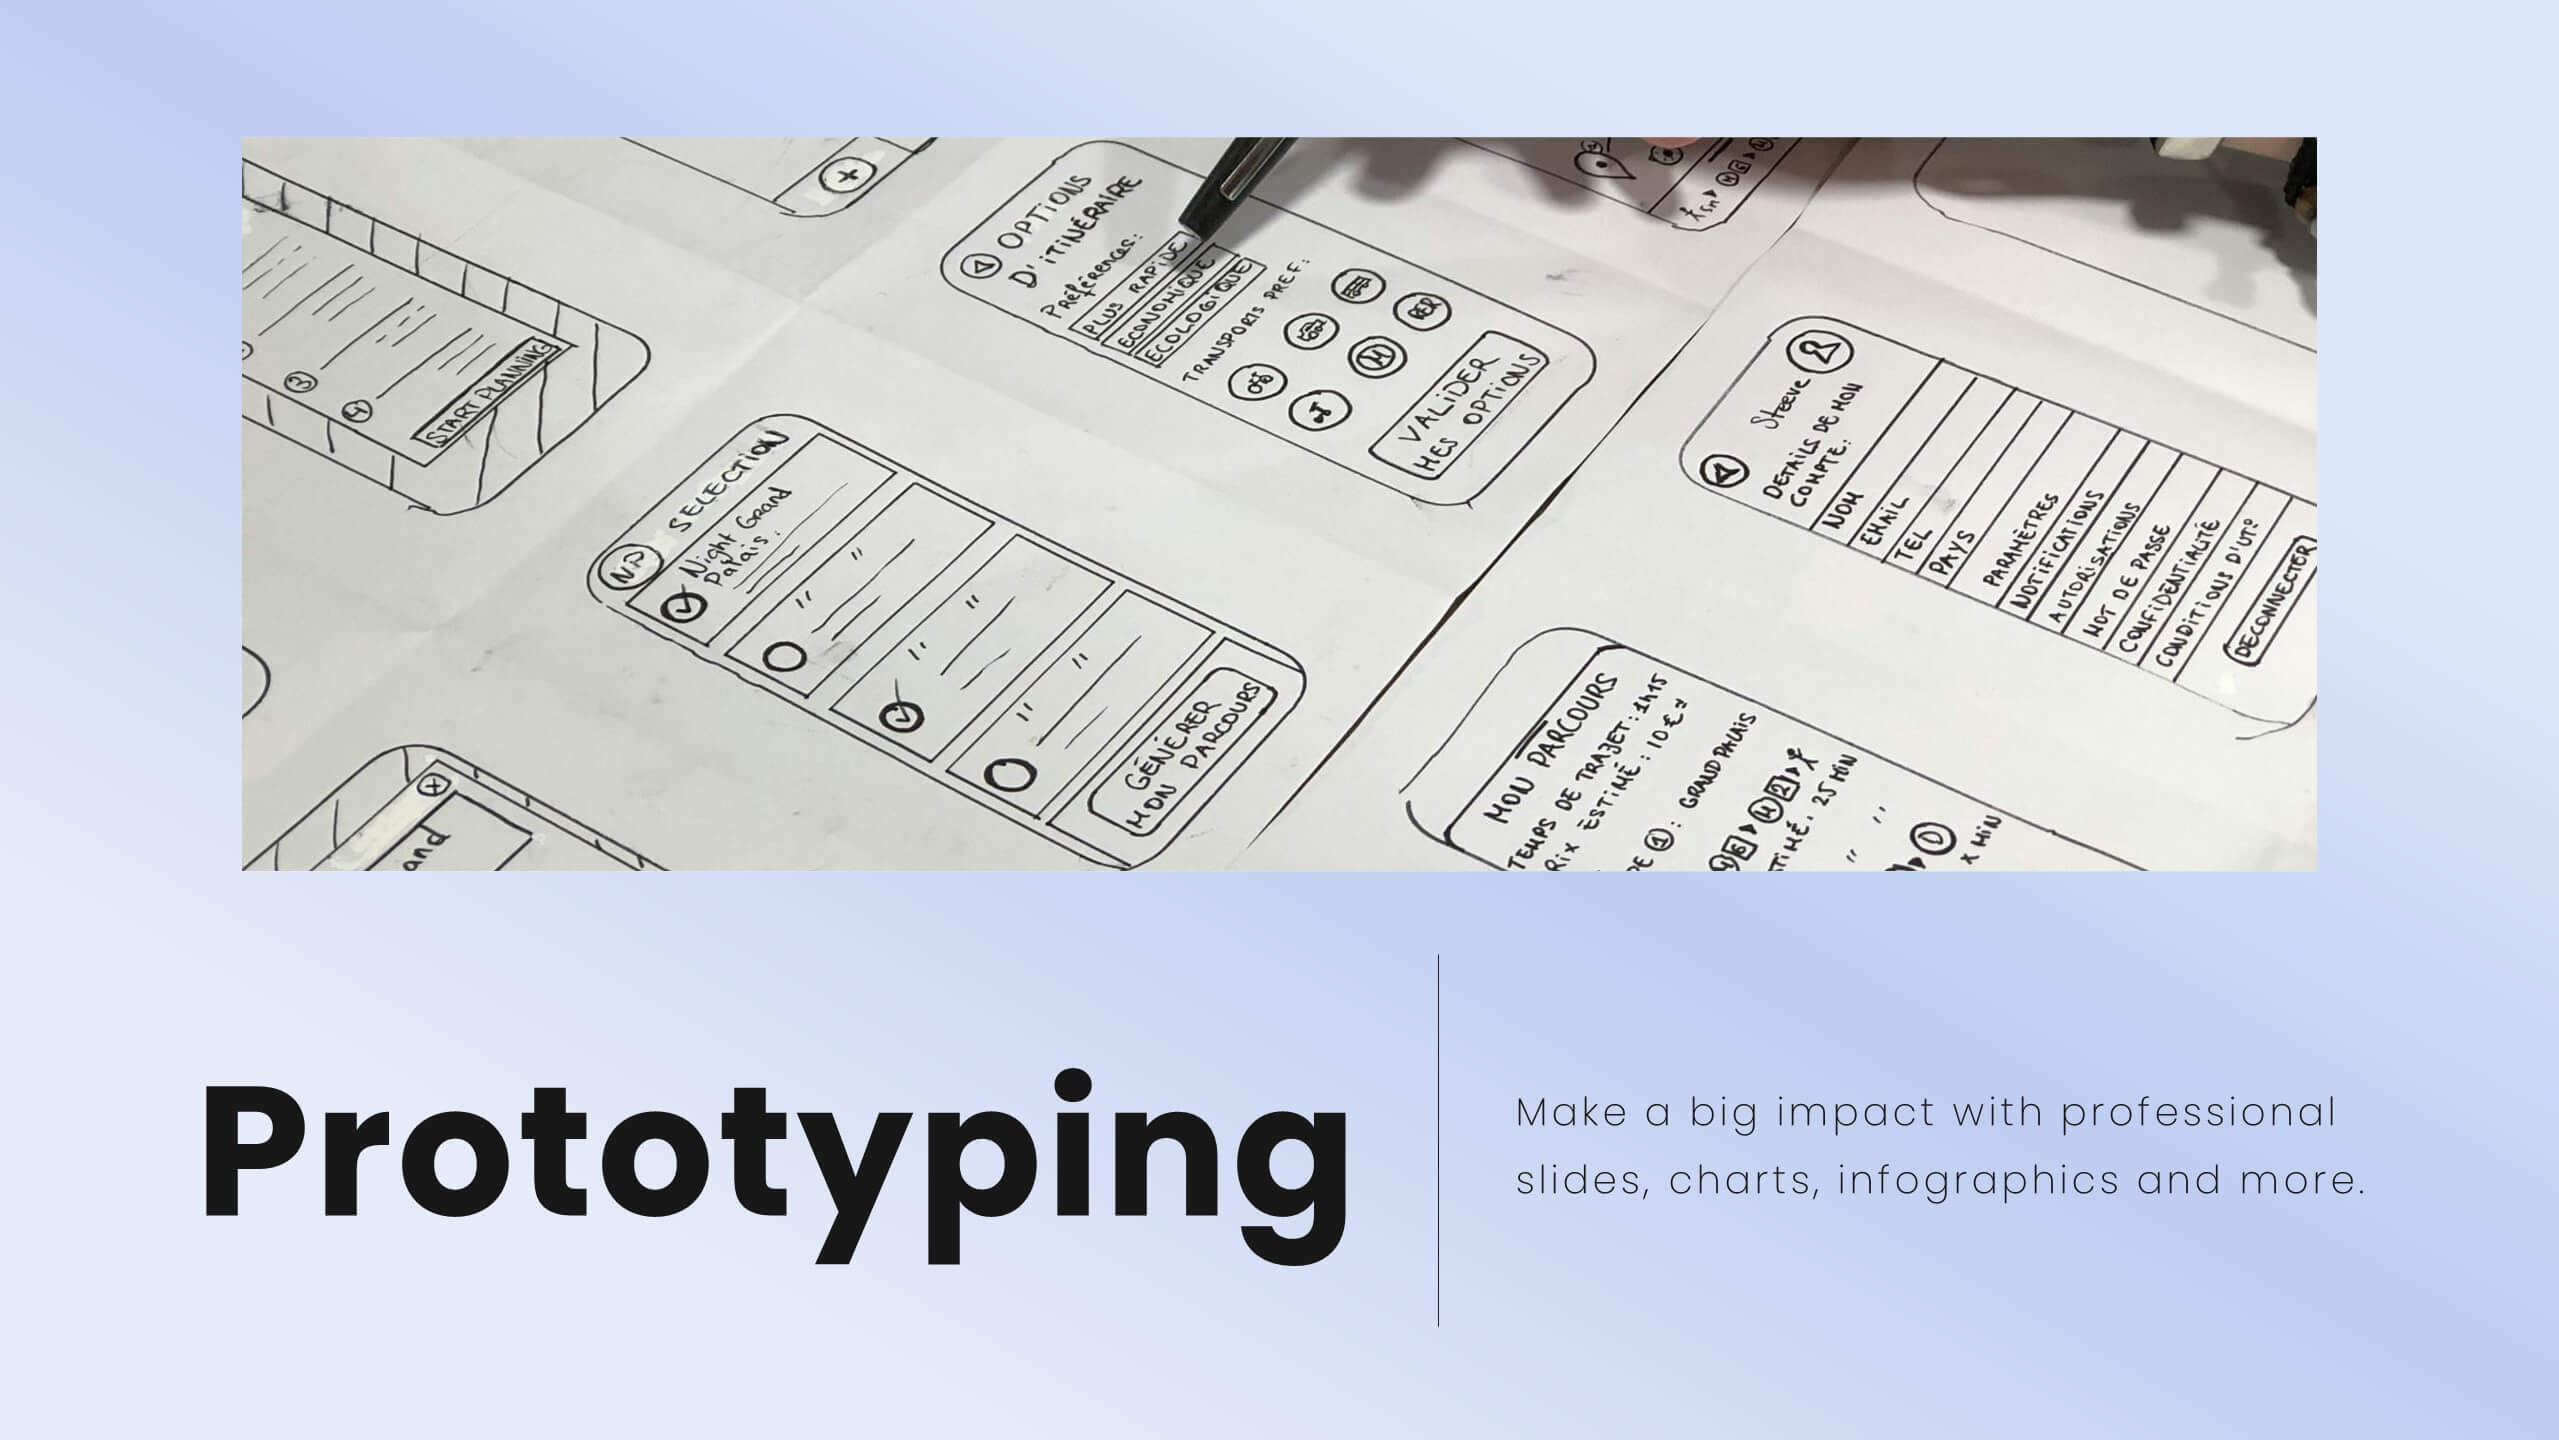
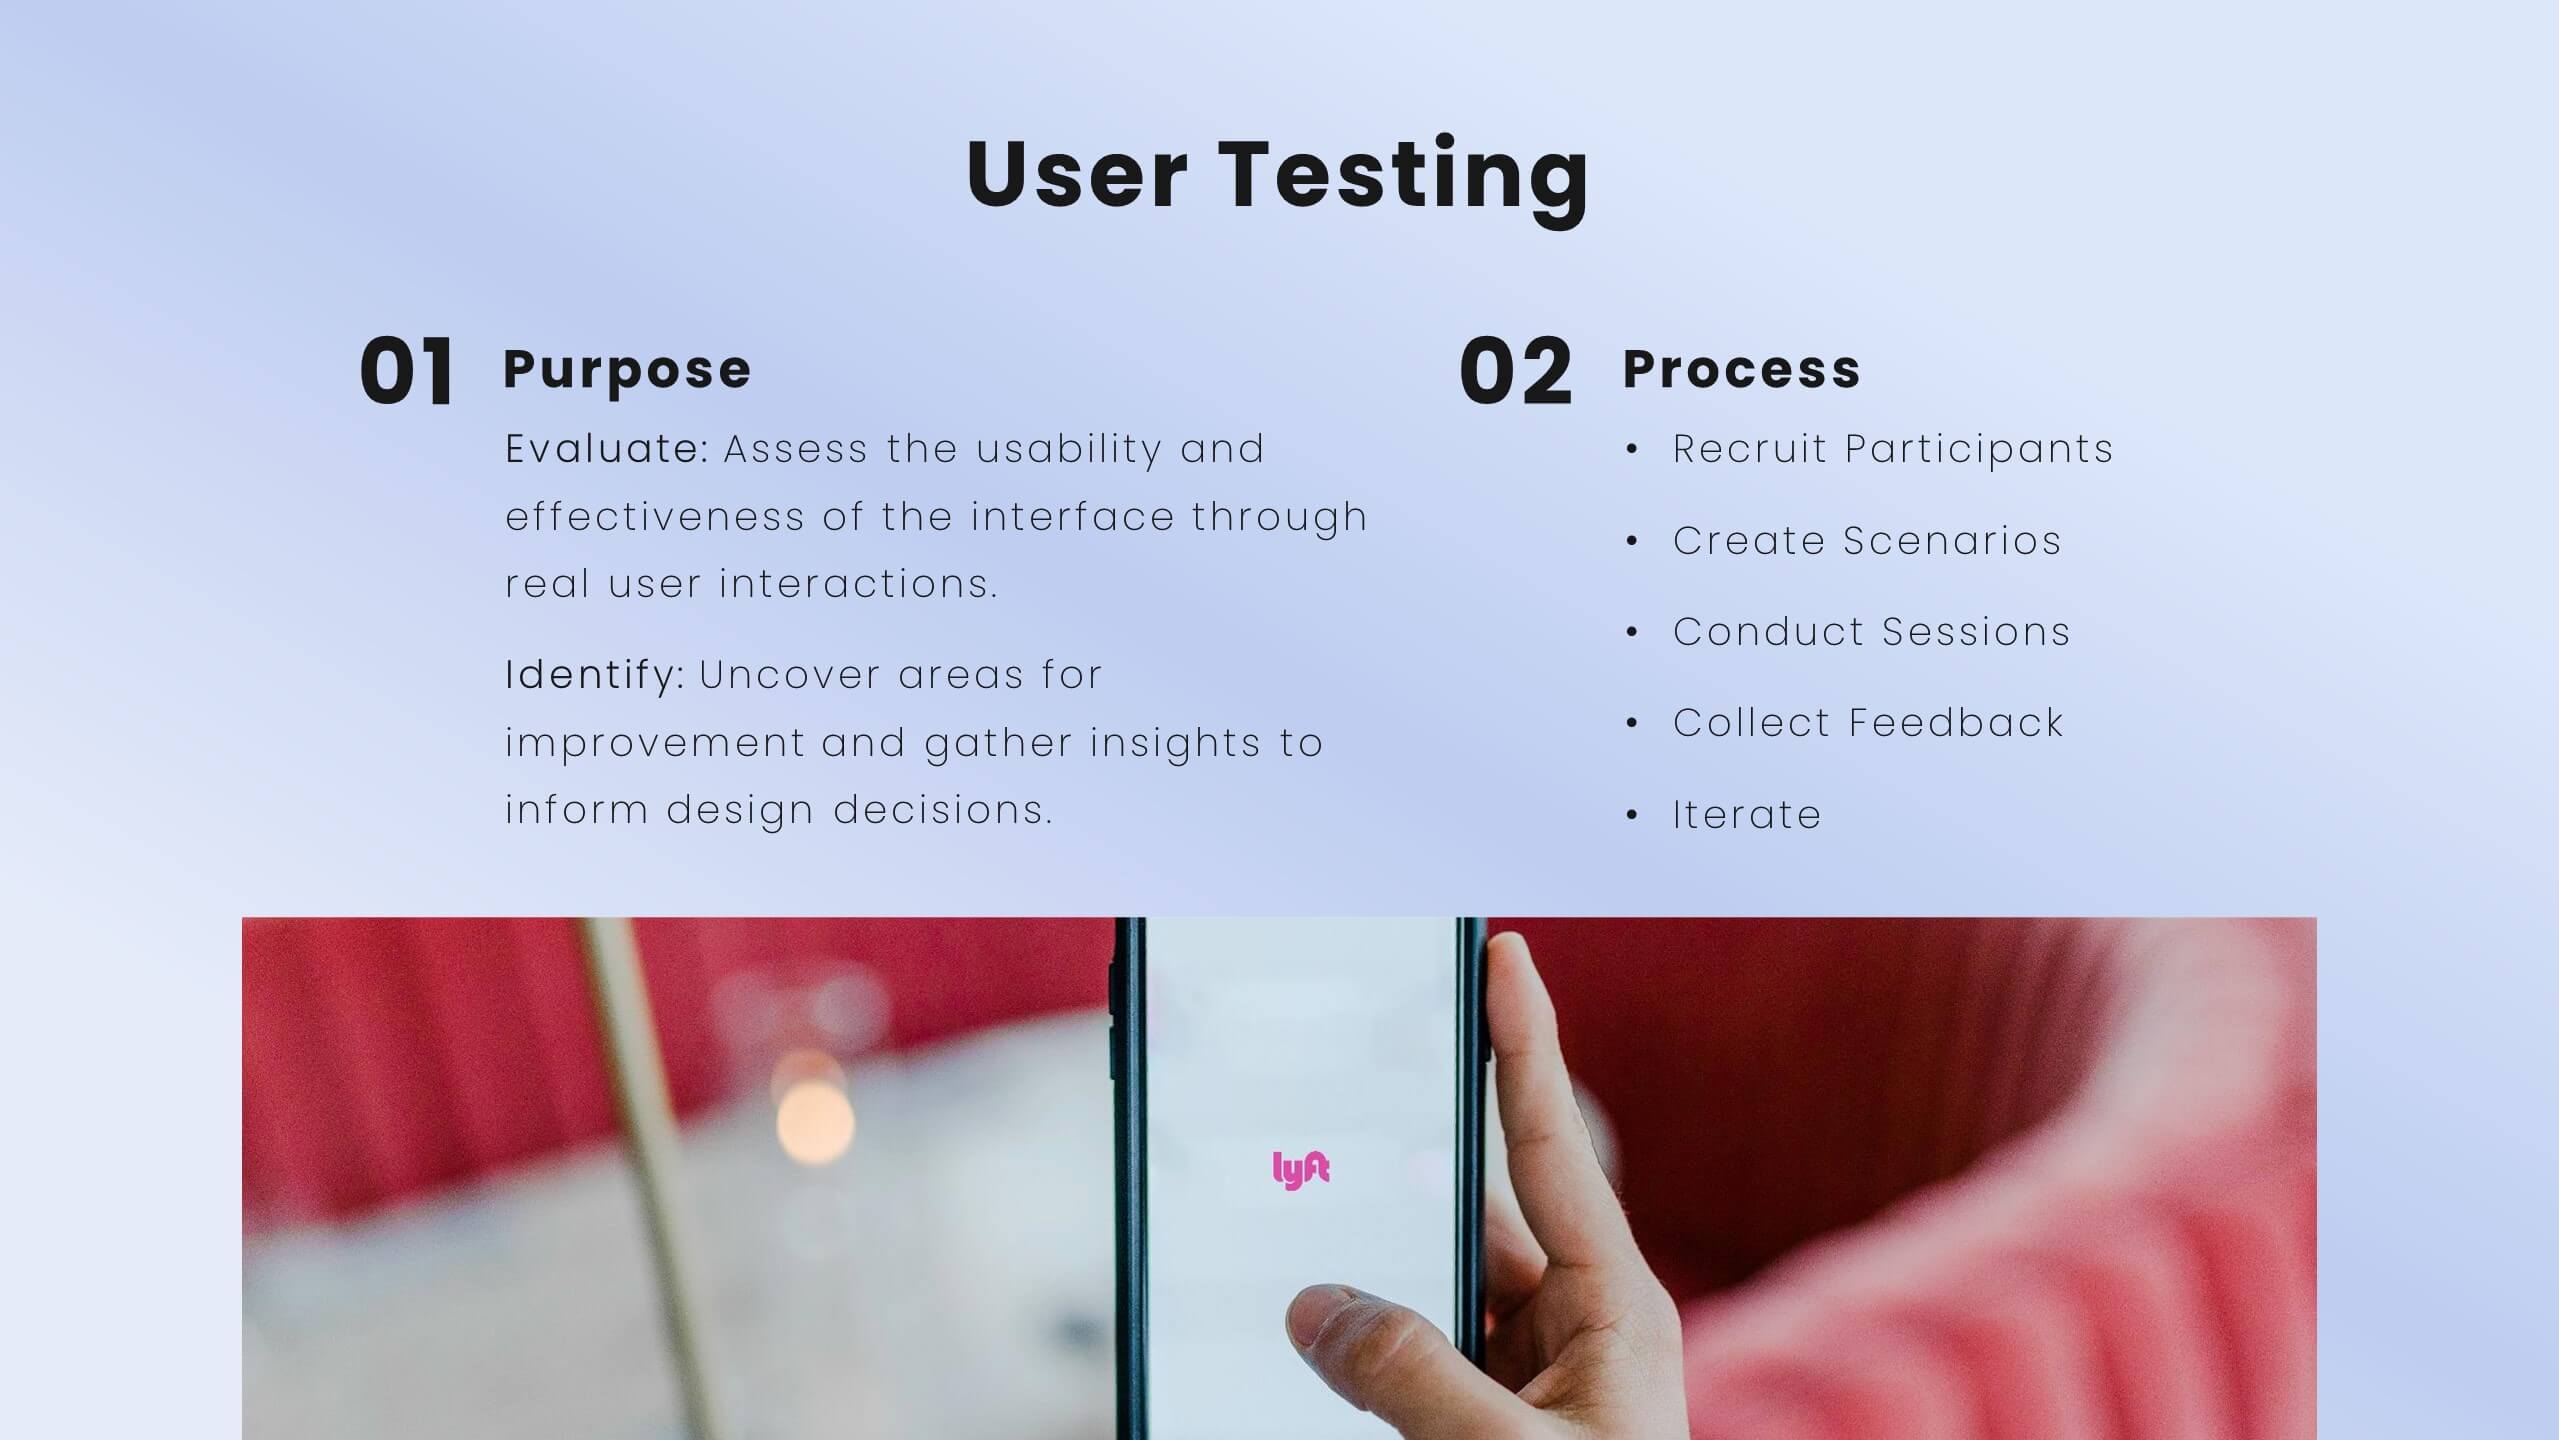
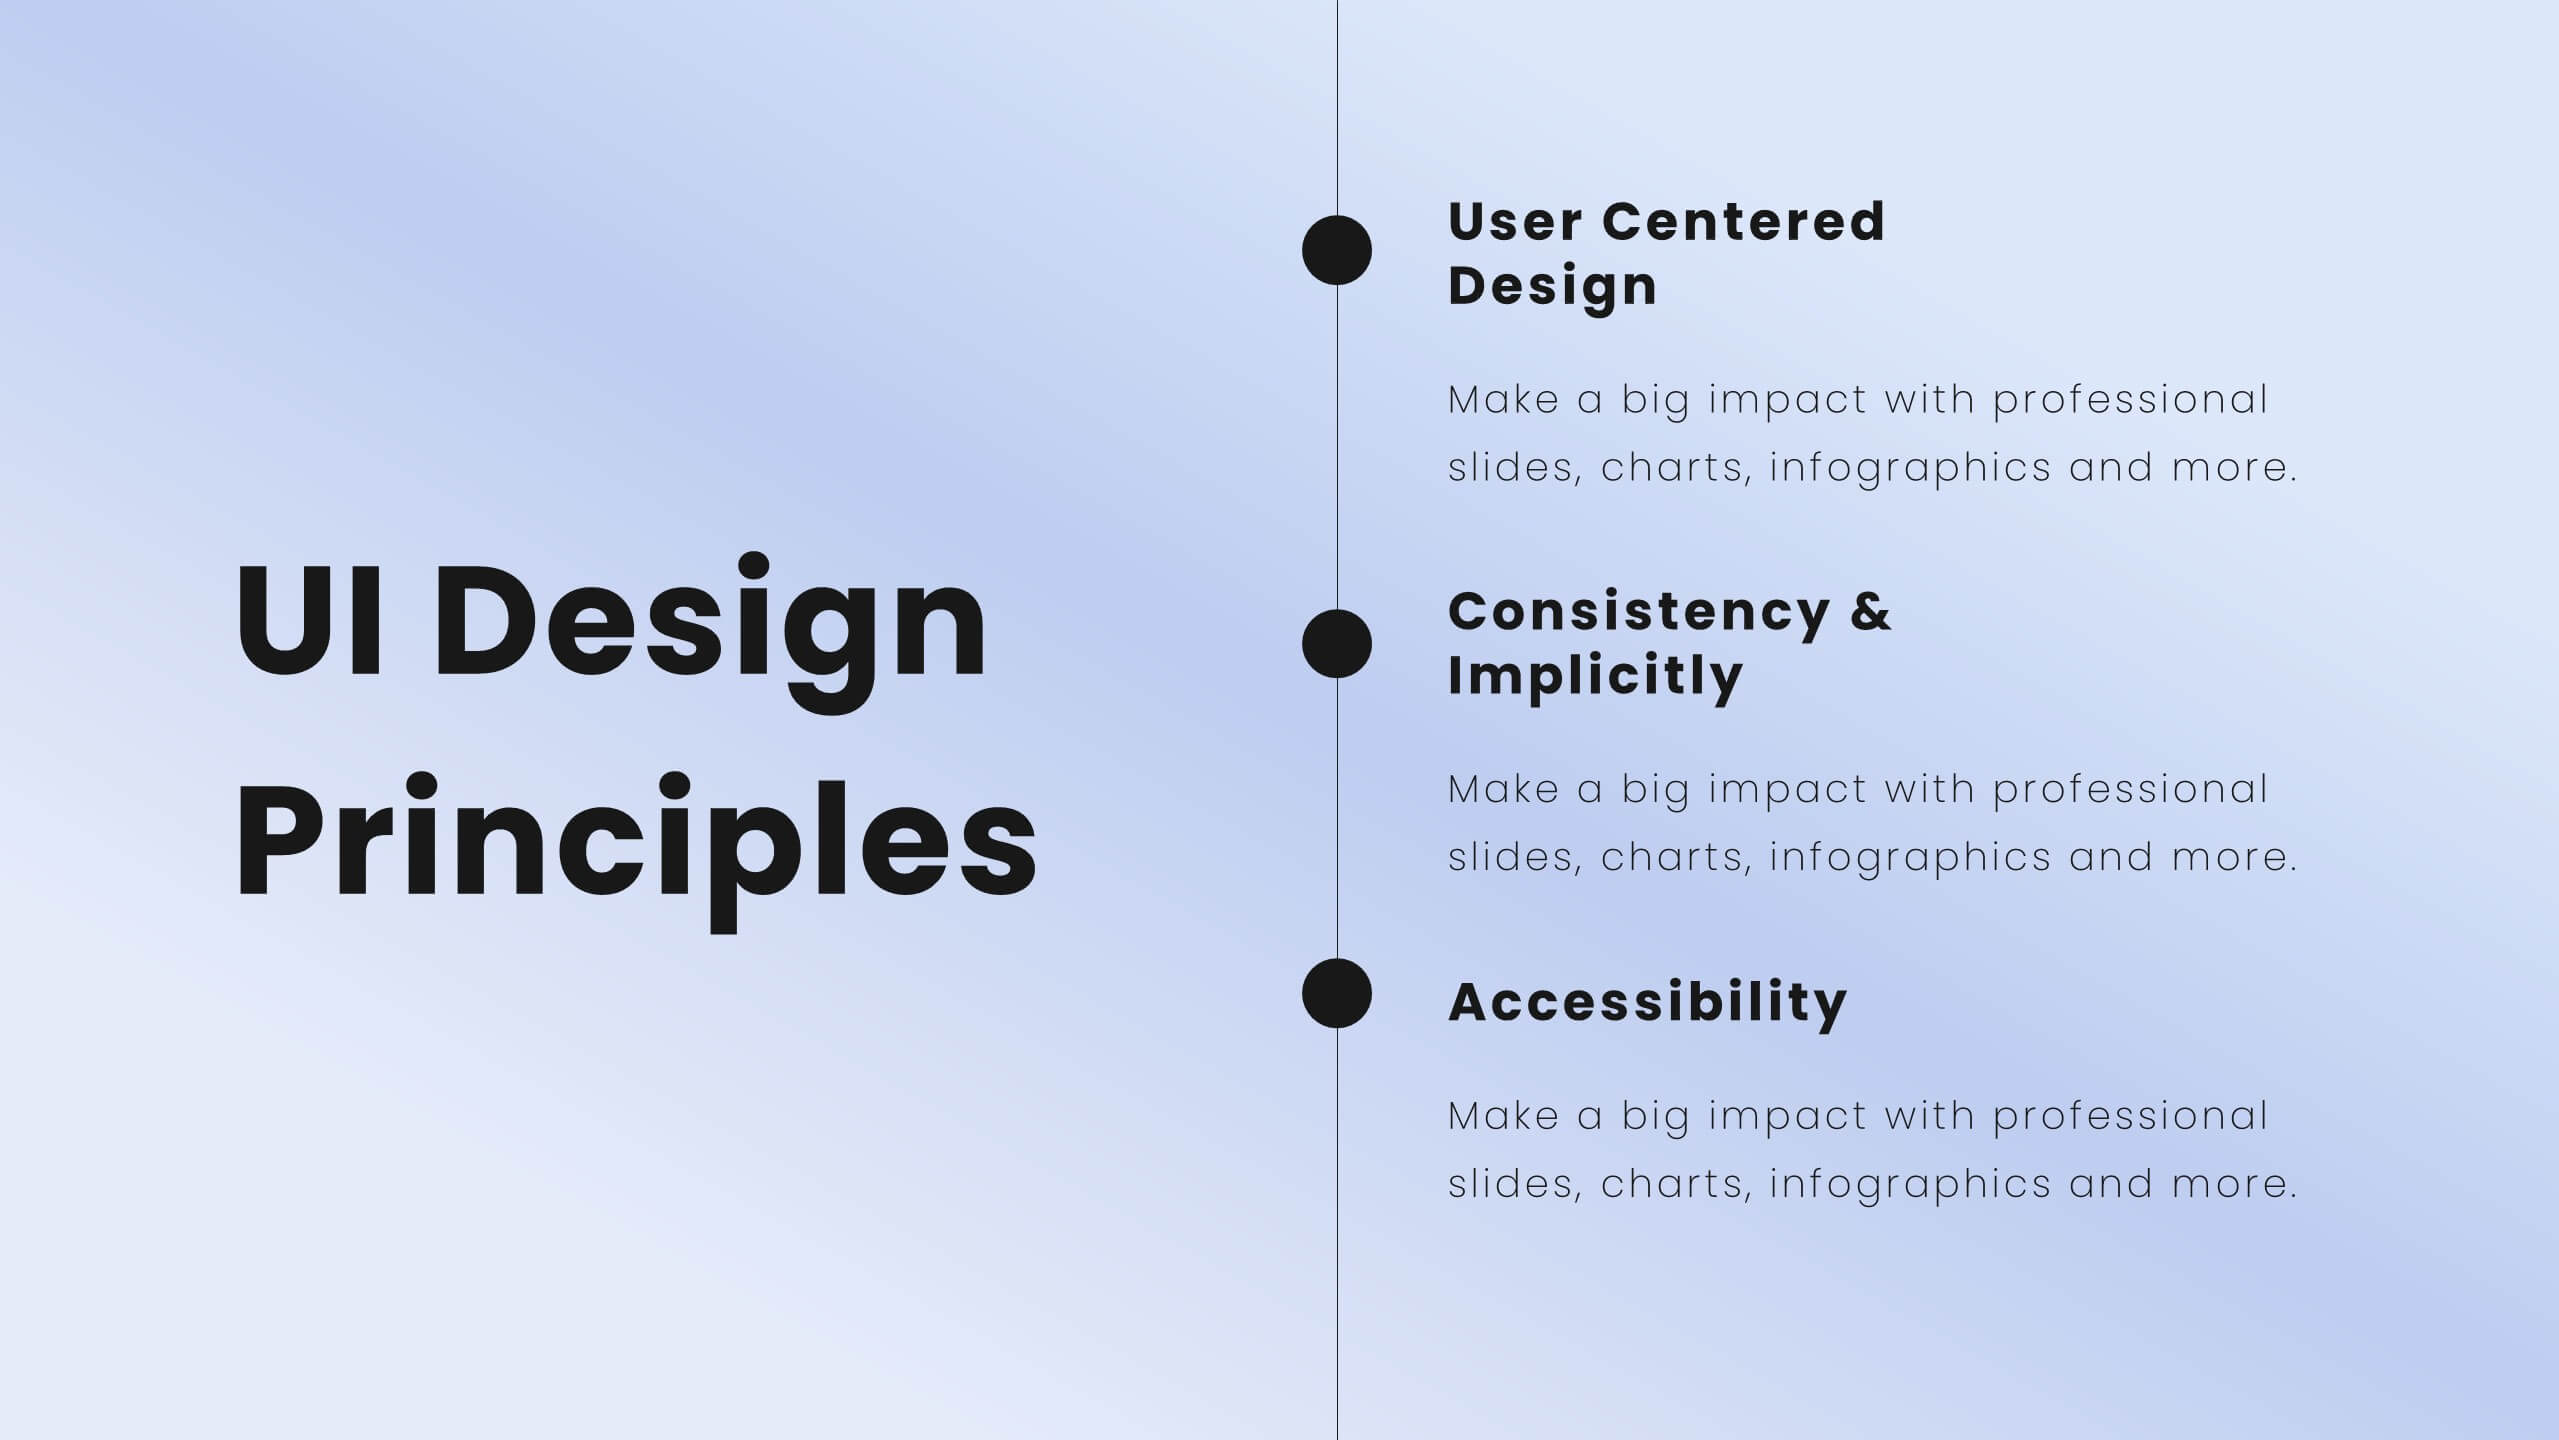
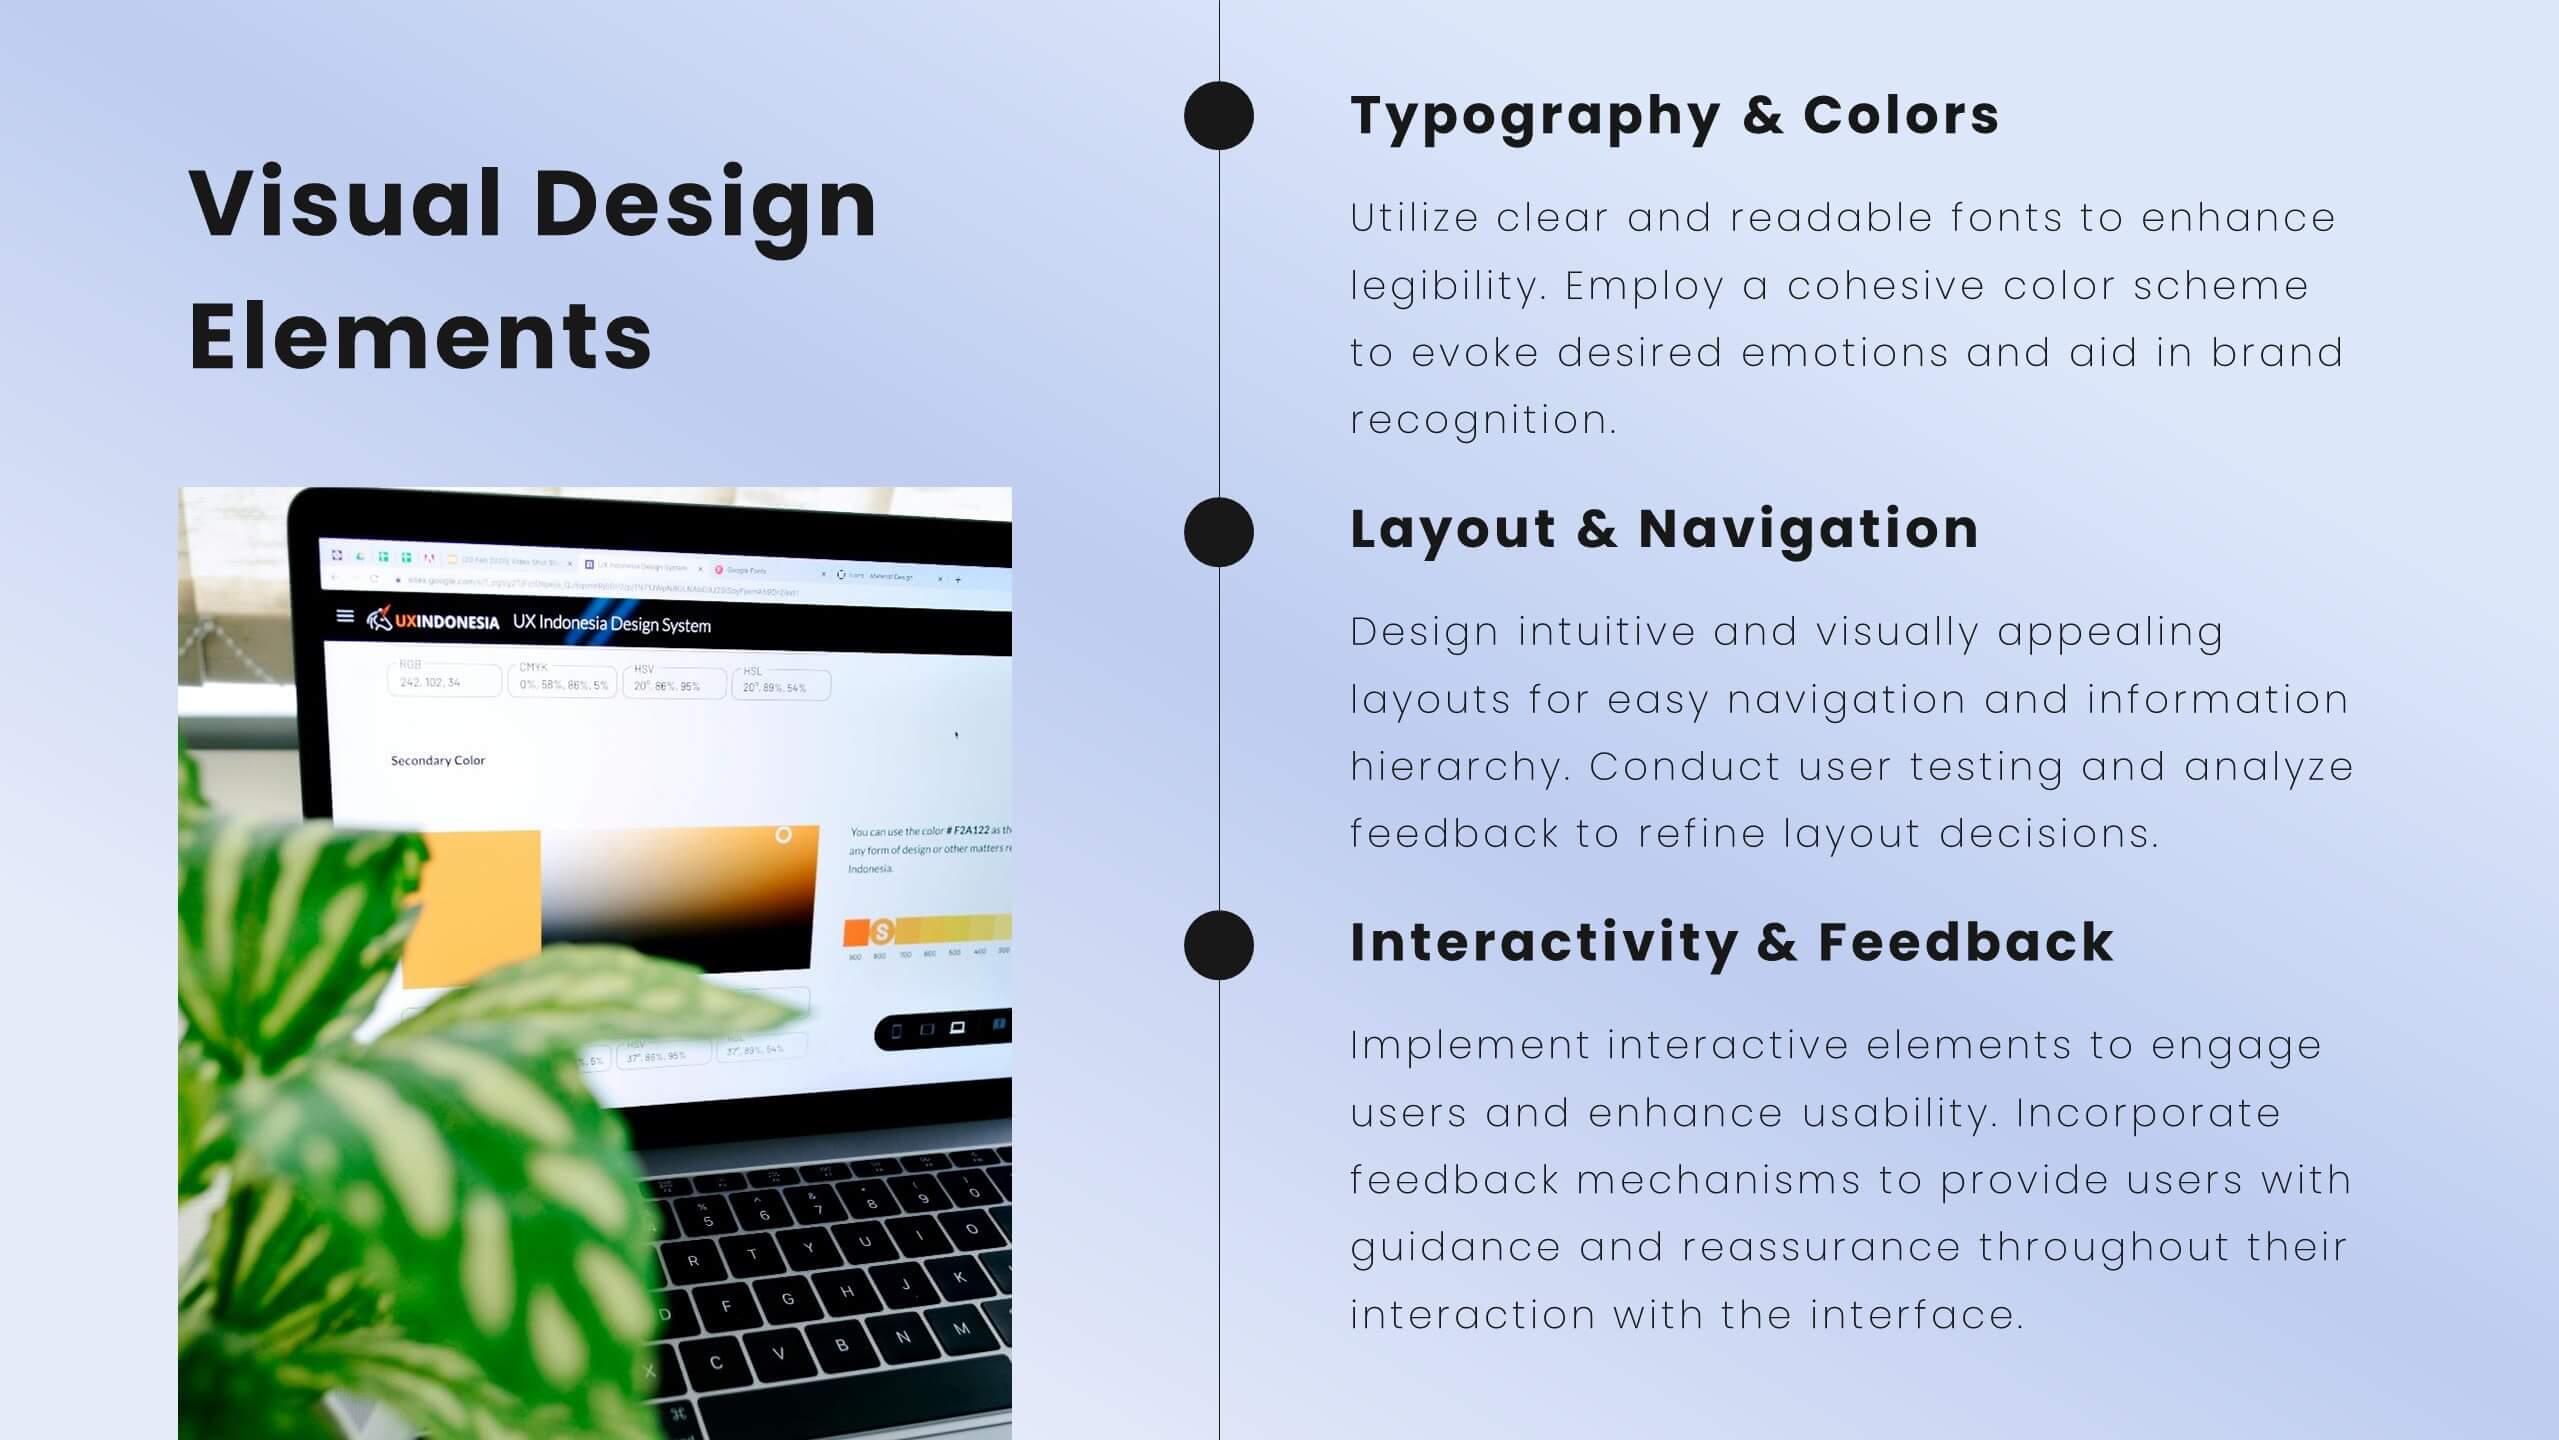
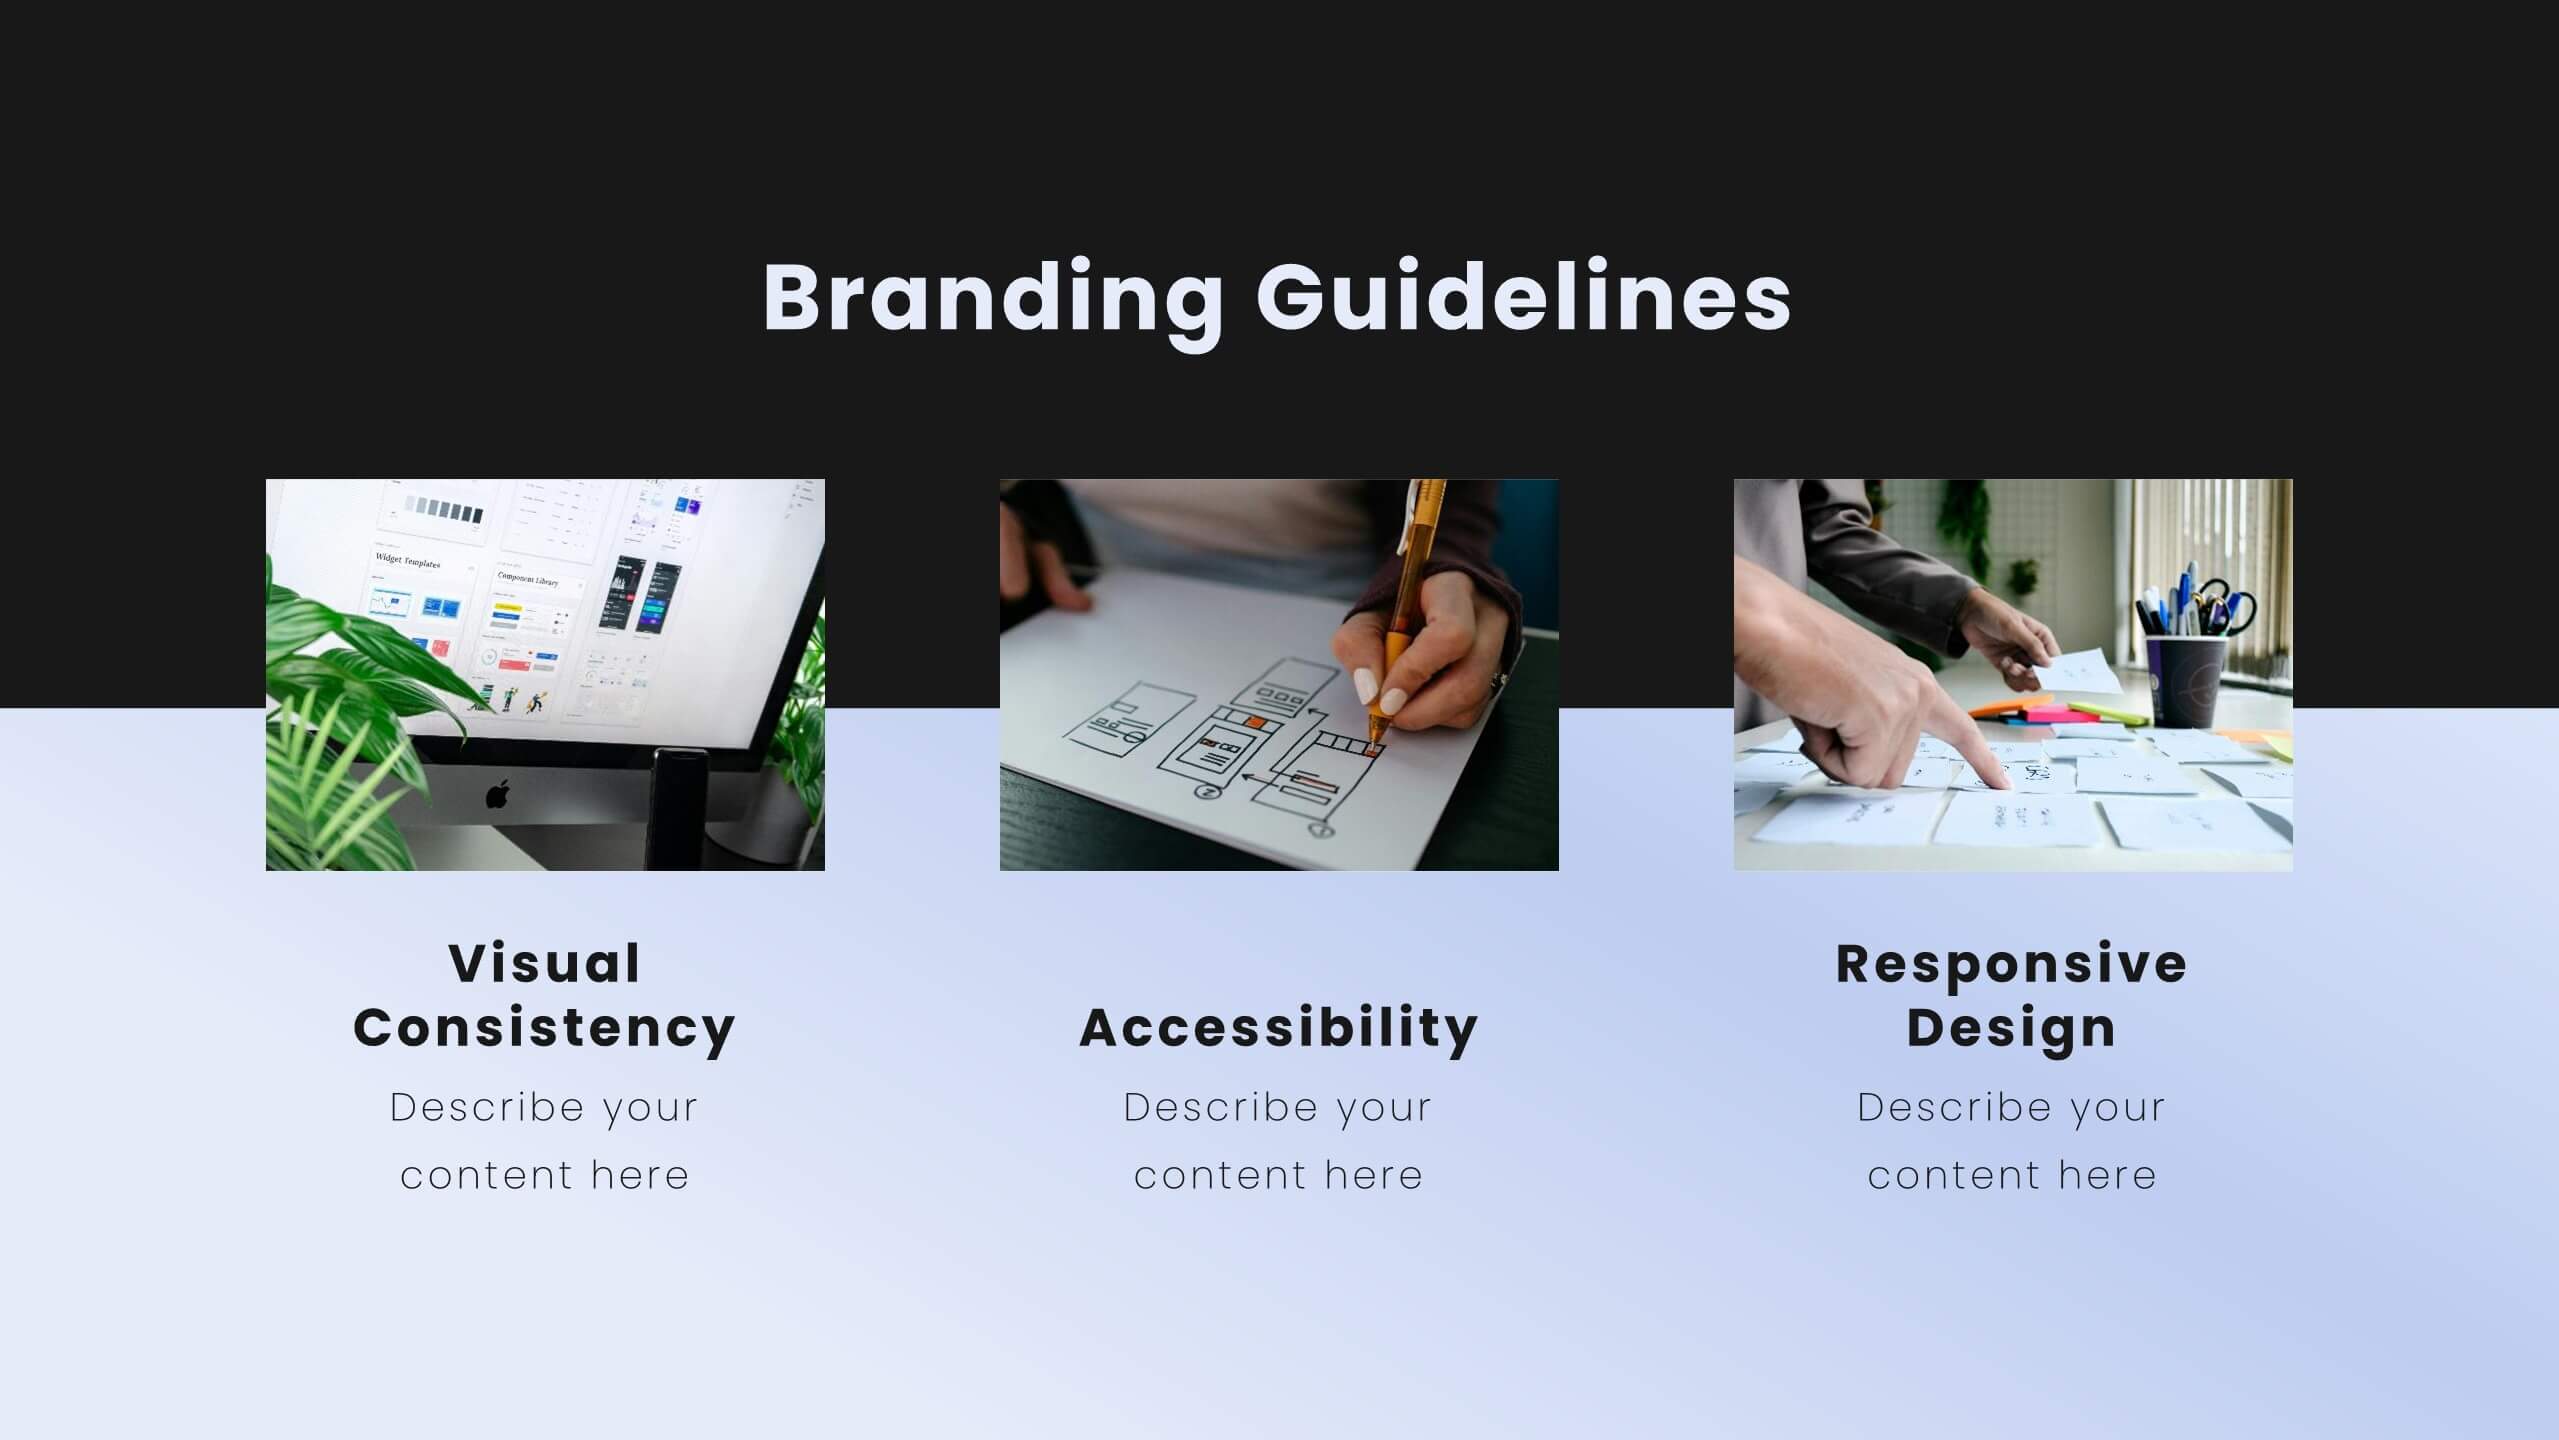
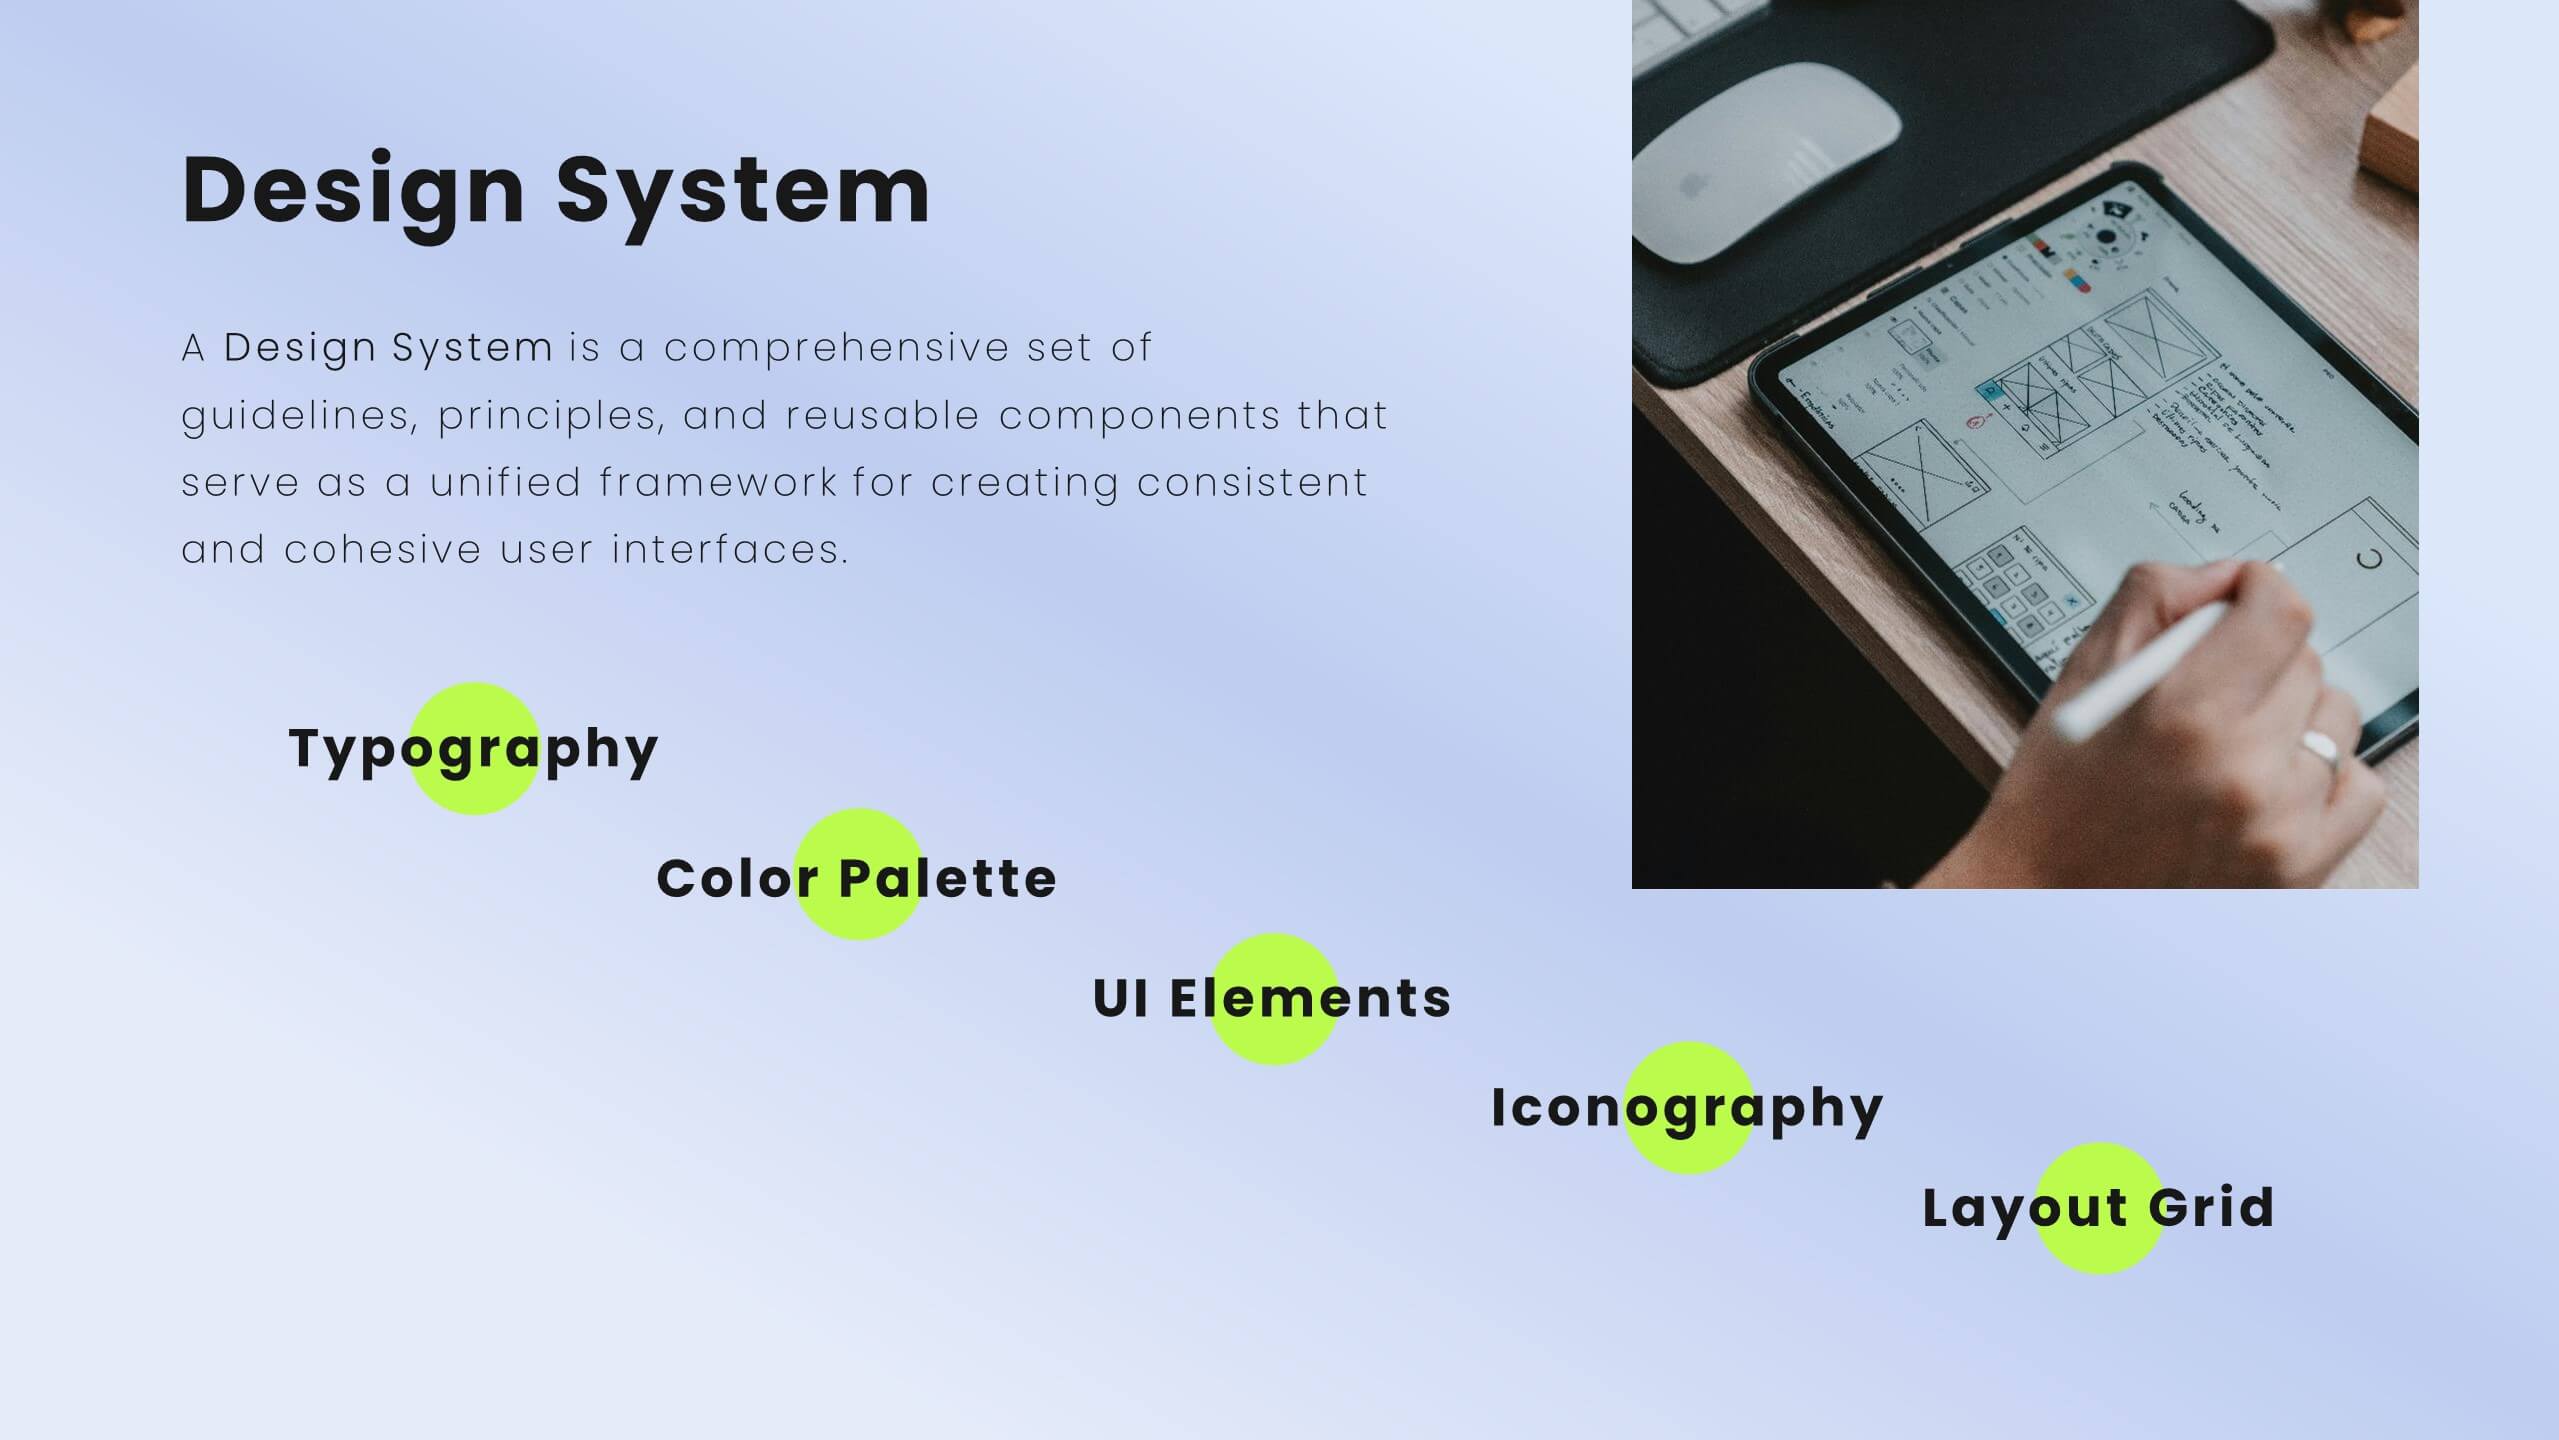
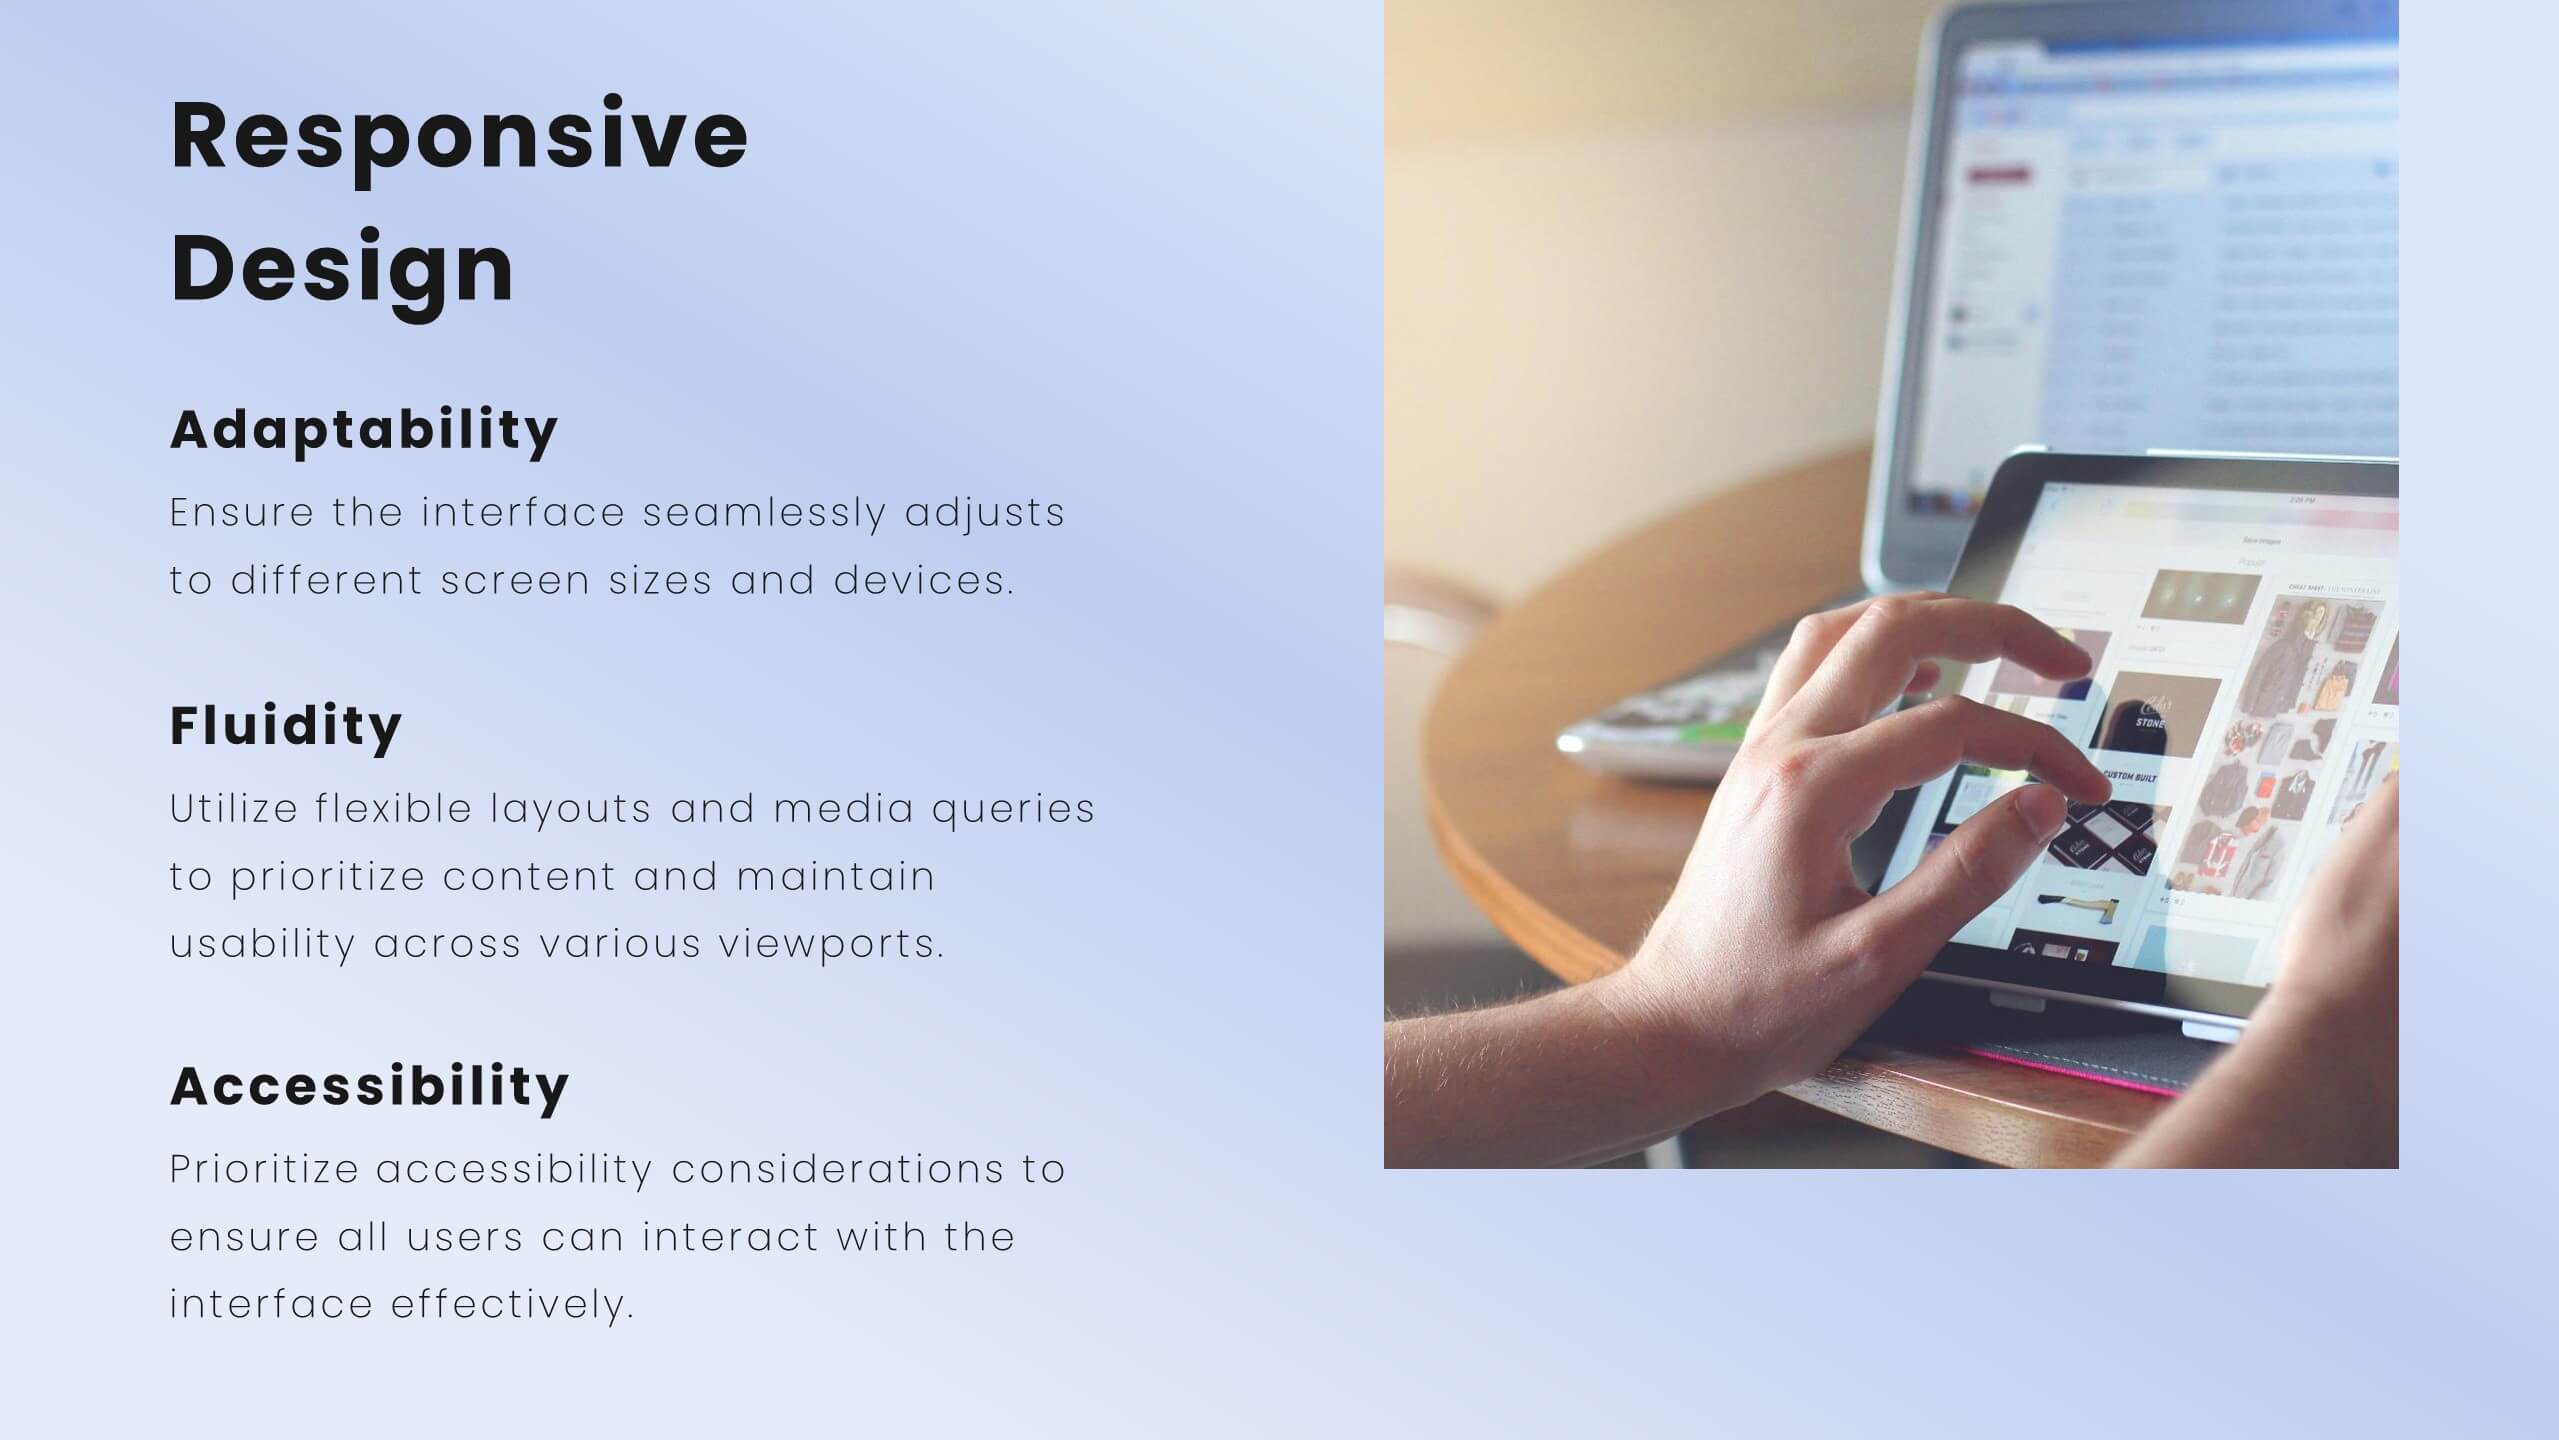
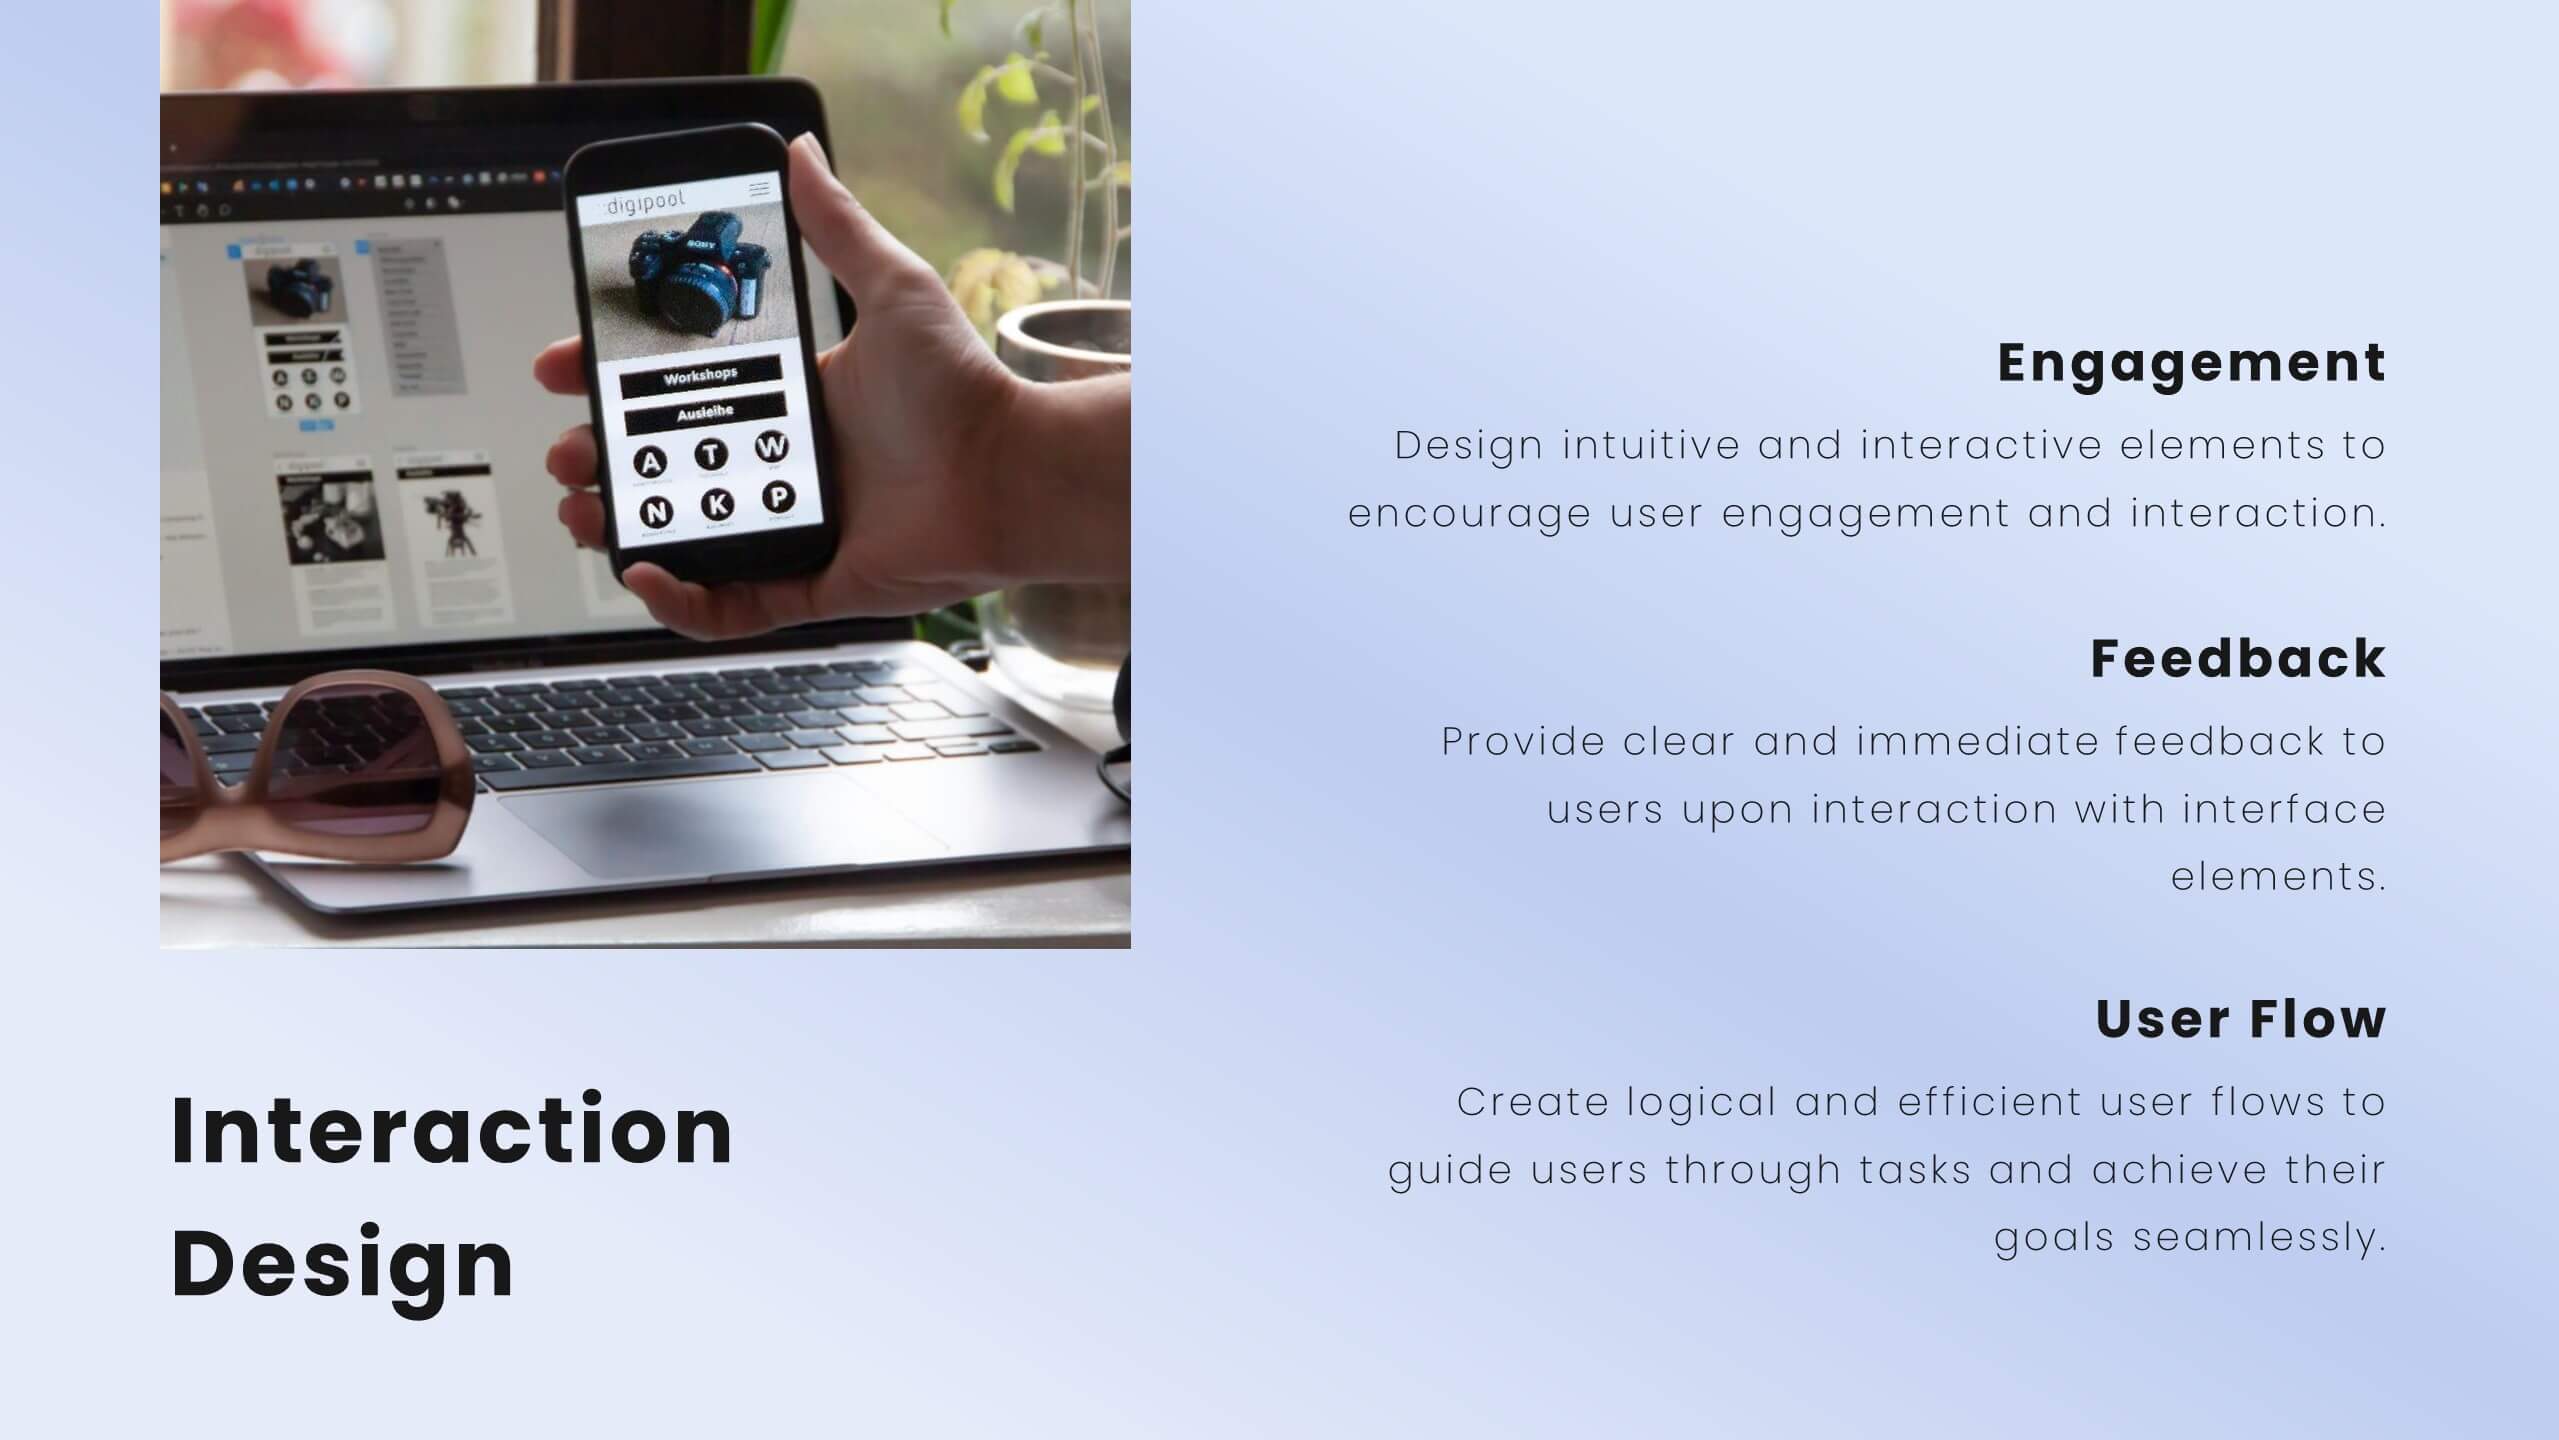
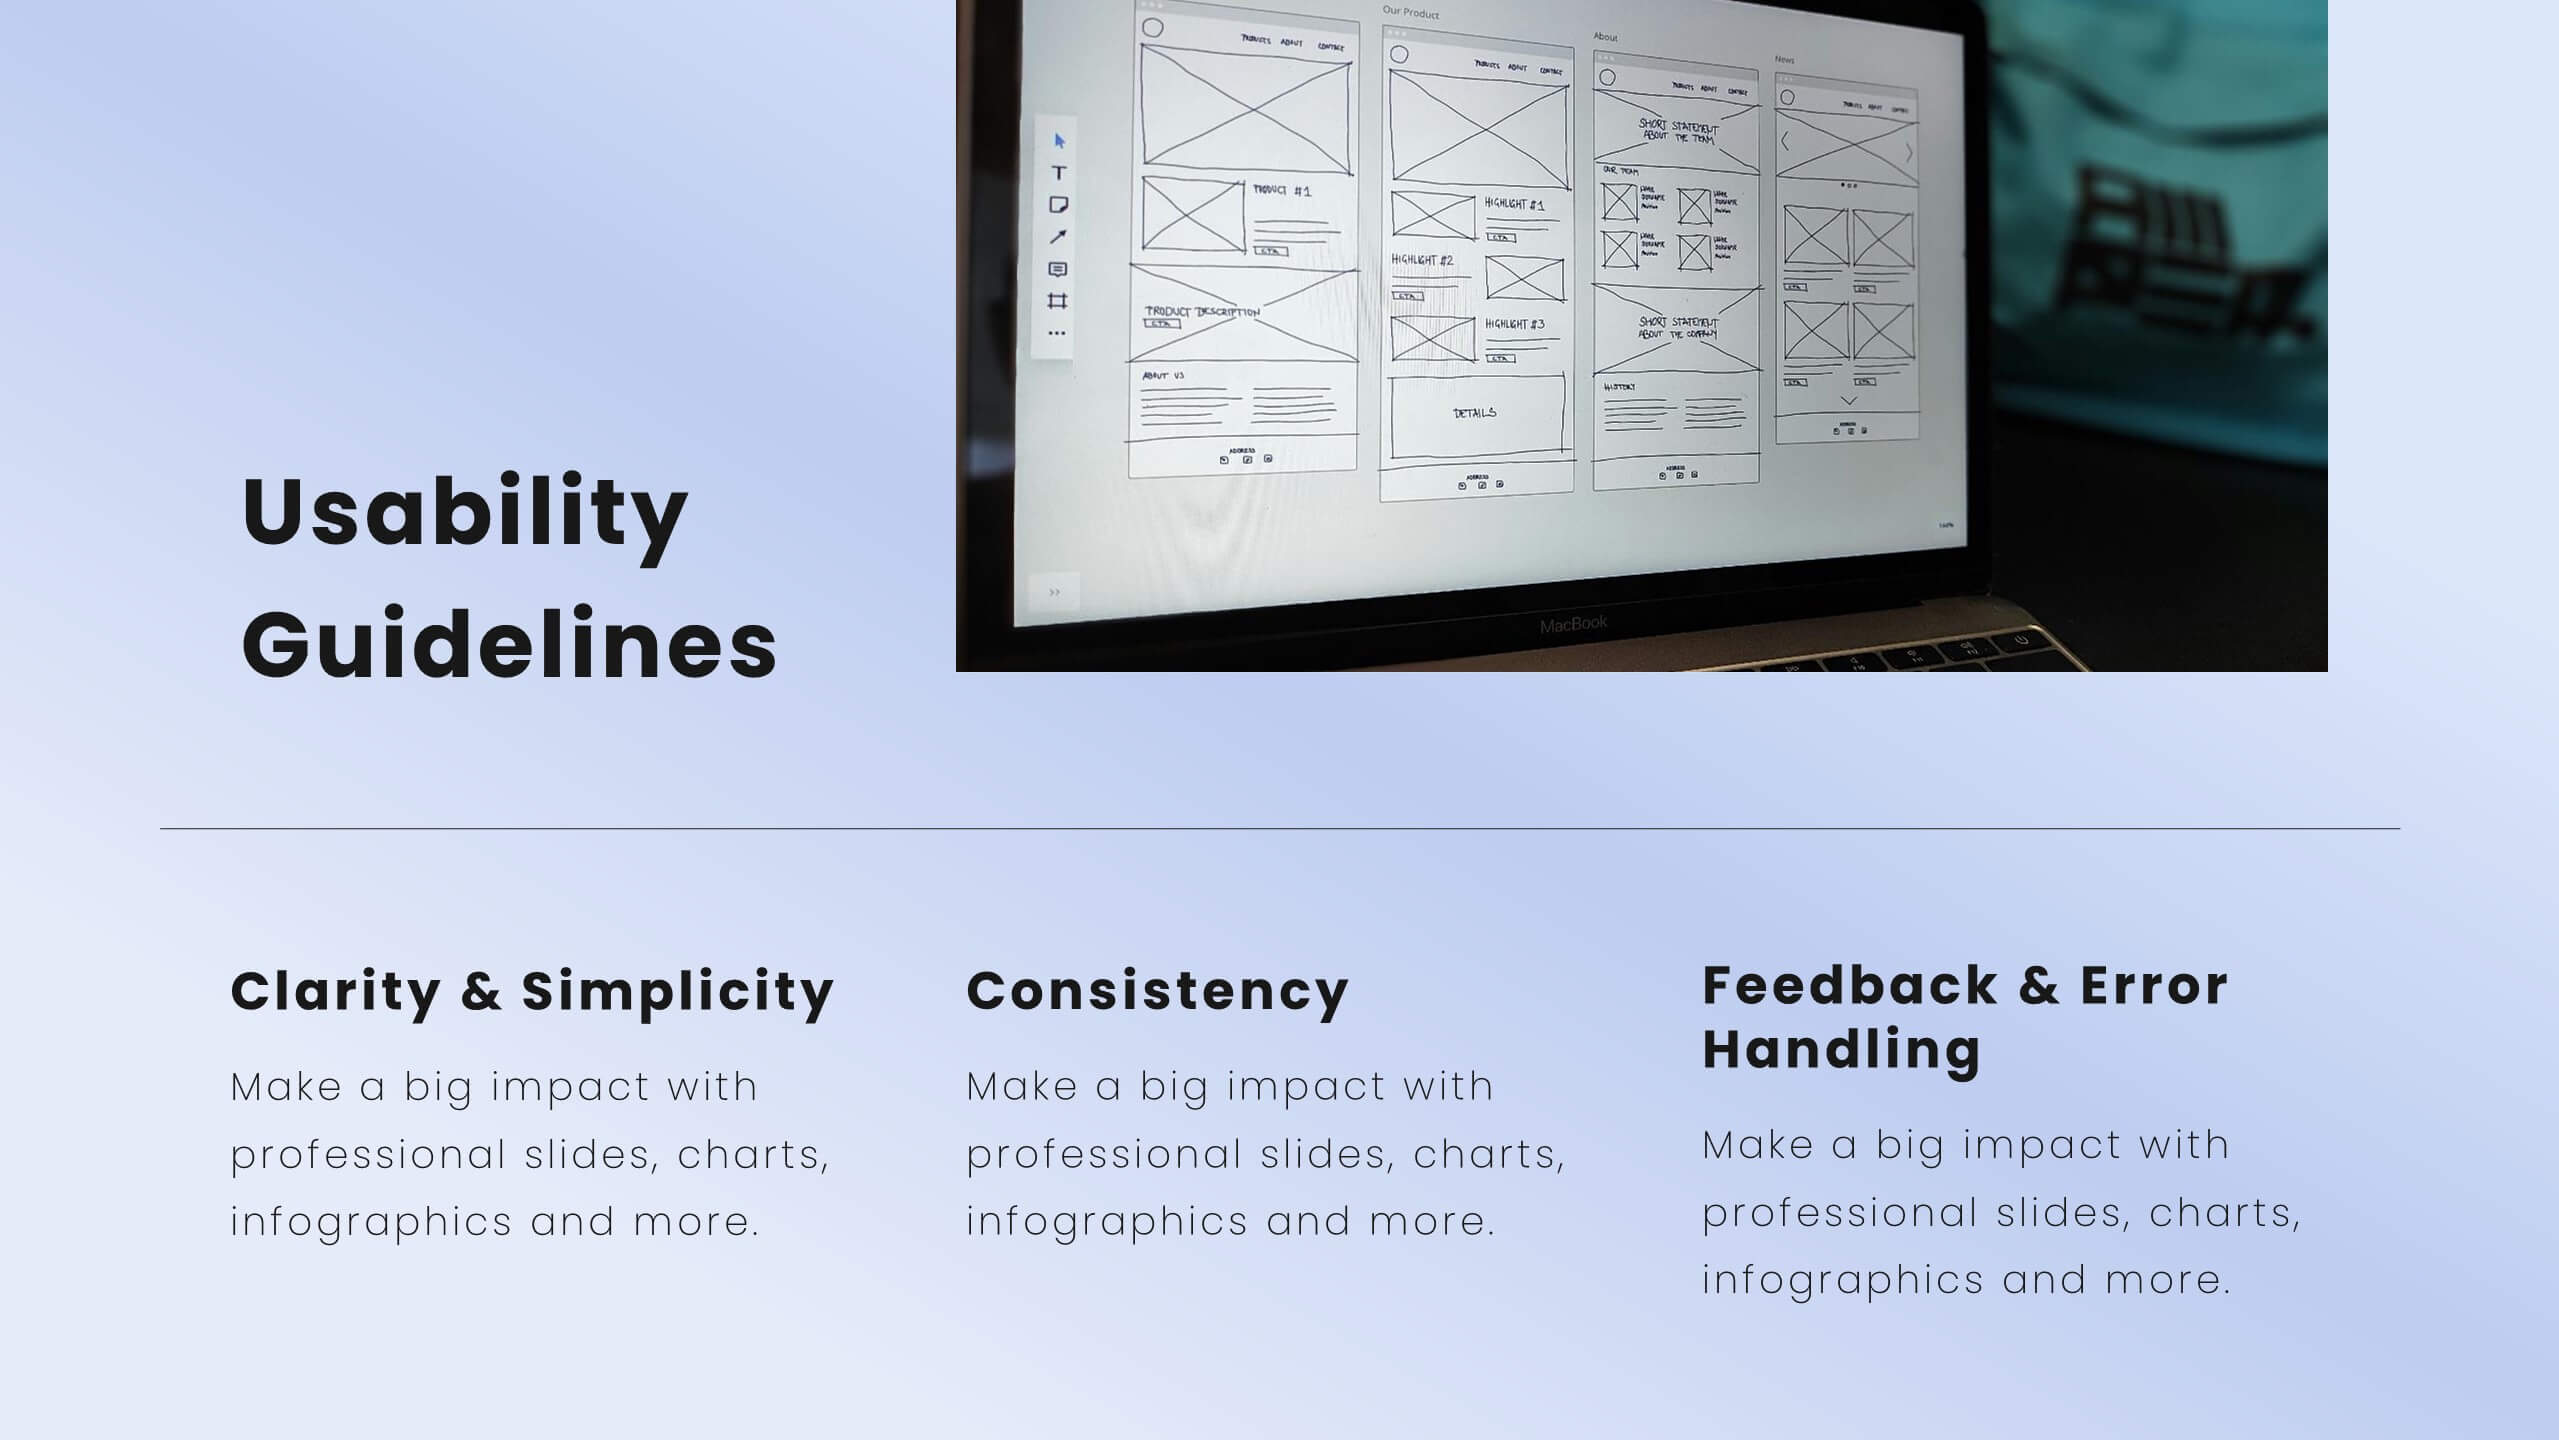
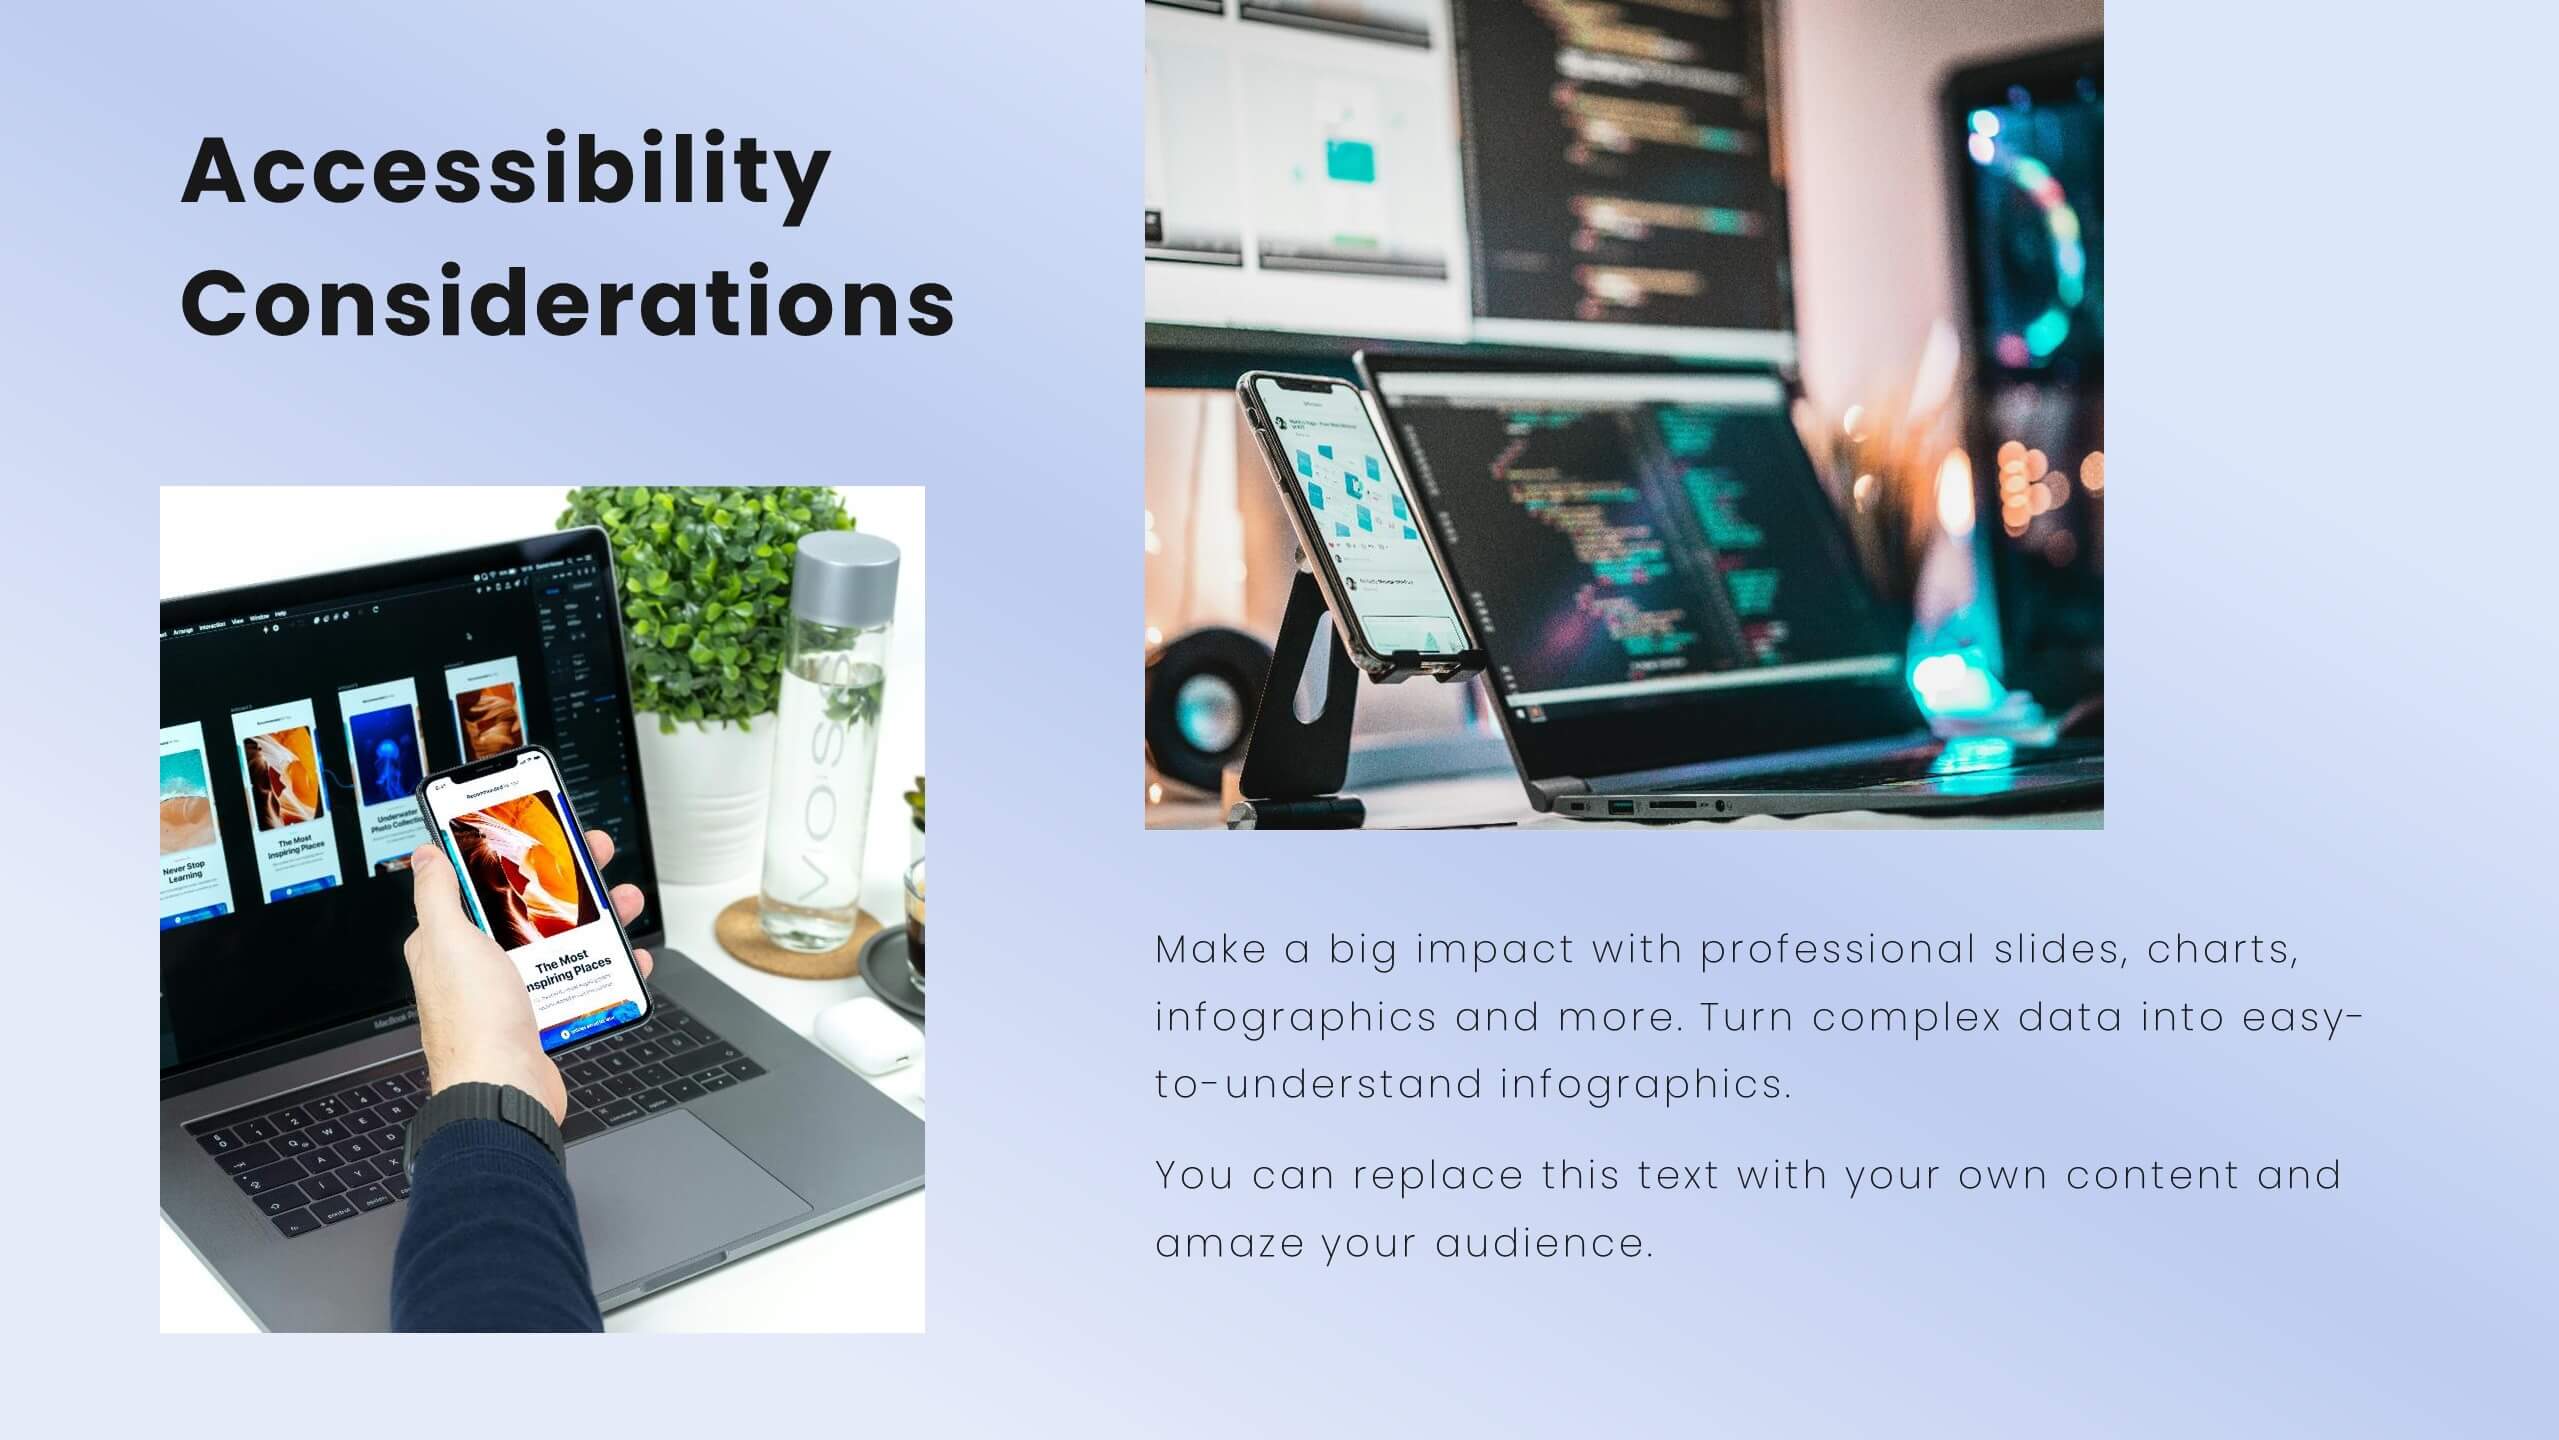
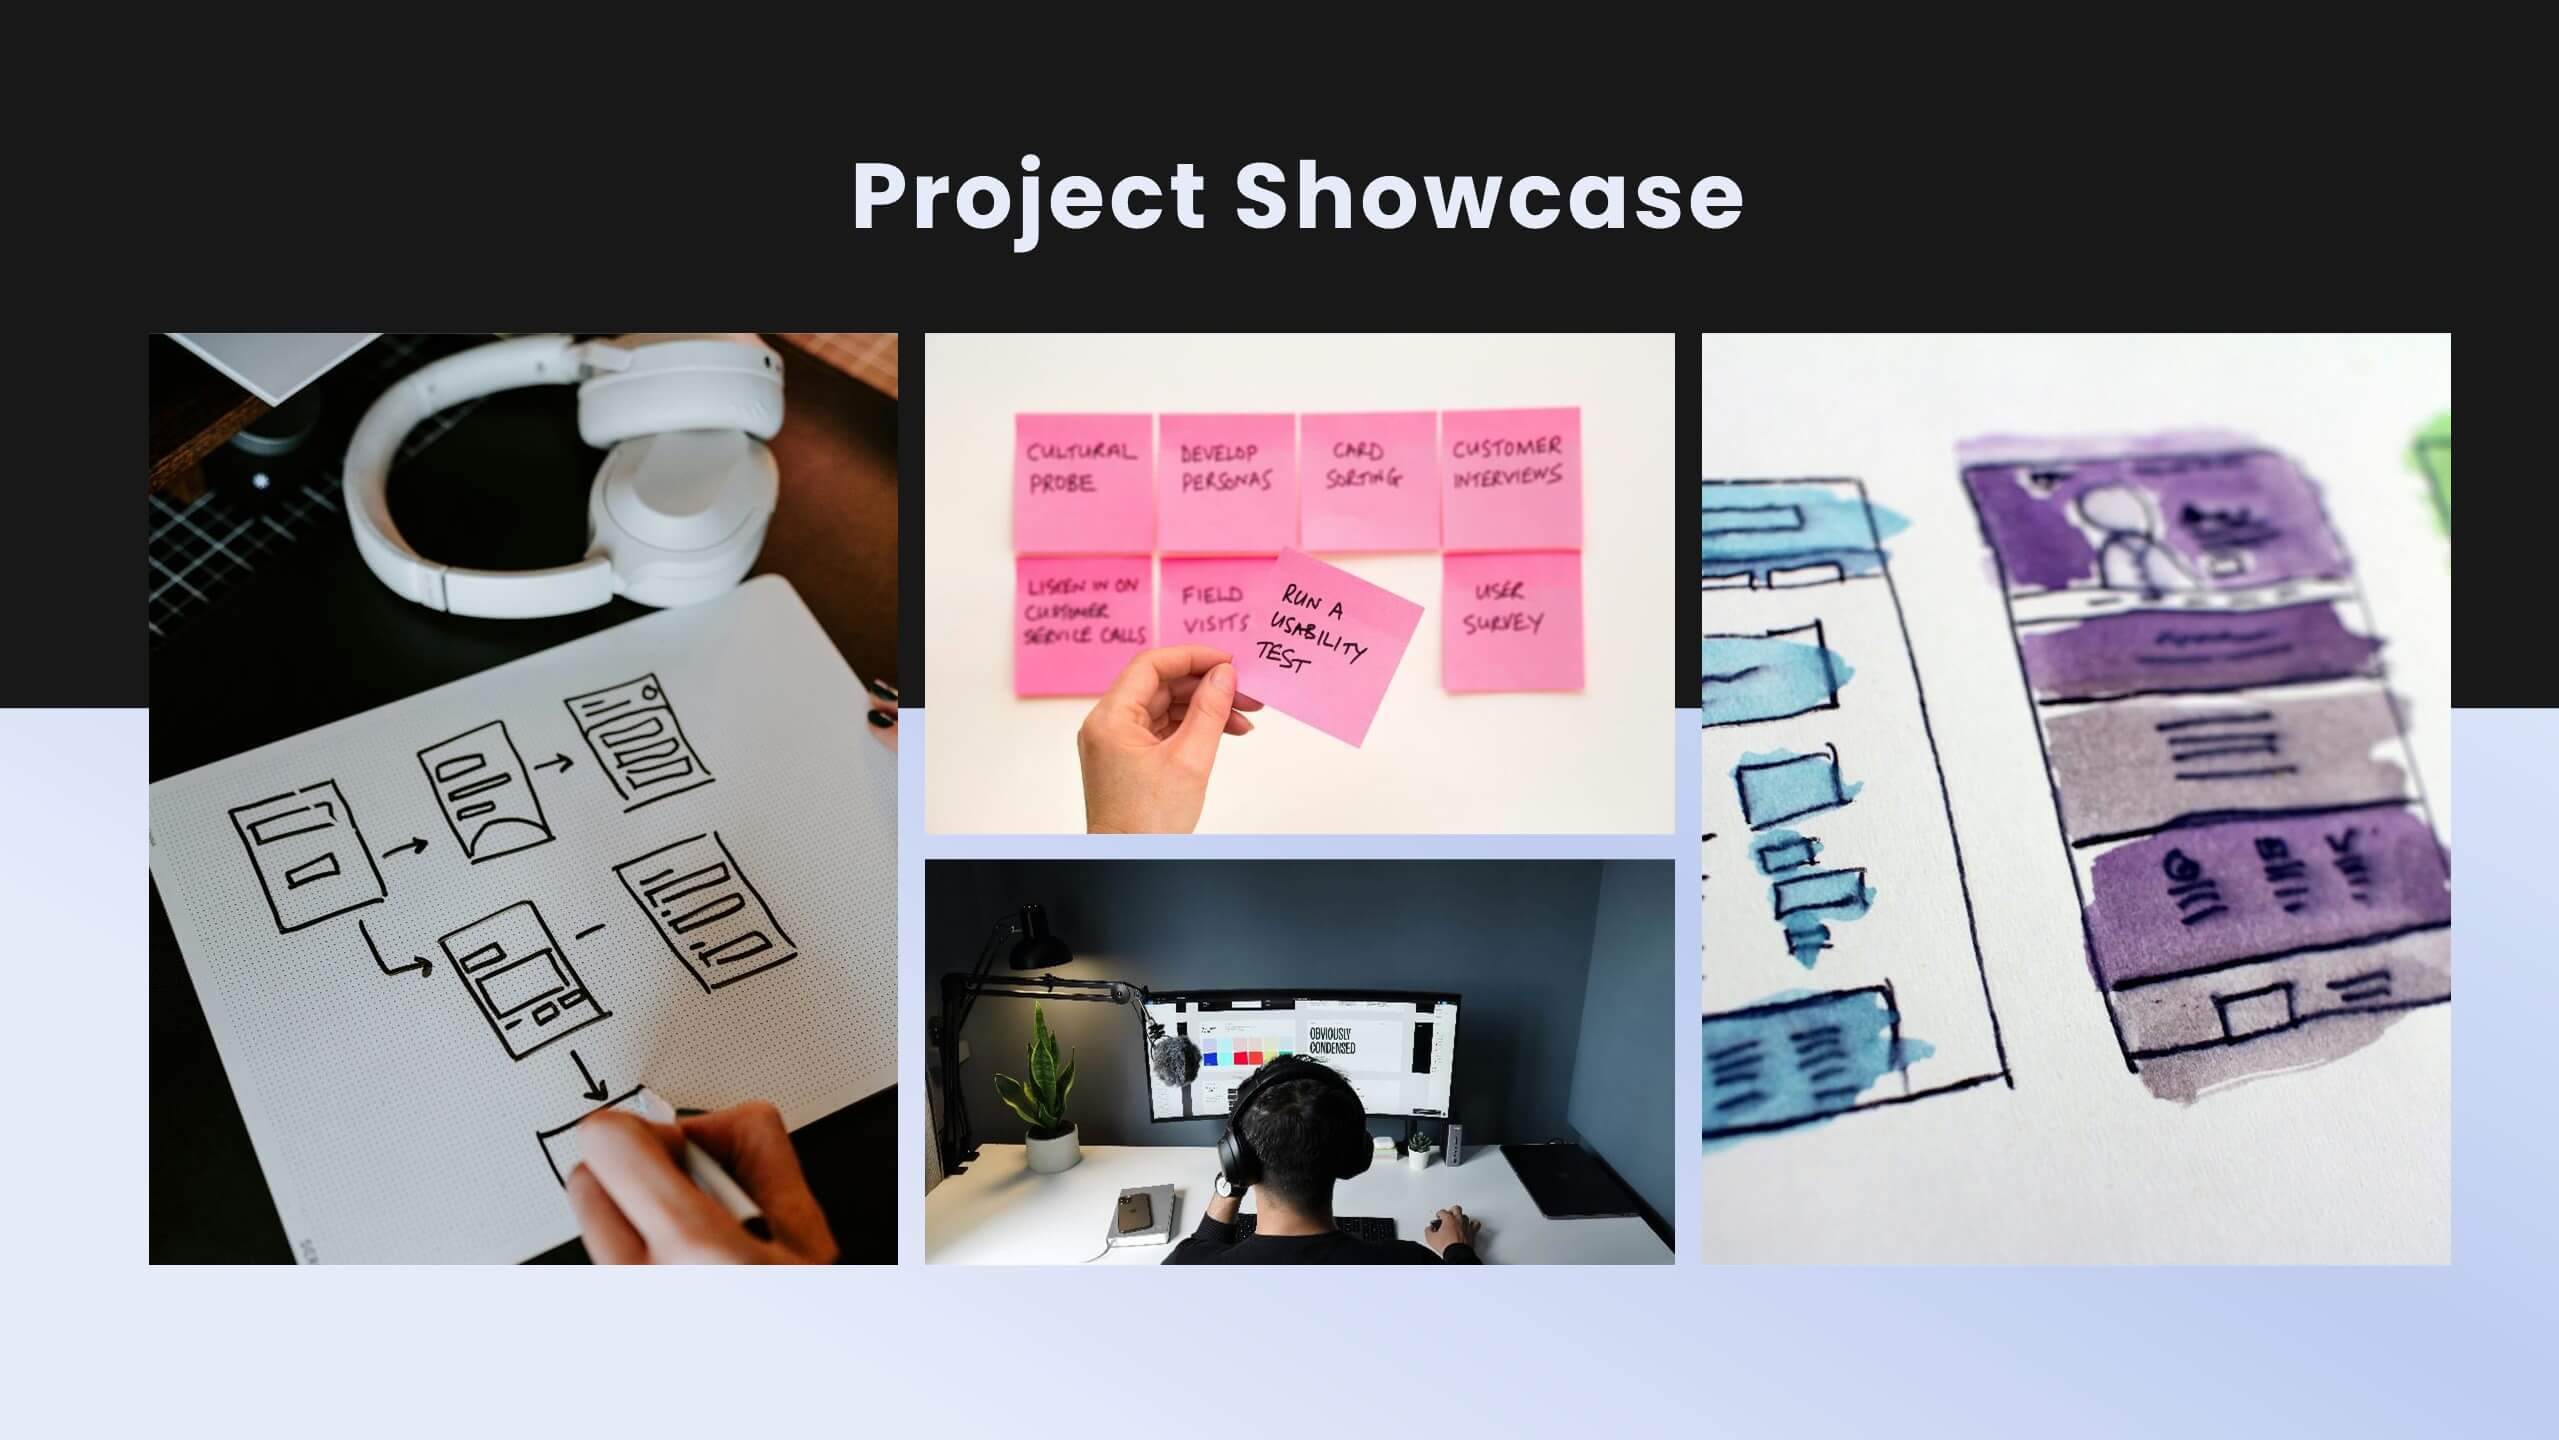
Jigsaw User Experience Proposal Presentation
Enhance user experience with this comprehensive UX proposal template! Perfect for outlining user research, personas, and design principles. Ideal for UX/UI designers aiming to present their strategies and solutions. Compatible with PowerPoint, Keynote, and Google Slides, this template ensures your UX proposals are clear, professional, and impactful. Create exceptional user experiences today!