


Características


¿Tienes alguna pregunta?
Recomendar


6 diapositivas
3D Infographic Design
Visualize data like never before with this bold 3D block diagram layout. Designed to break down complex figures into three key segments, it’s perfect for presenting percentages, growth areas, or metric comparisons. Easily editable in PowerPoint, Keynote, and Google Slides.


21 diapositivas
Ember Echo Graphic Design Project Plan Presentation
The Ember Graphic Design Project Plan template is the perfect canvas for your creative journey! Kickstart your project with a sleek and professional introduction that sets the tone for your design vision. This template is designed to guide you through every step of the design process, from the initial brief to the final presentation. Highlight your target audience, concept development, and design elements with beautifully crafted slides that capture the essence of your project. Dive into the specifics with dedicated sections for brand identity components, textures, and the design process itself, ensuring that every detail is covered. The template also includes mood boards, prototypes, and design assets, making it easy to showcase your work in progress. With feedback and testing slides, you can iterate and refine your designs before presenting the final product. This template is fully compatible with PowerPoint, Keynote, and Google Slides, making it versatile and easy to use for any creative project.


3 diapositivas
Company Mission and Core Values Presentation
Present your brand’s purpose with clarity using this streamlined infographic slide. Divided into three distinct sections—Mission, Vision, and Values—each with icon support and editable text, this layout offers a clean and professional structure for showcasing your company’s guiding principles. Ideal for pitch decks, onboarding, and strategic planning presentations. Fully compatible with PowerPoint, Keynote, and Google Slides.


6 diapositivas
Demographic Transition Infographics
Embark on a journey through the fascinating concept of demographic transition! This infographic opens the door to understanding how societies evolve over time in terms of population growth and age structure. From the early stages of high birth and death rates to the advanced stages of low birth and death rates, we unveil the intricate phases of demographic transition that shape our world. Discover the profound impacts of demographic transition on societies and economies. Learn how changes in population structure affect labor markets, healthcare systems, and social welfare. Understand the opportunities for economic growth and development that can arise from a favorable demographic transition. With this engaging infographic, compatible with PowerPoint, Keynote, and Google Slides, sharing your understanding of demographic transition has never been more accessible. Empower yourself with the knowledge to comprehend and discuss this vital aspect of our world's development. Dive into the complexities of demographic transition and embark on a journey of exploration and enlightenment.


4 diapositivas
E-Learning LMS Deployment Strategy Presentation
Break down your LMS rollout with clarity and style using this collaborative e-learning strategy visual. With its unique pencil-and-laptop layout, this infographic is perfect for trainers, course creators, and EdTech professionals mapping out a deployment process. Fully compatible with PowerPoint, Keynote, and Google Slides for flexible customization.


6 diapositivas
Digital Marketing Strategy and Trends Presentation
The "Digital Marketing Strategy and Trends" template is designed to help marketers visualize and present their strategies and market trends effectively. It facilitates clear mapping of key steps in digital marketing campaigns, making it easier to convey complex strategies in a digestible format. This template is compatible with PowerPoint, Keynote, and Google Slides, ensuring it can be utilized across various platforms for diverse audiences.


20 diapositivas
Ignisiel Sales Performance Report Presentation
Present your sales performance insights with a bold and professional edge using this dynamic presentation template. Designed to highlight every critical aspect of your sales achievements, it features slides for company introductions, service overviews, and target market analysis. Dive deeper into your success with sections on sales objectives, competitive analysis, and an in-depth performance metrics breakdown. Showcase your team’s efforts with slides for team introductions and build trust through customer testimonials. Financials are made clear with slides for pricing strategies and enticing promotions and discounts. Wrap up your presentation with actionable slides for future opportunities and an organized feedback section to engage stakeholders effectively. Fully customizable and compatible with PowerPoint, Google Slides, and Keynote, this template ensures your message is delivered with clarity and style. Perfect for businesses aiming to make a bold impression.


6 diapositivas
Circular Wheel Diagram Presentation
Bring motion and balance to your ideas with this clean, circular design that connects every element in a seamless flow. Ideal for showcasing continuous processes, team dynamics, or strategic cycles, it keeps your message clear and engaging. Fully compatible with PowerPoint, Keynote, and Google Slides for easy editing.


3 diapositivas
Triangle Diagram for Strategic Layers Presentation
Visualize interconnected processes or layered strategies with the Triangle Diagram for Strategic Layers Presentation. This slide features three dynamic triangle shapes arranged in a circular flow, perfect for representing cycles, frameworks, or pillars of a system. Each point includes space for a title, icon, and supporting text. Great for illustrating collaboration, dependencies, or strategic pillars. Compatible with PowerPoint, Keynote, and Google Slides.


4 diapositivas
Design and Project Work Samples Presentation
Showcase your creative projects with this visually structured layout. Featuring a bold title area and three image slots for key works, it’s perfect for portfolios, proposals, or pitch decks. Fully editable in PowerPoint, Keynote, and Google Slides to suit your brand and project presentation needs.


6 diapositivas
United States Coronavirus Map
A United States Coronavirus Map is a graphical representation that displays the spread of the coronavirus (COVID-19) across the United States. This infographic template may use different colors, shades, or symbols to indicate the severity of COVID-19 cases in different areas. Darker colors may represent higher case numbers, while lighter colors may represent lower case numbers. These maps are valuable tools to track the progression of the virus, identify hotspots, and make informed decisions related to public health. This can also help raise awareness about the importance of preventive measures and promote data-driven strategies to control the spread.


5 diapositivas
Eco-Friendly Practices Implementation Presentation
Brighten your message with a clean, circular design that maps out every green initiative step-by-step. This visual template illustrates key eco-conscious actions, helping you present sustainable practices with ease. Perfect for environmental reports, team strategies, or policy pitches. Fully compatible with PowerPoint, Keynote, and Google Slides for flexible editing.


7 diapositivas
Chart Comparison Infographic Presentation
Chart Comparison is the process of comparing different charts or graphs to identify similarities. It involves analyzing multiple sets of data by visually presenting them in charts. Use this template to show the comparison of various charts and how things look when they are compared. This template will help you create a professional Infographic presentation that highlights the key differences between data sets. Each chart can have it's own color, so you can use any color you want. You can also add text in the chart with your own content, and edit in Powerpoint, Keynote, or Google Slides.


8 diapositivas
Simplified Step-by-Step Process Plan Presentation
Break complex workflows into clear, manageable steps with the Simplified Step-by-Step Process Plan Presentation. Designed with a clean vertical timeline and alternating flag-style indicators, this template guides viewers through four distinct phases—ideal for process explanations, onboarding flows, or project milestones. Each step features a matching icon and space for concise descriptions to keep your message clear and structured. Fully editable in PowerPoint, Keynote, and Google Slides.


23 diapositivas
Solarae Investor Pitch Presentation
This Investor Pitch Deck Presentation is designed to impress potential investors with a modern, professional layout. Covering key topics like company overview, financials, competitive landscape, and milestones, it's fully customizable and easy to edit in PowerPoint, Keynote, and Google Slides. Perfect for startups seeking funding opportunities.


23 diapositivas
Ethelin Digital Strategy Presentation
The digital strategy presentation template is designed to showcase your company's goals, market analysis, and strategic initiatives. Featuring slides for SWOT analysis, performance metrics, and action plans, it’s perfect for business planning and stakeholder engagement. Fully customizable and compatible with PowerPoint, Keynote, and Google Slides.


22 diapositivas
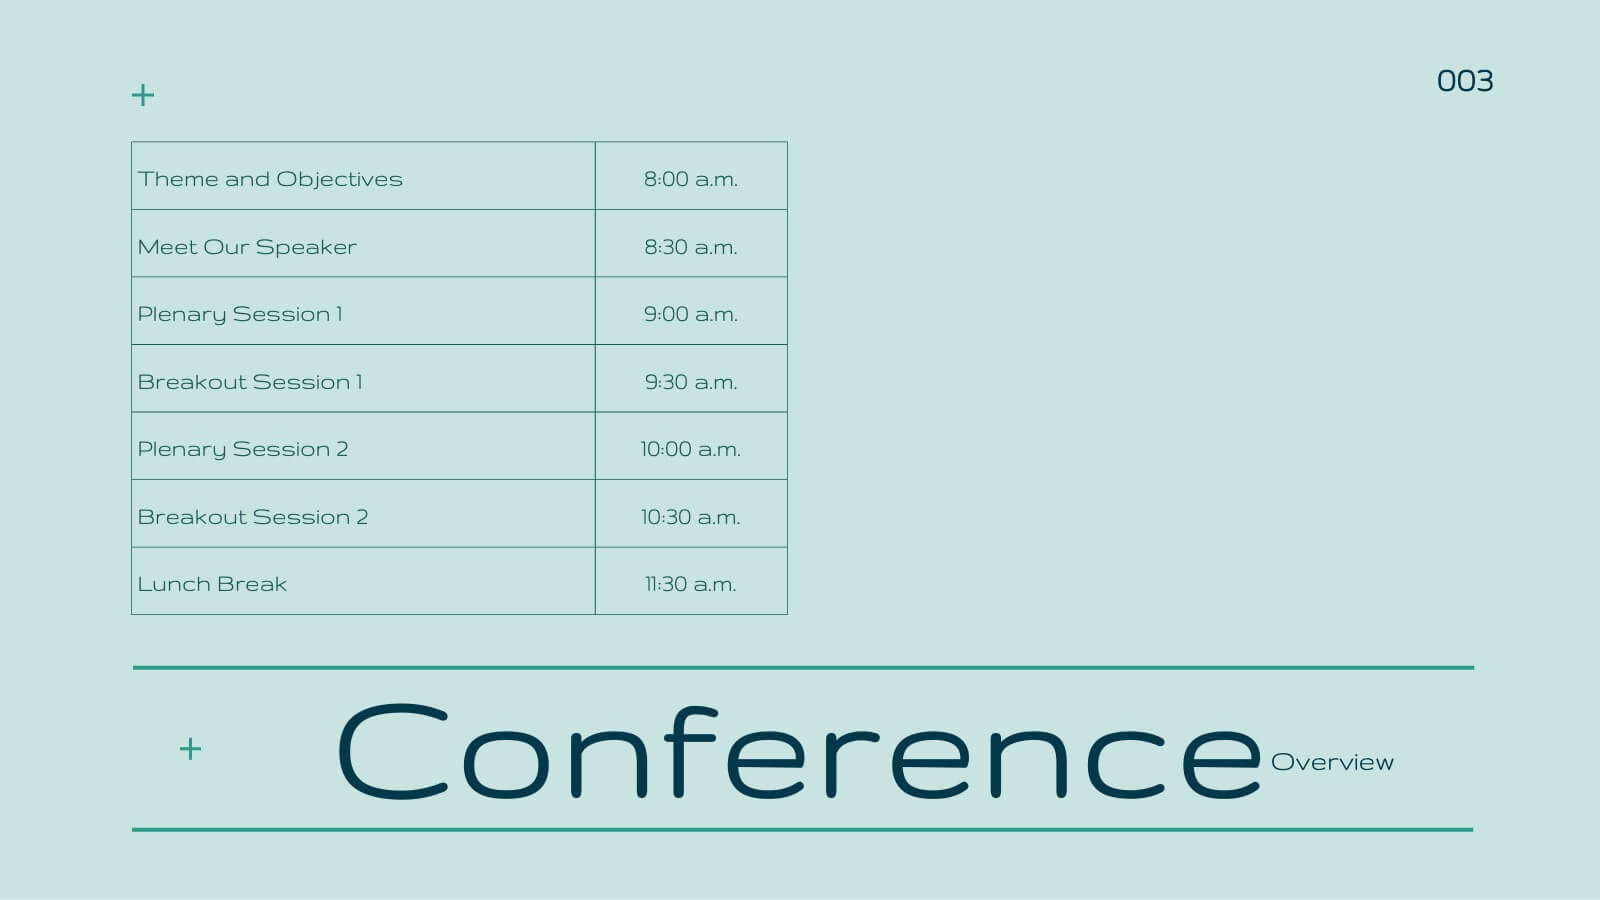
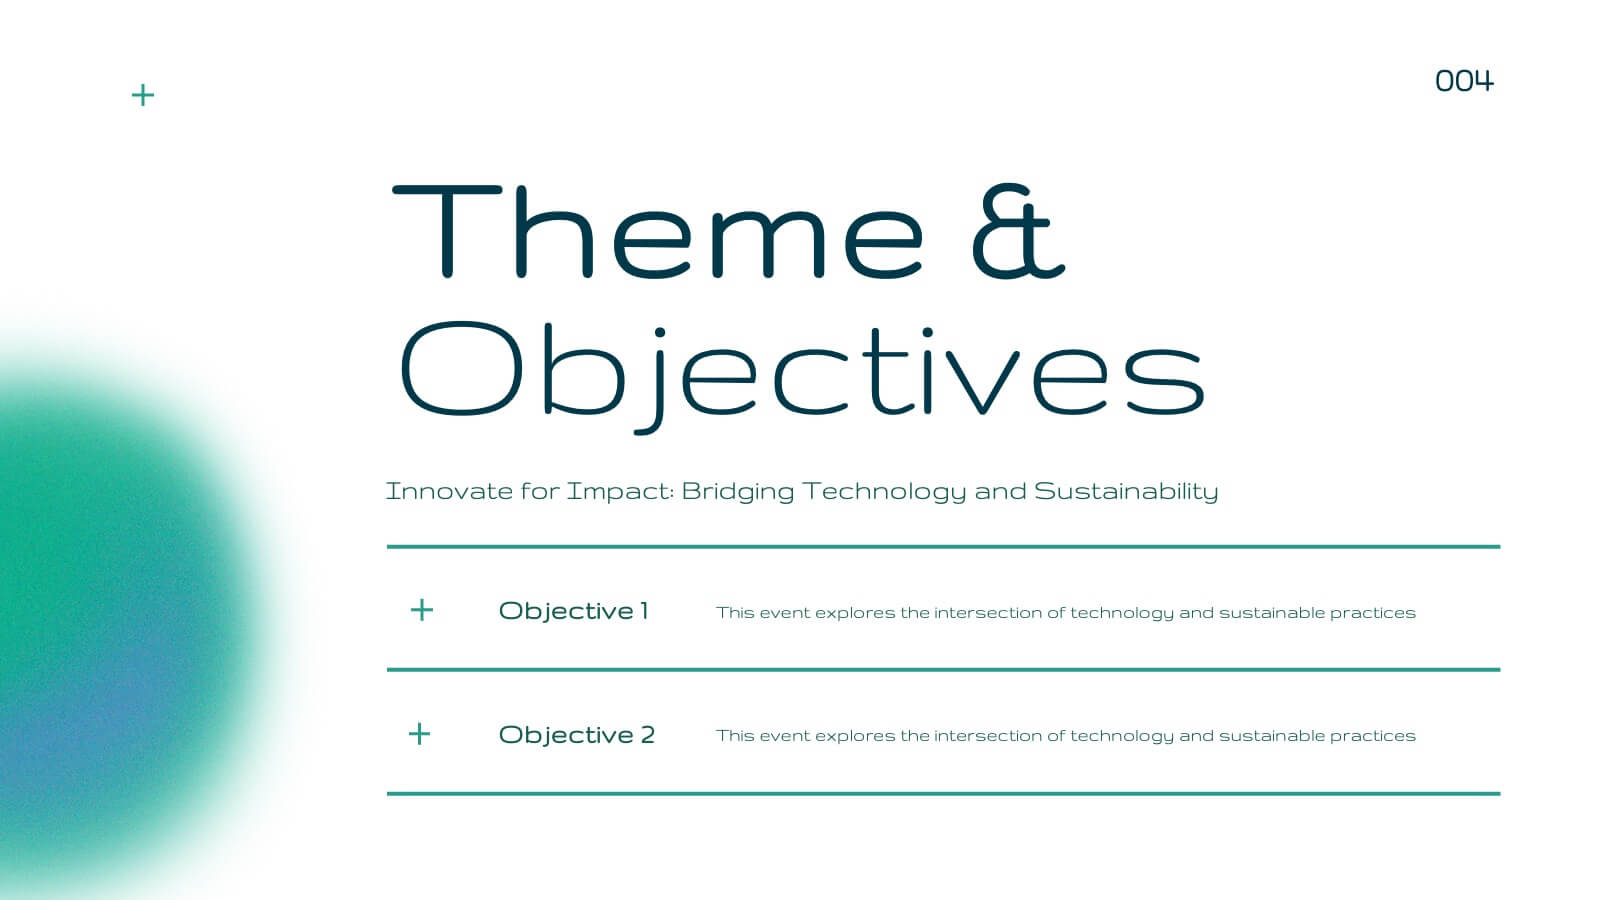
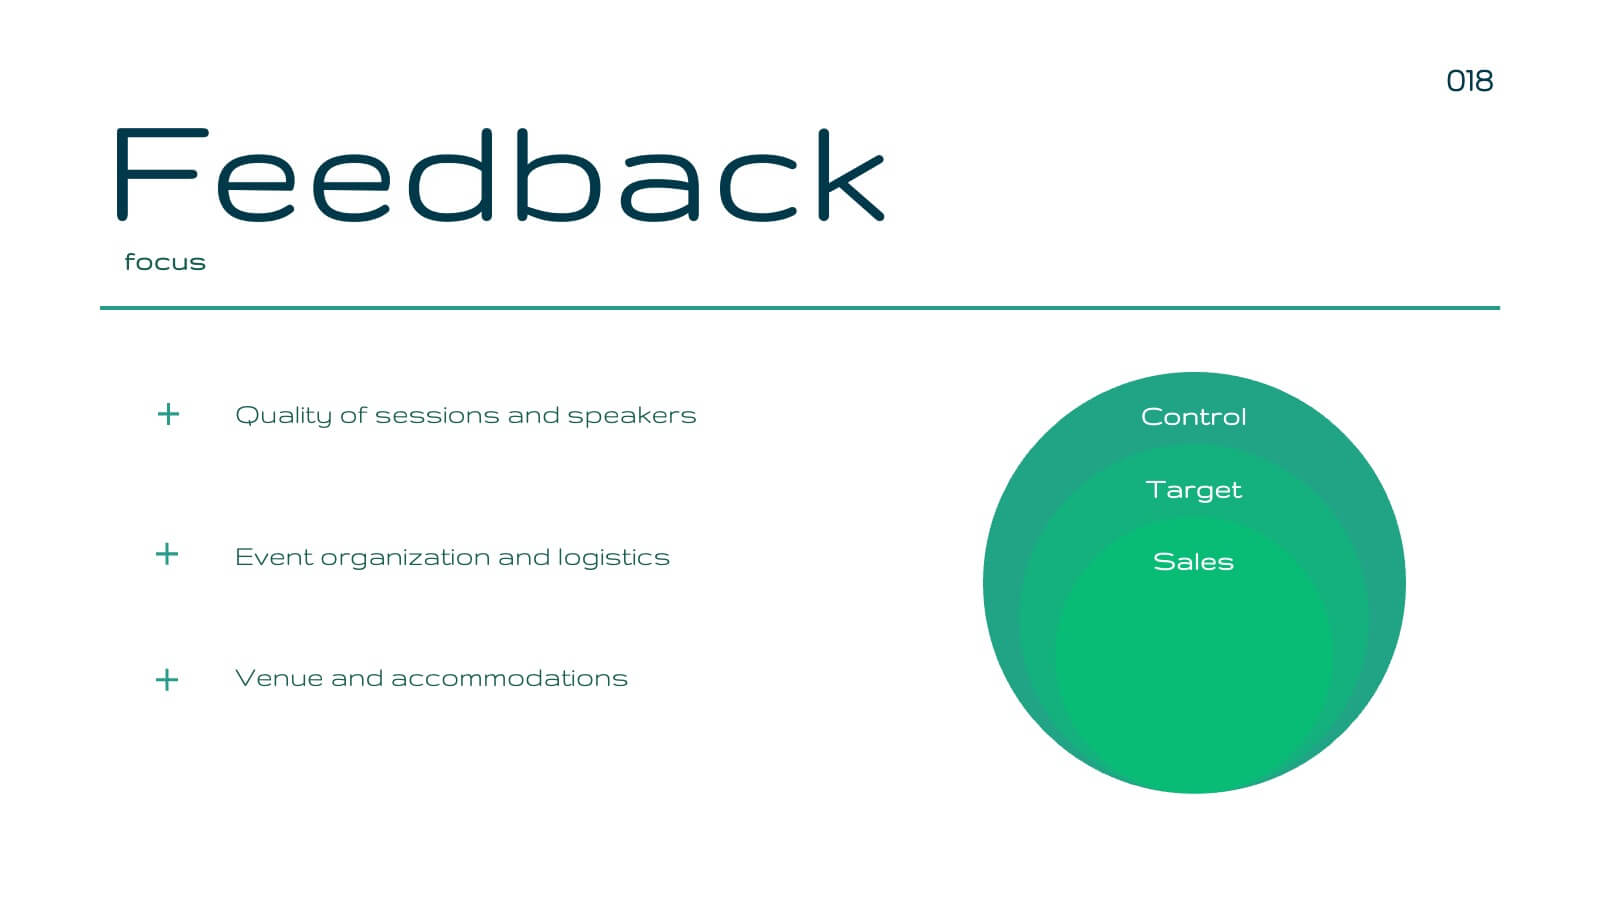
Blaze Business Operations Plan Presentation
Elevate your business presentations with this elegant, modern template designed for comprehensive business operations. Perfect for covering themes, objectives, workshops, and panel discussions, it ensures a professional and engaging delivery. The clean design and structured layout enhance clarity and impact. Compatible with PowerPoint, Keynote, and Google Slides, it’s versatile for any platform.