


Características


¿Tienes alguna pregunta?
Recomendar


10 diapositivas
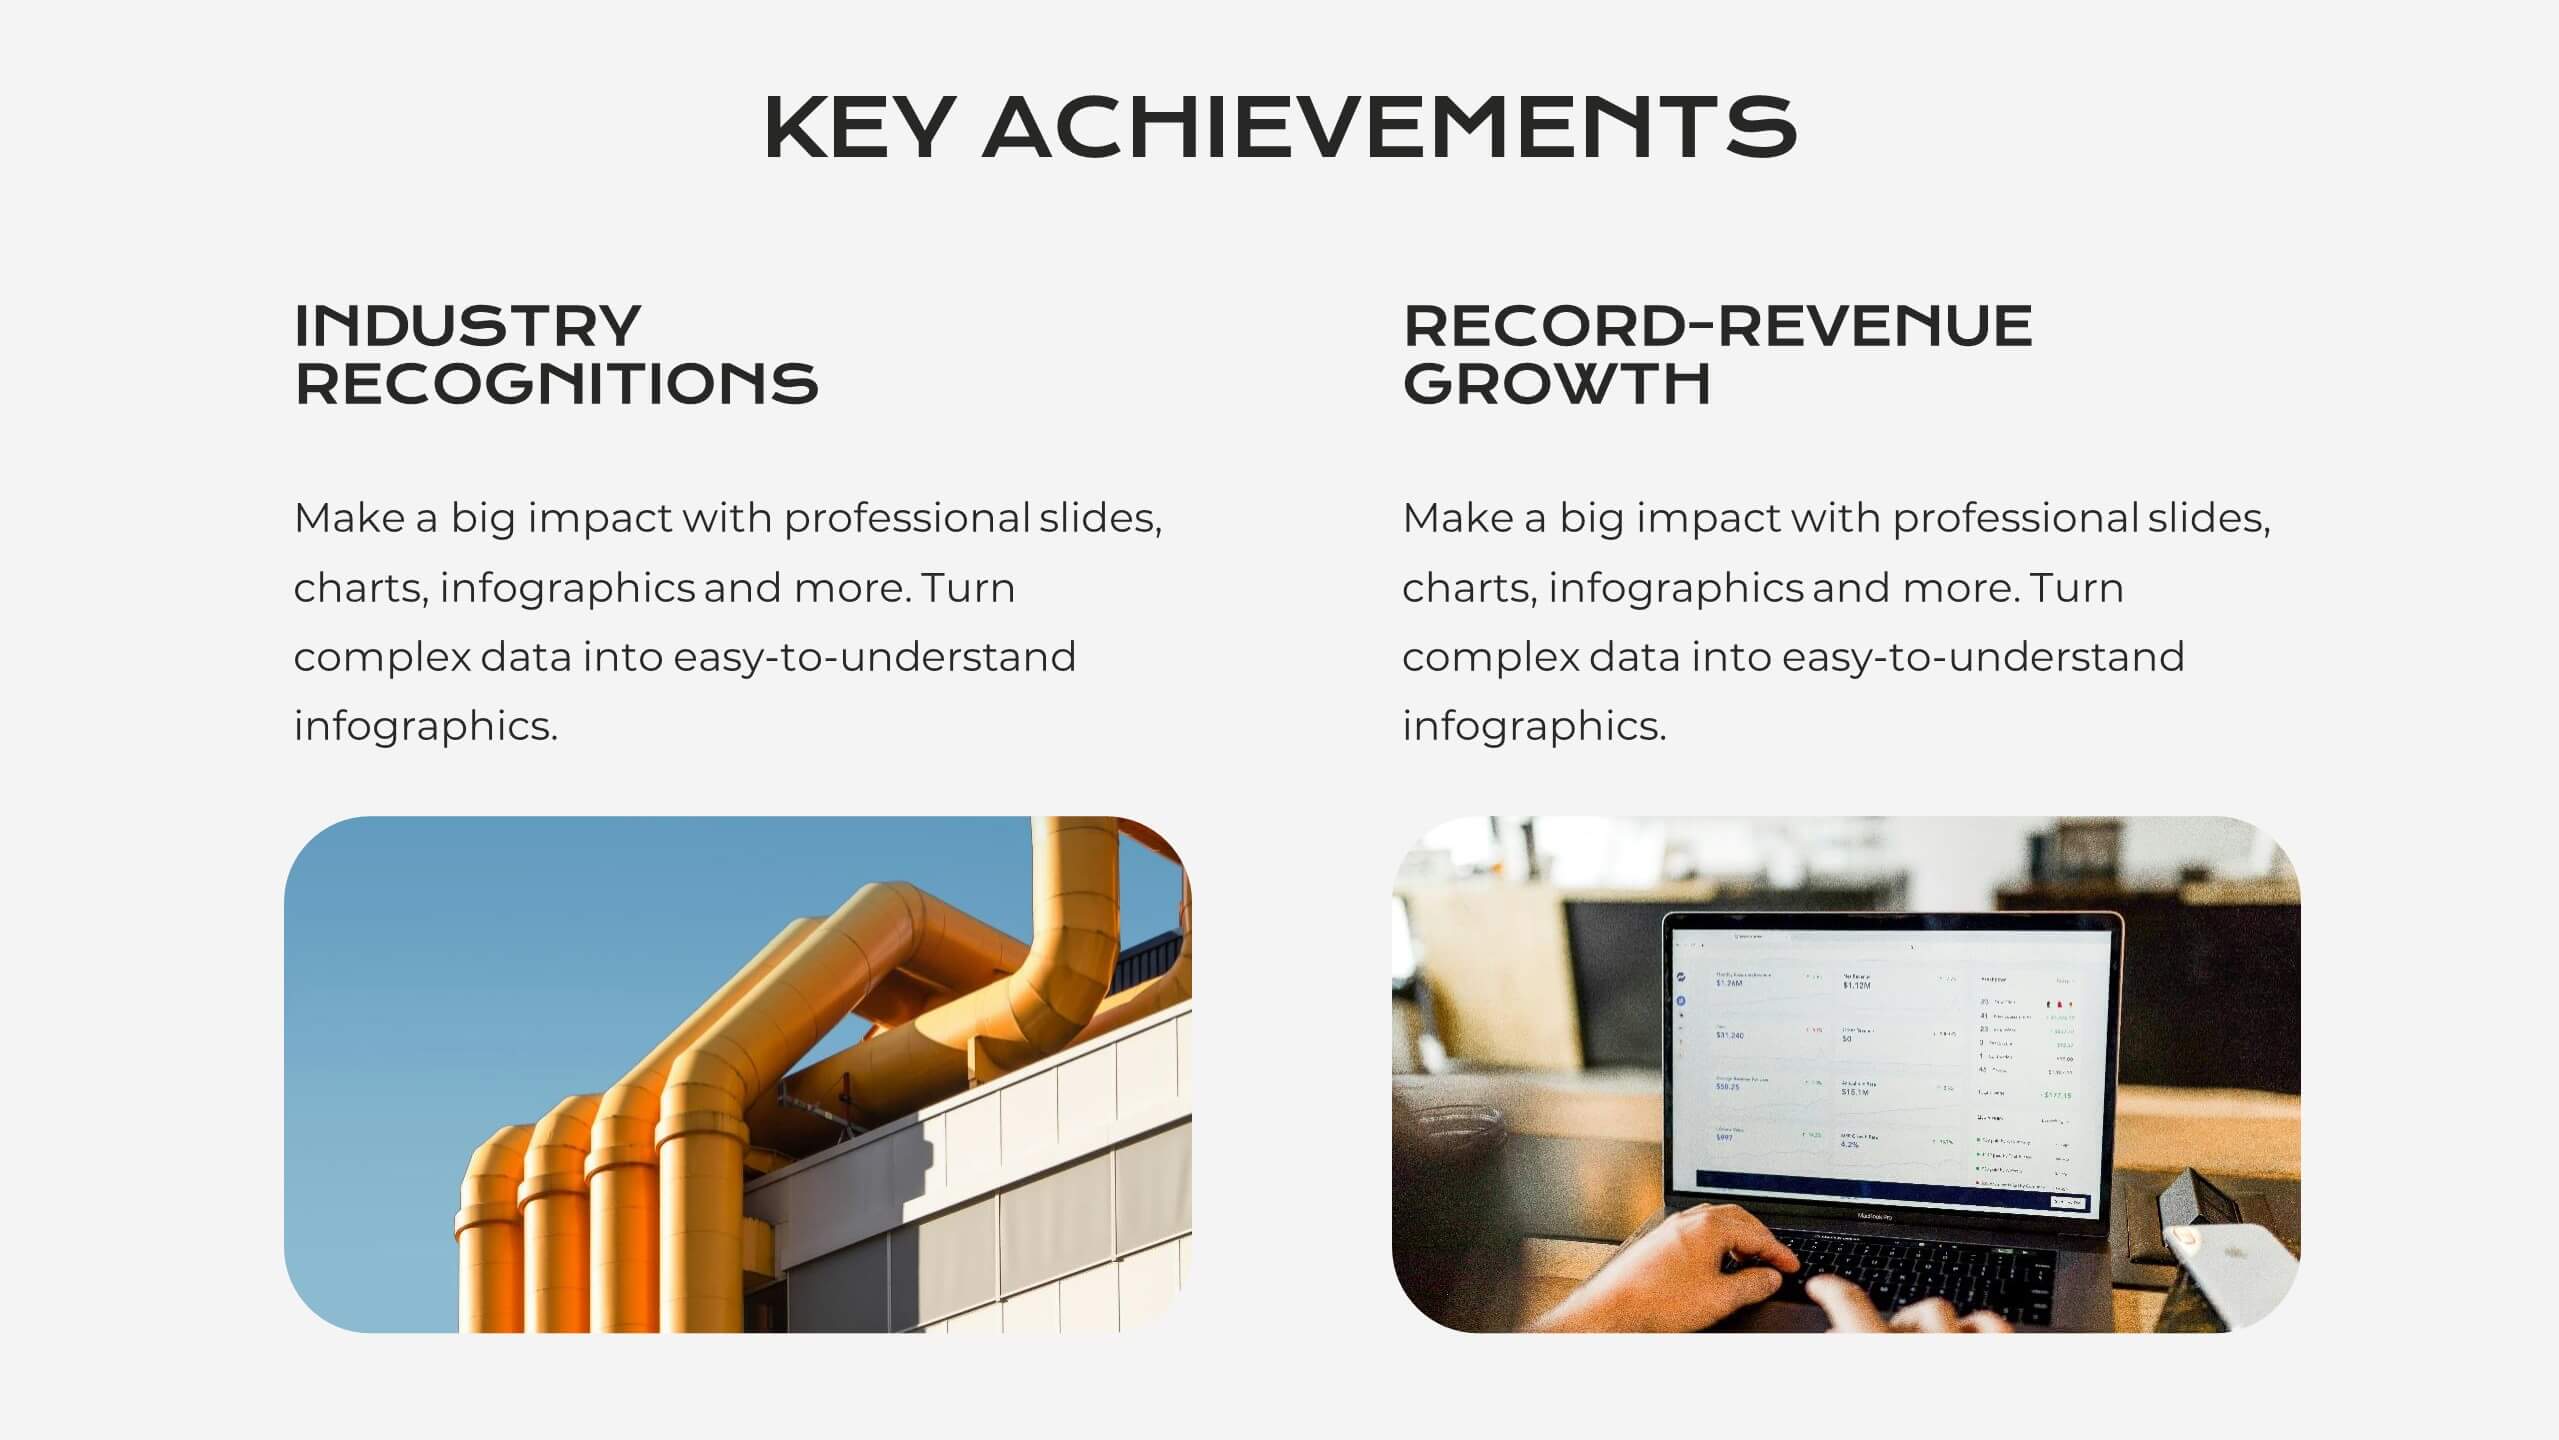
Corporate Briefing Schedule Agenda
Present your briefing points clearly with the Corporate Briefing Schedule Agenda Presentation. This linear layout uses bold icons, color-coded sections, and connecting lines to outline four key discussion items—ideal for company meetings, timelines, or project updates. Fully editable in PowerPoint, Keynote, and Google Slides.


4 diapositivas
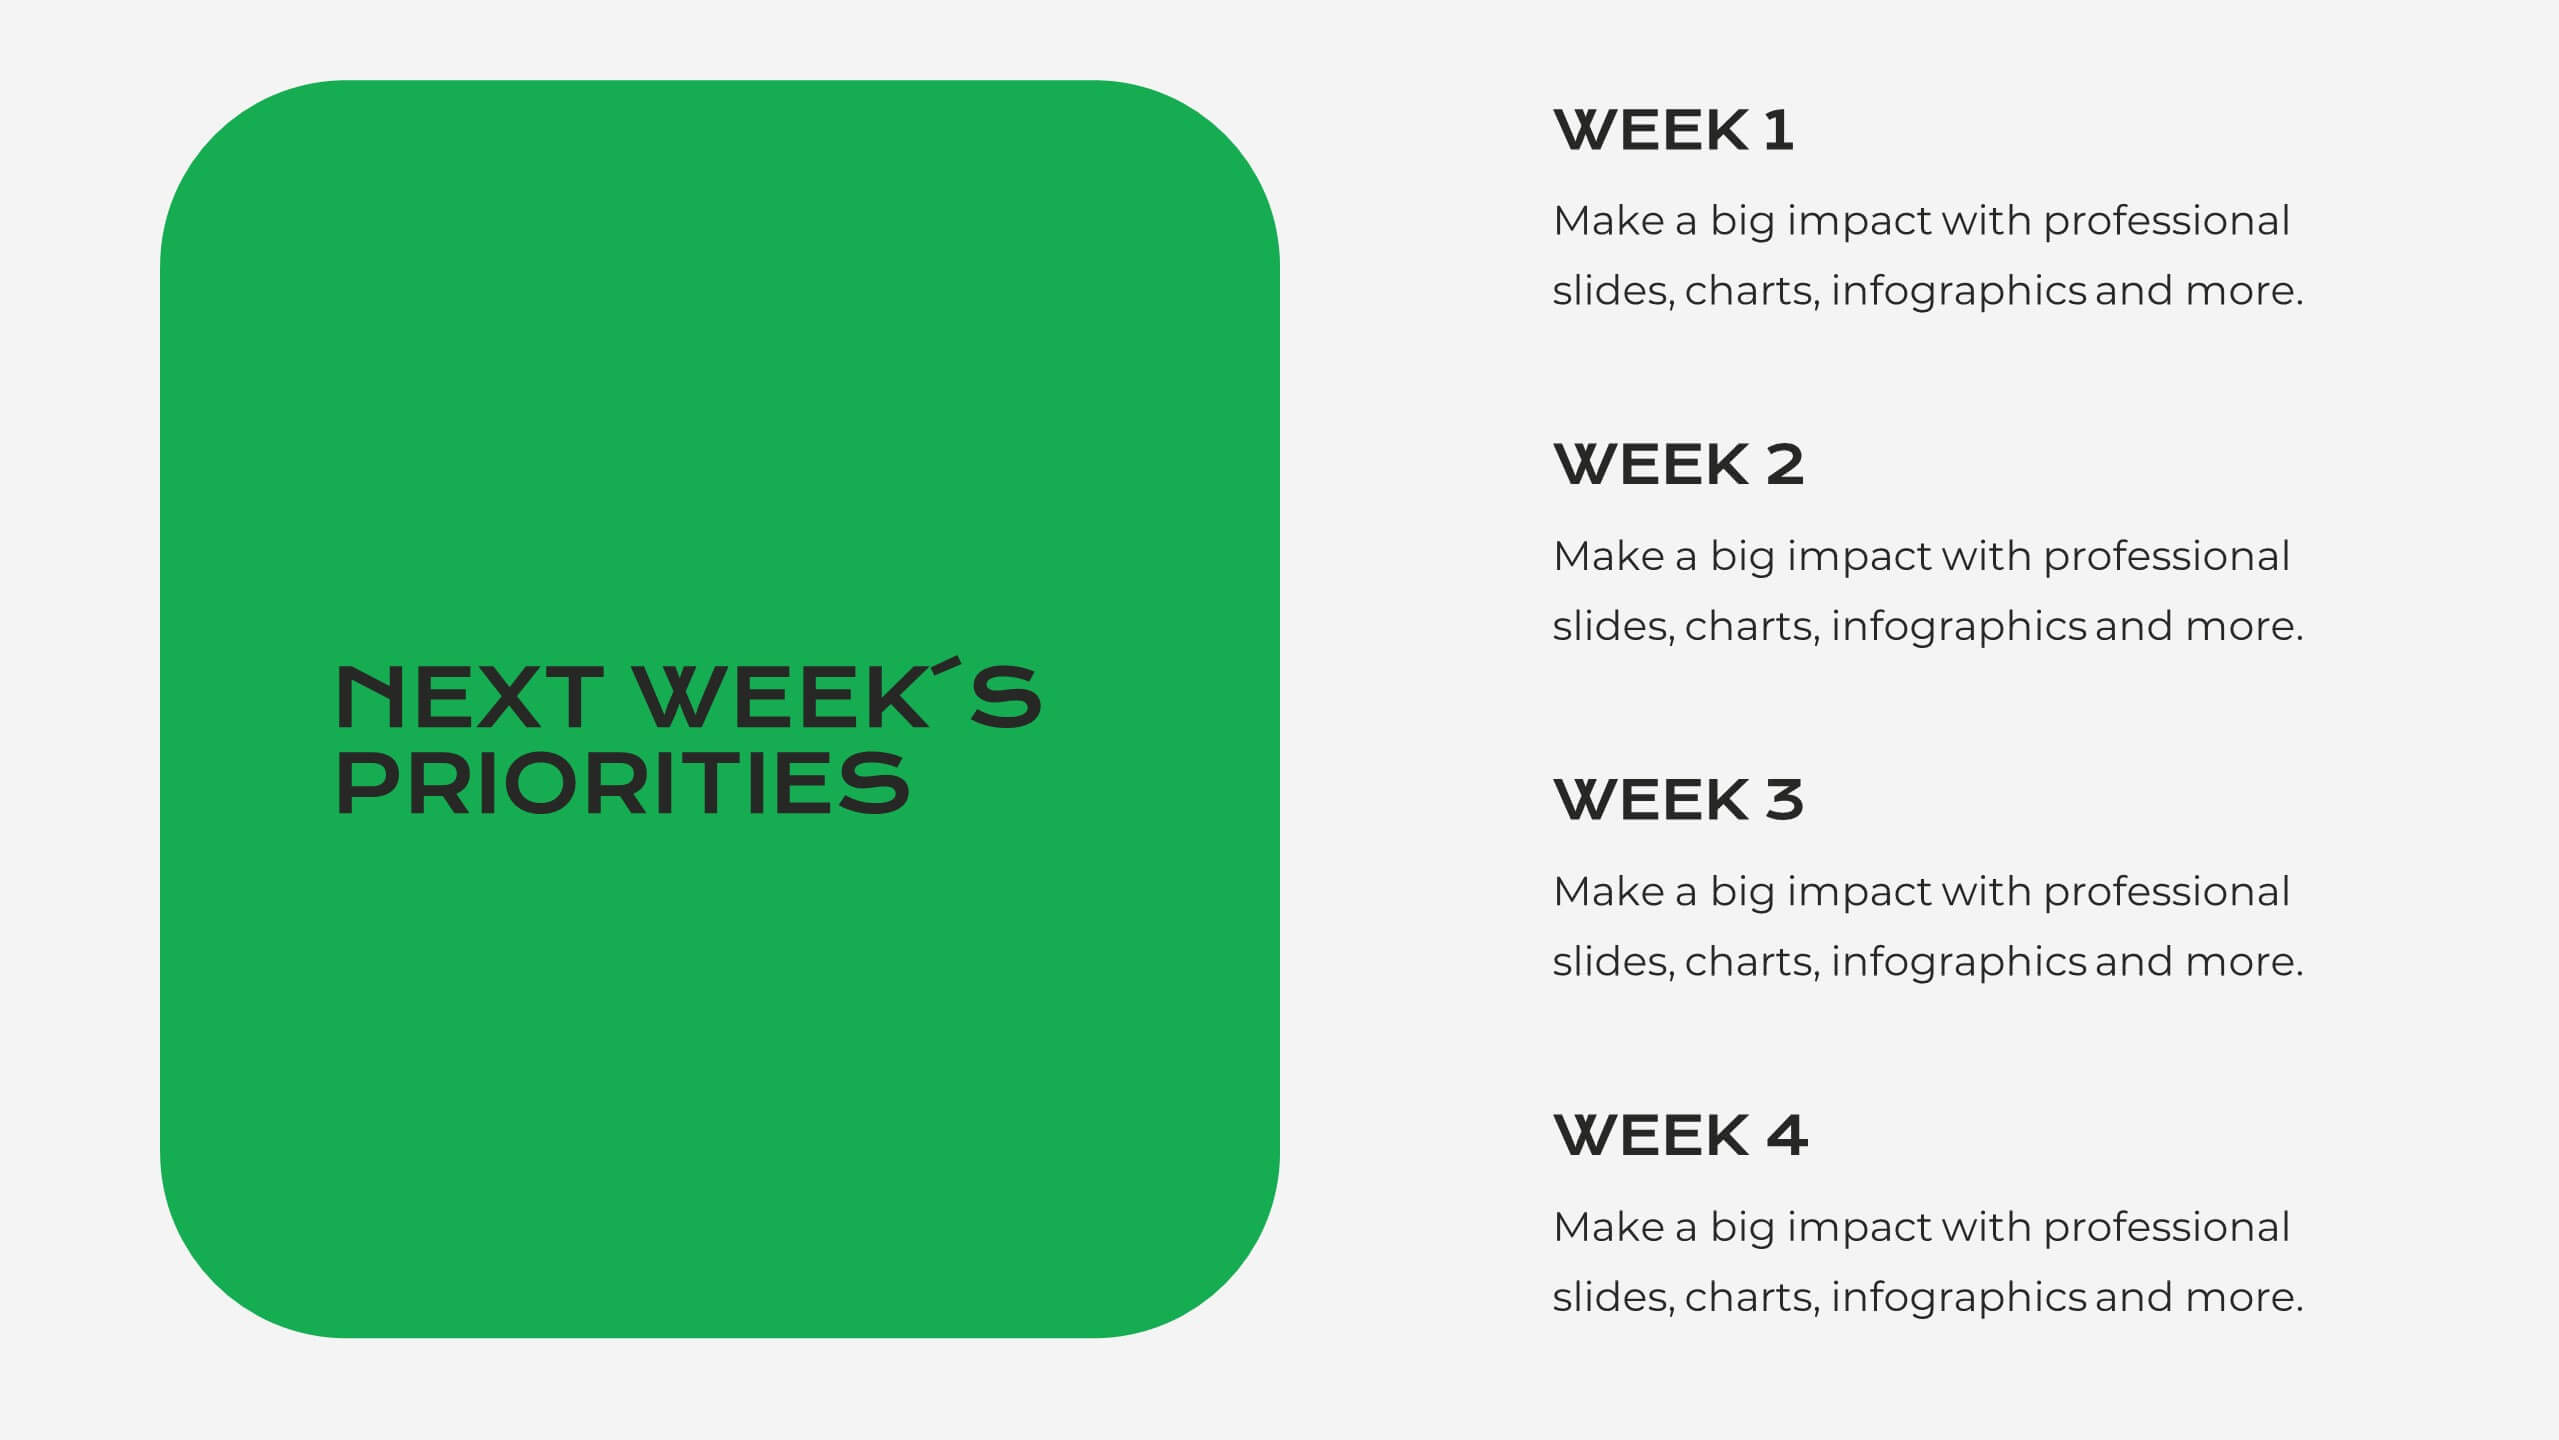
90-Day Success Plan for New Hires Presentation
Set your team up for success with this 90-Day Success Plan for New Hires Presentation. This template is perfect for onboarding workflows, outlining key milestones at 30, 60, and 90 days. Help managers and HR professionals communicate expectations clearly and track new employee progress. Fully editable in PowerPoint, Keynote, and Google Slides.


6 diapositivas
Company Expansion Timeline Presentation
Show your company’s growth story in a way that’s both professional and visually captivating. This presentation template helps you outline milestones, future goals, and expansion phases with clarity and style. Fully customizable and compatible with PowerPoint, Keynote, and Google Slides for effortless editing and polished results.

21 diapositivas
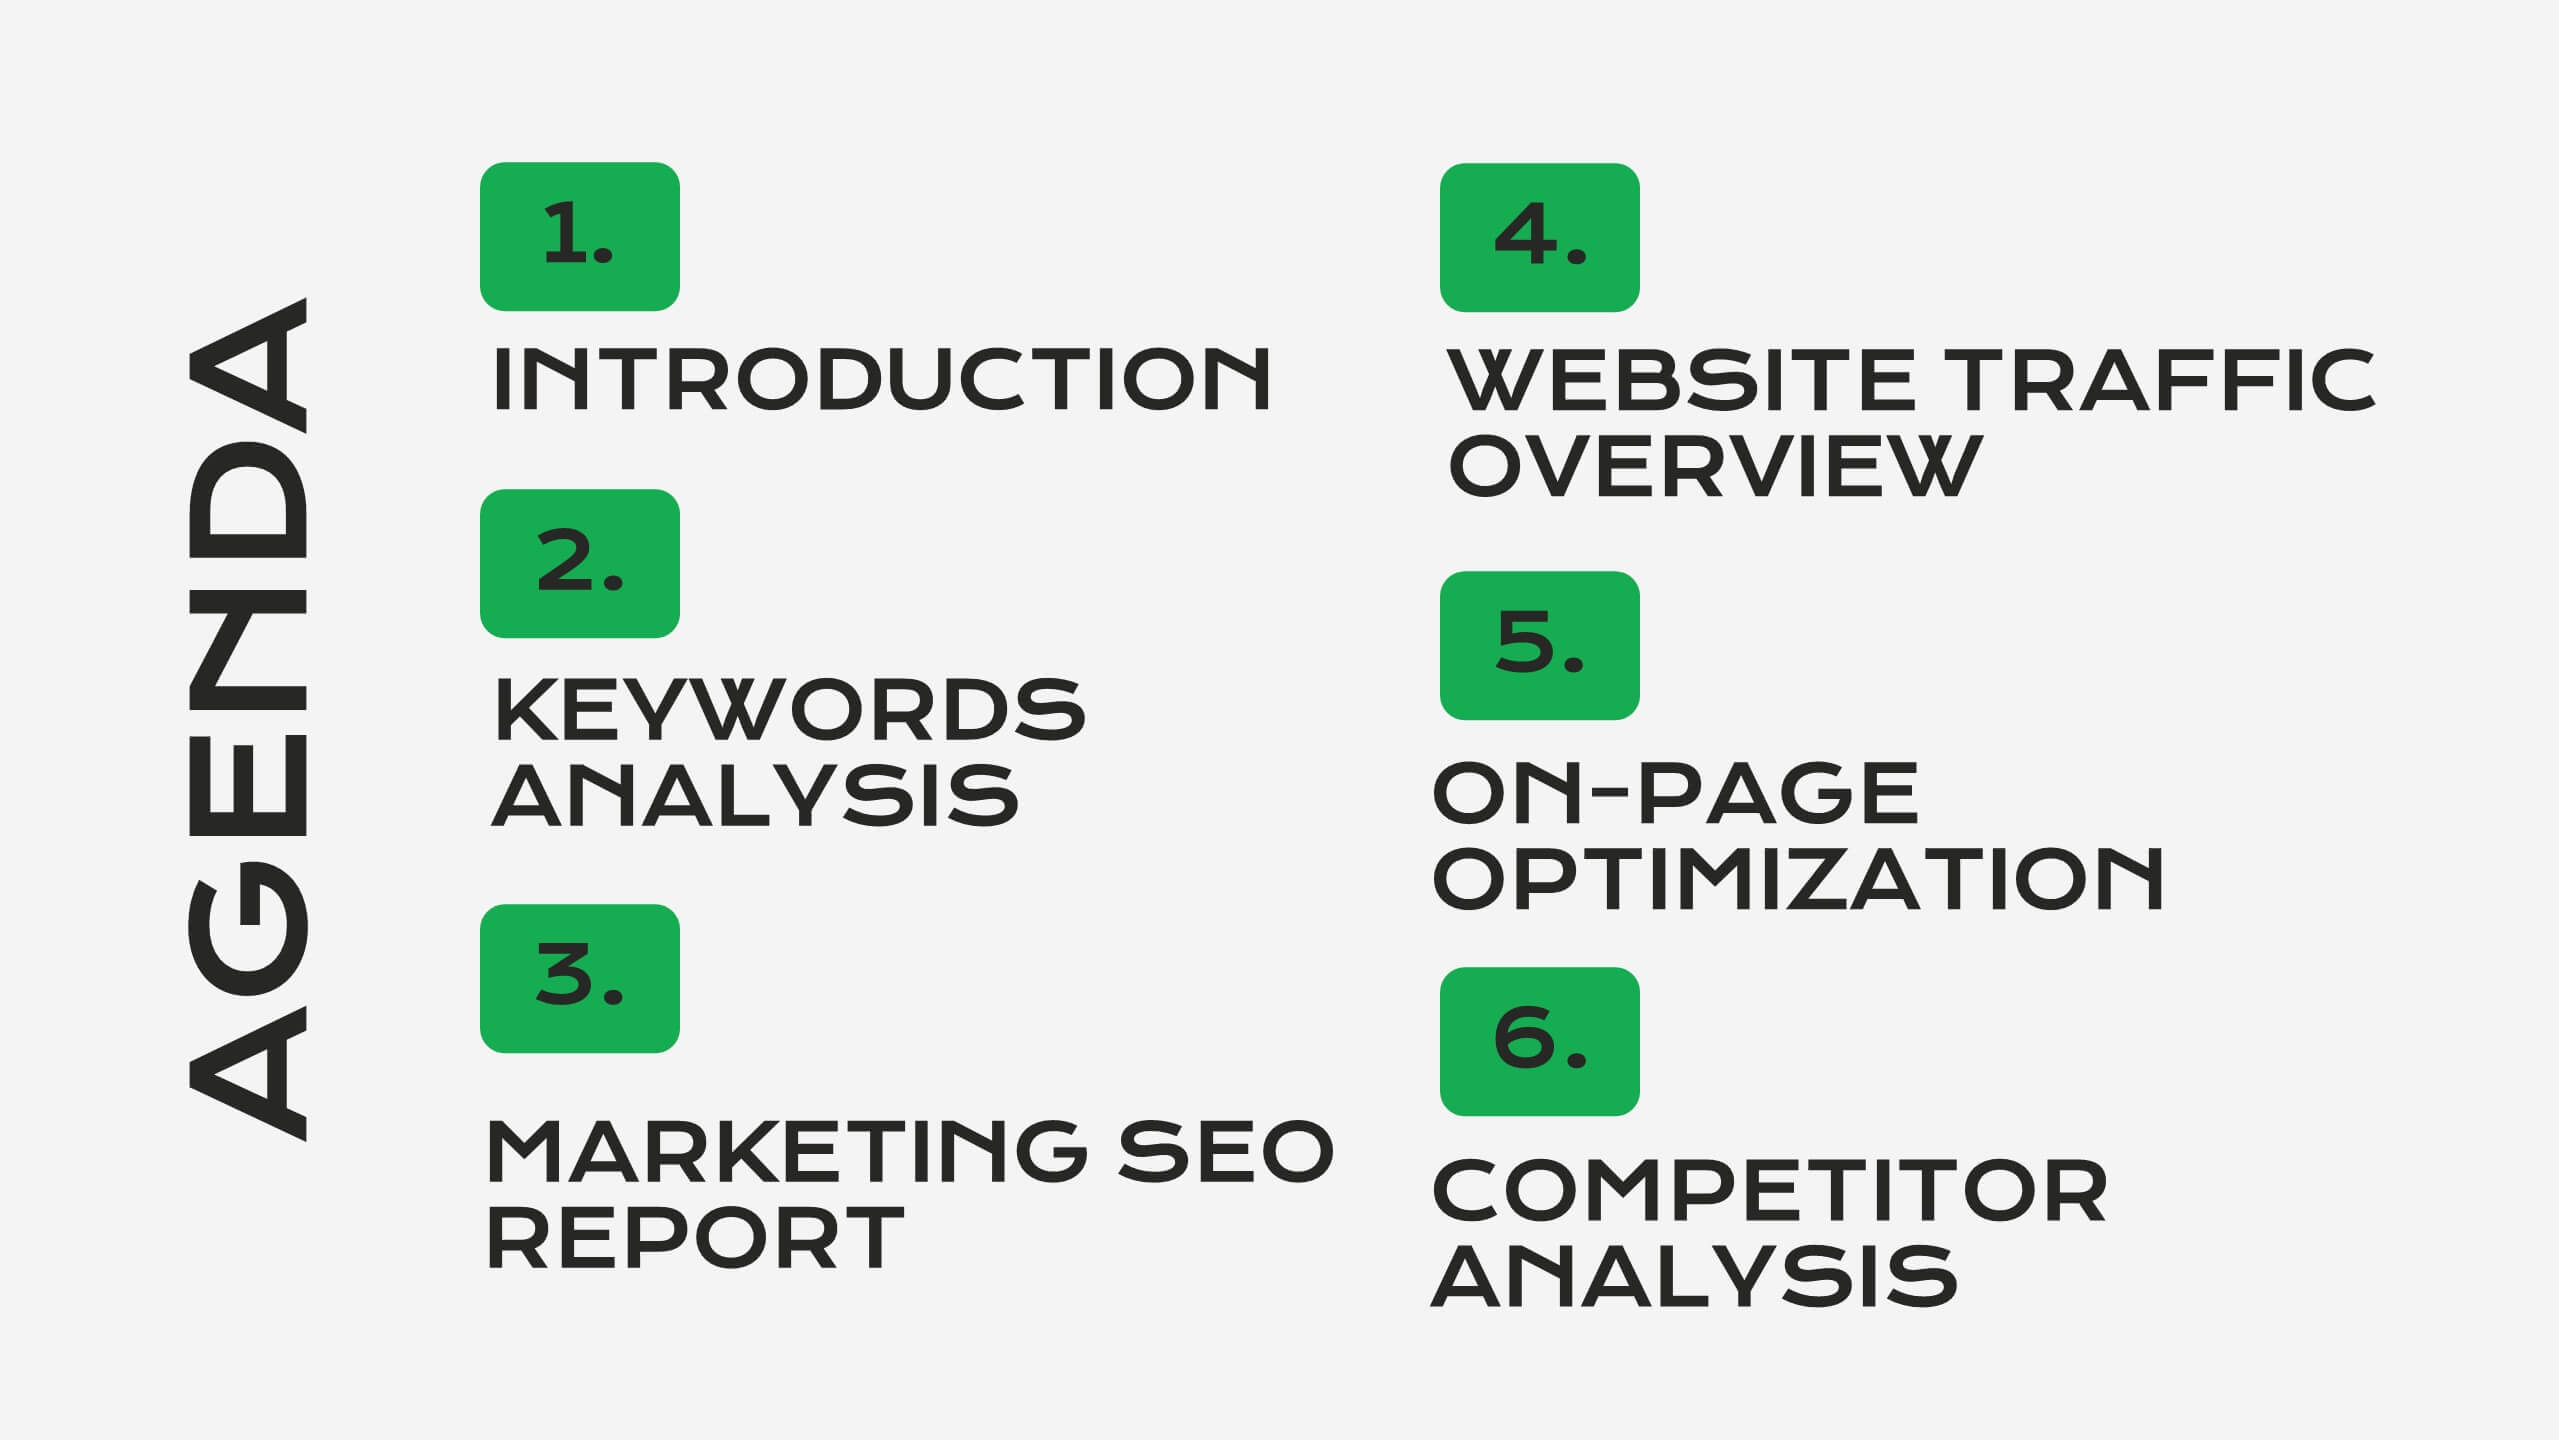
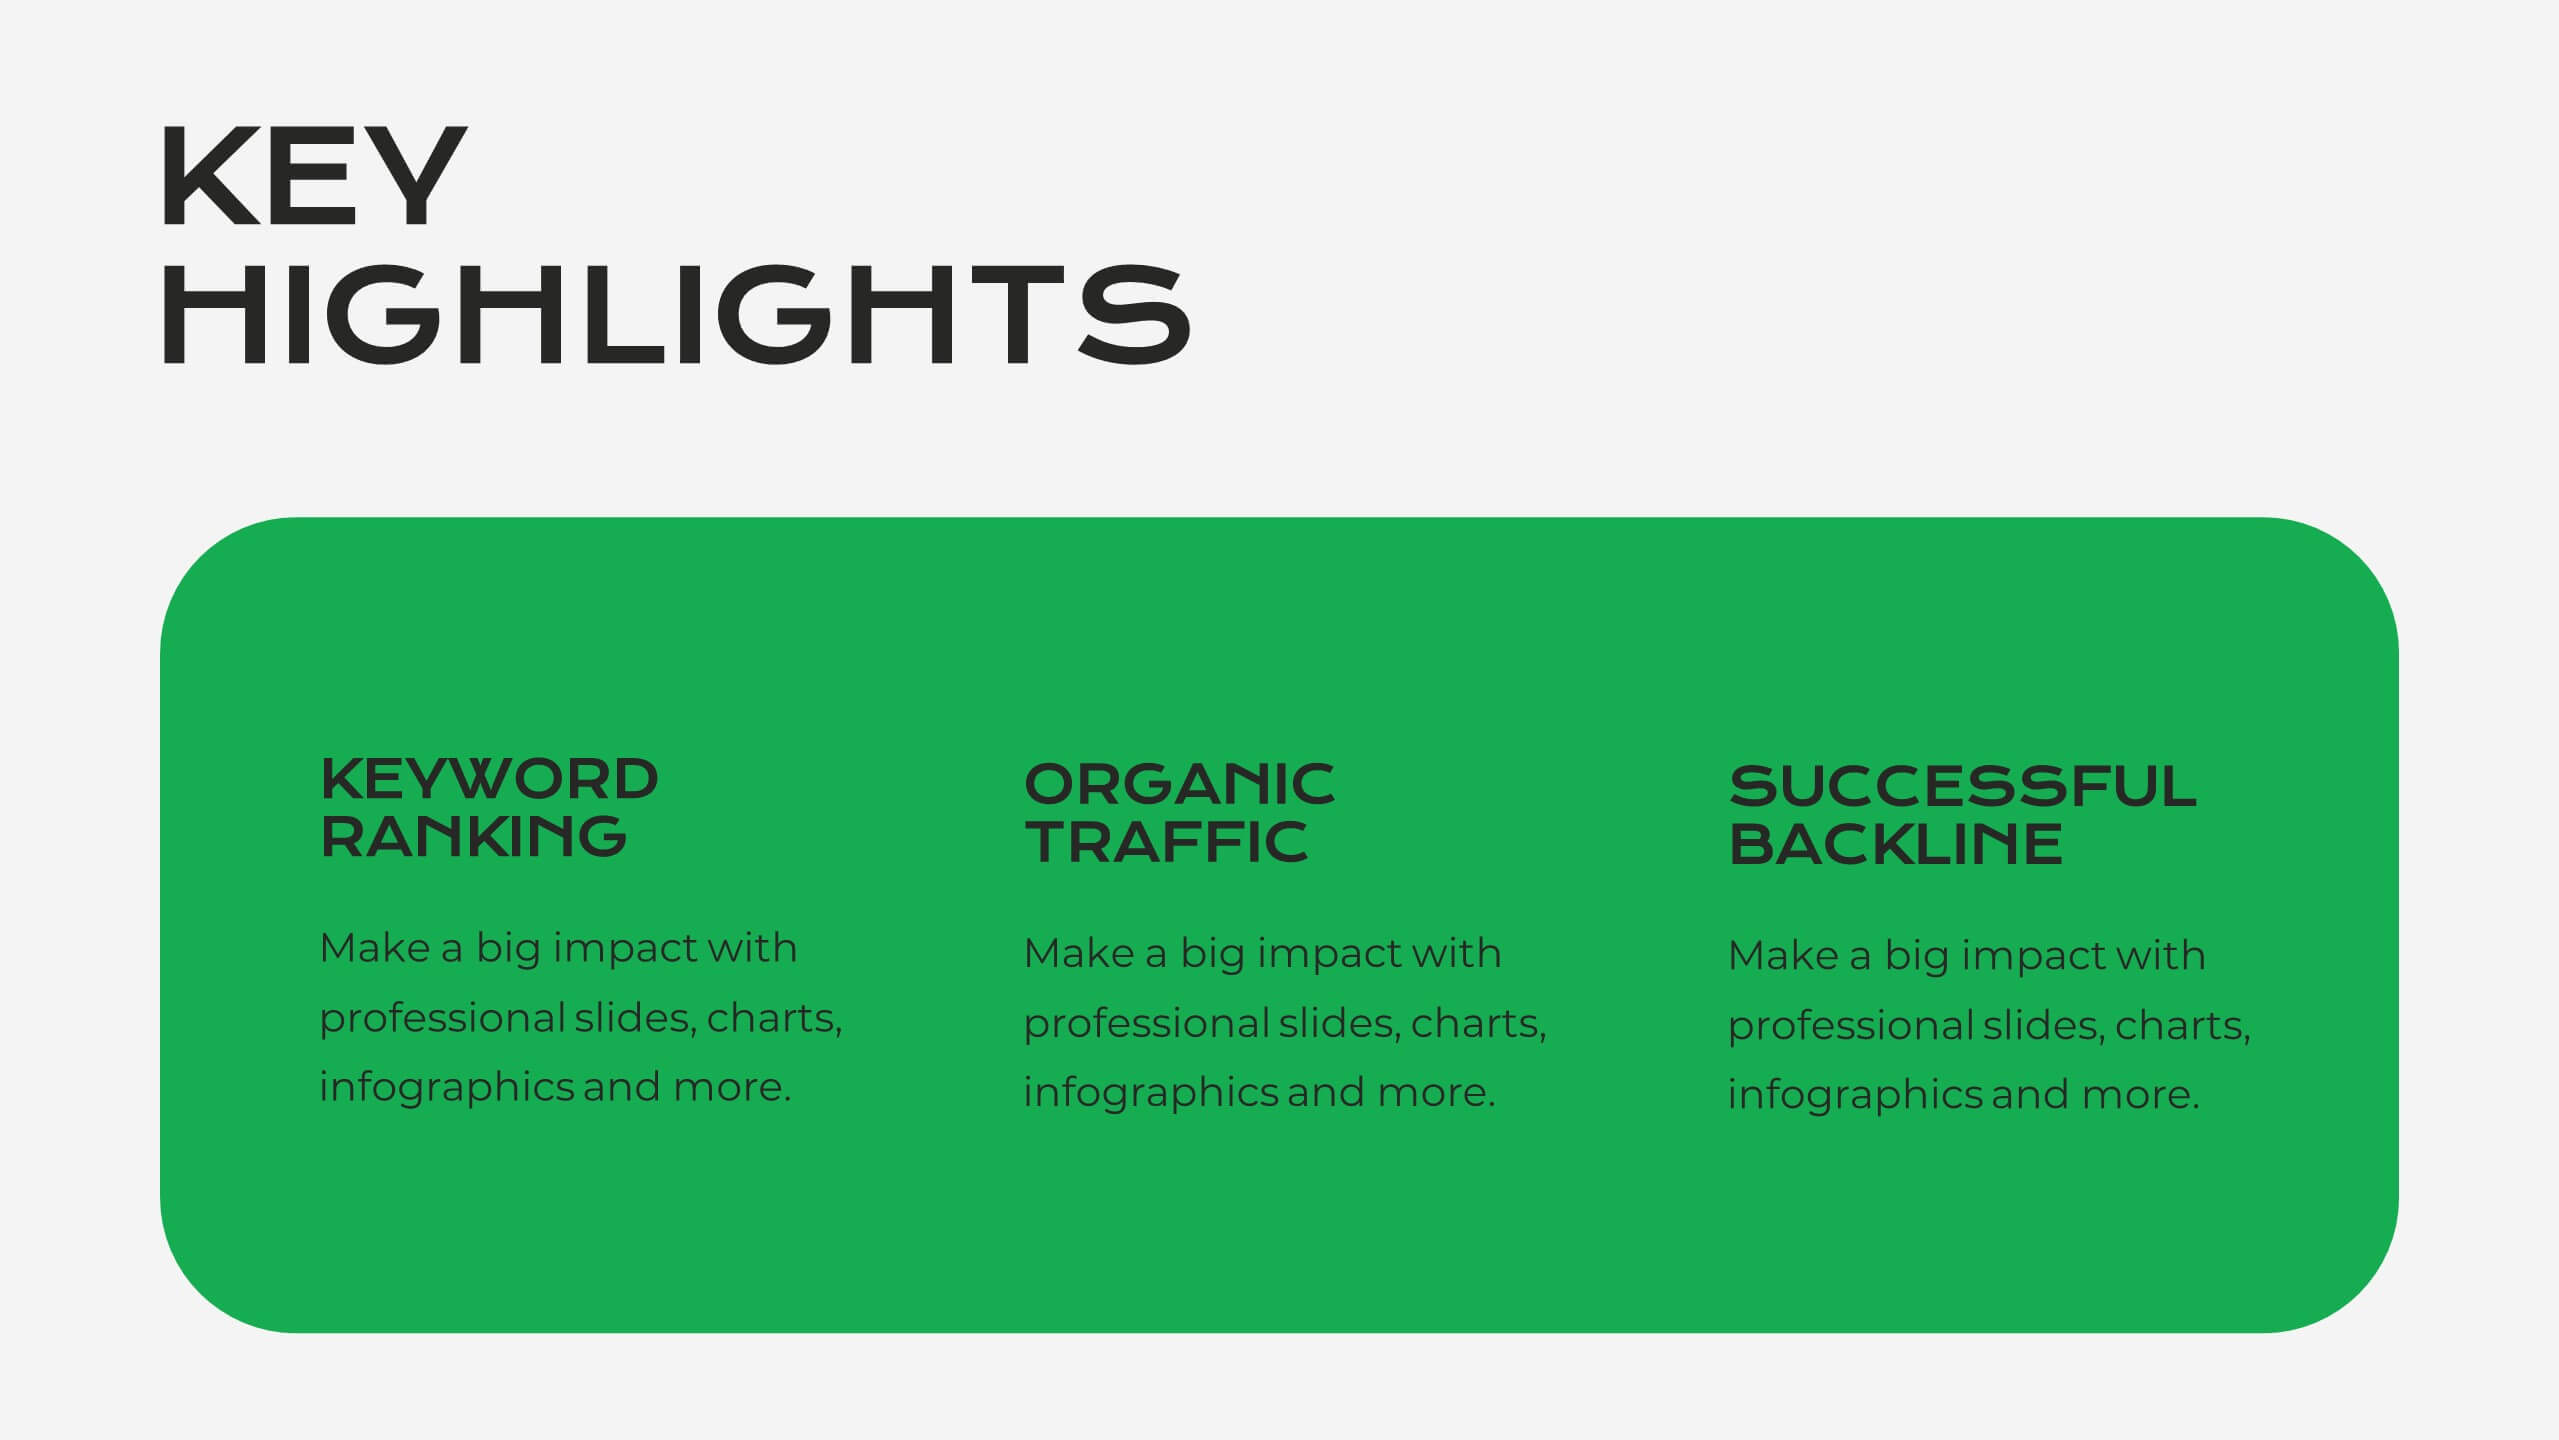
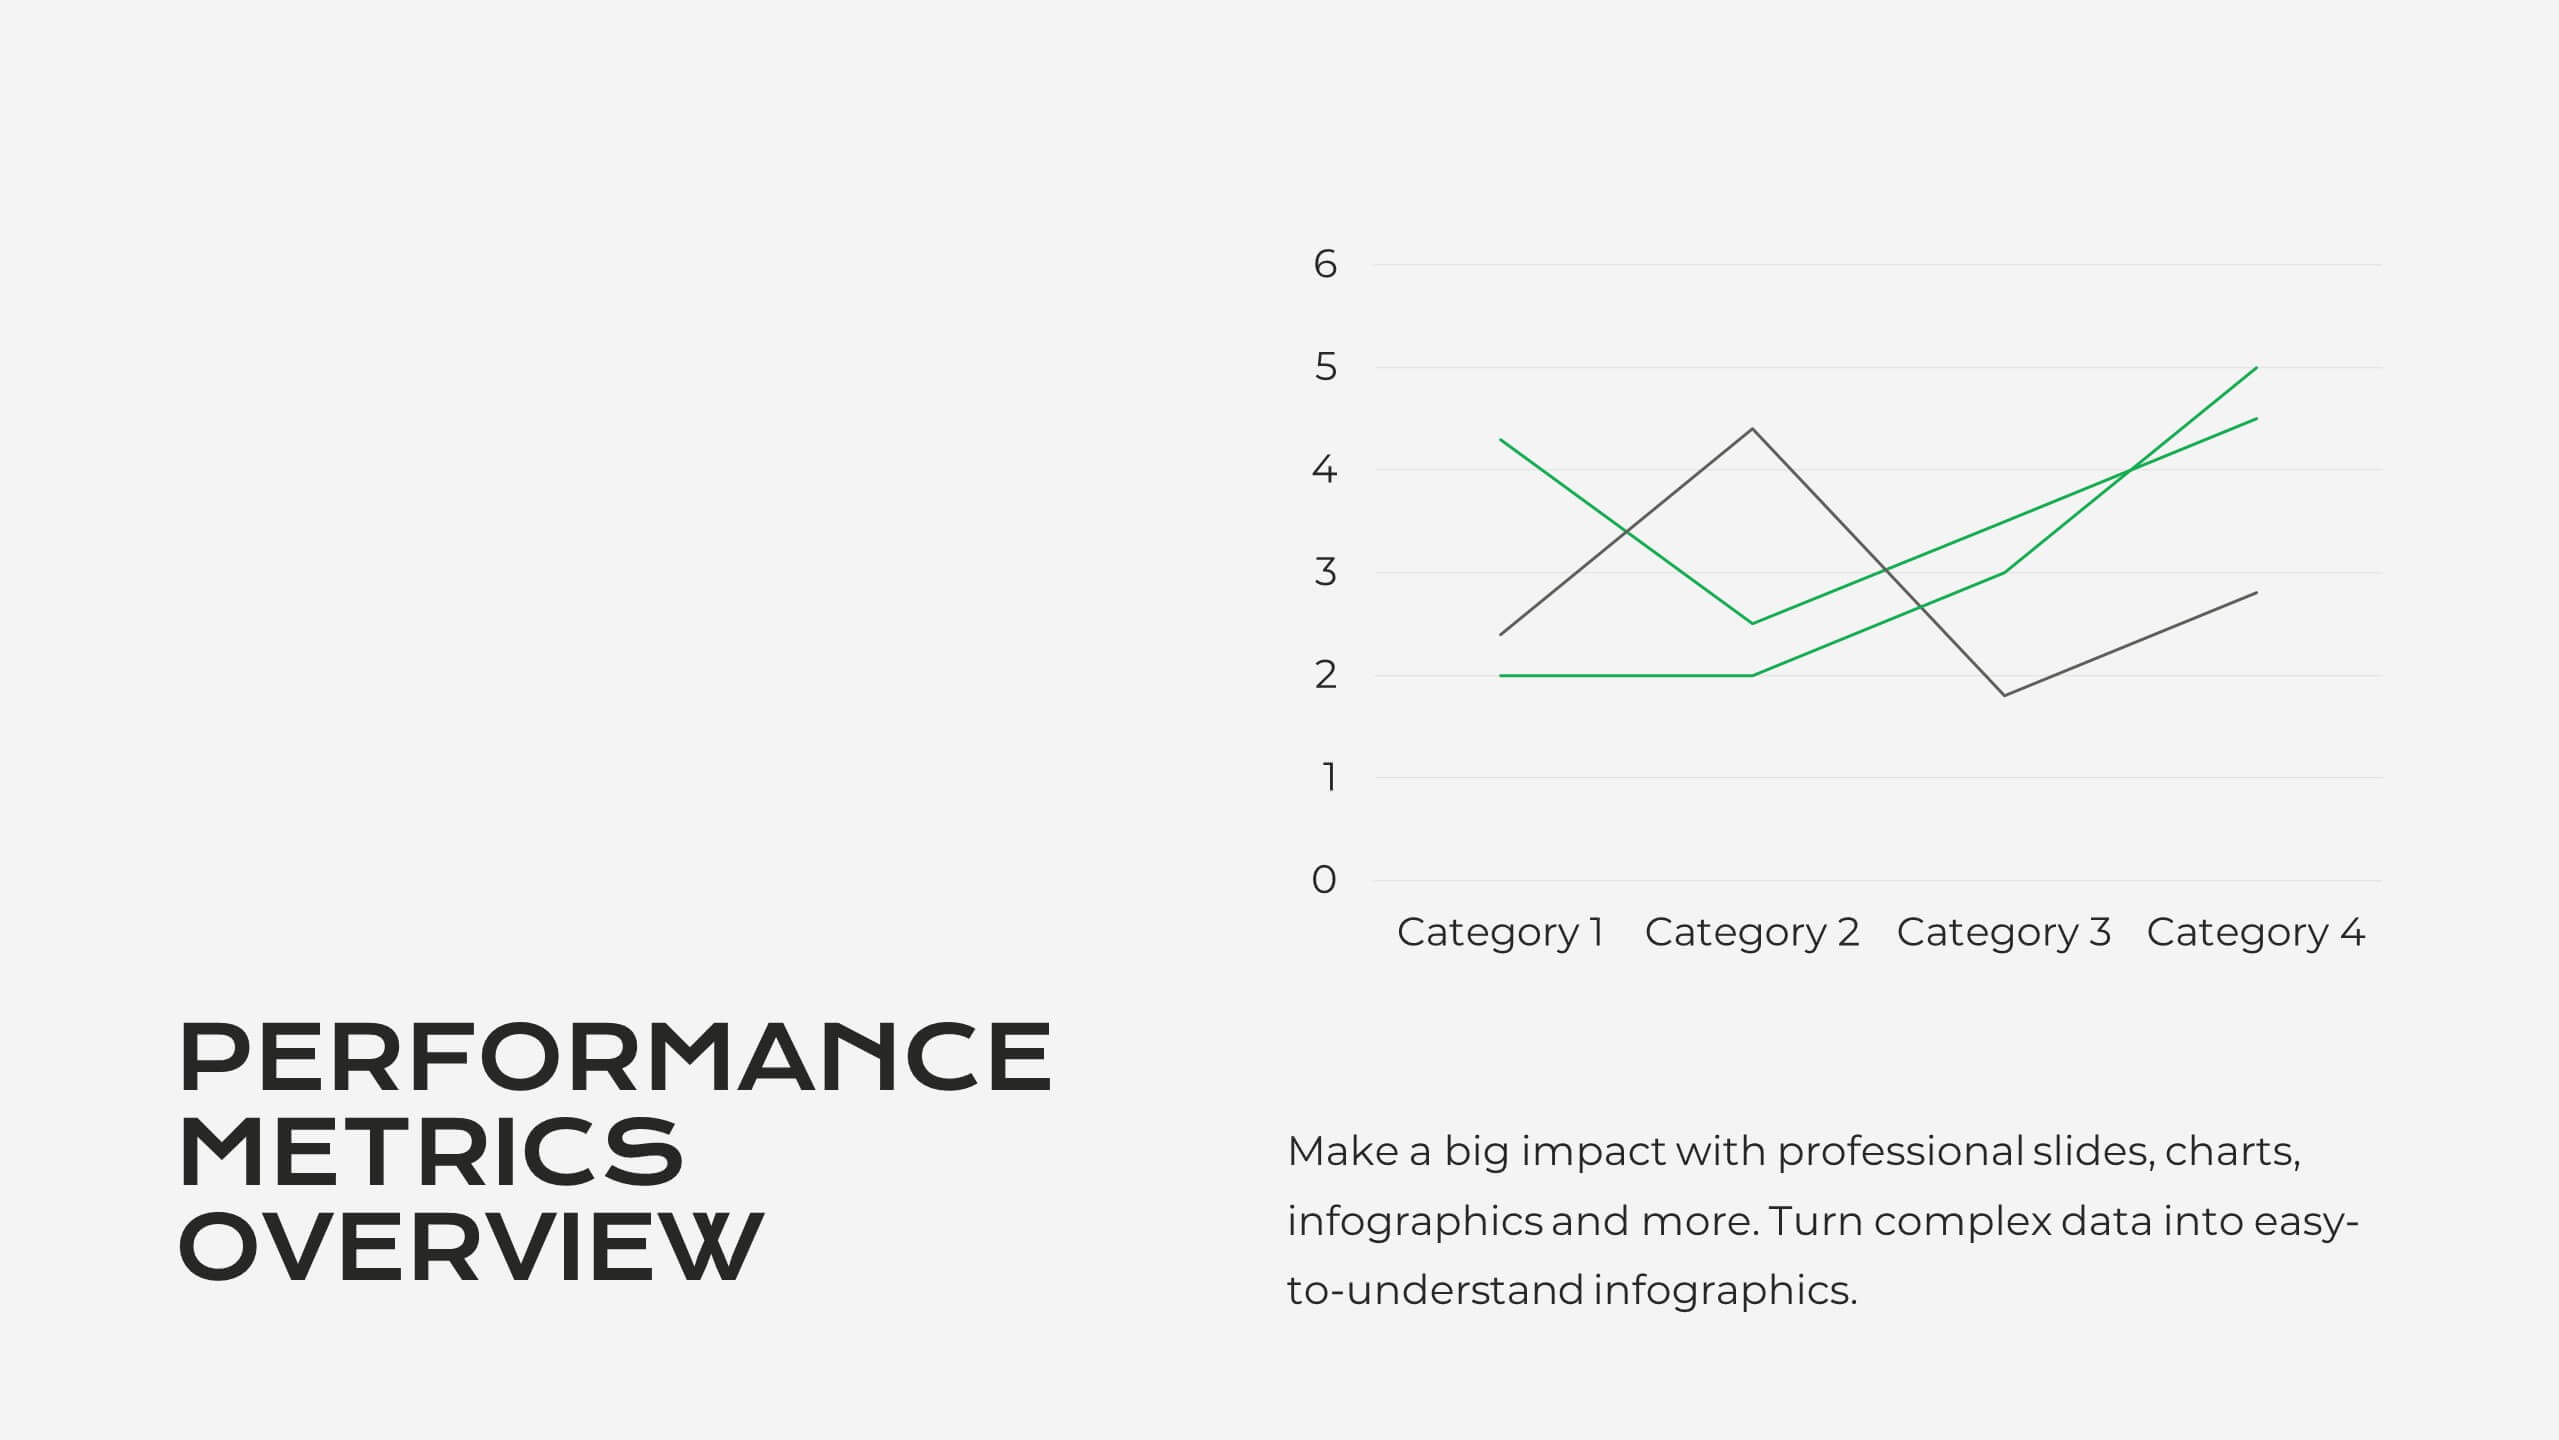
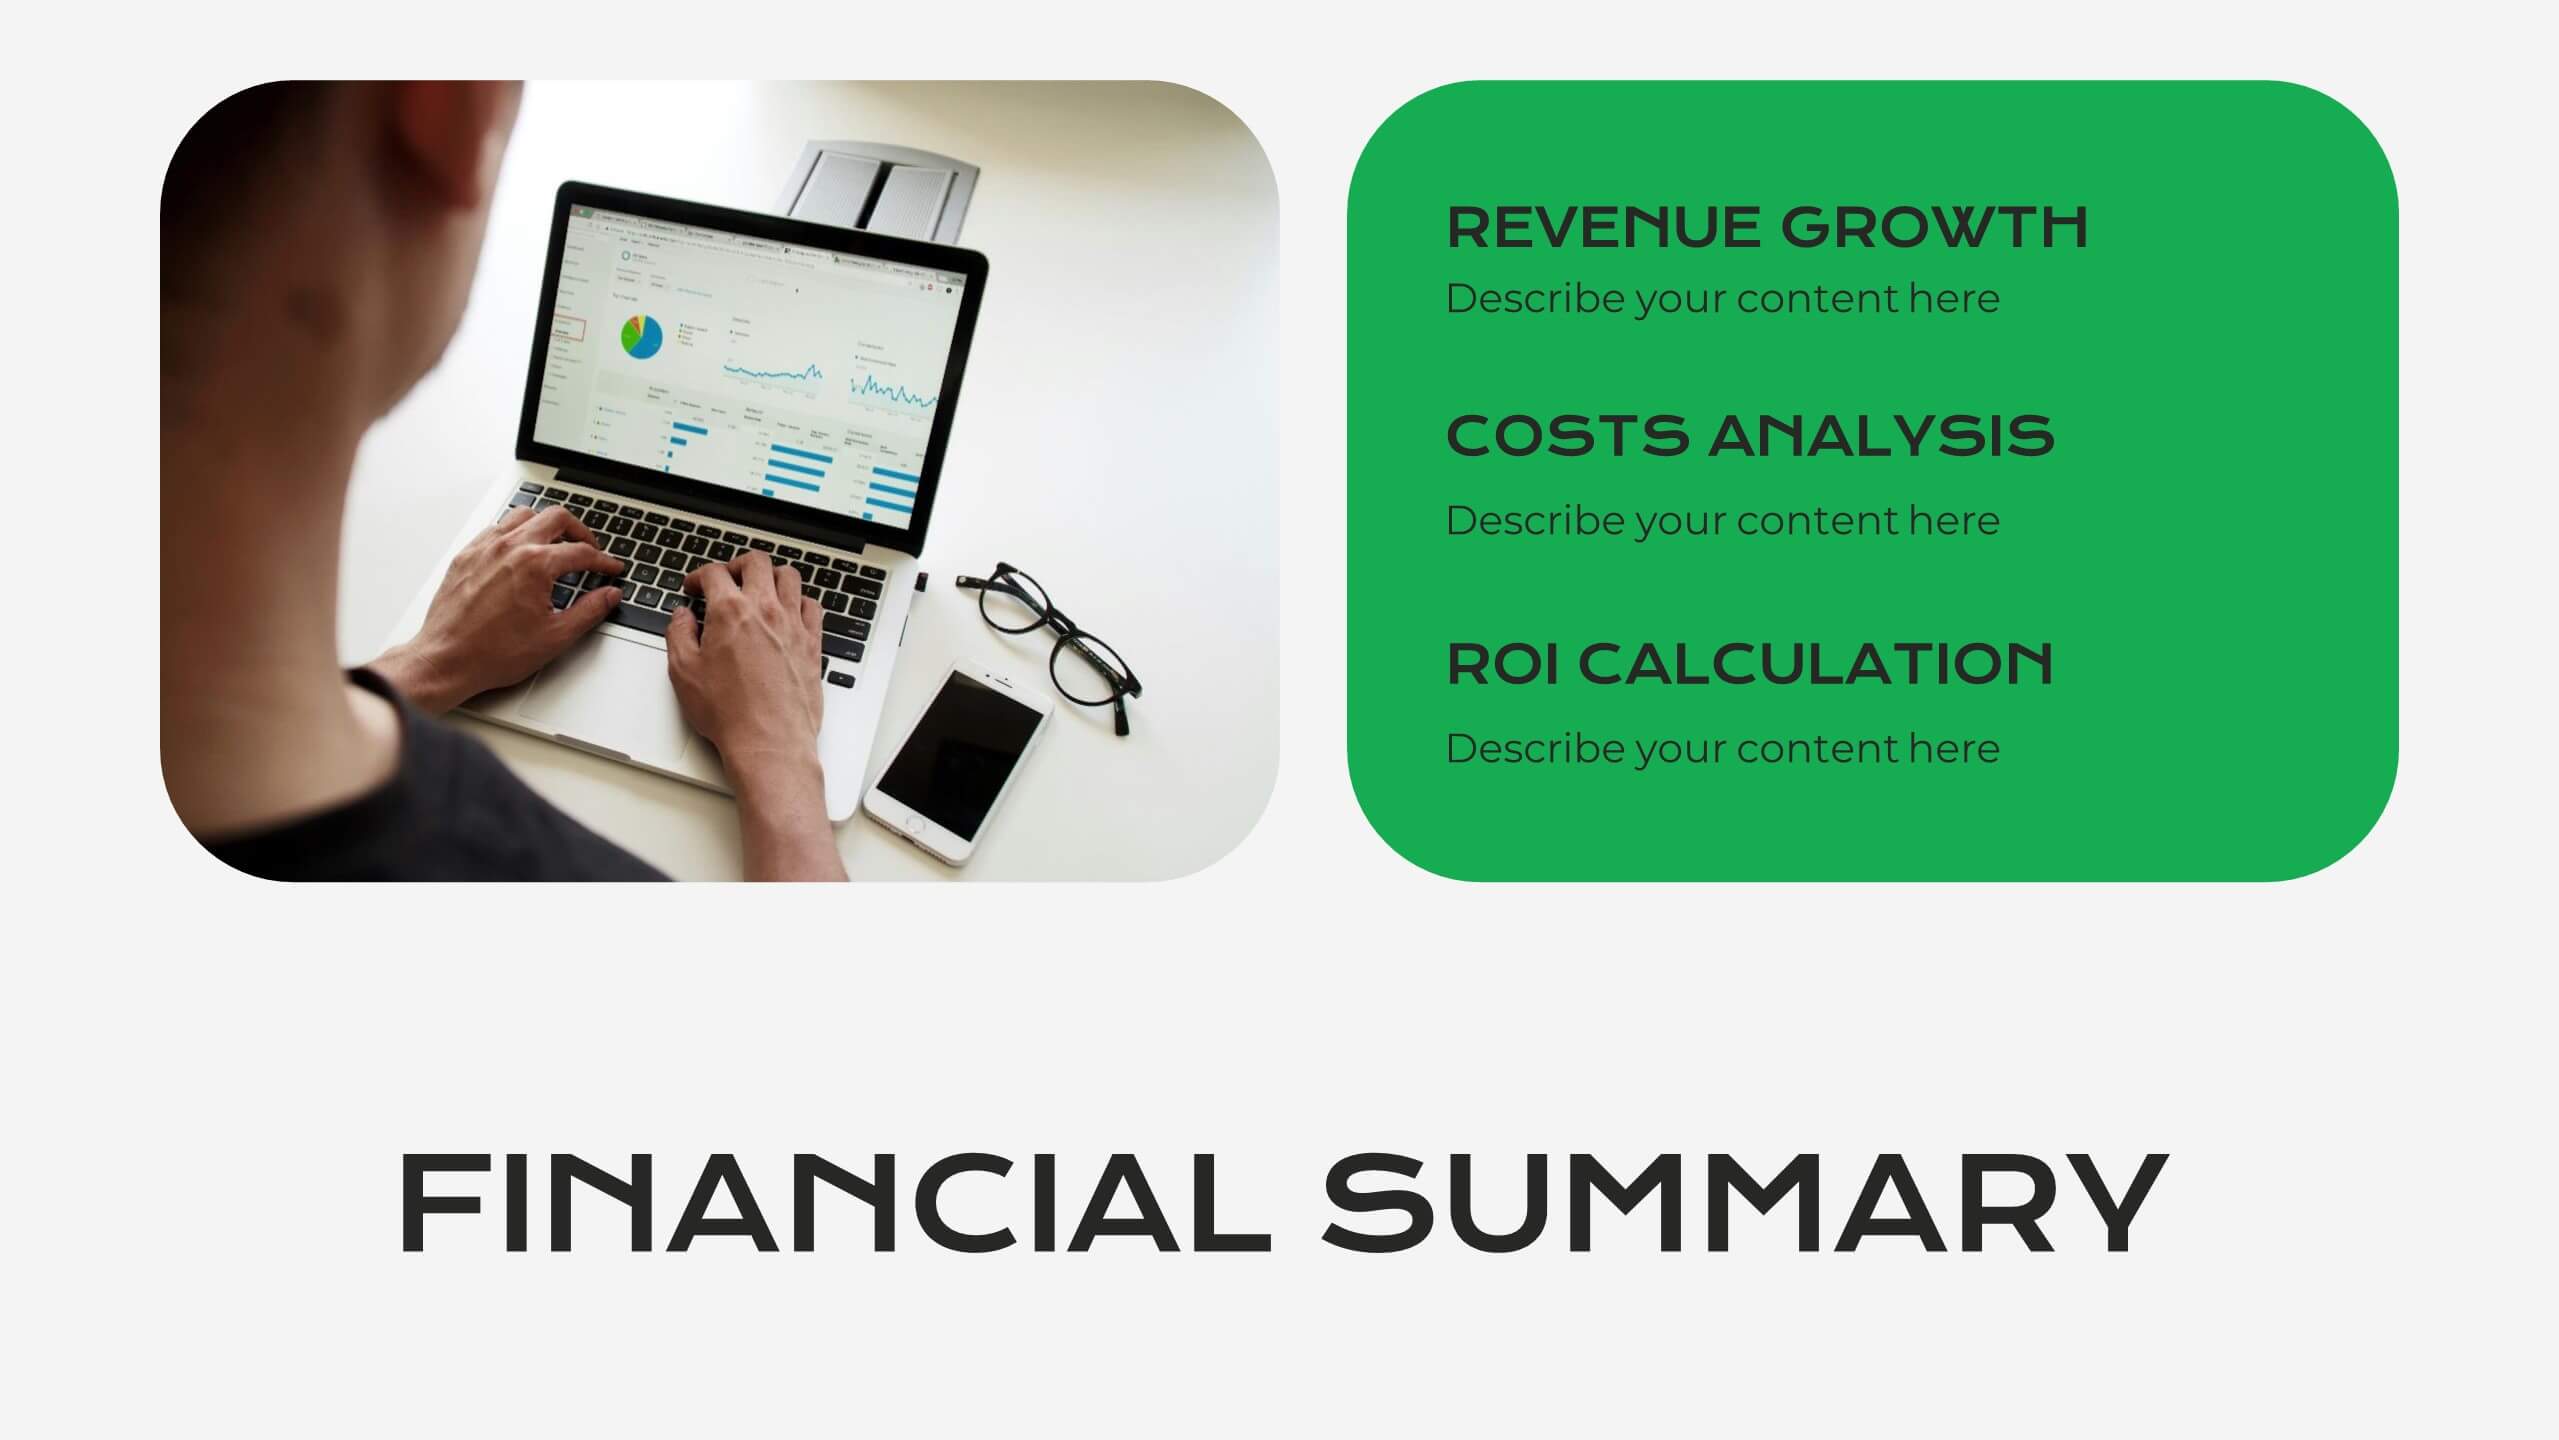
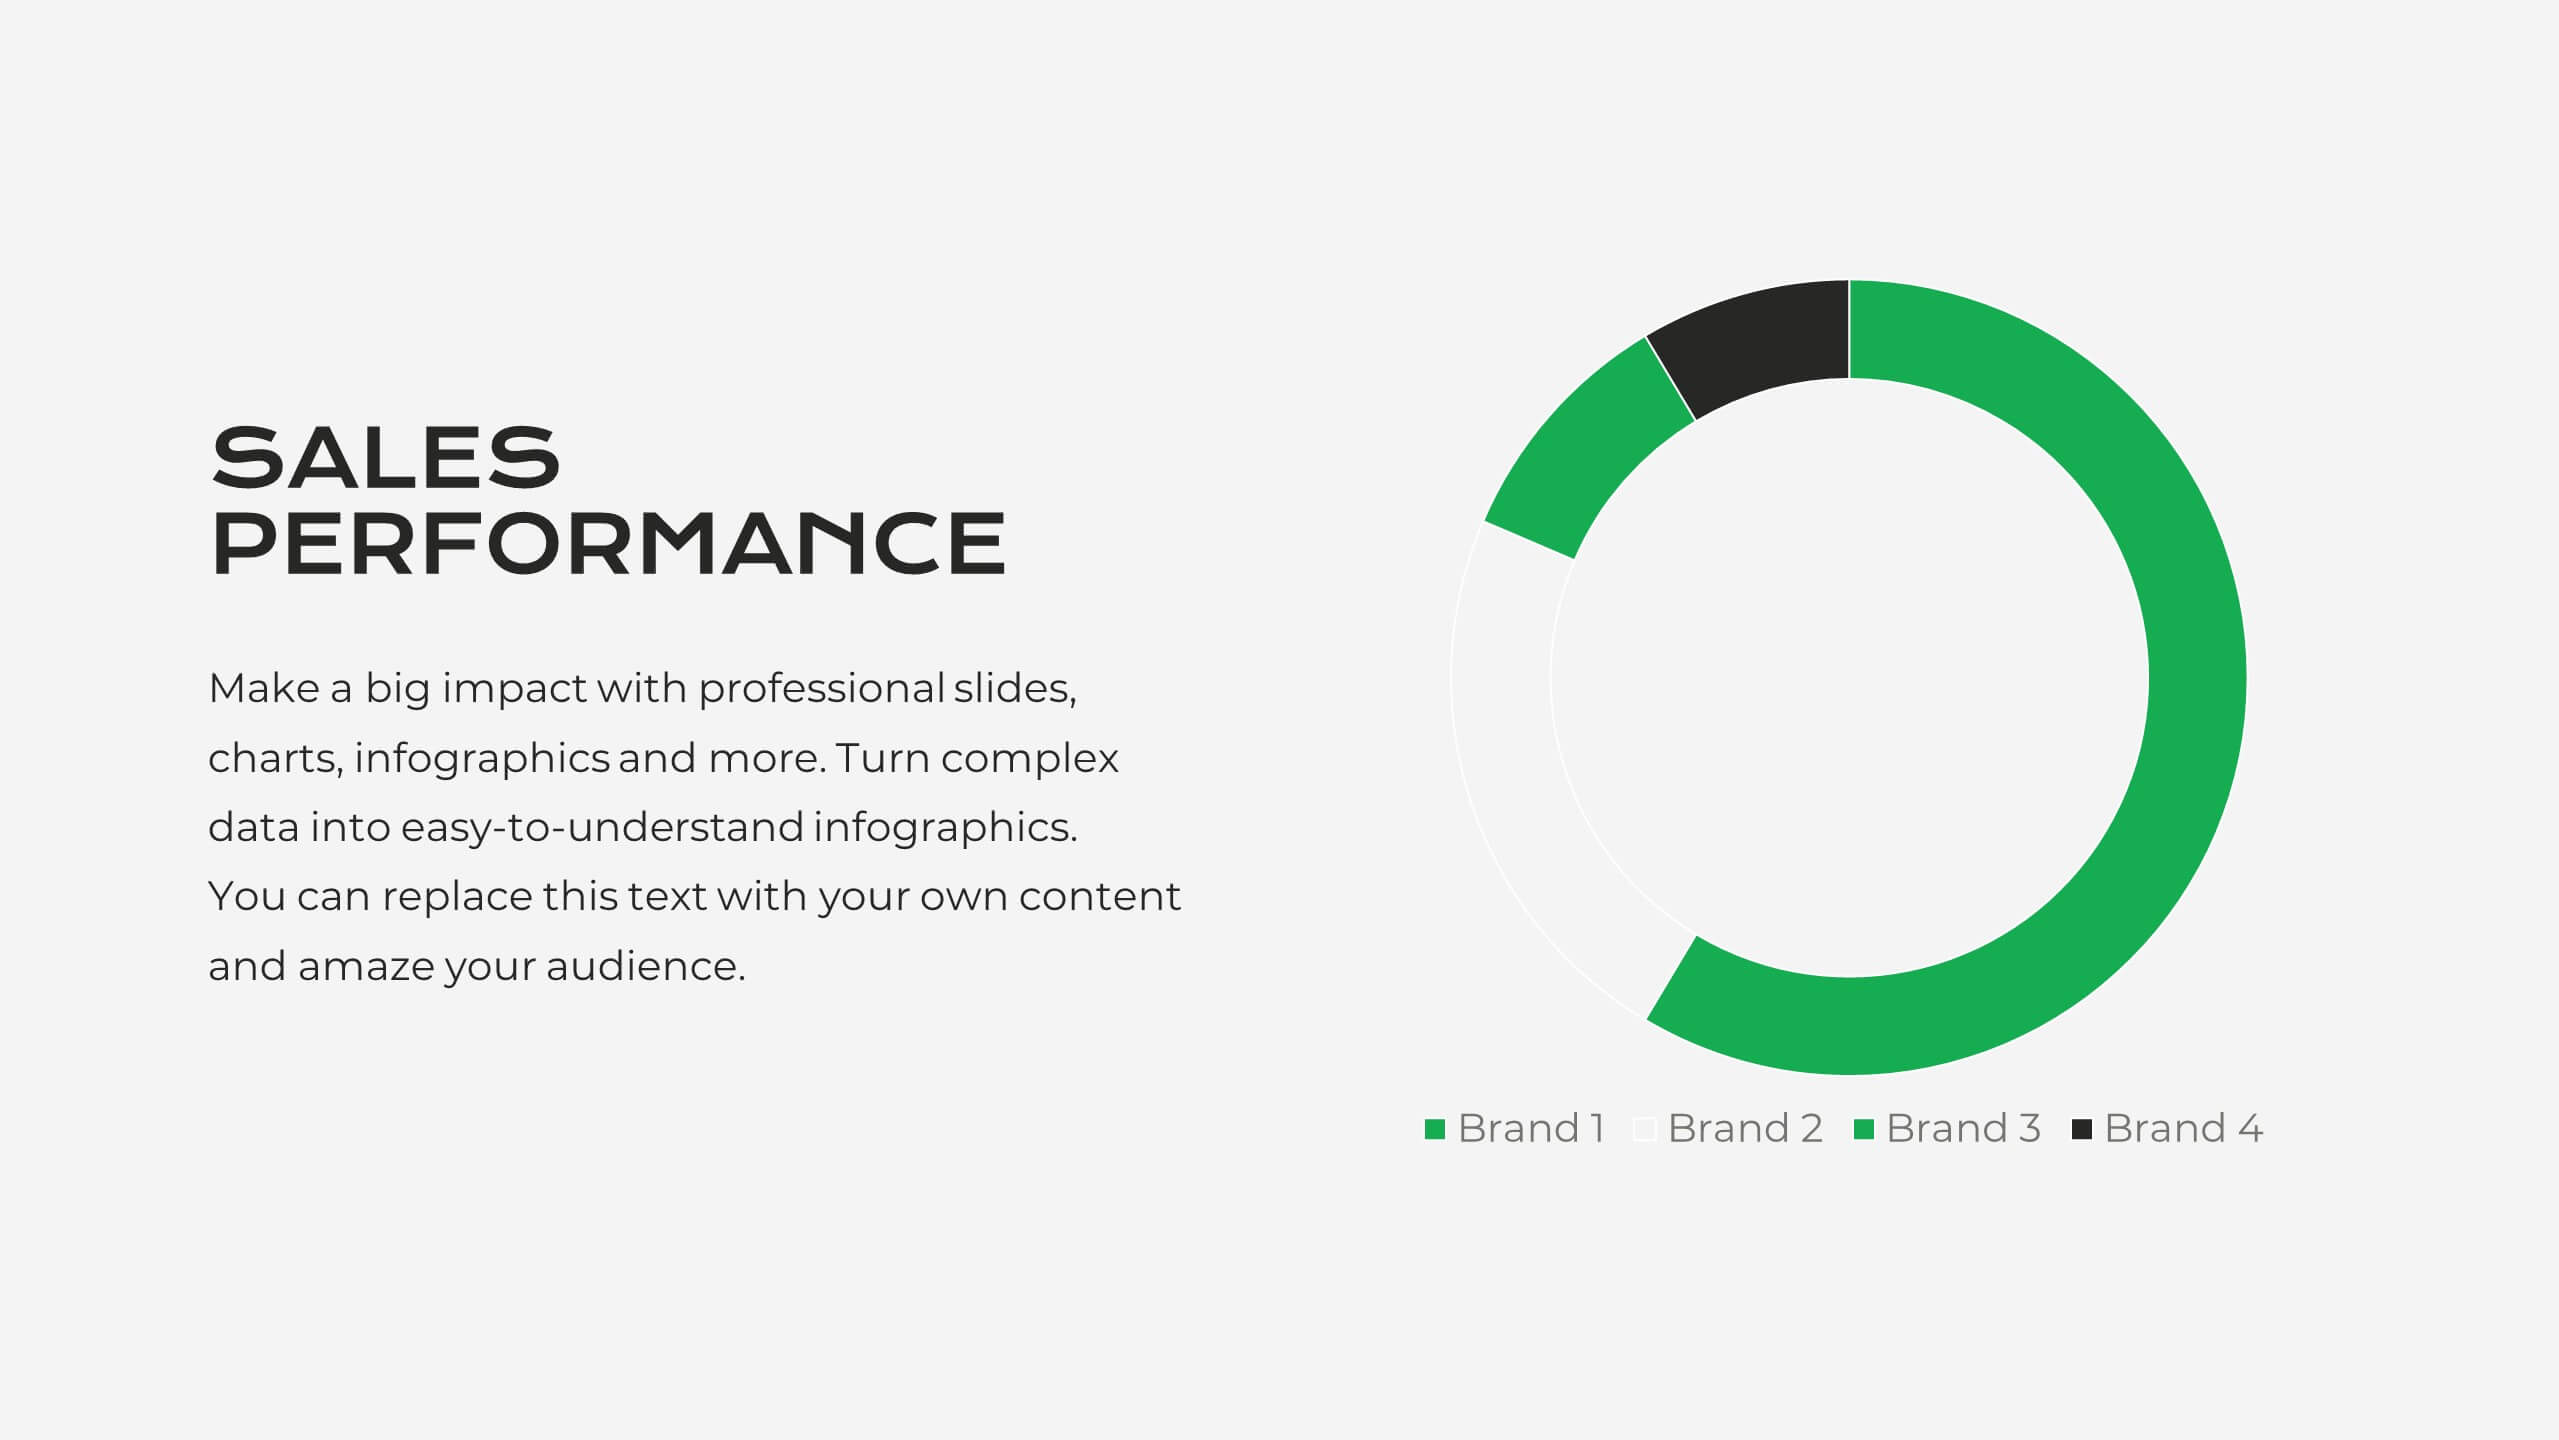
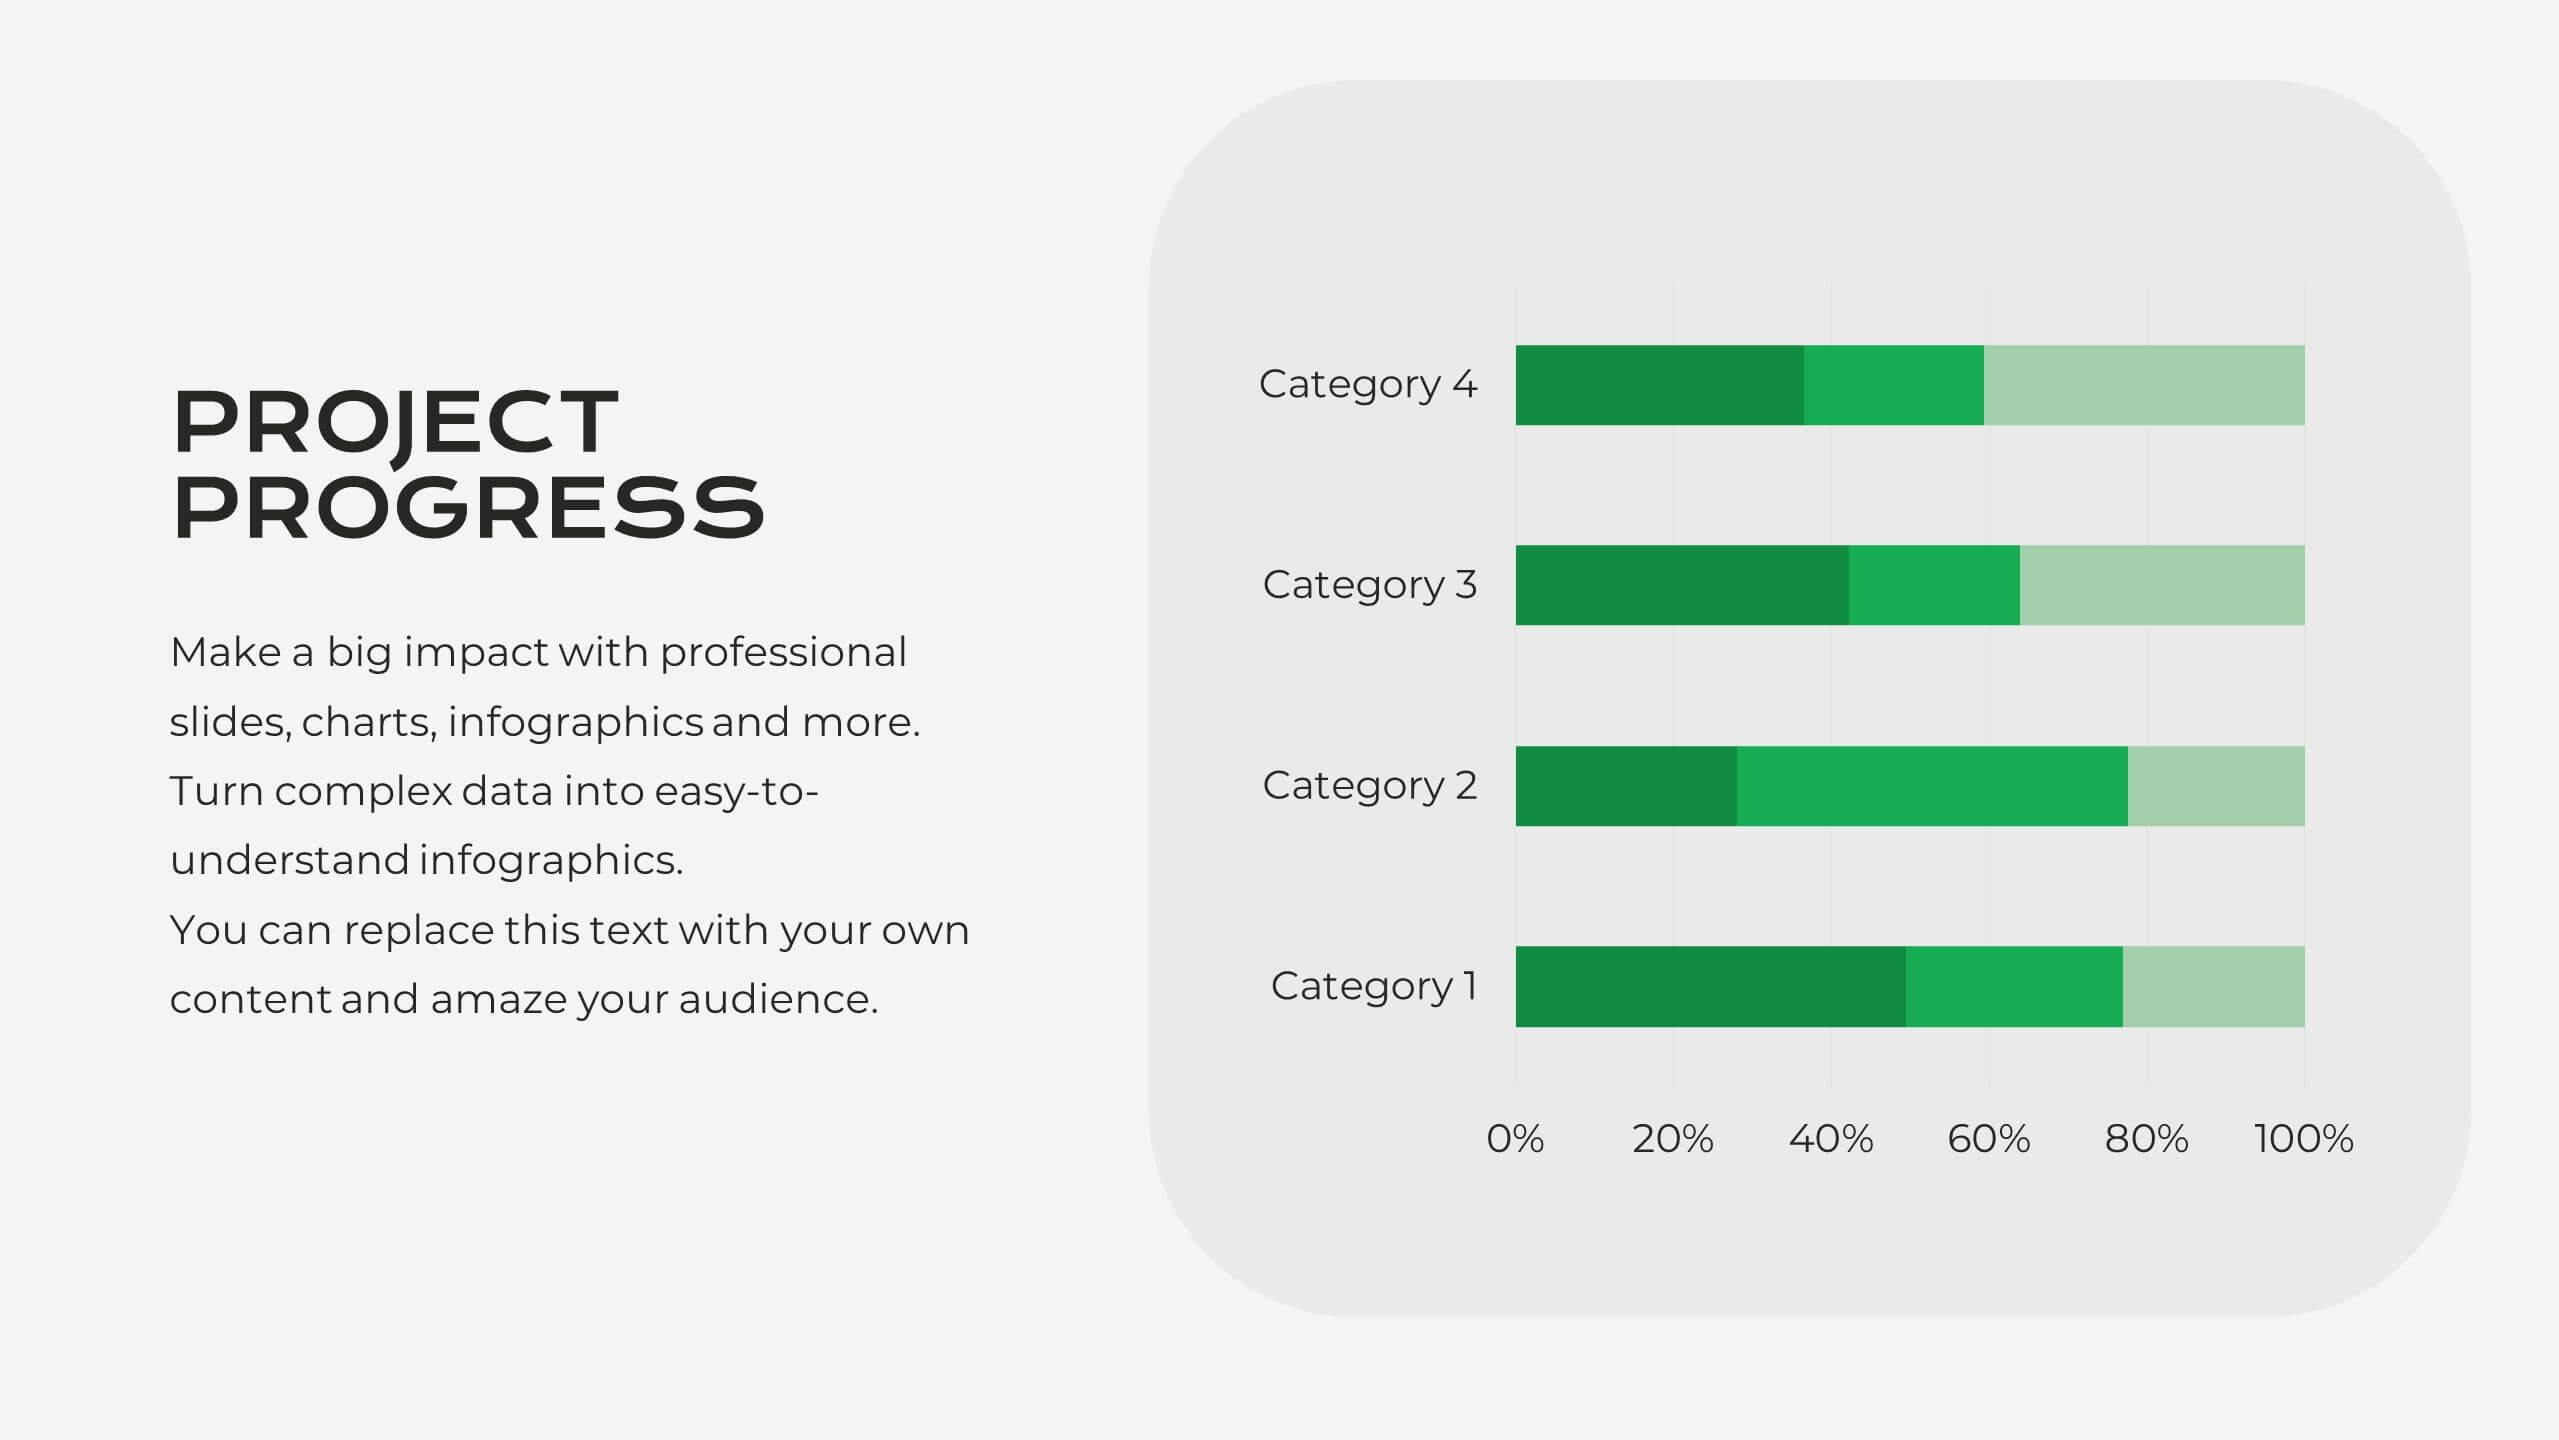
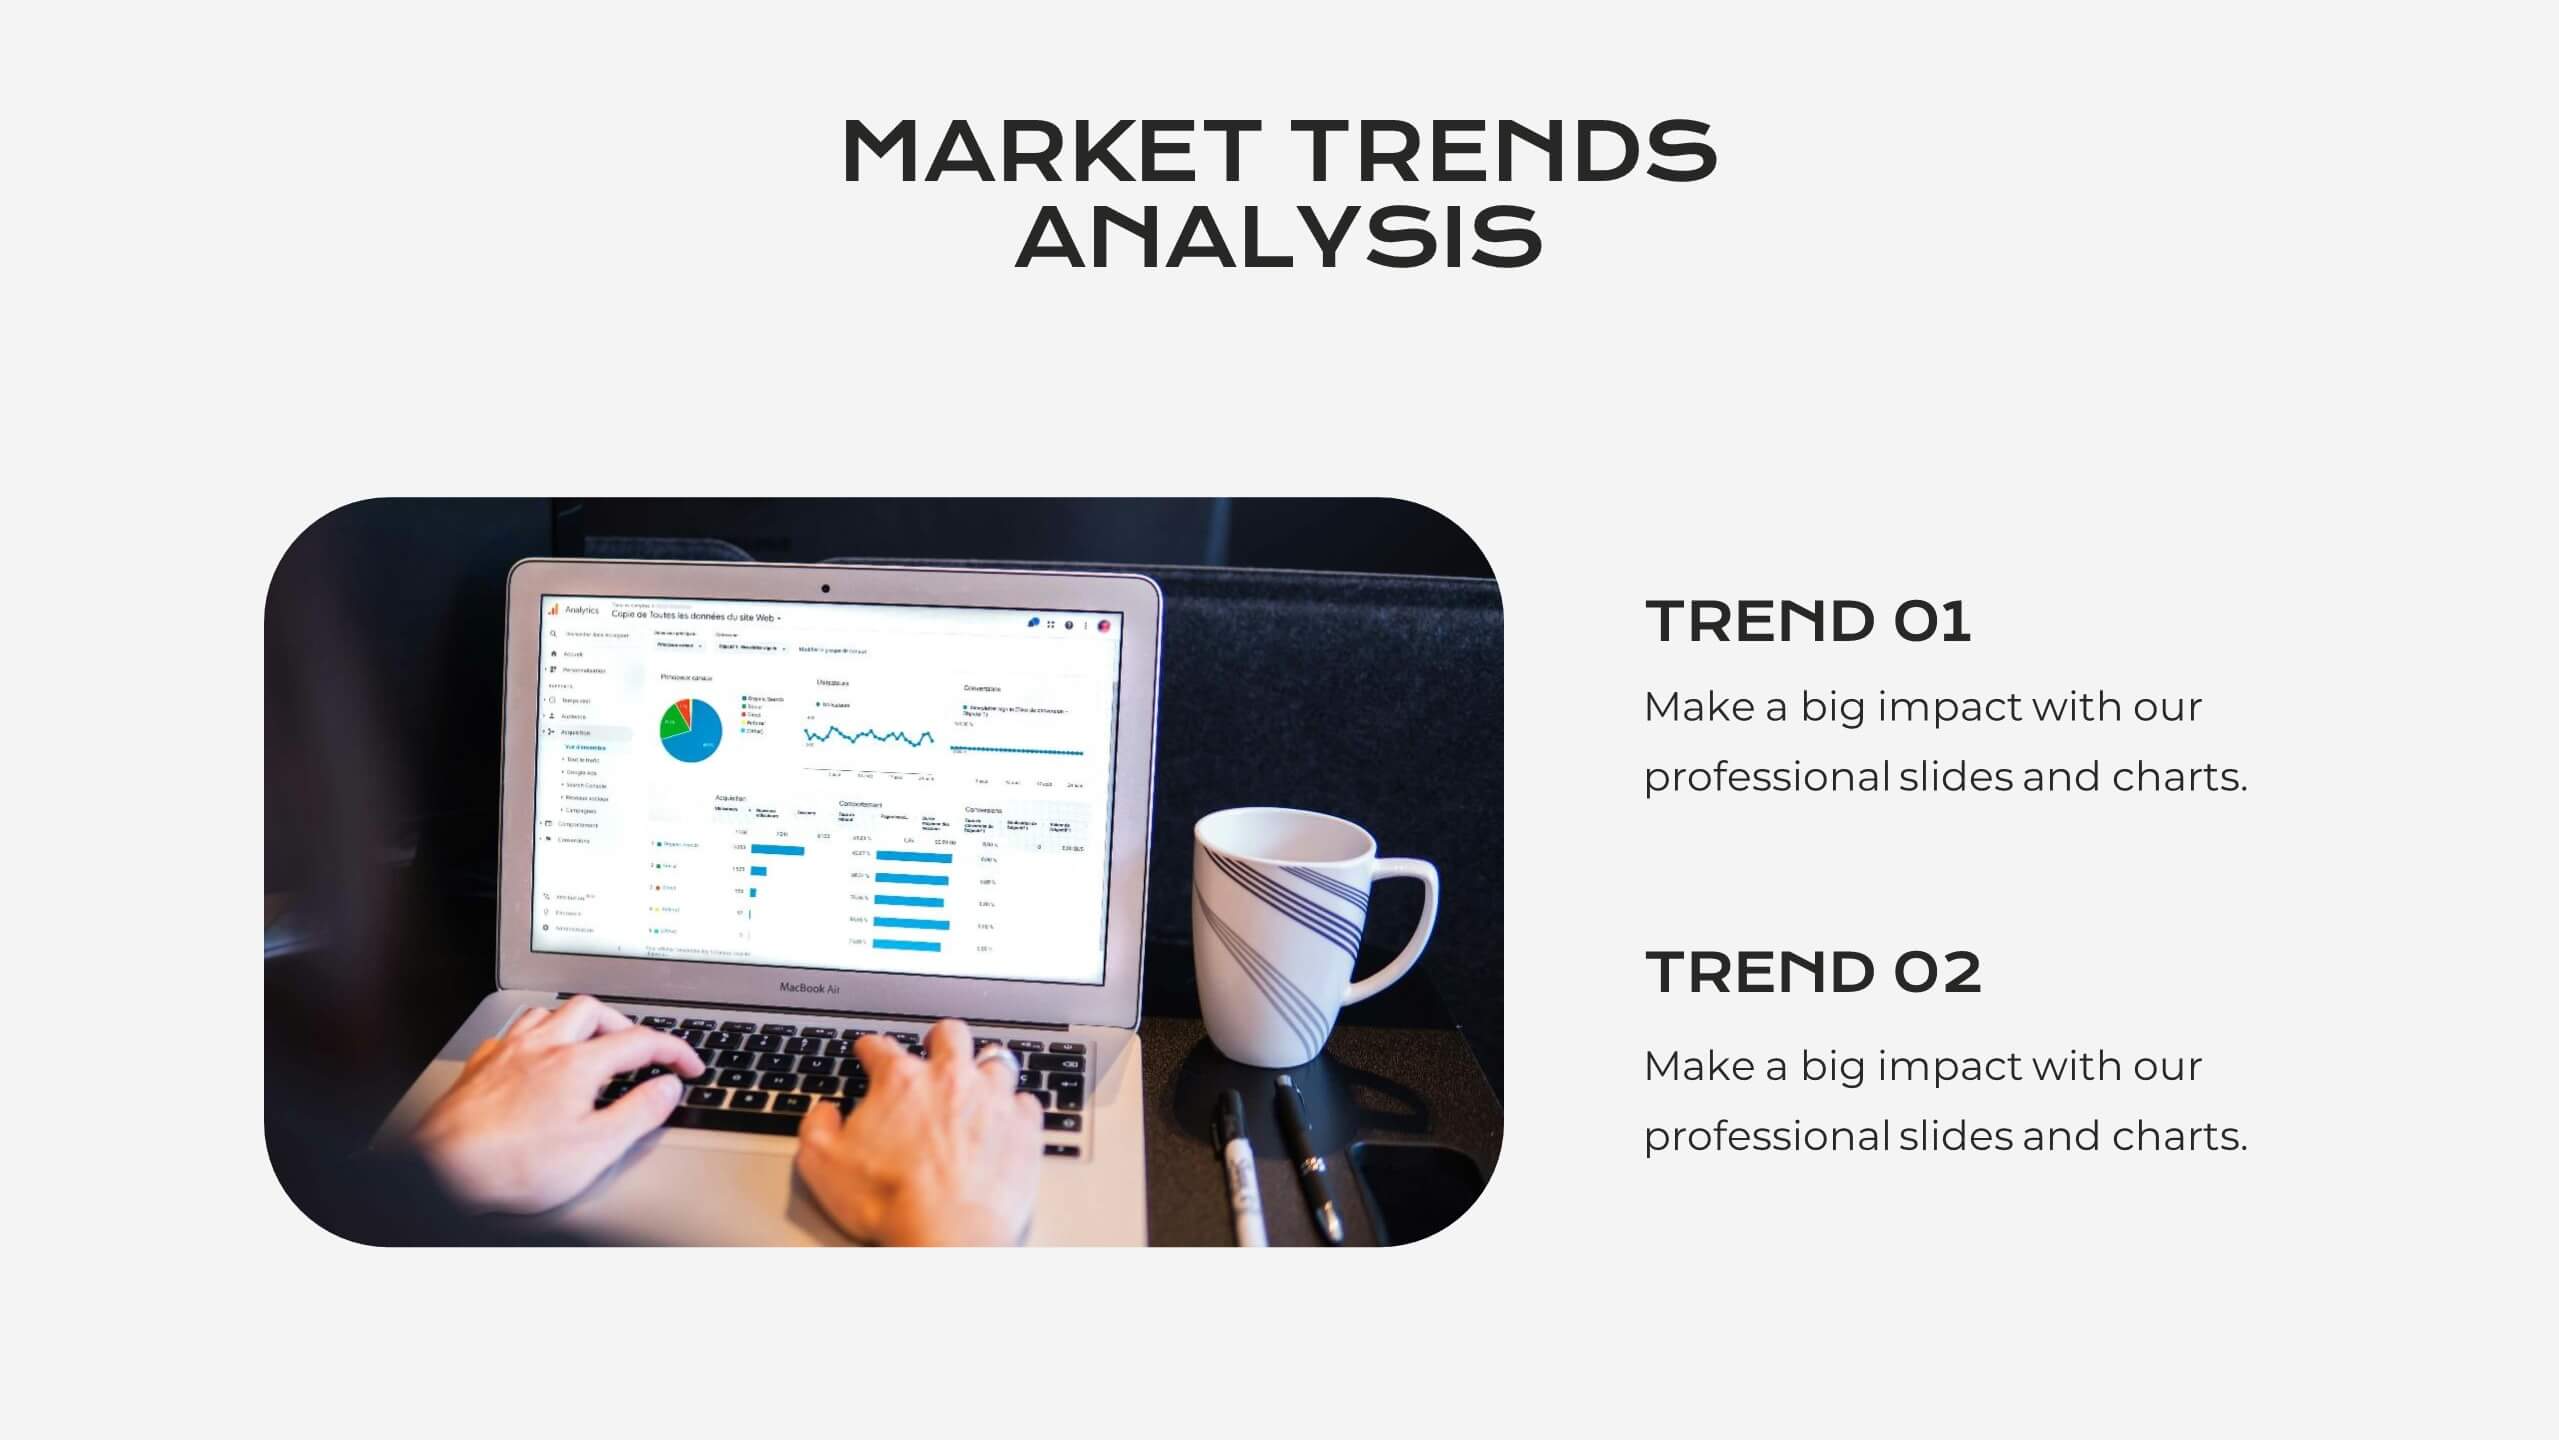
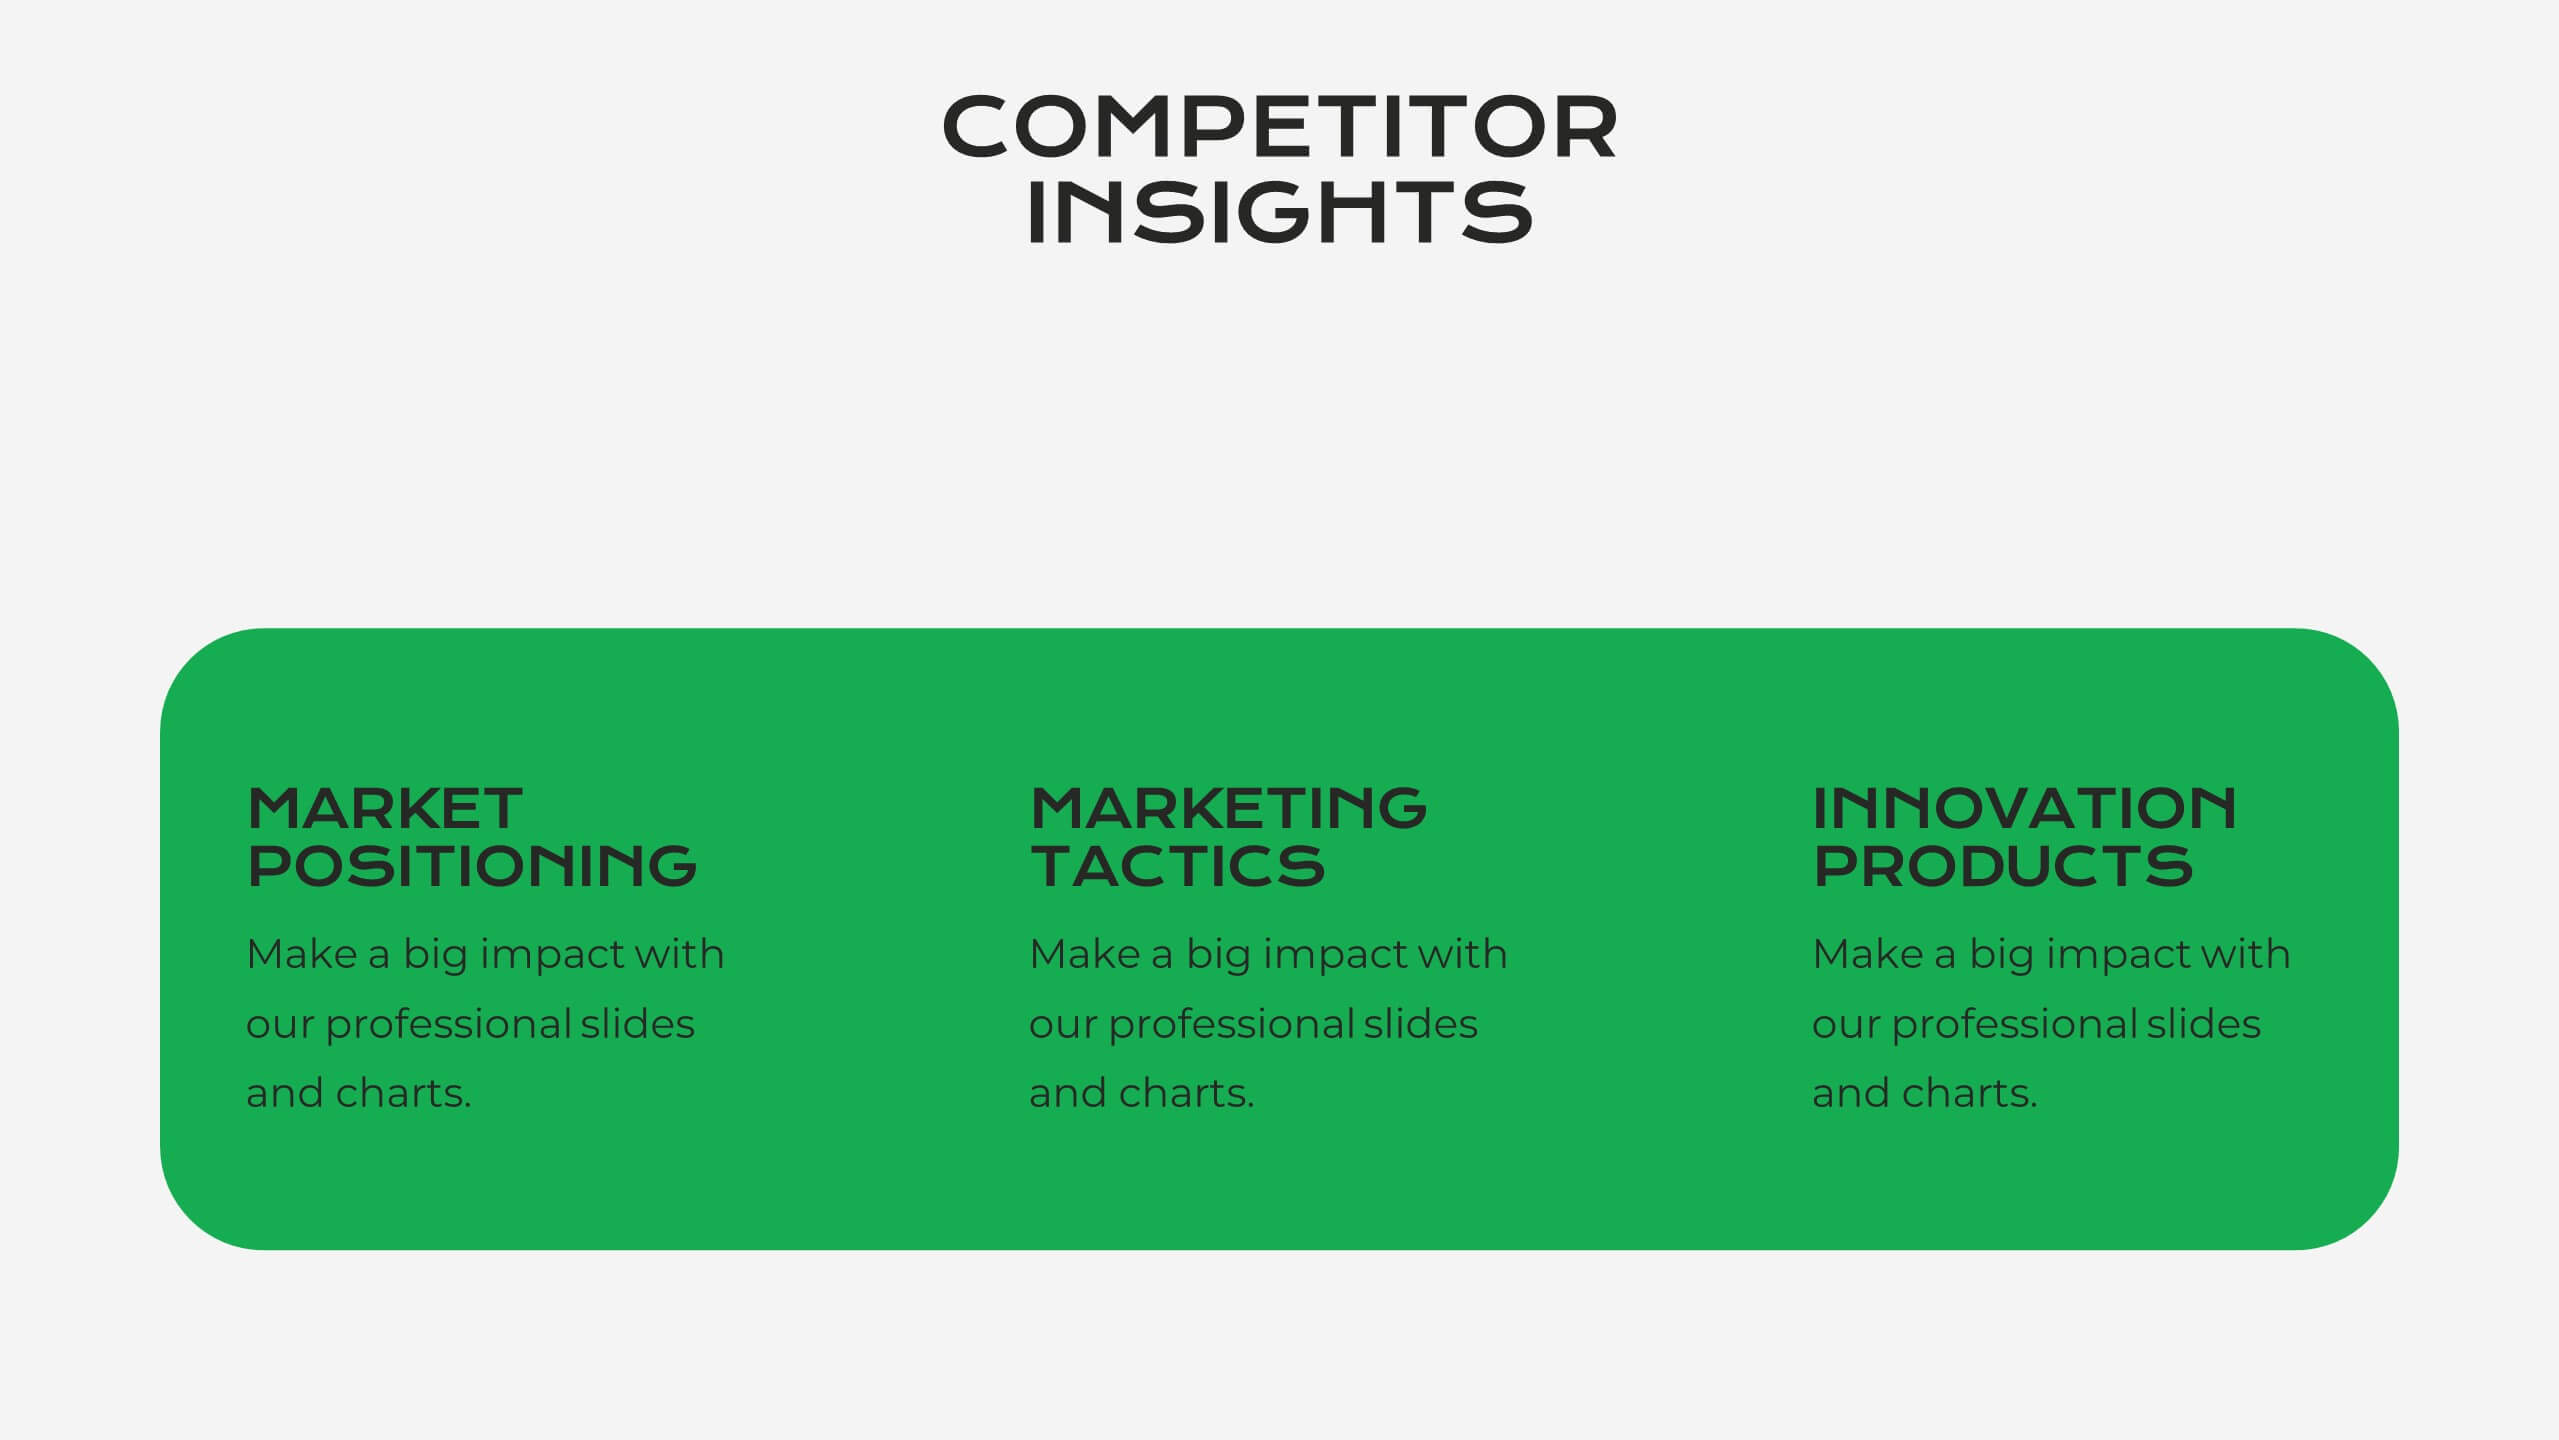
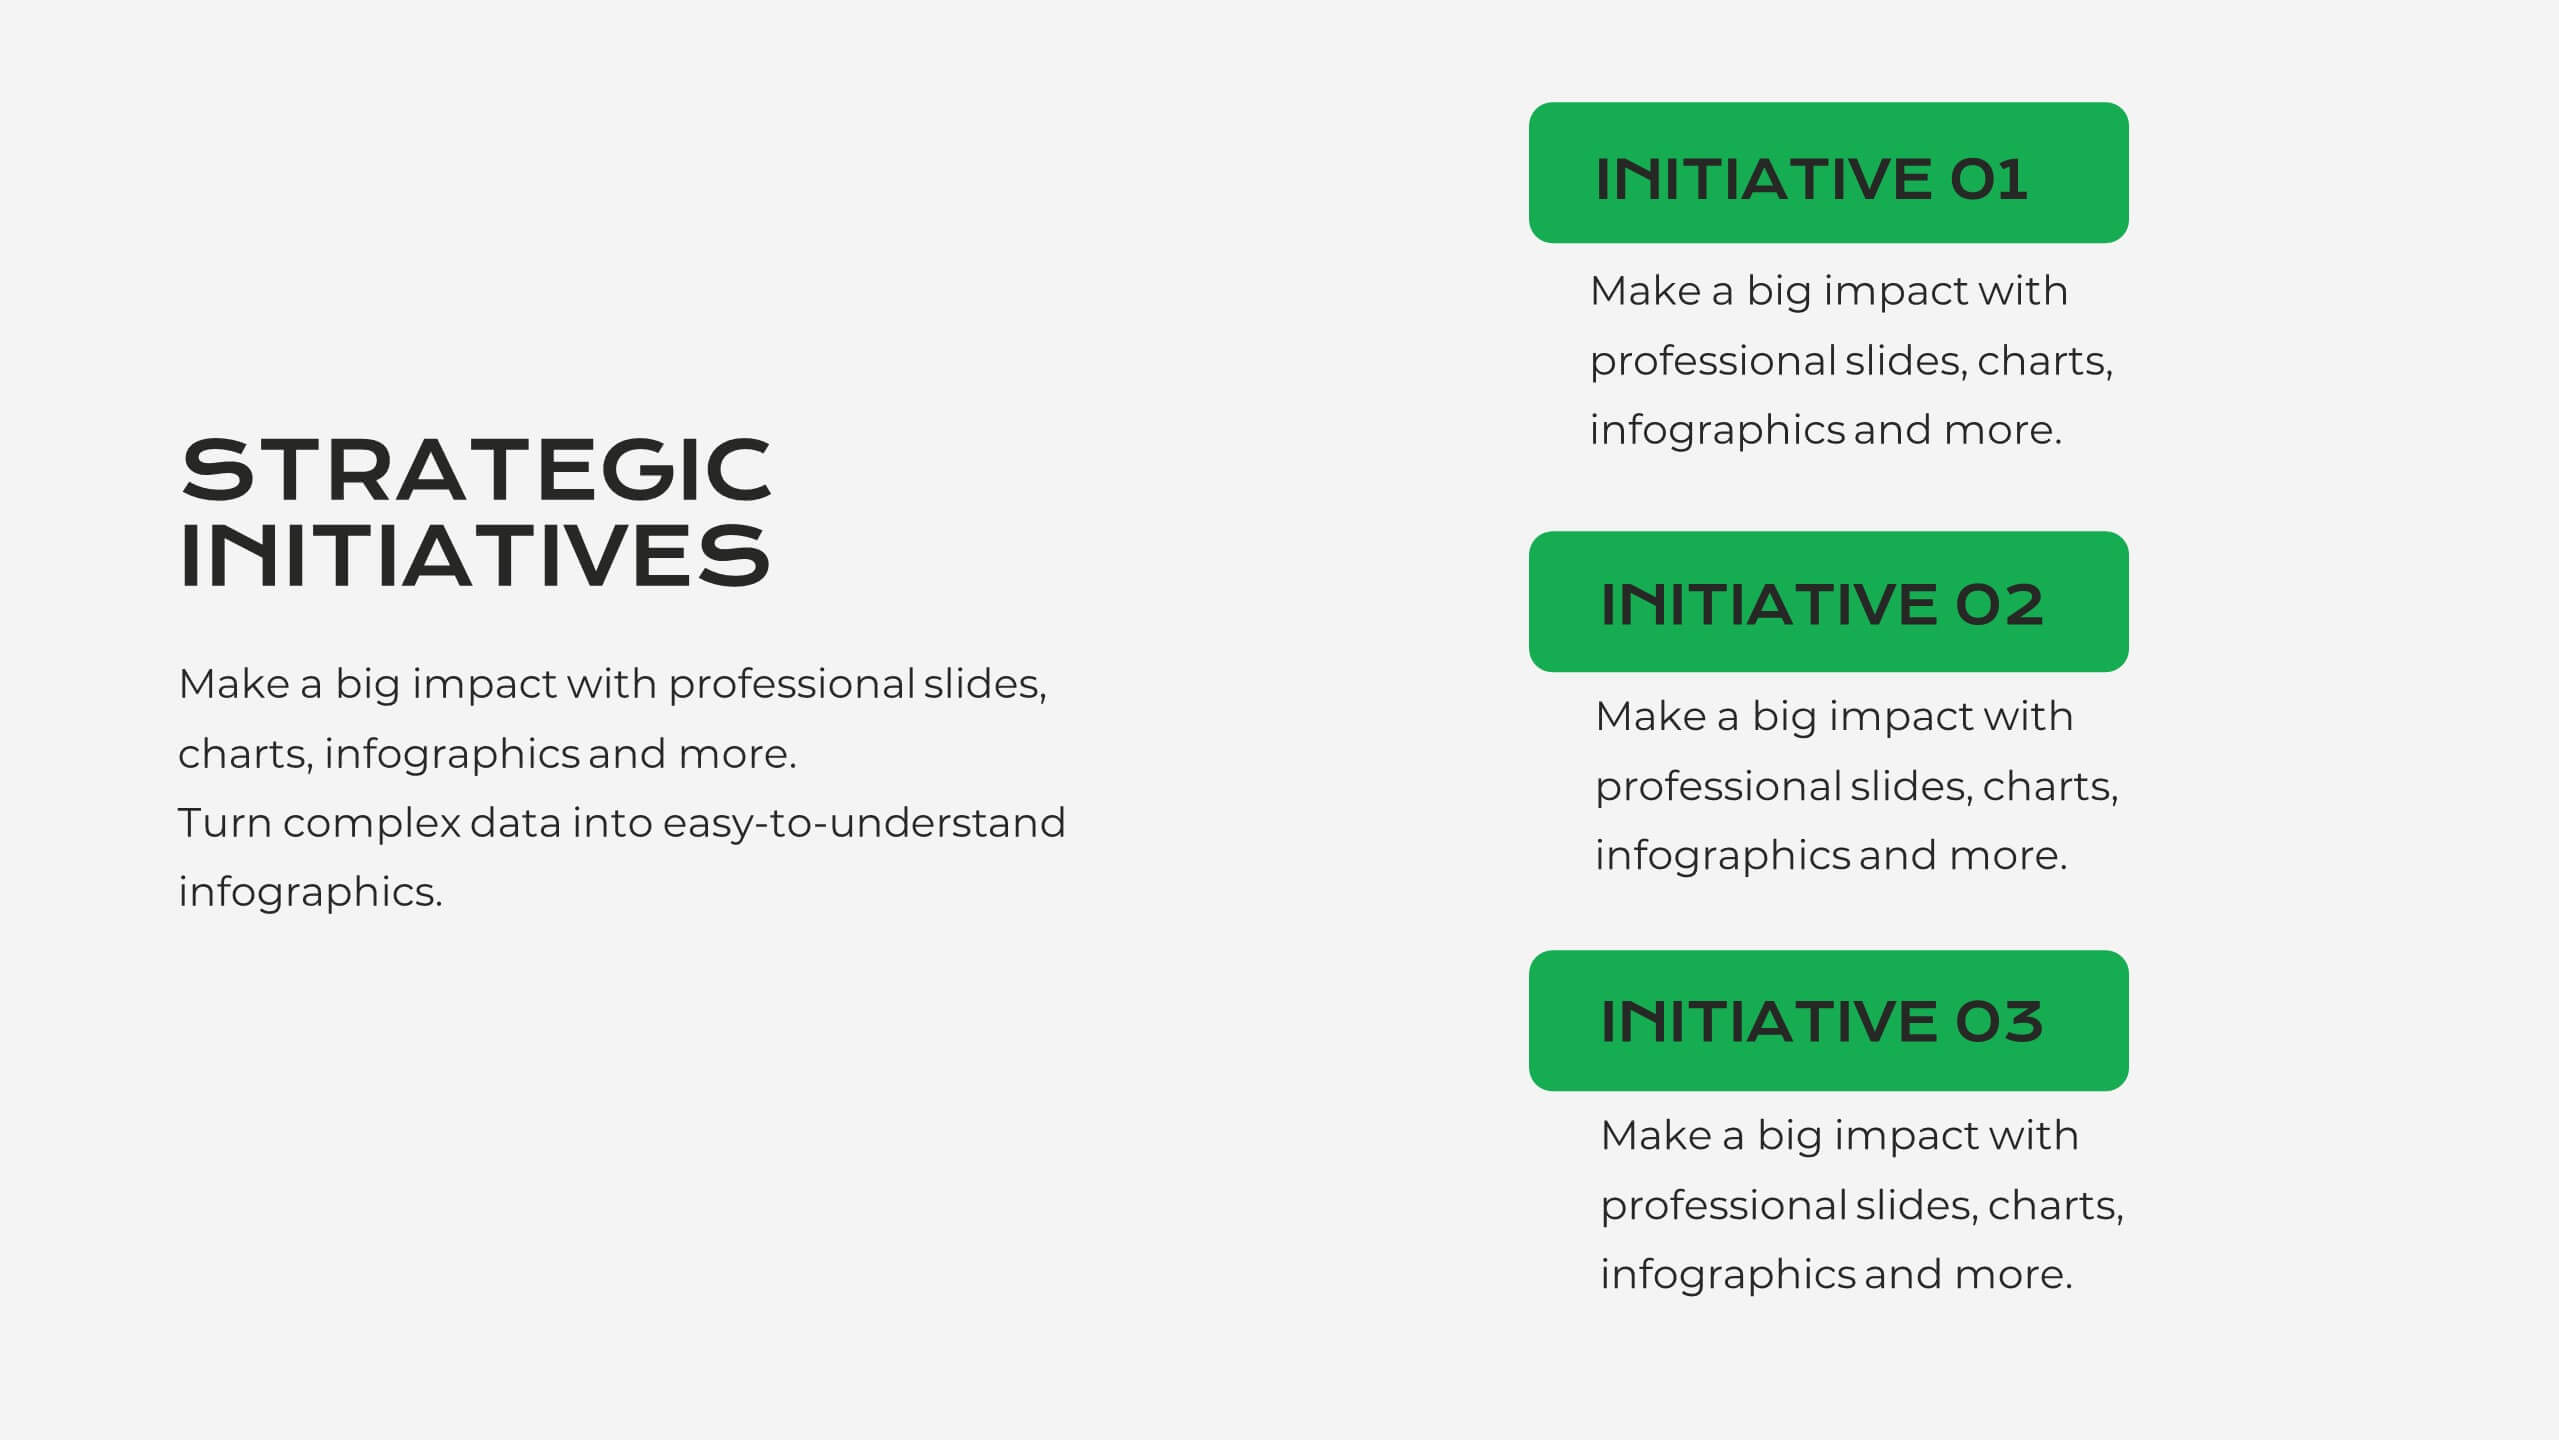
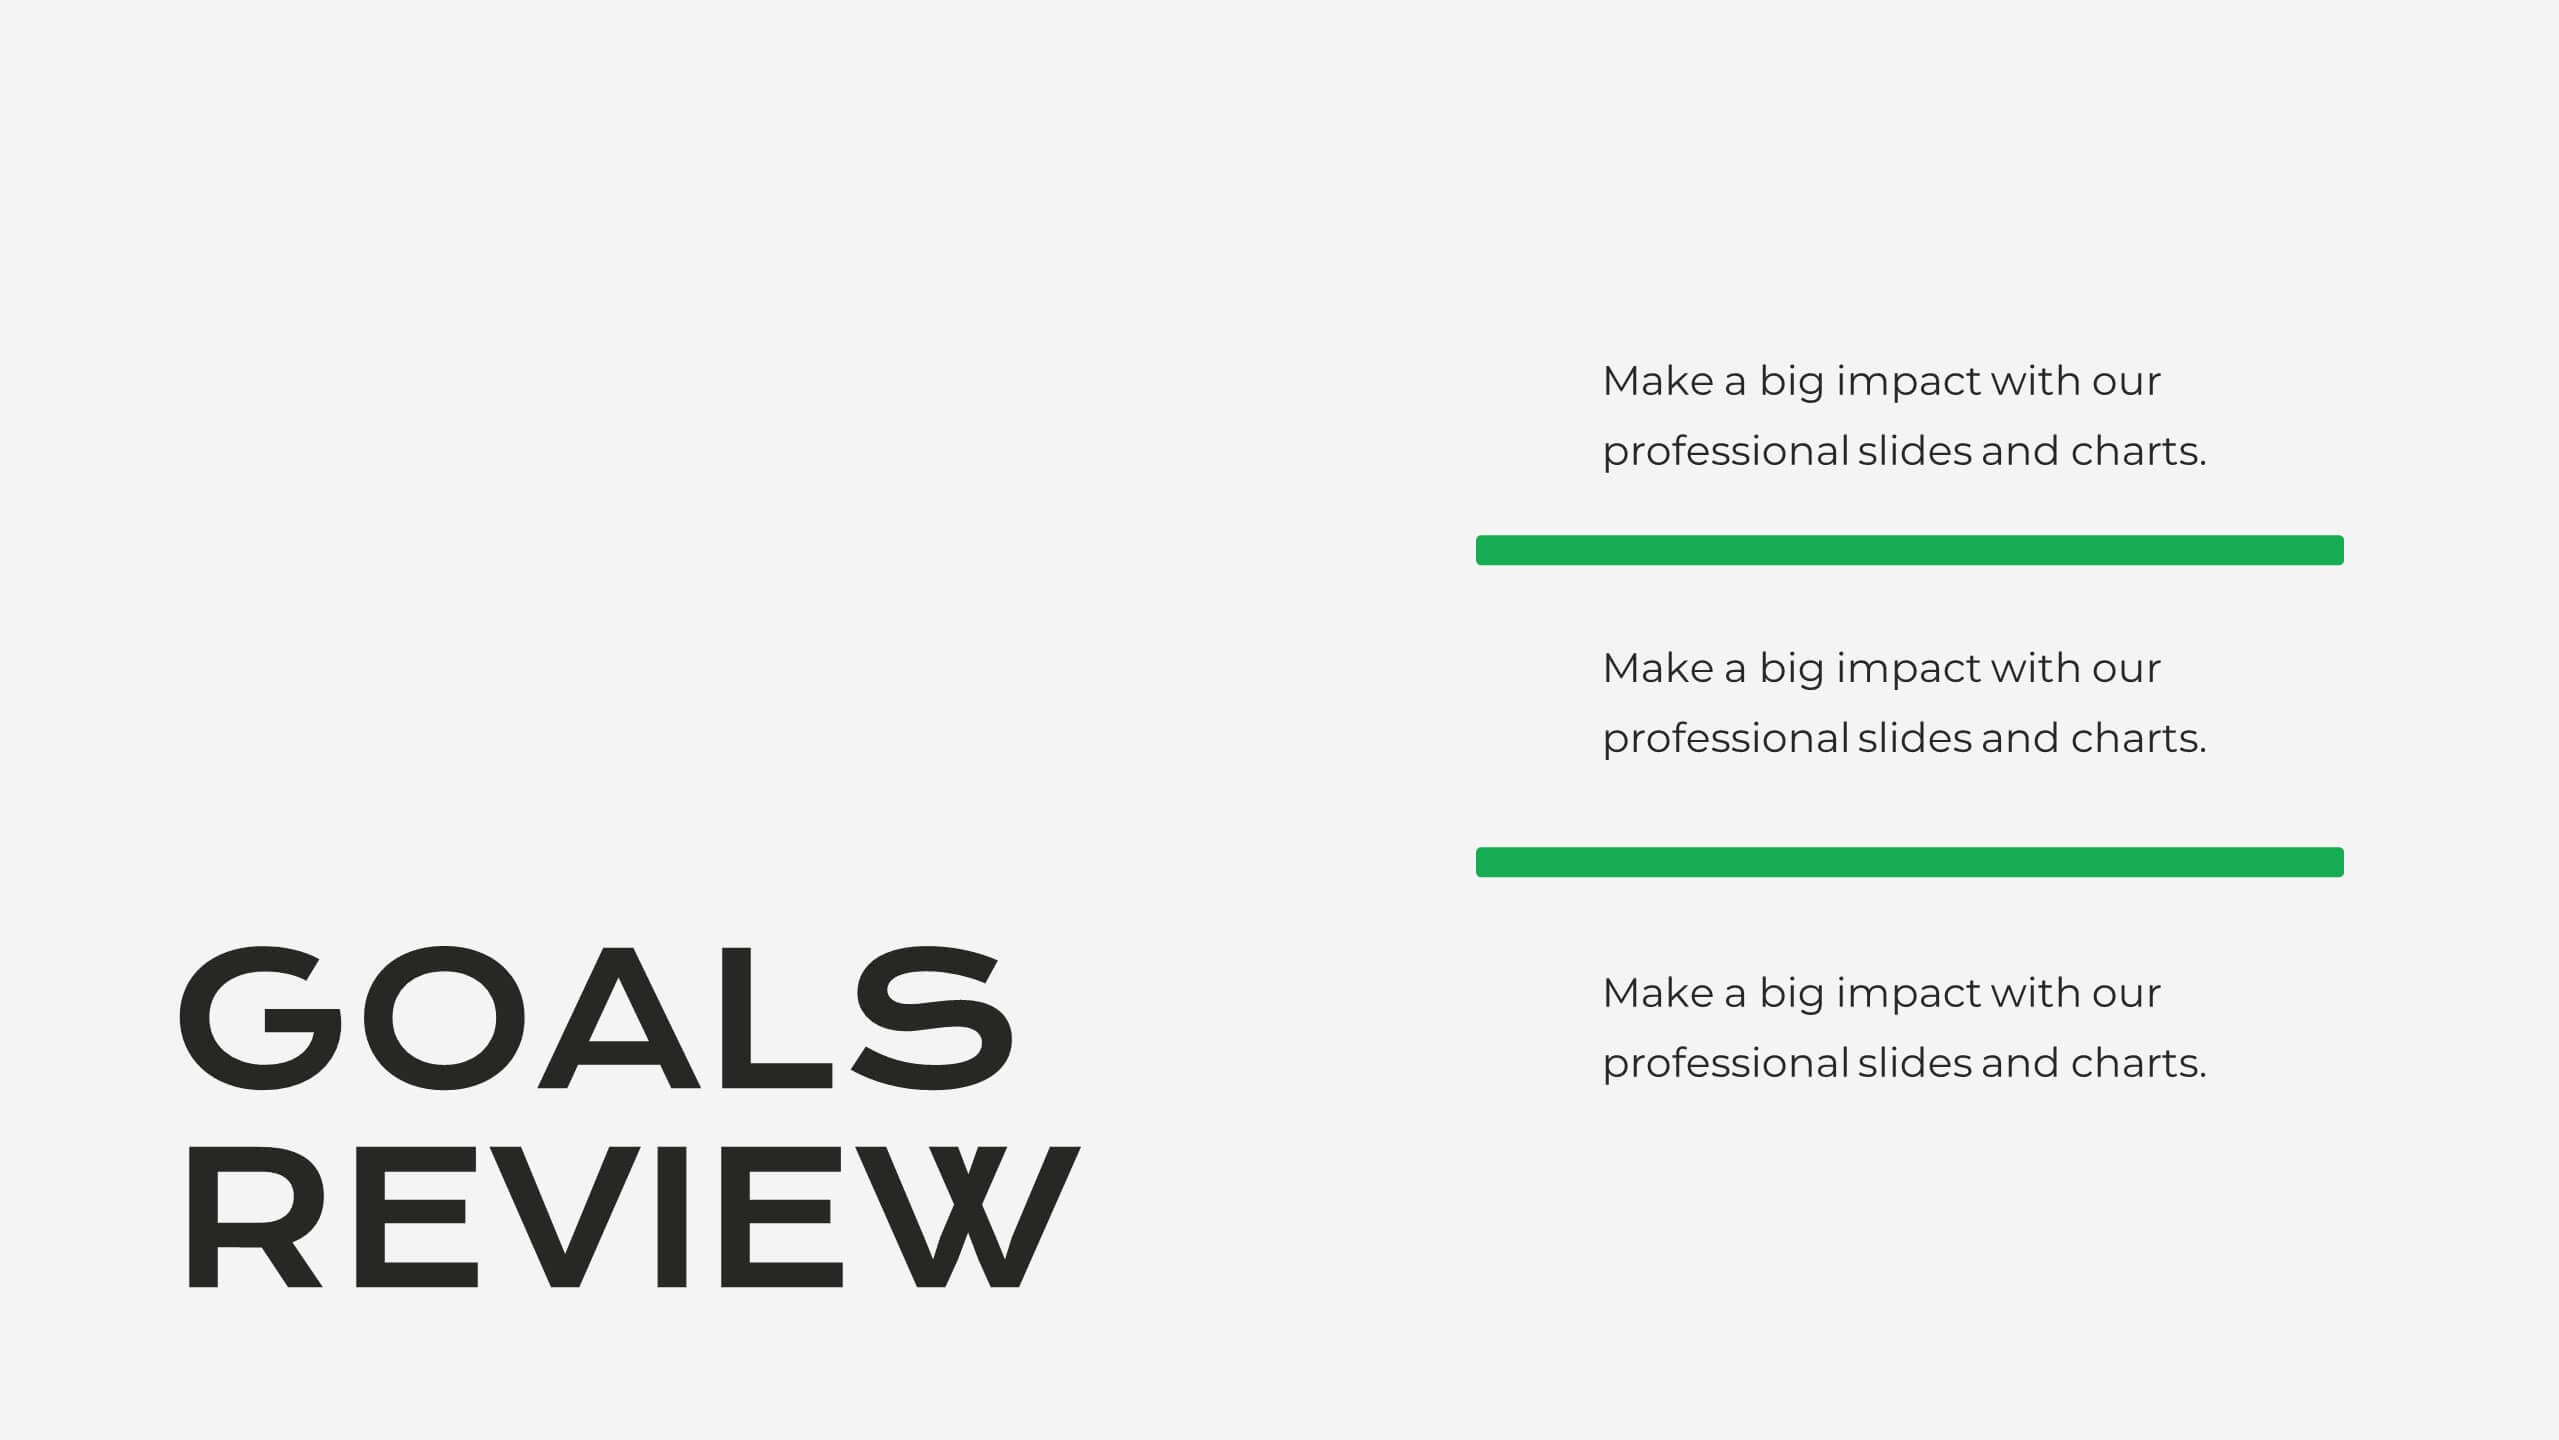
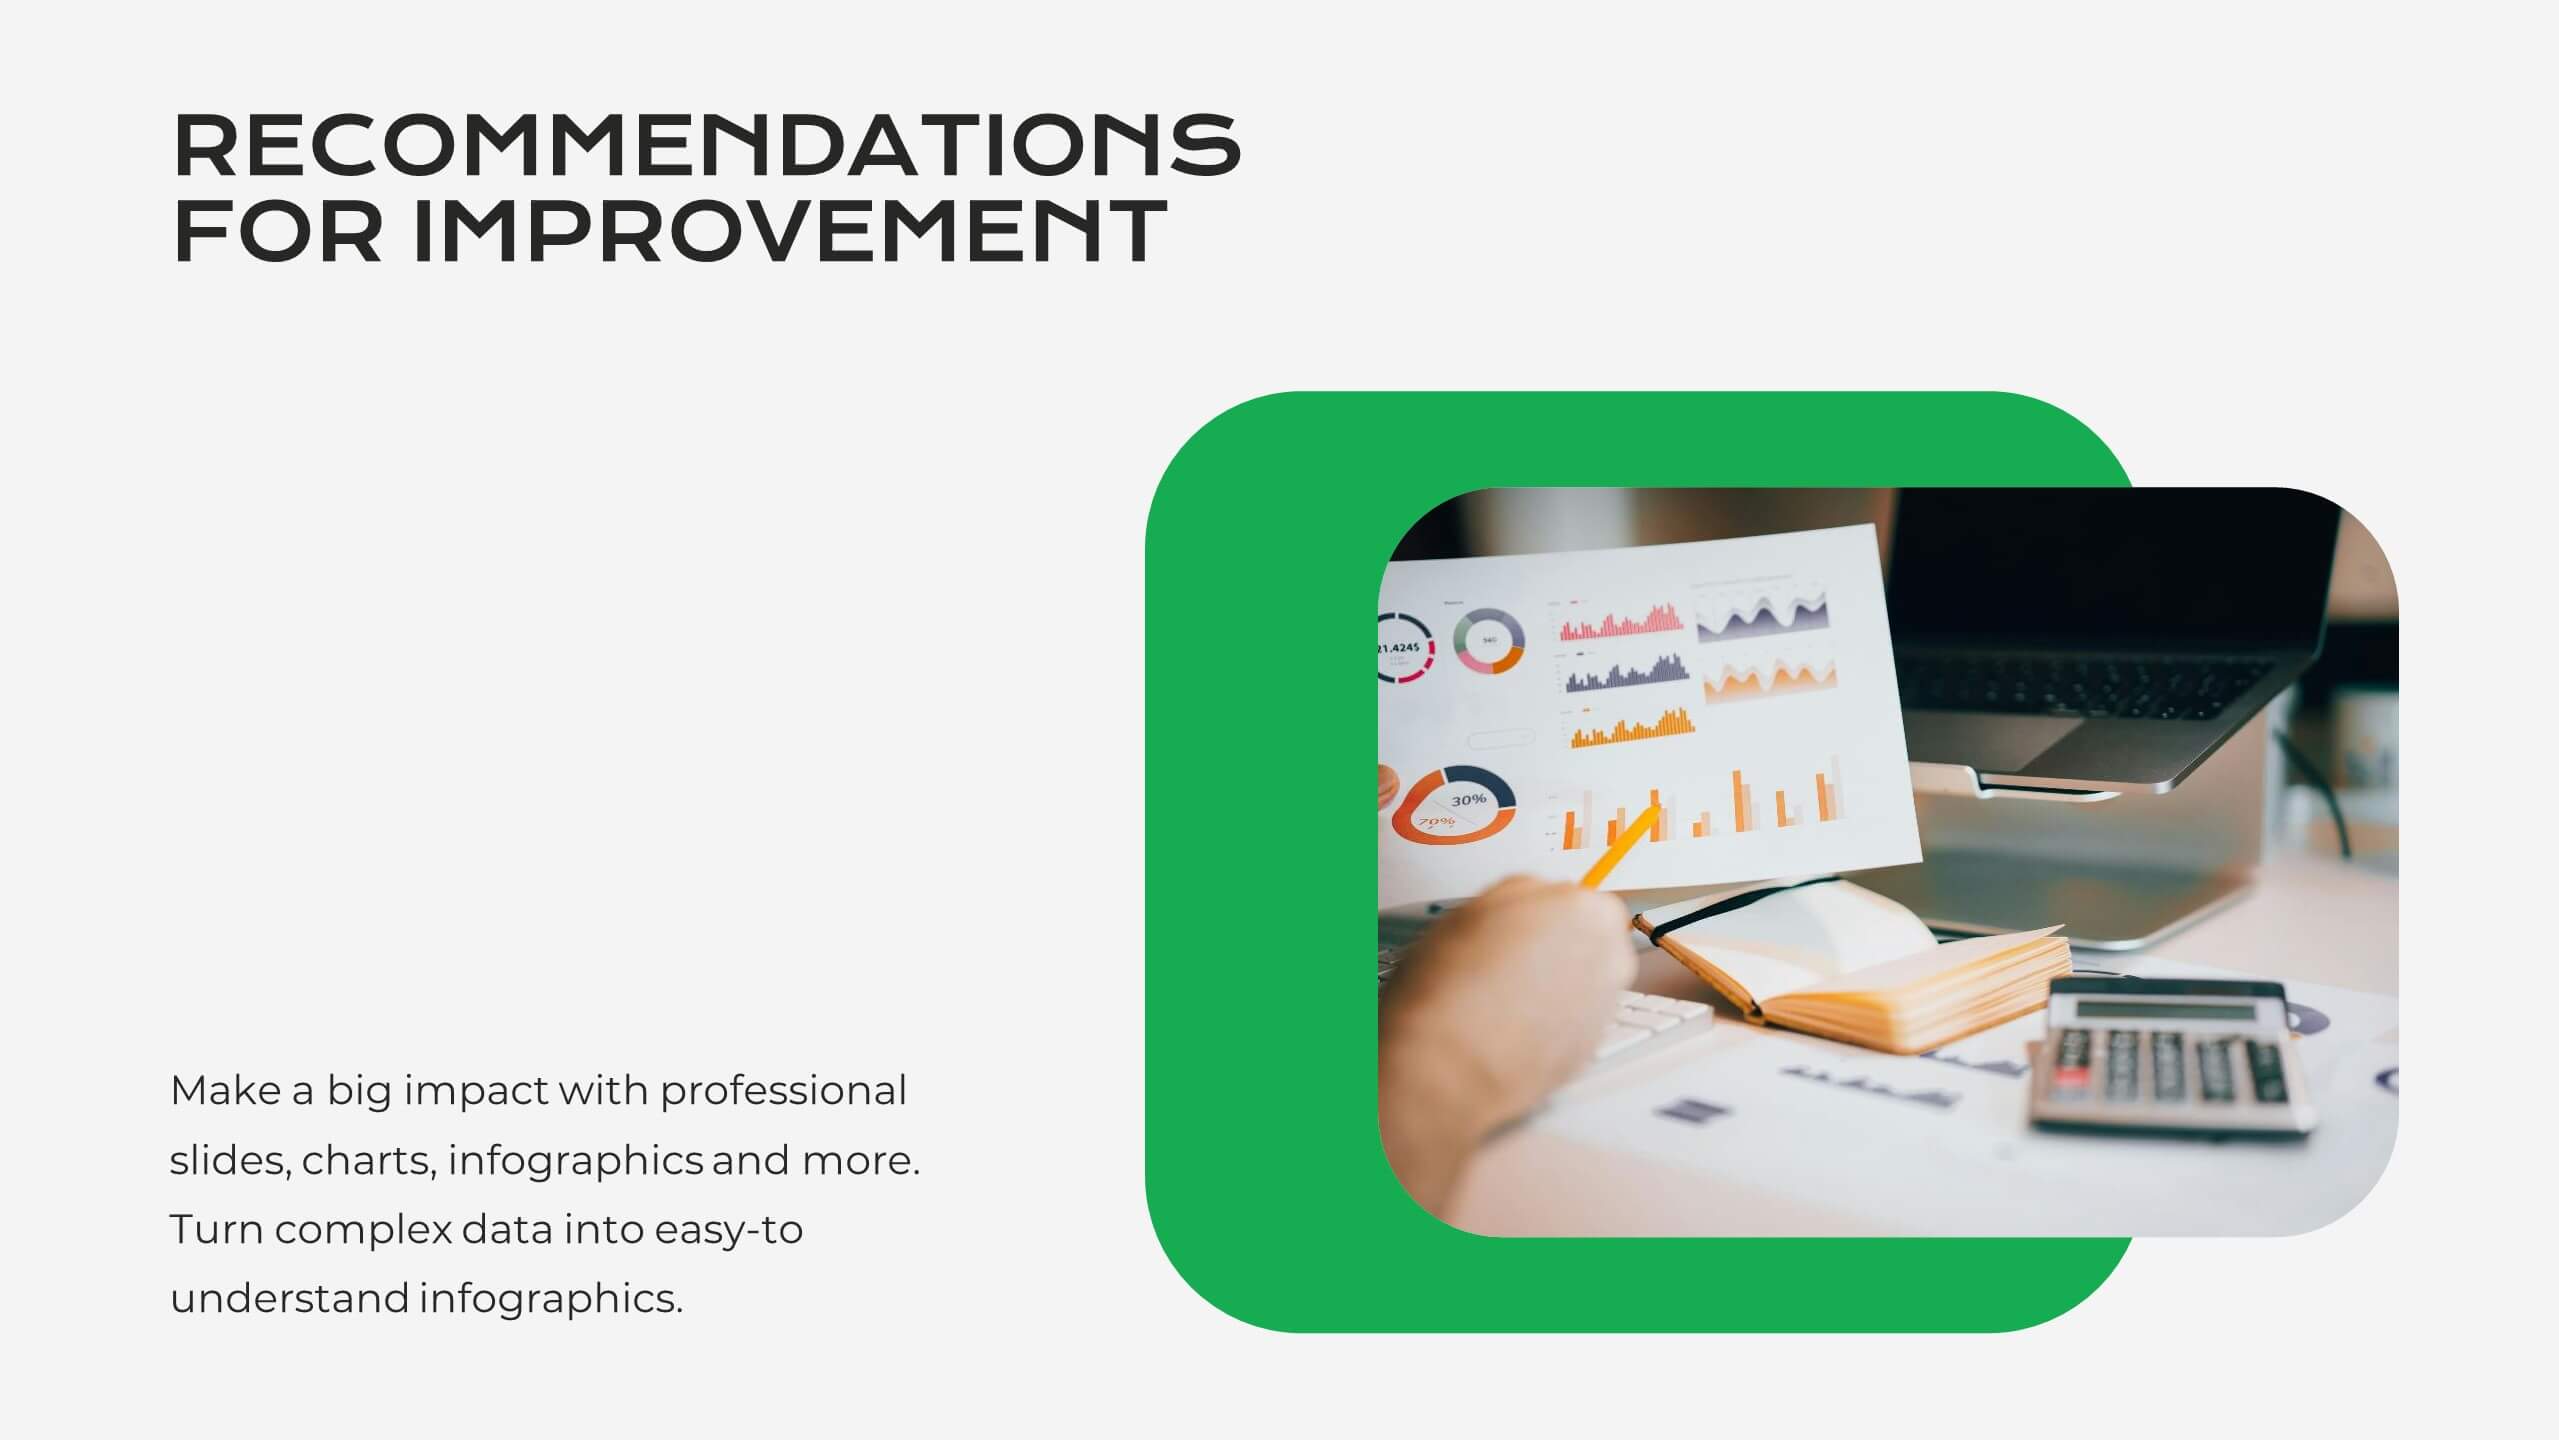
Serene Market Analysis Report Presentation
This modern and clean Market Analysis Report template is designed to help you present key data and insights with clarity and impact. Ideal for business professionals and analysts, it includes slides for key highlights, performance metrics, financial summaries, competitor insights, and strategic initiatives. The template's sleek layout ensures that your data is easy to understand and visually appealing, making it perfect for internal reports or client presentations. Customize it effortlessly in PowerPoint, Keynote, or Google Slides, and impress your audience with a polished and professional report.


26 diapositivas
Company Profile Simple Duotone Presentation
Introducing our premier company profile presentation template, designed to beautifully encapsulate the essence of your business. Set against a backdrop that transitions from the serene blue sky to a deeper, more intense blue, this template evokes feelings of limitless possibilities and profound depth. This dual-tone theme, with its varying shades of blue, not only emphasizes trust, professionalism, and reliability but also creates an atmosphere of calm and stability, essential attributes for showcasing your company's strengths and accomplishments. Modern in its layout, our template facilitates a structured presentation of your company's history, mission, achievements, and future aspirations. The design intricately merges the visuals of the expansive sky with the profound depth of the darker hue, creating a narrative that speaks of a firm foundation with an eye on soaring to new heights. Perfectly compatible with both PowerPoint and Google Slides, this template offers ease of customization. Whether it's adjusting the content to fit your corporate story or tweaking the design elements, this template offers flexibility and user-friendliness. Dive deep into your company's journey and aspirations with this exquisite blue-themed template. It's not just a presentation; it's a reflection of your company's ethos and vision. Utilize this template to give stakeholders, partners, and employees a p....


4 diapositivas
Data Table Infographic Presentation
Organize complex information clearly with the Data Table Infographic Presentation. This slide design features a structured table layout paired with icon-labeled column headers for visual clarity. Ideal for presenting statistics, performance metrics, survey data, or structured comparisons. Highlighted headers draw attention to key sections, making your data easy to digest. Fully editable in PowerPoint, Keynote, and Google Slides.


7 diapositivas
Customer Empathy Map Infographic Presentation
An Empathy Map infographic is a visual tool used to help understand the needs, wants, and behaviors of a particular customer. This template is a perfect way to gather and organize information about a person's experience and perspective, in order to better understand their motivations and desires. This empathy map infographic consists of a diagram that is divided into four quadrants: what the user thinks and feels, what they hear, what they see, and what they do. In each quadrant, information is gathered about the user's thoughts, feelings, and actions related to a particular product or service.


7 diapositivas
Mockup Infographic
Elevate your presentation game with this versatile collection of mockup templates, designed to showcase your digital projects in a sleek, professional manner. Each template features a clean and modern design, highlighting your work on various digital devices including smartphones, tablets, and computer screens. With a focus on simplicity and visual appeal, these mockups provide the perfect canvas for demonstrating websites, apps, and other digital products. The well-organized layouts allow for easy customization, letting you quickly insert your own images and text to match your project’s needs. Ideal for professionals in web development, app design, or digital marketing, this collection helps convey the functionality and aesthetics of your digital creations effectively. Utilize these mockups in client presentations, marketing materials, or portfolio showcases to give your audience a realistic preview of your digital solutions.


5 diapositivas
Benefits of Insurance Infographics
The purpose of insurance is to mitigate the financial impact of unexpected events or circumstances that may result in financial loss. These infographic templates are versatile and effective tools to convey the value of insurance to your audience. These are perfect to highlight the various advantages and importance of having insurance coverage. This serves as an engaging tool to educate and inform your audience about the benefits of different types of insurance policies. This makes it easy for viewers to understand the benefits and importance of insurance in various aspects of life. Compatible with Powerpoint, Keynote, and Google Slides.


5 diapositivas
Brain Chemistry Infographics
Brain chemistry refers to the complex interplay of chemicals, also known as neurotransmitters, that are responsible for transmitting signals within the brain. These infographic templates are designed to illustrate the intricate workings of brain chemistry. They aim to explain complex concepts in a clear and engaging way, making it suitable for educational settings, psychology courses, neuroscience presentations, or any context where understanding brain chemistry is essential. These templates set the foundation for exploring various aspects of brain chemistry. Colorful illustrations and icons help visualize the neurotransmitters and their impact.


4 diapositivas
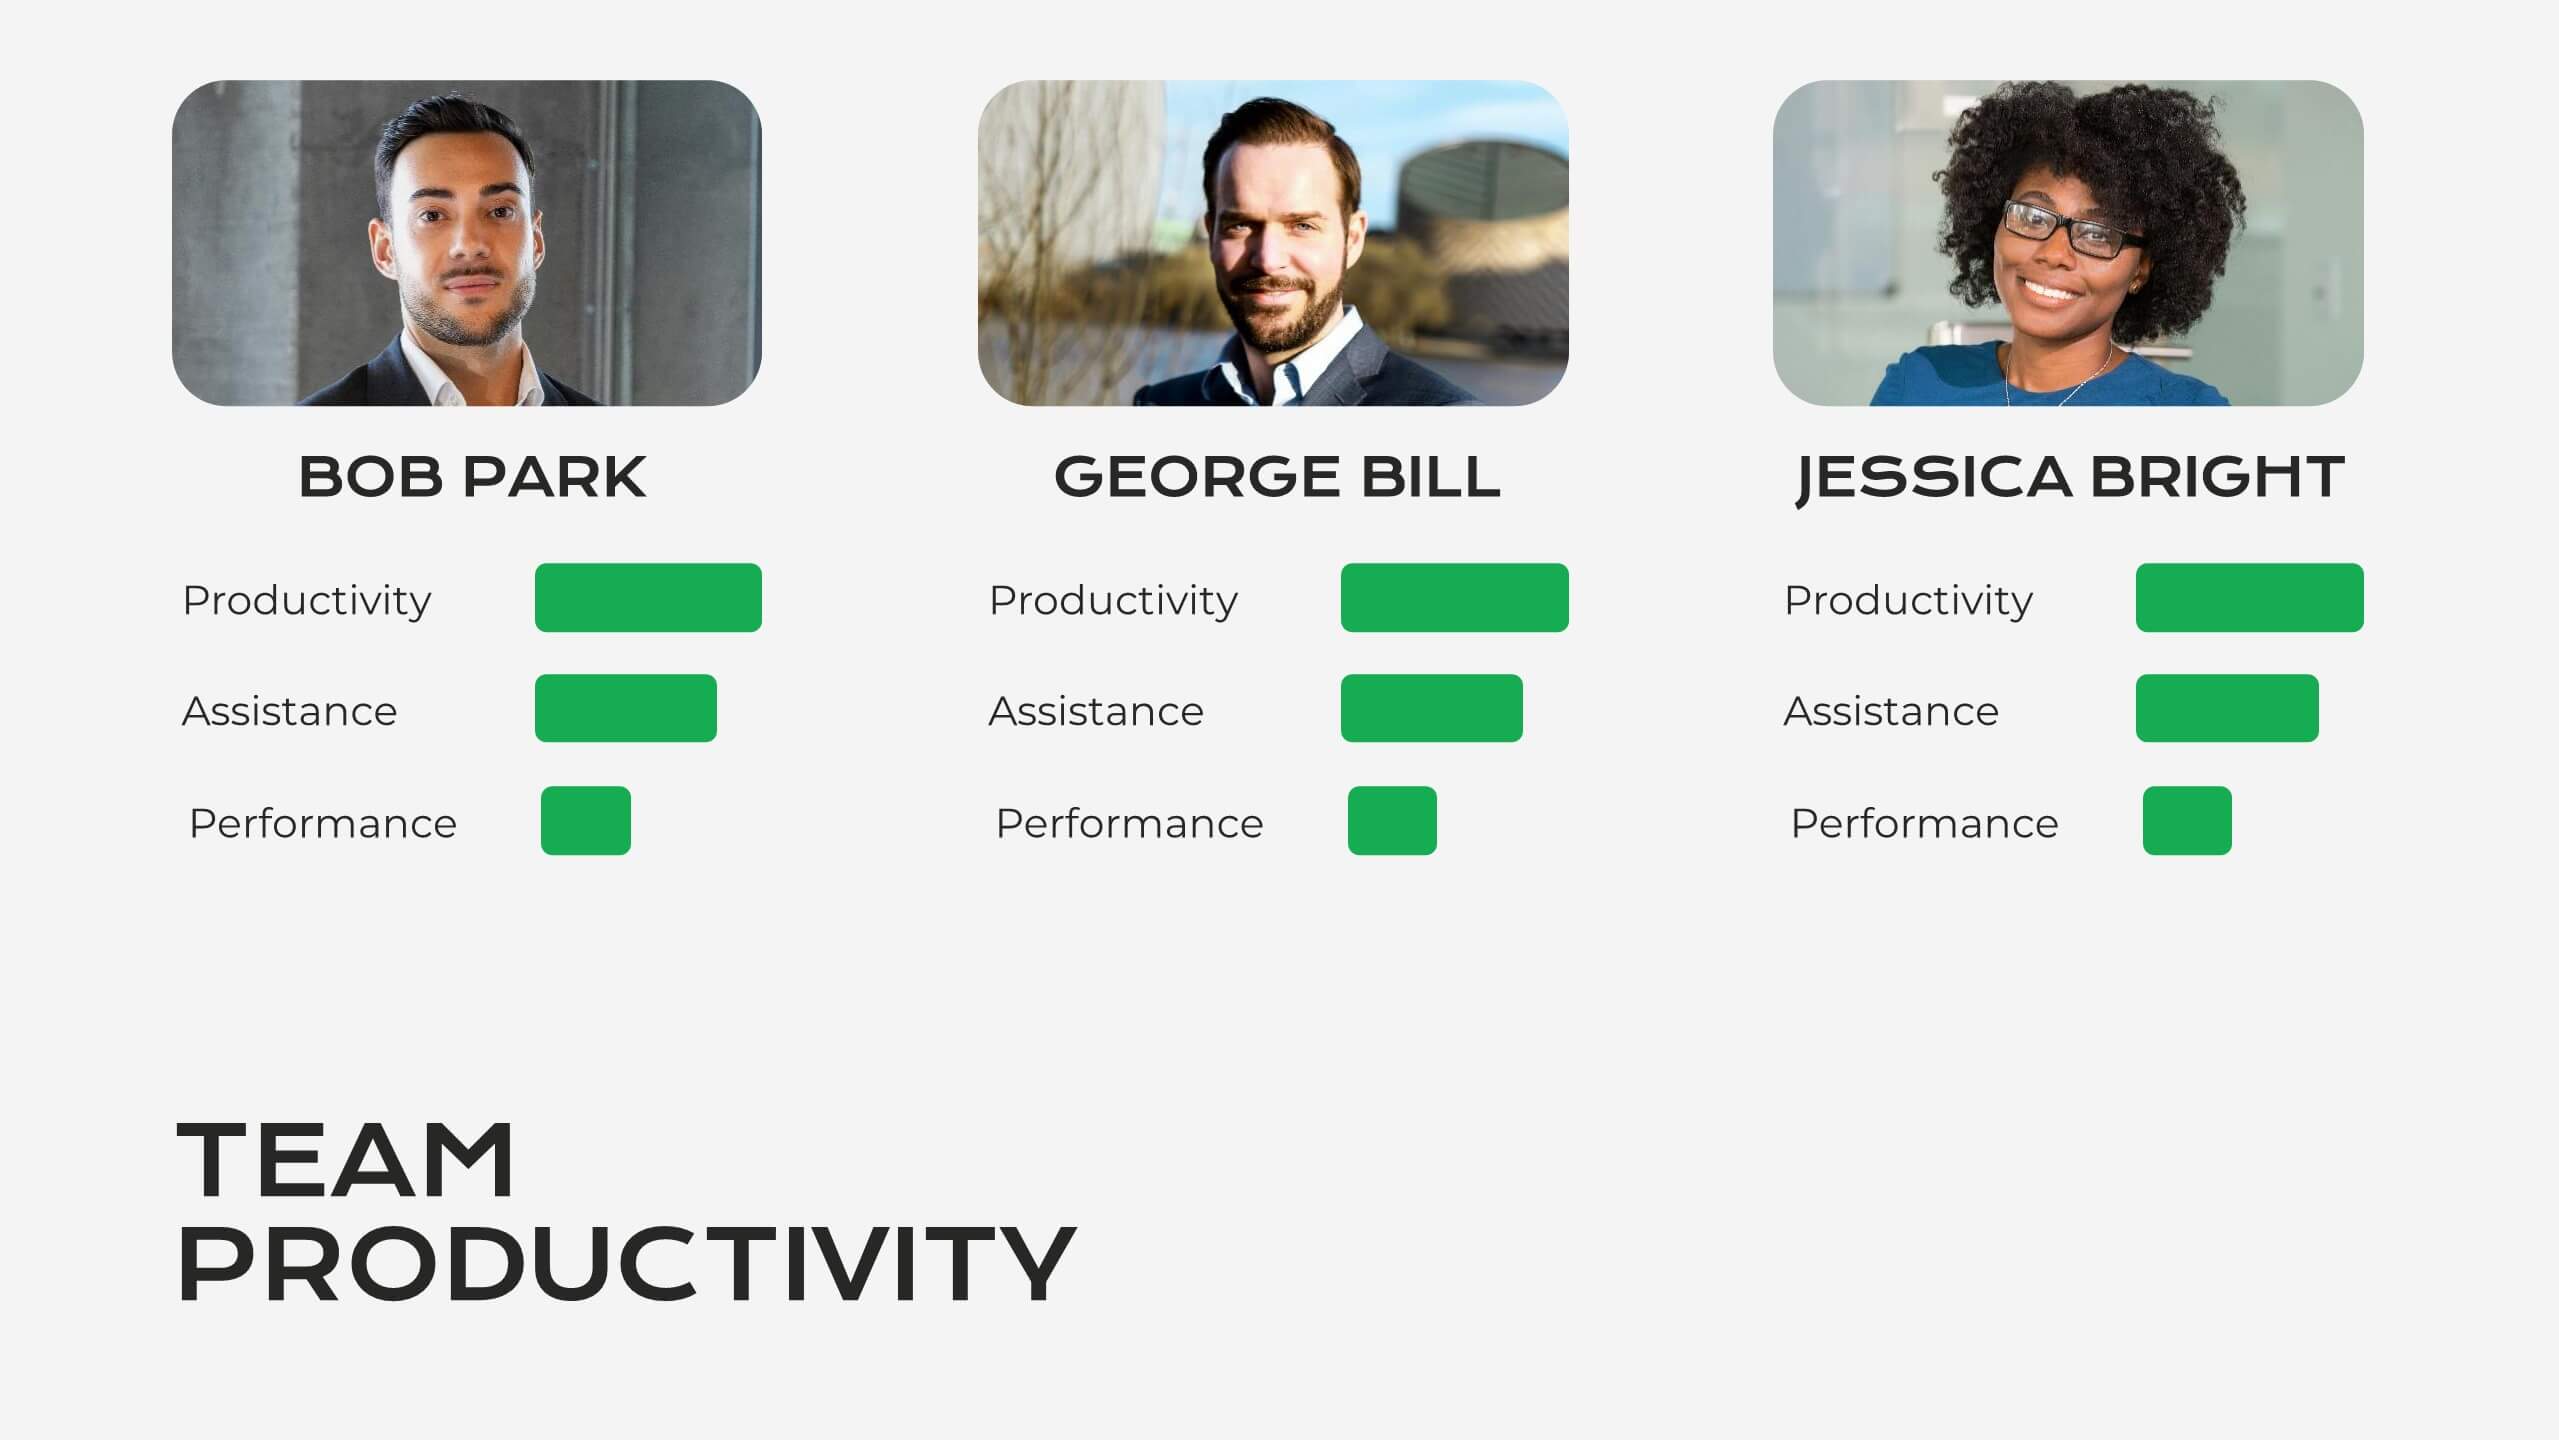
Illustrated Office Environment Templates Presentation
Bring your data to life with a fun, illustrated spin! This presentation template uses vibrant office-themed visuals to explain workplace stats, tasks, or organizational breakdowns with clarity. Perfect for showcasing team roles, resource allocation, or workflow insights. Fully compatible with PowerPoint, Keynote, and Google Slides for seamless customization.


4 diapositivas
Digital Marketing Strategy Presentation
Present your marketing insights with impact using this engaging digital marketing strategy slide. Featuring a modern bar chart with layered 3D blocks and icon-labeled highlights, this slide is perfect for showcasing strategy breakdowns, campaign priorities, or market performance data. Customize each section with concise titles and professional content. Ideal for marketers, agencies, and analysts. Fully editable in PowerPoint, Keynote, and Google Slides.


8 diapositivas
Business Challenge & Solution Presentation
Address complex issues with clarity using this business challenges and solutions presentation. Featuring a chess knight visual, it helps outline problems and corresponding strategies. Ideal for strategic planning, risk management, and executive briefings. Fully customizable in PowerPoint, Keynote, and Google Slides to fit your corporate or consulting presentation needs.


11 diapositivas
Moodboard Presentation
This Moodboard template is a vibrant tool for designers and creatives looking to showcase the aesthetic direction of their project. It starts with a dynamic cover slide, drawing you into the visual theme. As you progress through the slides, you are greeted with rich textures and a spectrum of colors carefully selected to inspire and evoke emotion. The slides dedicated to 'Textures' and 'Colors' serve not only as a palette but also as a canvas to communicate the essence of your creative vision. Questions like "Have you chosen your colors yet?" engage the audience, encouraging interaction and reflection on their choices. The 'Concept' and 'Keys' slides further detail the creative process and the core elements that will define the final design. The comprehensive Moodboard culminates in a credits slide, attributing all the inspirational sources that fueled the visual journey.


5 diapositivas
Business Plan Infographics
Elevate your strategic approach with the business plan infographics template. Cast in the motivational hues of orange, purple, and green, this template breathes life into your business strategy, illustrating your plan's potential. Entrepreneurs and corporate strategists will find this creative, vertical-style infographic an invaluable ally in conveying complex business plans with simplicity and visual flair. Compatible with Powerpoint, Keynote, and Google Slides. This dynamic template comes complete with innovative graphics, thematic icons, and designated image placeholders, all fashioned to articulate your business journey. Utilize this tool to captivate your audience.


22 diapositivas
Calcifis Qualitative Research Findings Presentation
Present your research insights with clarity and impact using this modern and engaging presentation template. Cover key areas such as research objectives, methodology, data analysis, key findings, limitations, and recommendations. The visually appealing design helps you communicate complex qualitative data effectively, making it ideal for academic, business, and market research presentations. Fully customizable and compatible with PowerPoint, Keynote, and Google Slides.


6 diapositivas
Circular Wheel Diagram Presentation
Bring motion and balance to your ideas with this clean, circular design that connects every element in a seamless flow. Ideal for showcasing continuous processes, team dynamics, or strategic cycles, it keeps your message clear and engaging. Fully compatible with PowerPoint, Keynote, and Google Slides for easy editing.