


Características


¿Tienes alguna pregunta?
Recomendar


7 diapositivas
Strategic Highlights Executive Summary Presentation
Showcase your business priorities with the Strategic Highlights Executive Summary Presentation. This layout features up to seven colorful, clearly labeled content blocks—perfect for summarizing goals, KPIs, initiatives, or focus areas. Easy to edit in PowerPoint, Keynote, Google Slides, or Canva for quick customization and clean executive reporting.


5 diapositivas
Medical Technology Infographics
Medical Technology refers to the use of innovative technologies, devices, and systems in healthcare to improve patient care, diagnosis, treatment, and overall healthcare delivery. These infographics are comprehensive and visually appealing designs that allow you to showcase the advancements and impact of medical technology in the healthcare industry. This template is perfect for presentations, reports, or educational materials related to medical technology. The template includes various vertical infographic elements that allow you to highlight the benefits, applications, and advancements in medical technology.


6 diapositivas
Efficient Scheduling and Time Management Presentation
Stay on time and on target with the Efficient Scheduling and Time Management presentation slide. Designed with smartwatch graphics showing time progression, this layout visually emphasizes planning, deadlines, and time-based tasks. Ideal for outlining agendas, productivity methods, or resource allocation strategies. Each time block includes editable text fields for key milestones or steps. Compatible with PowerPoint, Keynote, and Google Slides.


6 diapositivas
Stakeholder Management Analysis Infographics
Efficiently manage stakeholders with our Stakeholder Management Analysis infographic template. This template is fully compatible with popular presentation software like PowerPoint, Keynote, and Google Slides, allowing you to easily customize it to analyze and communicate your stakeholder management strategies. The Stakeholder Management Analysis infographic template offers a visually engaging platform to assess, categorize, and prioritize stakeholders based on their influence and interest in your projects or initiatives. Whether you're a project manager, business leader, or involved in stakeholder engagement, this template provides a user-friendly canvas to create informative presentations and reports on stakeholder management. Optimize your stakeholder relationships with this SEO-optimized Stakeholder Management Analysis infographic template, thoughtfully designed for clarity and ease of use. Customize it to showcase stakeholder mapping, engagement strategies, and communication plans, helping you ensure that your stakeholders' needs and expectations are met effectively. Start crafting your personalized infographic today to excel in stakeholder management.


4 diapositivas
Minimal Company Profile Deck Presentation
Make a bold first impression with this sleek, minimal layout designed to showcase your company’s vision, services, and team with clarity and style. Perfect for startups or established brands, it balances professionalism and creativity effortlessly. Fully editable and compatible with PowerPoint, Keynote, and Google Slides for seamless customization.


8 diapositivas
Customer Demographics Target Market Presentation
Dive into the depths of your audience with the "Customer Demographics Target Market" presentation template. Ideal for marketers and businesses aiming to understand and segment their customer base effectively, this template offers a vibrant, clear visual breakdown of demographic data. Ensure your strategic communications resonate with the right crowd, with compatibility for PowerPoint, Keynote, and Google Slides.


7 diapositivas
Oceania Population Infographic Presentation
An Oceania map infographic is a visual representation of the Oceania region, which includes Australia, New Zealand, and the many small islands and archipelagos in the Pacific Ocean. This informative template highlights the geography, population, culture, history, and other relevant information about the region. This Oceania map infographic can be designed in a variety of styles and formats, including a political map, topographic map, population density map, and climate map. This template is compatible with Powerpoint, Keynote and Google Slides making it very easy to edit and include your data.


4 diapositivas
Veterinary Practice Overview Presentation
Give your veterinary insights a professional touch with this clean, modern infographic layout. Designed to showcase workflows, patient care processes, and team structures, it helps present information clearly and visually. Fully customizable and compatible with PowerPoint, Keynote, and Google Slides for easy editing and seamless presentation design.


26 diapositivas
Premium Finance for Daily Life Presentation
Introducing our Premium Finance for Daily Life Presentation template this is a comprehensive and informative tool to educate individuals about the concept of premium finance and its relevance in everyday life. This presentation aims to provide valuable insights on how premium finance can be utilized to manage and optimize personal finances. The slides are fully customizable and compatible with PowerPoint, Keynote, and Google Slides. It features a professional design with clean layouts, visually appealing graphics, and icons related to finance and daily life activities. The presentation can cover various topics related to premium finance.


7 diapositivas
Responsibility Assignment Matrix Infographic Presentation Template
The Responsibility Assignment Matrix is a graphical tool used to visually represent the various assignments and the roles of each individual in a project. It helps in better understanding who is responsible for what, and who is accountable for results. This is a matrix that identifies the key tasks involved in a project, and maps them to the individuals responsible for completing them. Use this template to emphasizes on the role of managers and the organizational goals. This simple template is designed to help teams create an effective accountability model, perfect for your next project!


26 diapositivas
Aedele Presentation Template
We all know how important food is, it's the center of life. We plan our days around food, we travel to eat food and our emotions are often tied up in food. This template was designed for people who love food and know how important it is to stand out from the crowd when it comes to the culinary world. Whether you're an investor, a food critique, a restaurant owner or simply a foodie we have all the classy modern slides you need to really make an impact on your audience and make sure your message doesn't get lost amongst all the other exciting talks and presentations at your next pitch meeting.


7 diapositivas
Step Numbers Infographic
A numbers infographic is a visual representation of data, statistics, or numerical information presented in a clear, concise, and visually appealing manner. This infographic template aims to communicate complex numerical data or figures in a way that is easy to understand and interpret. Compatible with Powerpoint, Keynote, and Google Slides. Utilizes the charts, graphs, icons, and other graphical elements to represent numerical data. These infographic visuals make it easier for viewers to grasp the meaning behind the numbers. This template will allow you to focus on presenting key numerical insights.


5 diapositivas
Sales and Revenue KPI Snapshot Presentation
Present your top metrics with this clean Sales and Revenue KPI Snapshot slide. Display up to four key performance indicators using icons, percentage bars, and customizable labels. Ideal for business reviews, marketing updates, and executive dashboards. Fully editable in PowerPoint, Keynote, and Google Slides for seamless integration.


5 diapositivas
Foundation of Success Pillars Presentation
Dive into the structural essence of your enterprise with our engaging 'Foundation of Success Pillars' presentation template. Vividly illustrate the key components vital for organizational prosperity. Ideal for presenting corporate strategies and values. Compatible with PowerPoint, Keynote, and Google Slides, it's perfect for enhancing your presentation visuals.


6 diapositivas
Europe Regions Infographic
Europe is a diverse continent with various regions that have their own unique characteristics and cultural identities. This infographic provides an overview of the different regions in Europe. It is designed to help viewers understand the diverse geography, culture, and characteristics of each region within Europe. The template features a map of Europe that highlights the various regions. Viewers can easily identify and explore each region on the map. The template includes slides dedicated to providing key information such as capital cities and major landmarks. The template incorporates statistical data to showcase key facts and figures about each region.


22 diapositivas
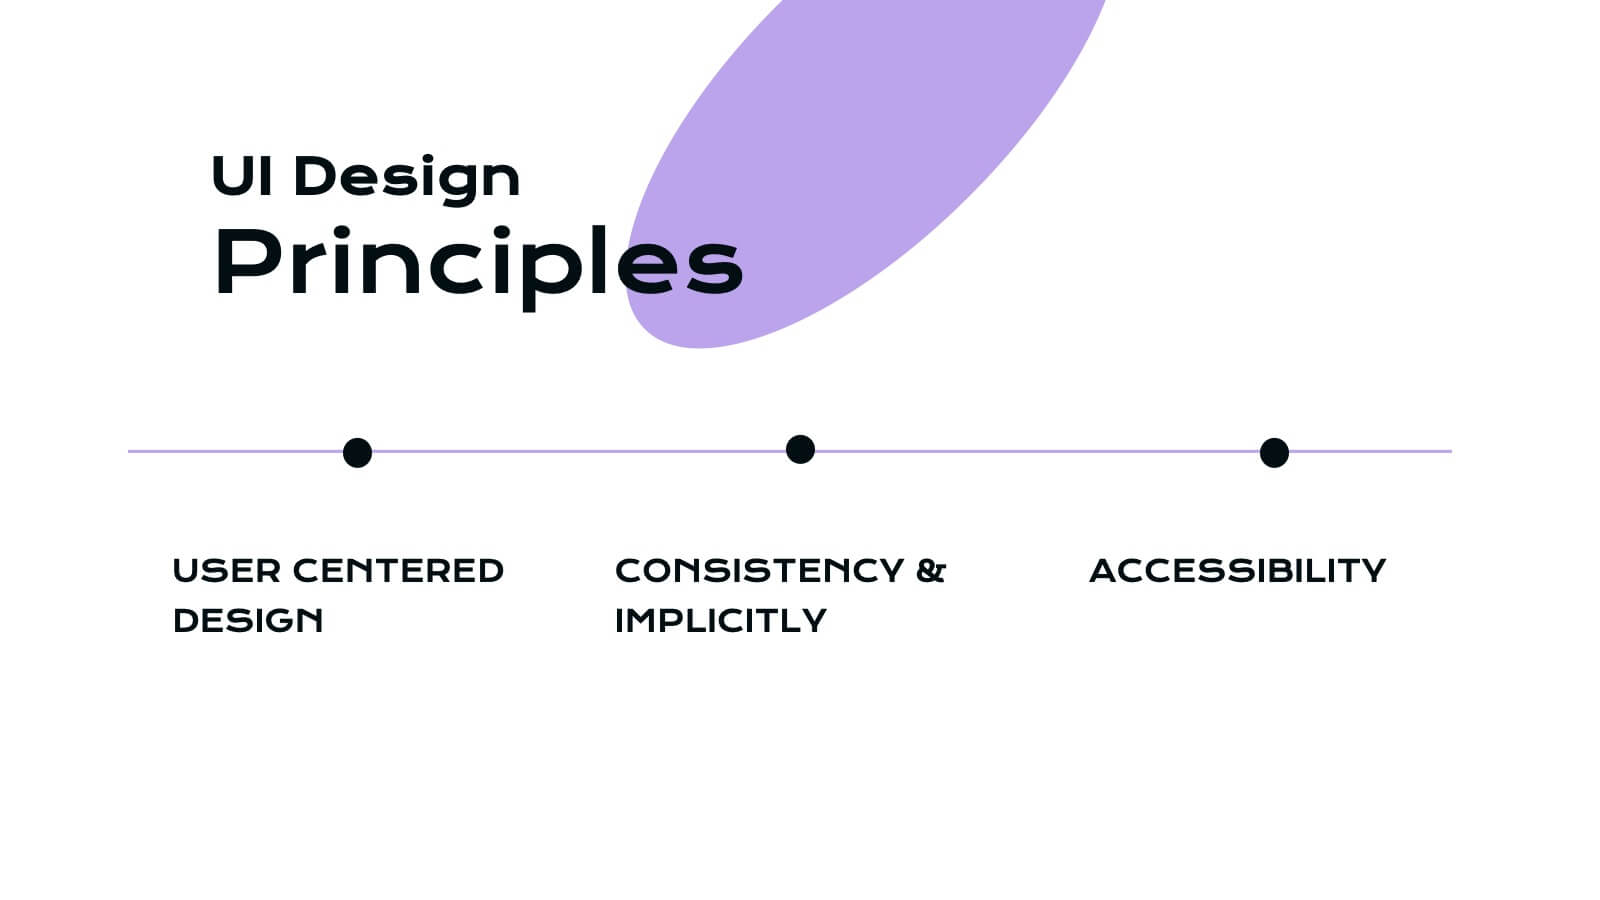
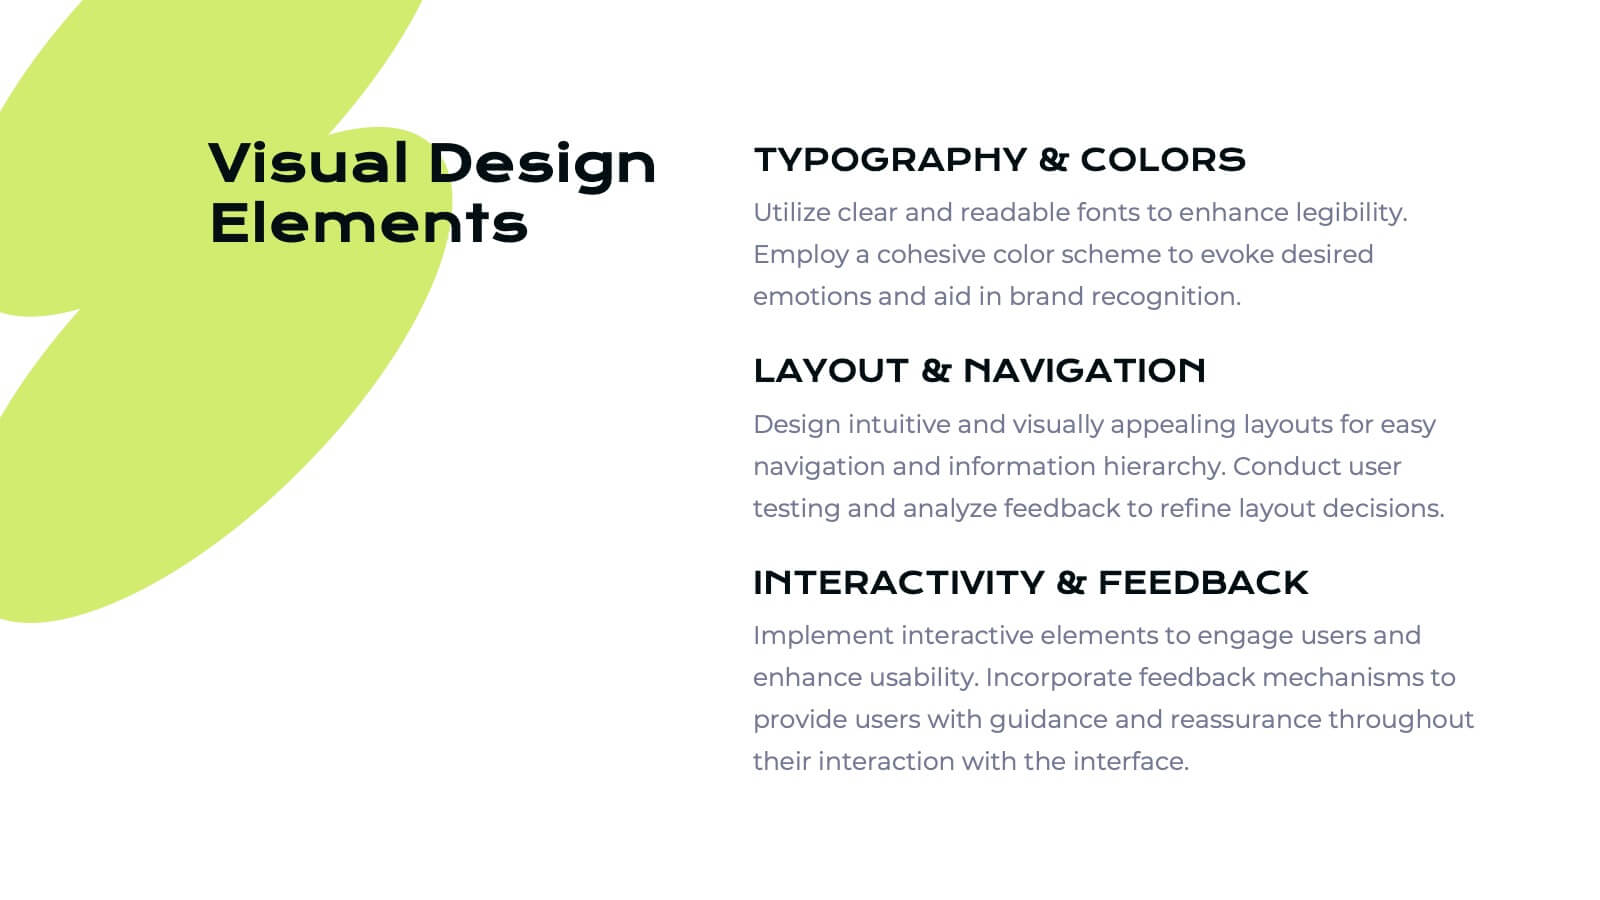
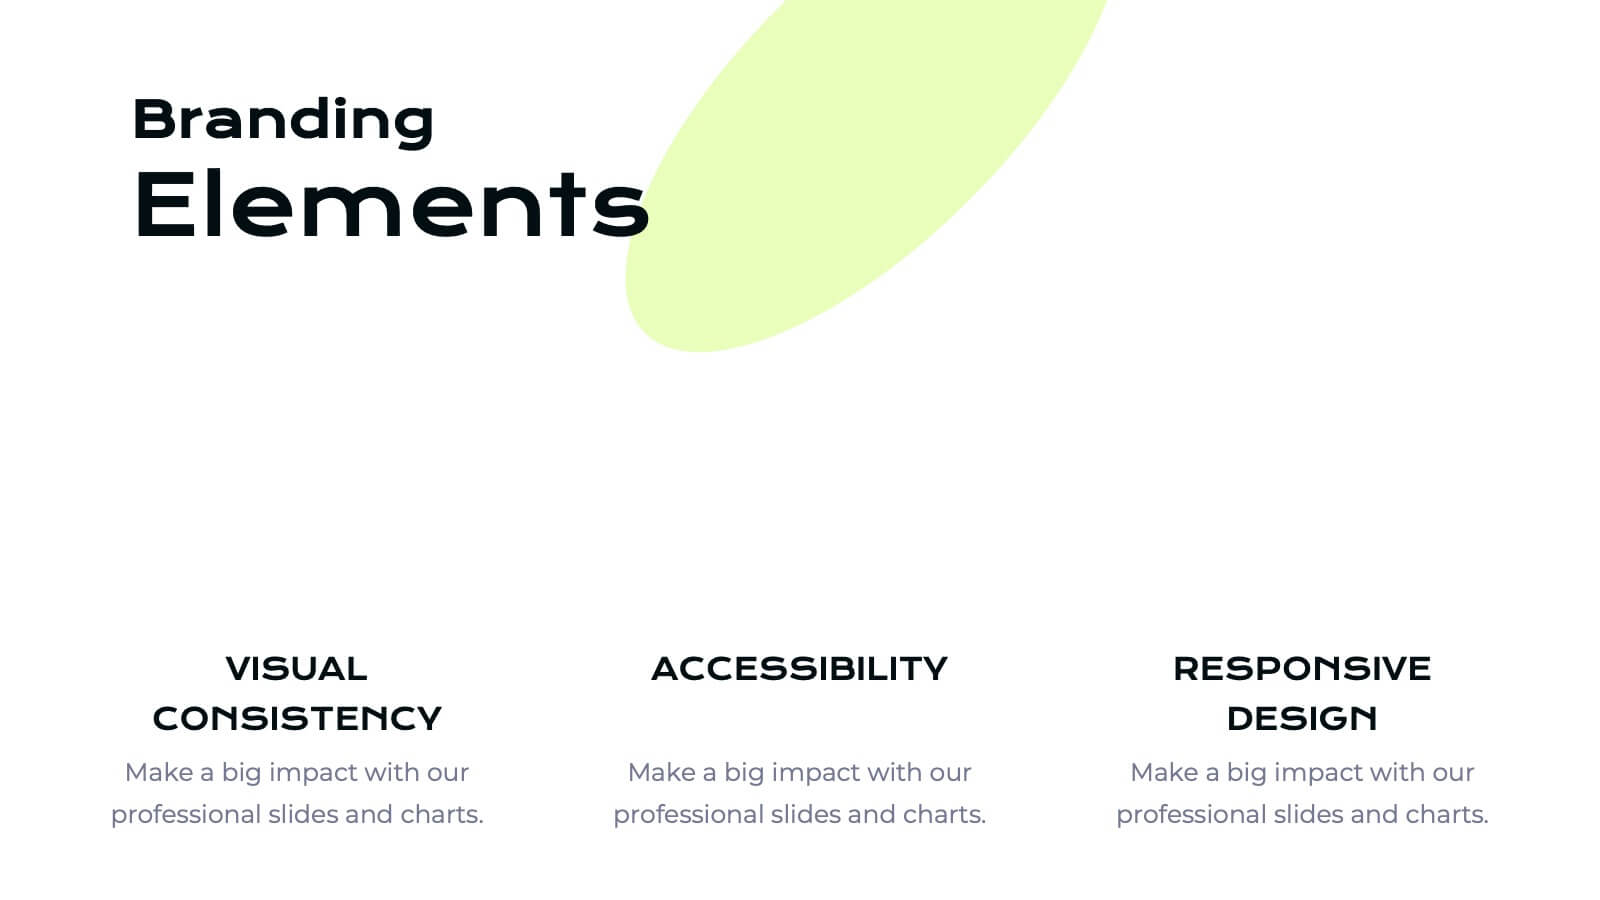
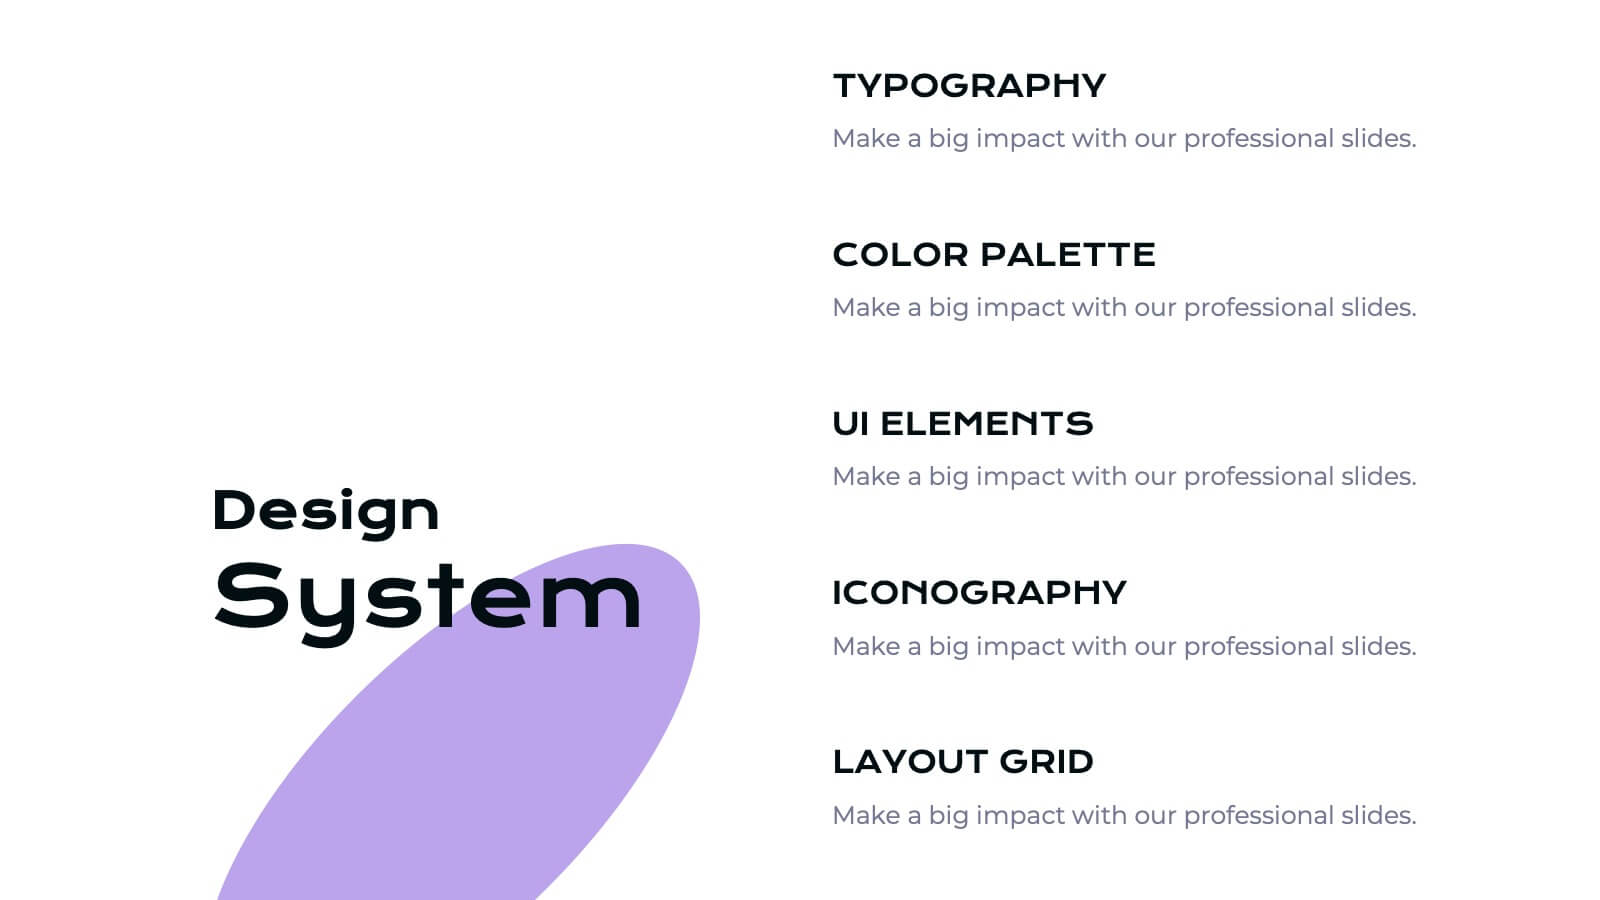
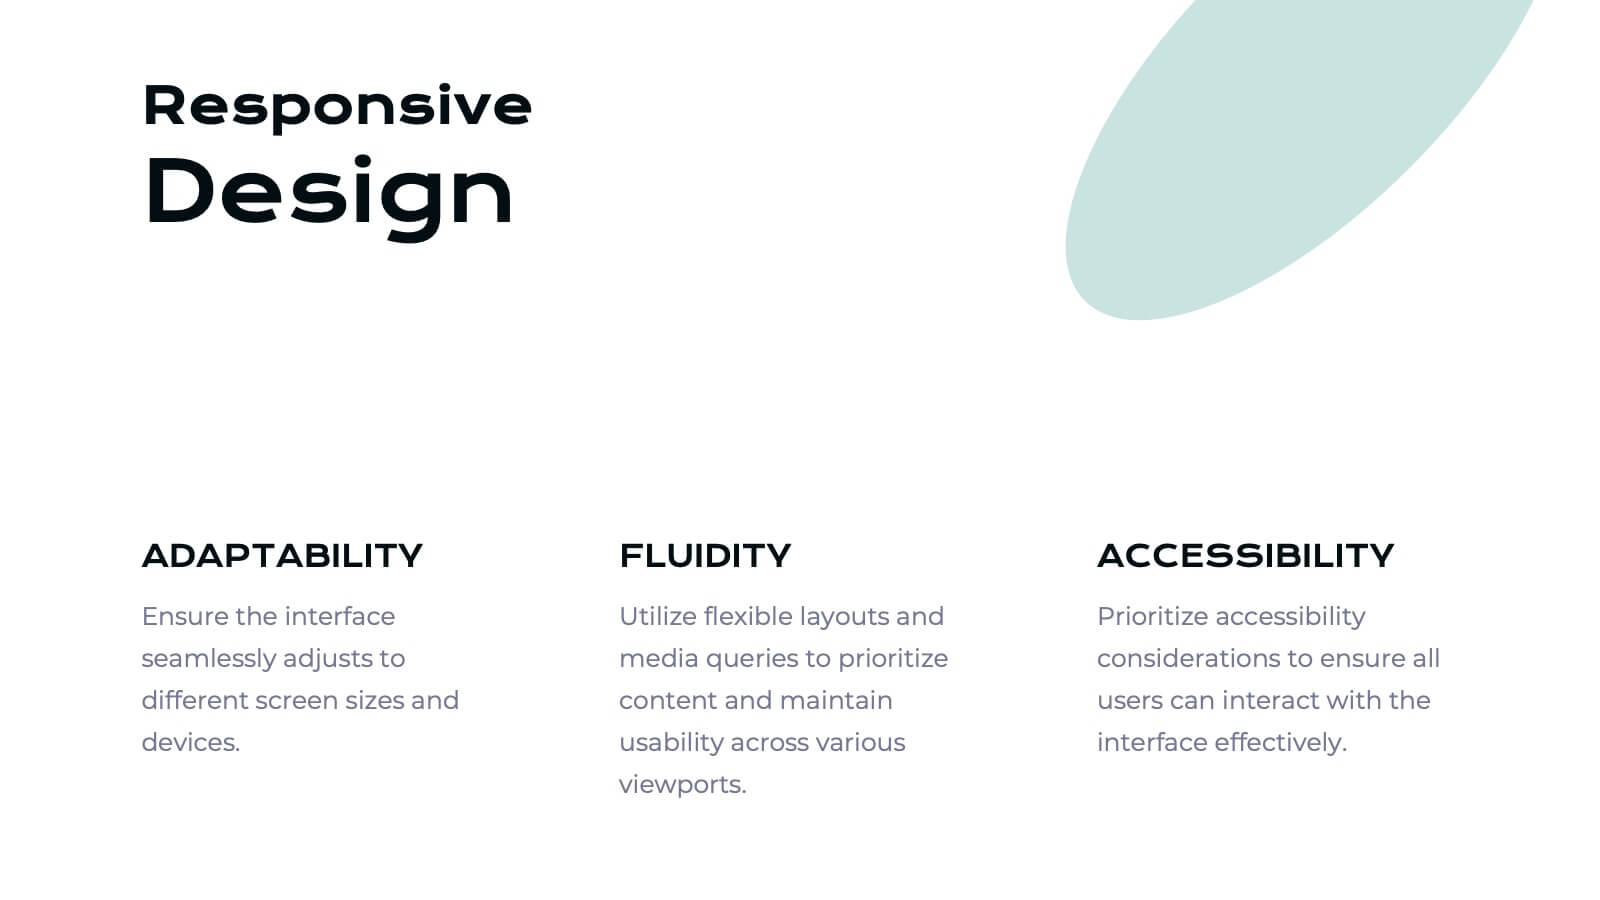
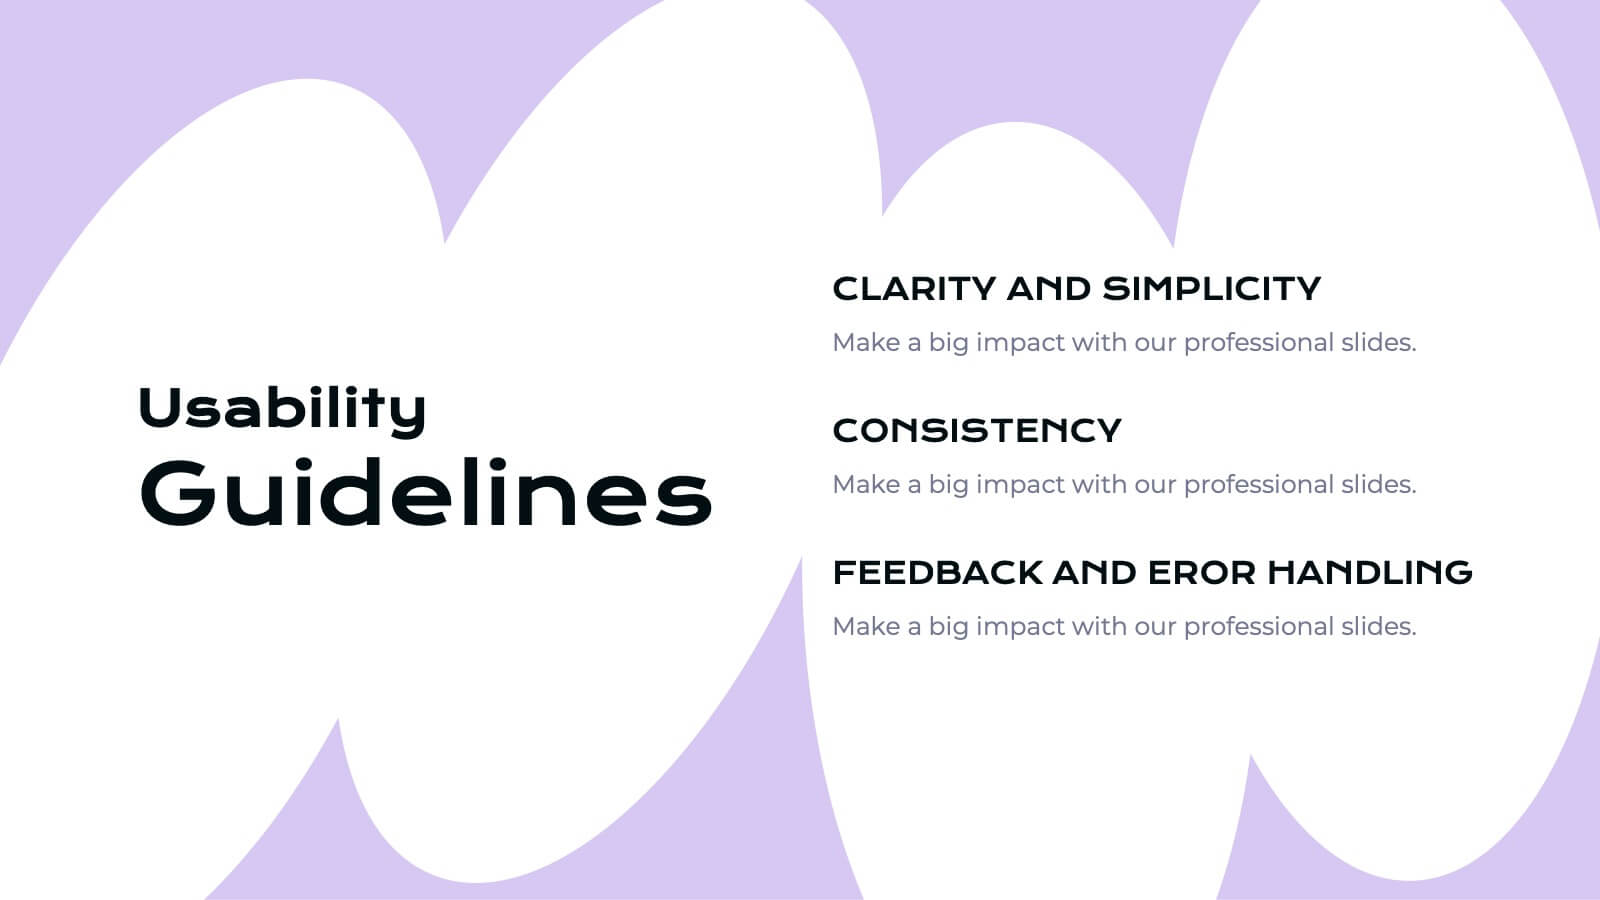
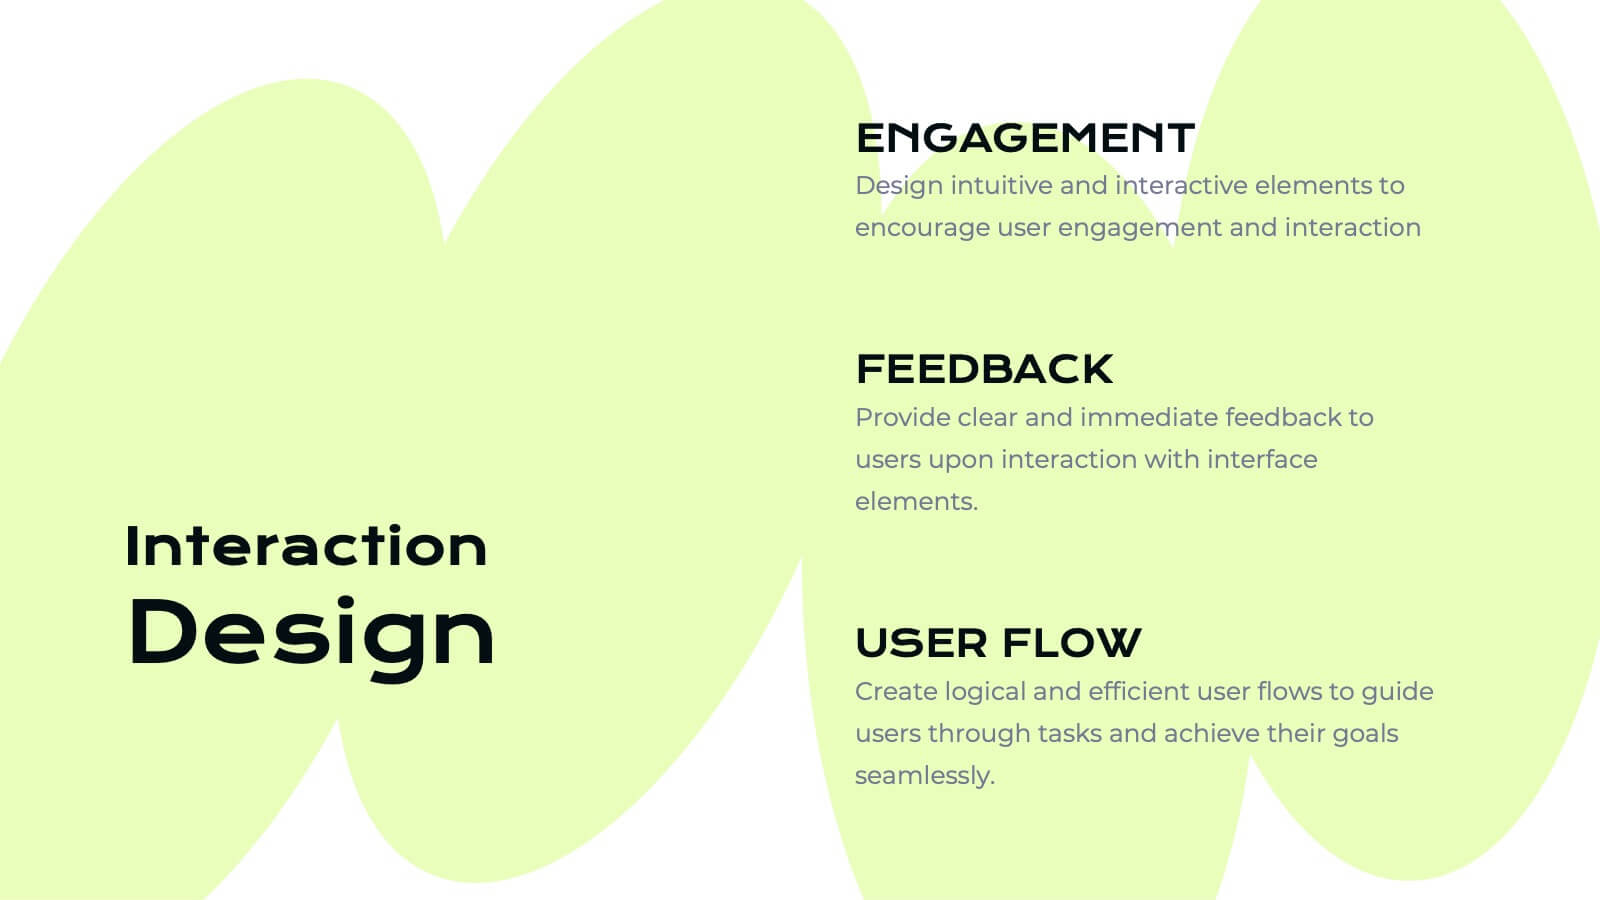
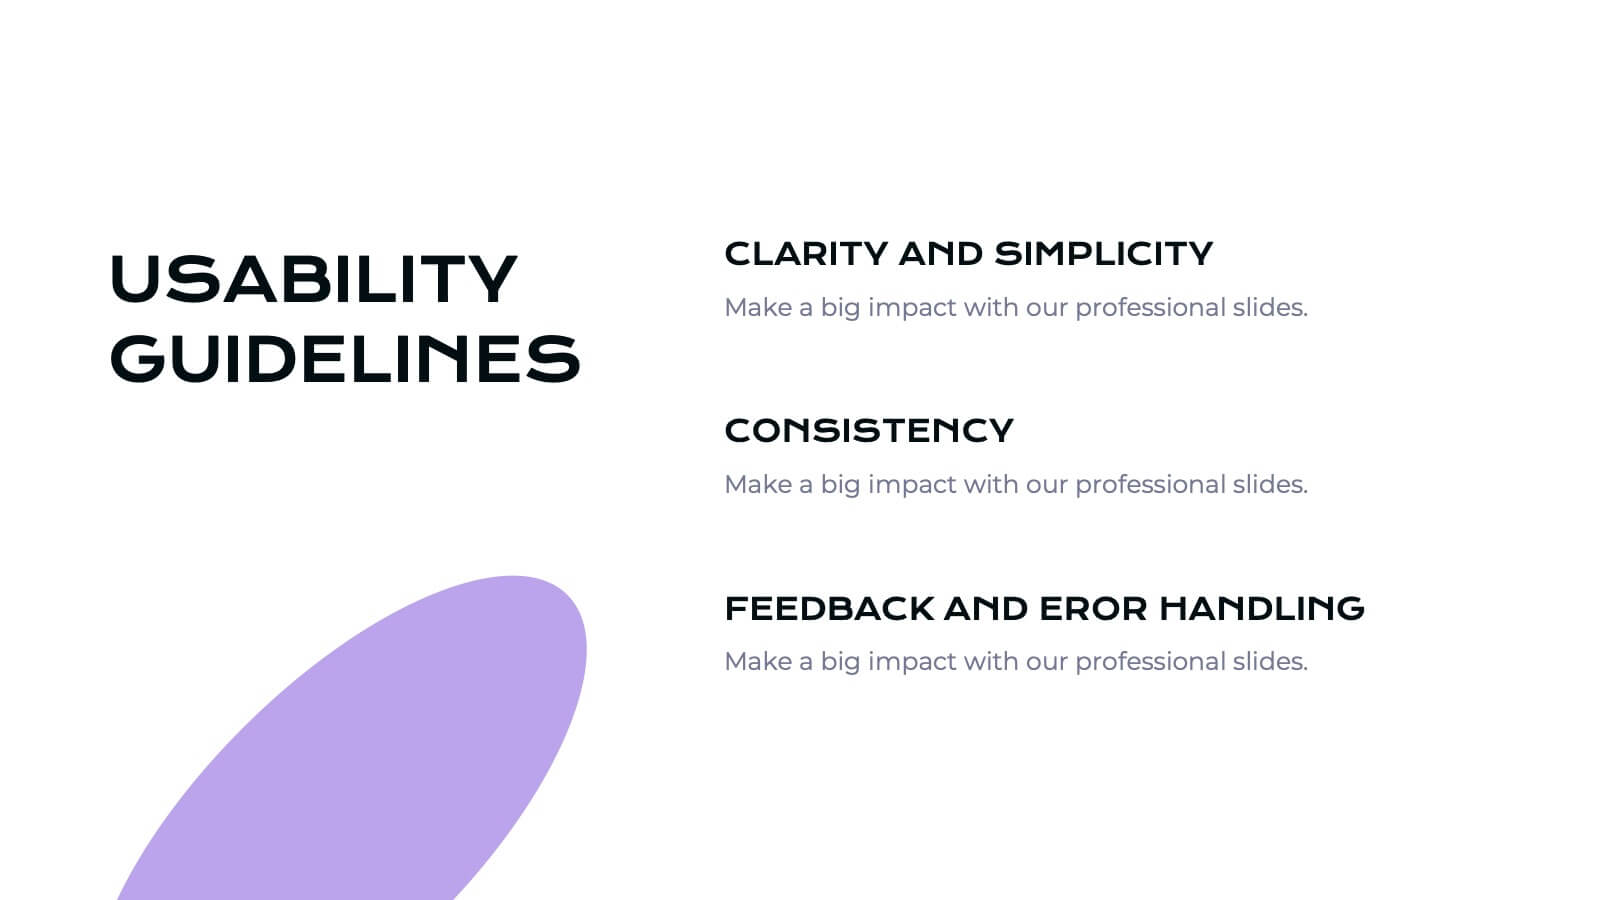
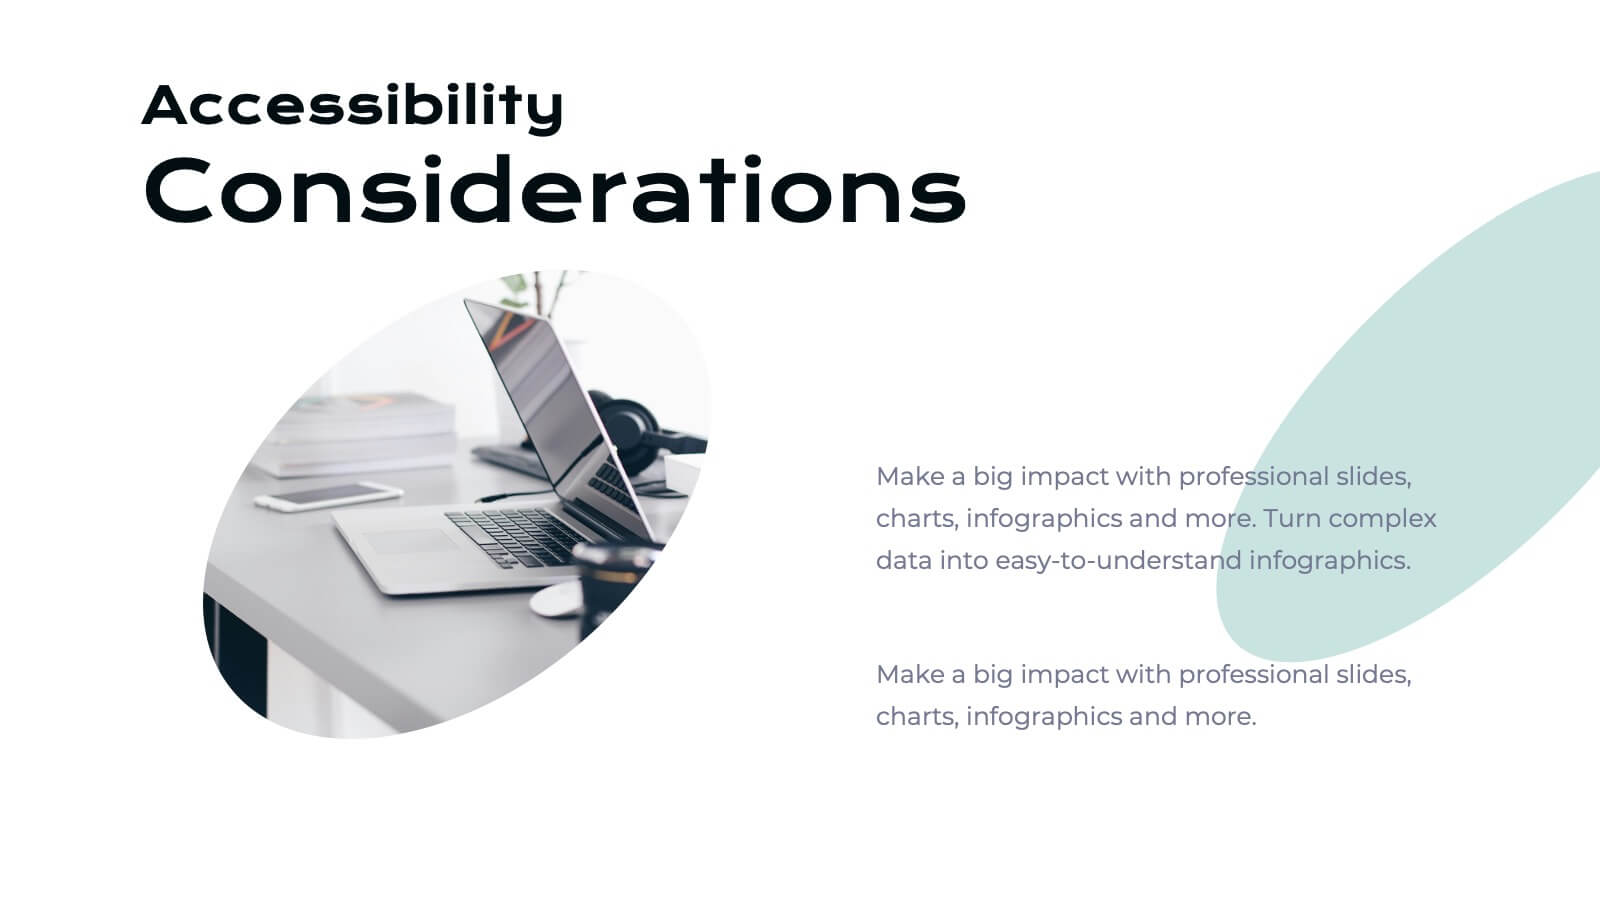
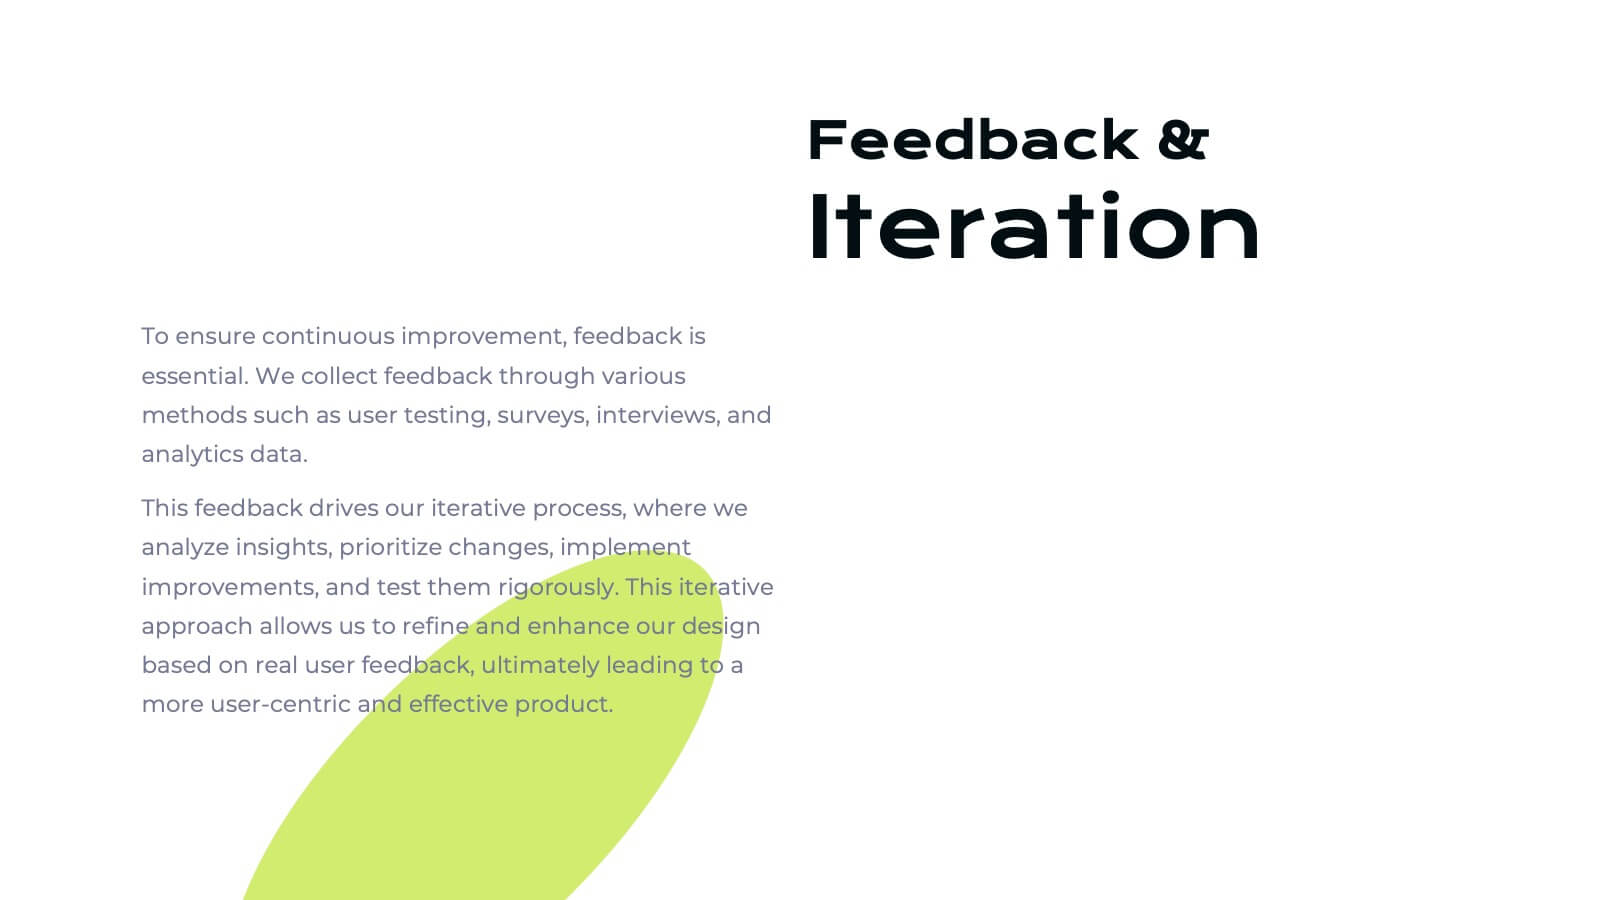
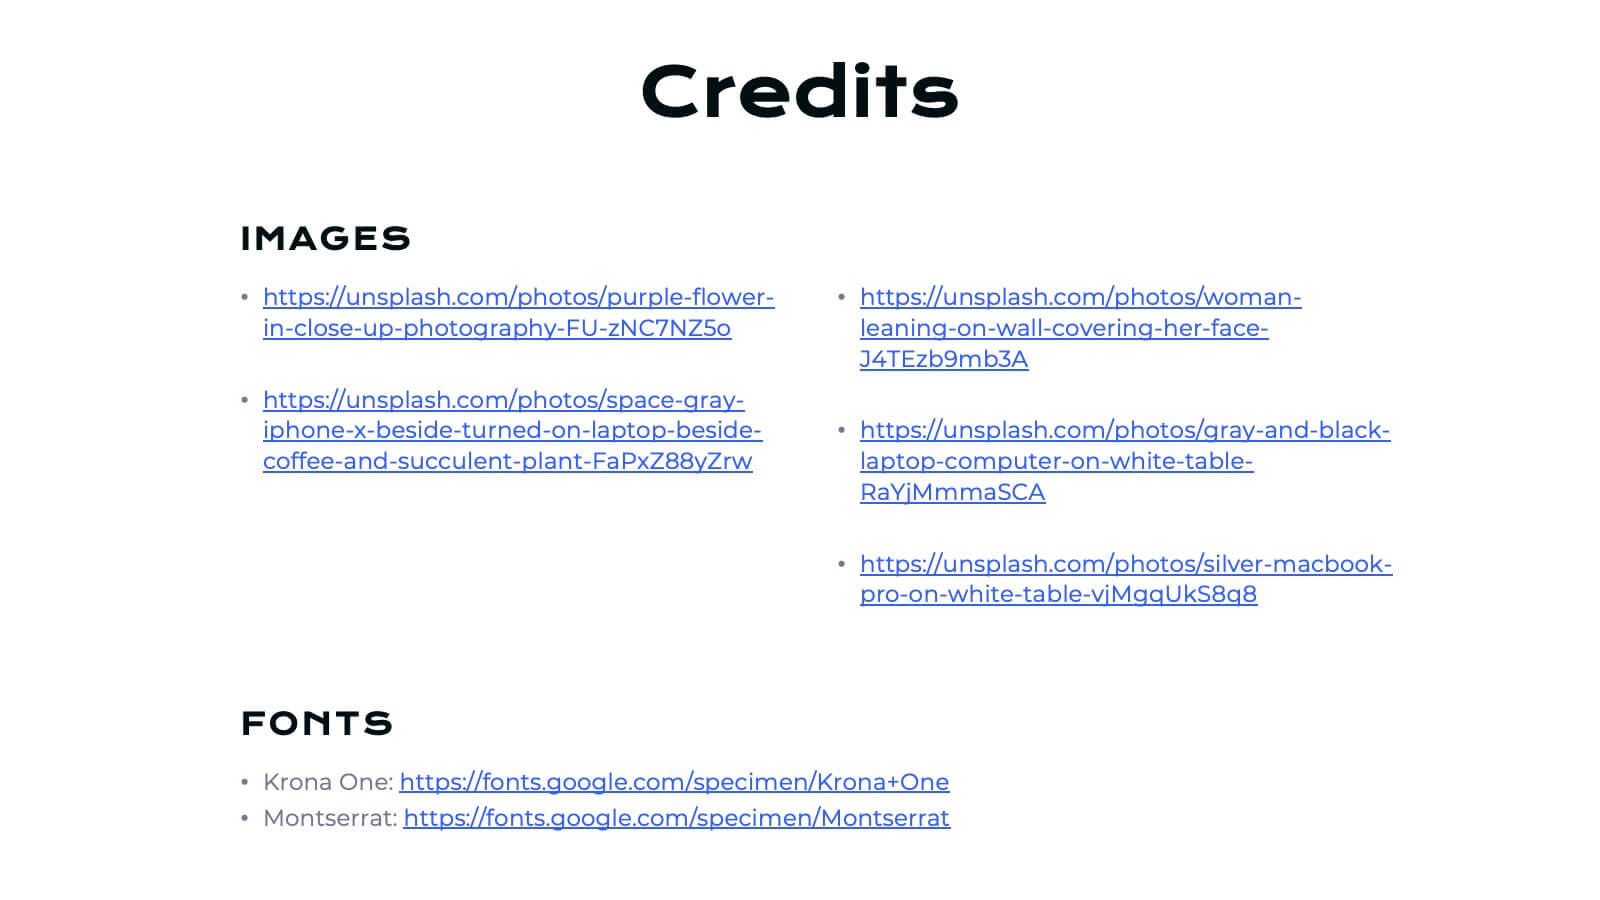
Ifrit User Experience Proposal Presentation
Unleash the power of great design with this fiery Ifrit-inspired presentation, perfect for delivering your user experience proposal! This template lets you showcase your UX strategies, research, and design process in a visually striking and well-organized format. Impress stakeholders with every slide. Compatible with PowerPoint, Keynote, and Google Slides.


6 diapositivas
Business Growth Metrics Butterfly Chart
Highlight performance patterns and opportunities with the Business Growth Metrics Butterfly Chart Presentation. This engaging layout uses mirrored radial segments to present six growth indicators—ideal for tracking progress across two categories, departments, or timeframes. The butterfly-shaped curves draw the viewer’s attention to the center, making comparisons intuitive and visually balanced. Fully customizable in PowerPoint, Keynote, and Google Slides, this template is perfect for showcasing KPI trends, sales metrics, or marketing performance.