


Características


¿Tienes alguna pregunta?
Recomendar


7 diapositivas
Business Decision-Making Questions Presentation
Streamline your decision-making process with this engaging and structured presentation slide. Featuring a lightbulb and question mark design, this template effectively illustrates problem-solving and strategic choices in a professional and visually appealing way. Ideal for business strategy, consulting, and brainstorming sessions, it is fully editable, allowing you to customize text, colors, and layout to fit your needs. Compatible with PowerPoint, Keynote, and Google Slides for seamless use.


5 diapositivas
Insurance Policy Infographics
Dive into the intricacies of insurance with our insurance policy infographics. Rendered in a professional palette of blue and an array of engaging colors, this creative, vertical template simplifies the often complex world of insurance policies. Ideal for insurance agents, companies, and educators, it provides a visual aid to explain coverage specifics, terms, and conditions or to compare policy offerings clearly and effectively. The infographic includes aesthetically pleasing graphics, symbolic icons, and designated spaces for factual data, making it a quintessential tool for enhancing audience understanding and promoting informed decision-making.


6 diapositivas
Scrum and Kanban Agile Delivery Presentation
Streamline your Agile processes with this modern Scrum and Kanban workflow slide. Highlight six key stages in your delivery cycle using a sleek, color-coded format with icons. Ideal for project managers, developers, and Agile teams. Fully editable in PowerPoint, Keynote, and Google Slides. Clean, professional layout for maximum clarity.


22 diapositivas
Galvonic Research Proposal Presentation
Present research insights professionally with this comprehensive proposal template. Covering objectives, methodology, findings, and implications, it provides a clear structure for academic or market research projects. Compatible with PowerPoint, Keynote, and Google Slides, it’s ideal for presenting detailed analysis, conclusions, and future directions.


5 diapositivas
Investor-Ready Business Pitch Plan Presentation
Make your business roadmap stand out with this dynamic visual journey, perfect for impressing investors from the first slide. This infographic-style pitch deck helps clearly outline your business strategy across five milestones, using vibrant colors and icons for easy comprehension. Fully compatible with PowerPoint, Keynote, and Google Slides.


4 diapositivas
3-Step Action Plan Next Steps Presentation
Turn your next big idea into a clear, achievable plan with this structured, goal-focused layout. Designed to visualize progress through three defined stages, it’s perfect for strategic planning, project timelines, or team roadmaps. Fully compatible with PowerPoint, Keynote, and Google Slides for smooth editing and professional presentation delivery.


5 diapositivas
Target Market and Audience Segmentation Presentation
Identify and engage your ideal audience with the Target Market and Audience Segmentation presentation. This clear, timeline-style infographic uses a bullseye layout to highlight key market segments and their progression. Ideal for marketing strategies, customer profiling, and campaign planning. Fully customizable in Canva, PowerPoint, and Google Slides.


12 diapositivas
Simple Gantt Chart Template Presentation
Track your project progress at a glance with this Simple Gantt Chart Template. Featuring color-coded circles for weekly task planning across two timelines, it’s perfect for visual project tracking. Easily customizable for PowerPoint, Keynote, or Google Slides. Ideal for quick updates, team syncs, and keeping your workflow organized.


5 diapositivas
Corporate Goal Alignment and Execution Presentation
Drive strategic clarity with this streamlined Corporate Goal Alignment and Execution slide. This template visually connects key initiatives with execution pathways and end goals, using a funnel-style layout that highlights the flow from strategic inputs to measurable outcomes. Perfect for aligning teams, reporting progress, or visualizing OKRs. Fully customizable in PowerPoint, Keynote, and Google Slides.


6 diapositivas
Numbered Steps Diagram Presentation
Watch your workflow come to life as each step rises in a clean, structured path that makes progress easy to follow. This presentation guides audiences through sequential actions with clarity, helping simplify processes, plans, or instructions. Perfect for business, training, or project teams. Fully compatible with PowerPoint, Keynote, and Google Slides.


6 diapositivas
Company Expansion Timeline Presentation
Show your company’s growth story in a way that’s both professional and visually captivating. This presentation template helps you outline milestones, future goals, and expansion phases with clarity and style. Fully customizable and compatible with PowerPoint, Keynote, and Google Slides for effortless editing and polished results.


20 diapositivas
Axisflare Artist Portfolio Presentation
Showcase your creative journey with this vibrant artist portfolio template, featuring sections for project highlights, philosophy, style, and client testimonials. Ideal for presenting your work and artistic approach, this template is compatible with PowerPoint, Keynote, and Google Slides for seamless presentation across various platforms.


4 diapositivas
Project Responsibility RACI Matrix Presentation
The "Project Responsibility RACI Matrix" presentation effectively delineates the responsibilities associated with different roles in a project. Each slide visually encodes the responsibilities as Responsible, Accountable, Consulted, or Informed for various tasks across different roles, enhancing clarity and promoting a thorough understanding of who is involved in each phase of project execution. This format is particularly useful for complex projects where multiple stakeholders need clear communication about their roles and contributions.


22 diapositivas
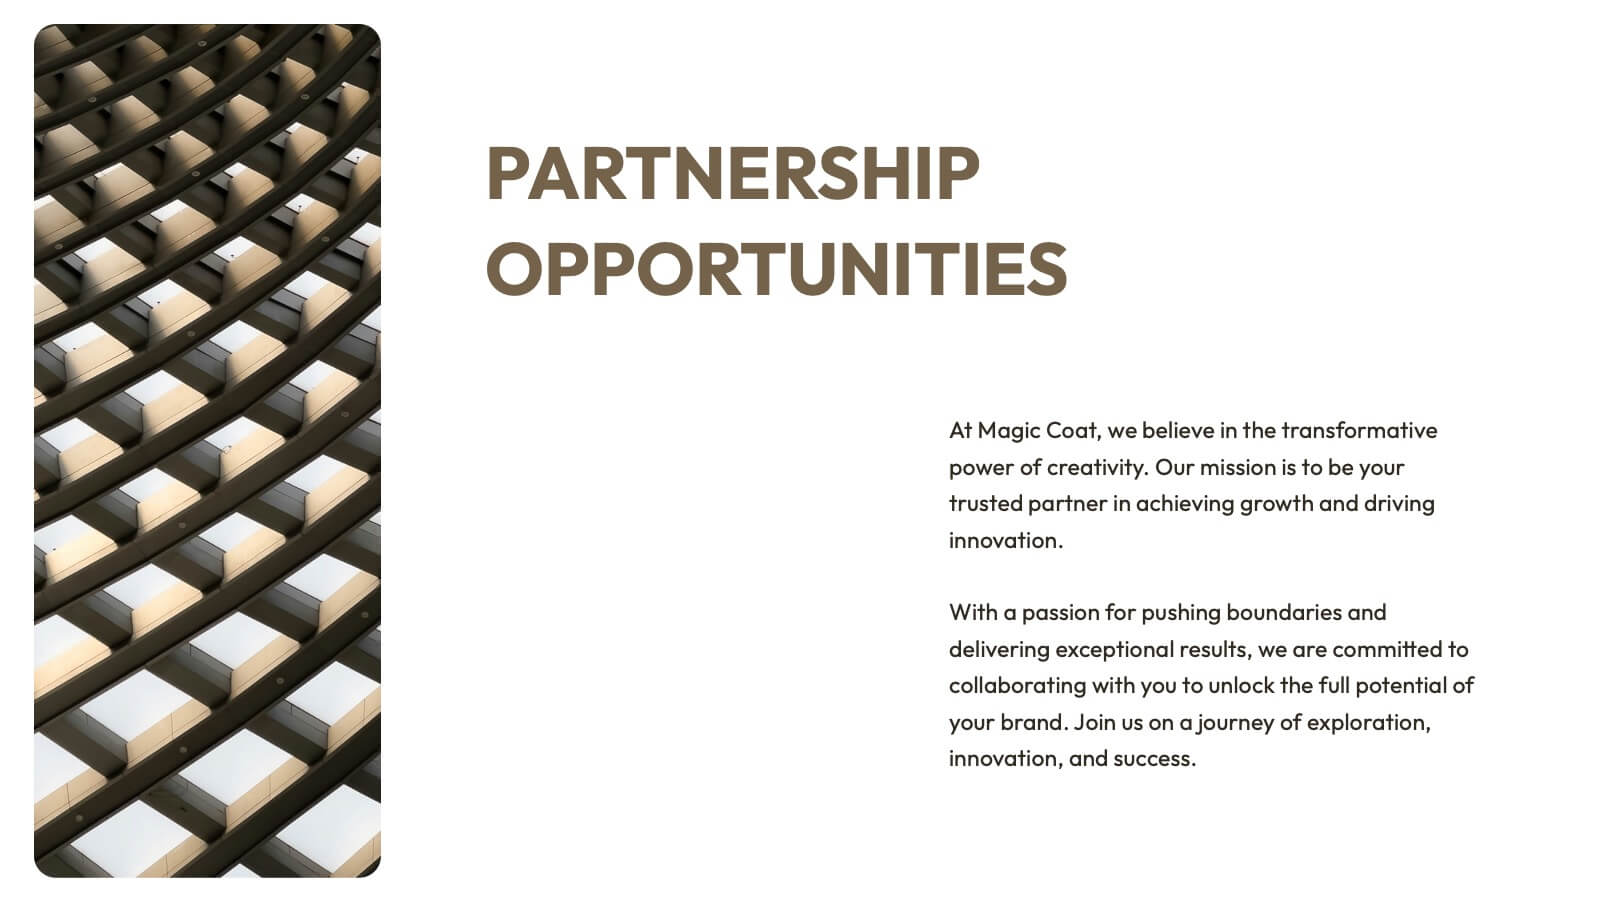
Vivid Creative Agency Pitch Deck Presentation
This sleek creative agency template is ideal for presenting your company's mission, services, and success stories. With a minimalist design, it offers a professional yet stylish approach to showcase case studies, industry trends, and partnership opportunities. It’s perfect for PowerPoint, Keynote, and Google Slides, making your agency stand out with every slide.


2 diapositivas
Designer Portfolio for Client Showcase Presentation
Showcase your creative work with the Designer Portfolio for Client Showcase Presentation. This sleek layout emphasizes visual storytelling, making it ideal for graphic designers, illustrators, and creatives presenting to potential clients. Highlight your projects in a clean, modern format. Compatible with Canva, PowerPoint, Keynote, and Google Slides for full customization.


5 diapositivas
Dual Axis Butterfly Diagram Presentation
Give your data the spotlight it deserves with a modern layout designed for clarity and balance. This presentation is perfect for comparing two perspectives, processes, or variables side by side in a visually appealing way. Fully customizable and compatible with PowerPoint, Keynote, and Google Slides.


8 diapositivas
Customer Survey Results Analysis Presentation
Visualize feedback clearly and confidently with this dynamic results breakdown template. Featuring circular percentage graphics around a central report icon, this slide is ideal for presenting survey insights, NPS metrics, or user feedback summaries. Fully editable in PowerPoint, Keynote, and Google Slides.