


Características


¿Tienes alguna pregunta?
Recomendar


8 diapositivas
Travel Planning and Itinerary Overview Presentation
Pack your bags—this stylish template makes mapping adventures a breeze! Designed for trip overviews and itinerary planning, it includes world maps, must-see lists, weather forecasts, and schedules all in one layout. Perfect for travel agencies, bloggers, or wanderlust planners. Fully compatible with PowerPoint, Keynote, and Google Slides for easy customization.


24 diapositivas
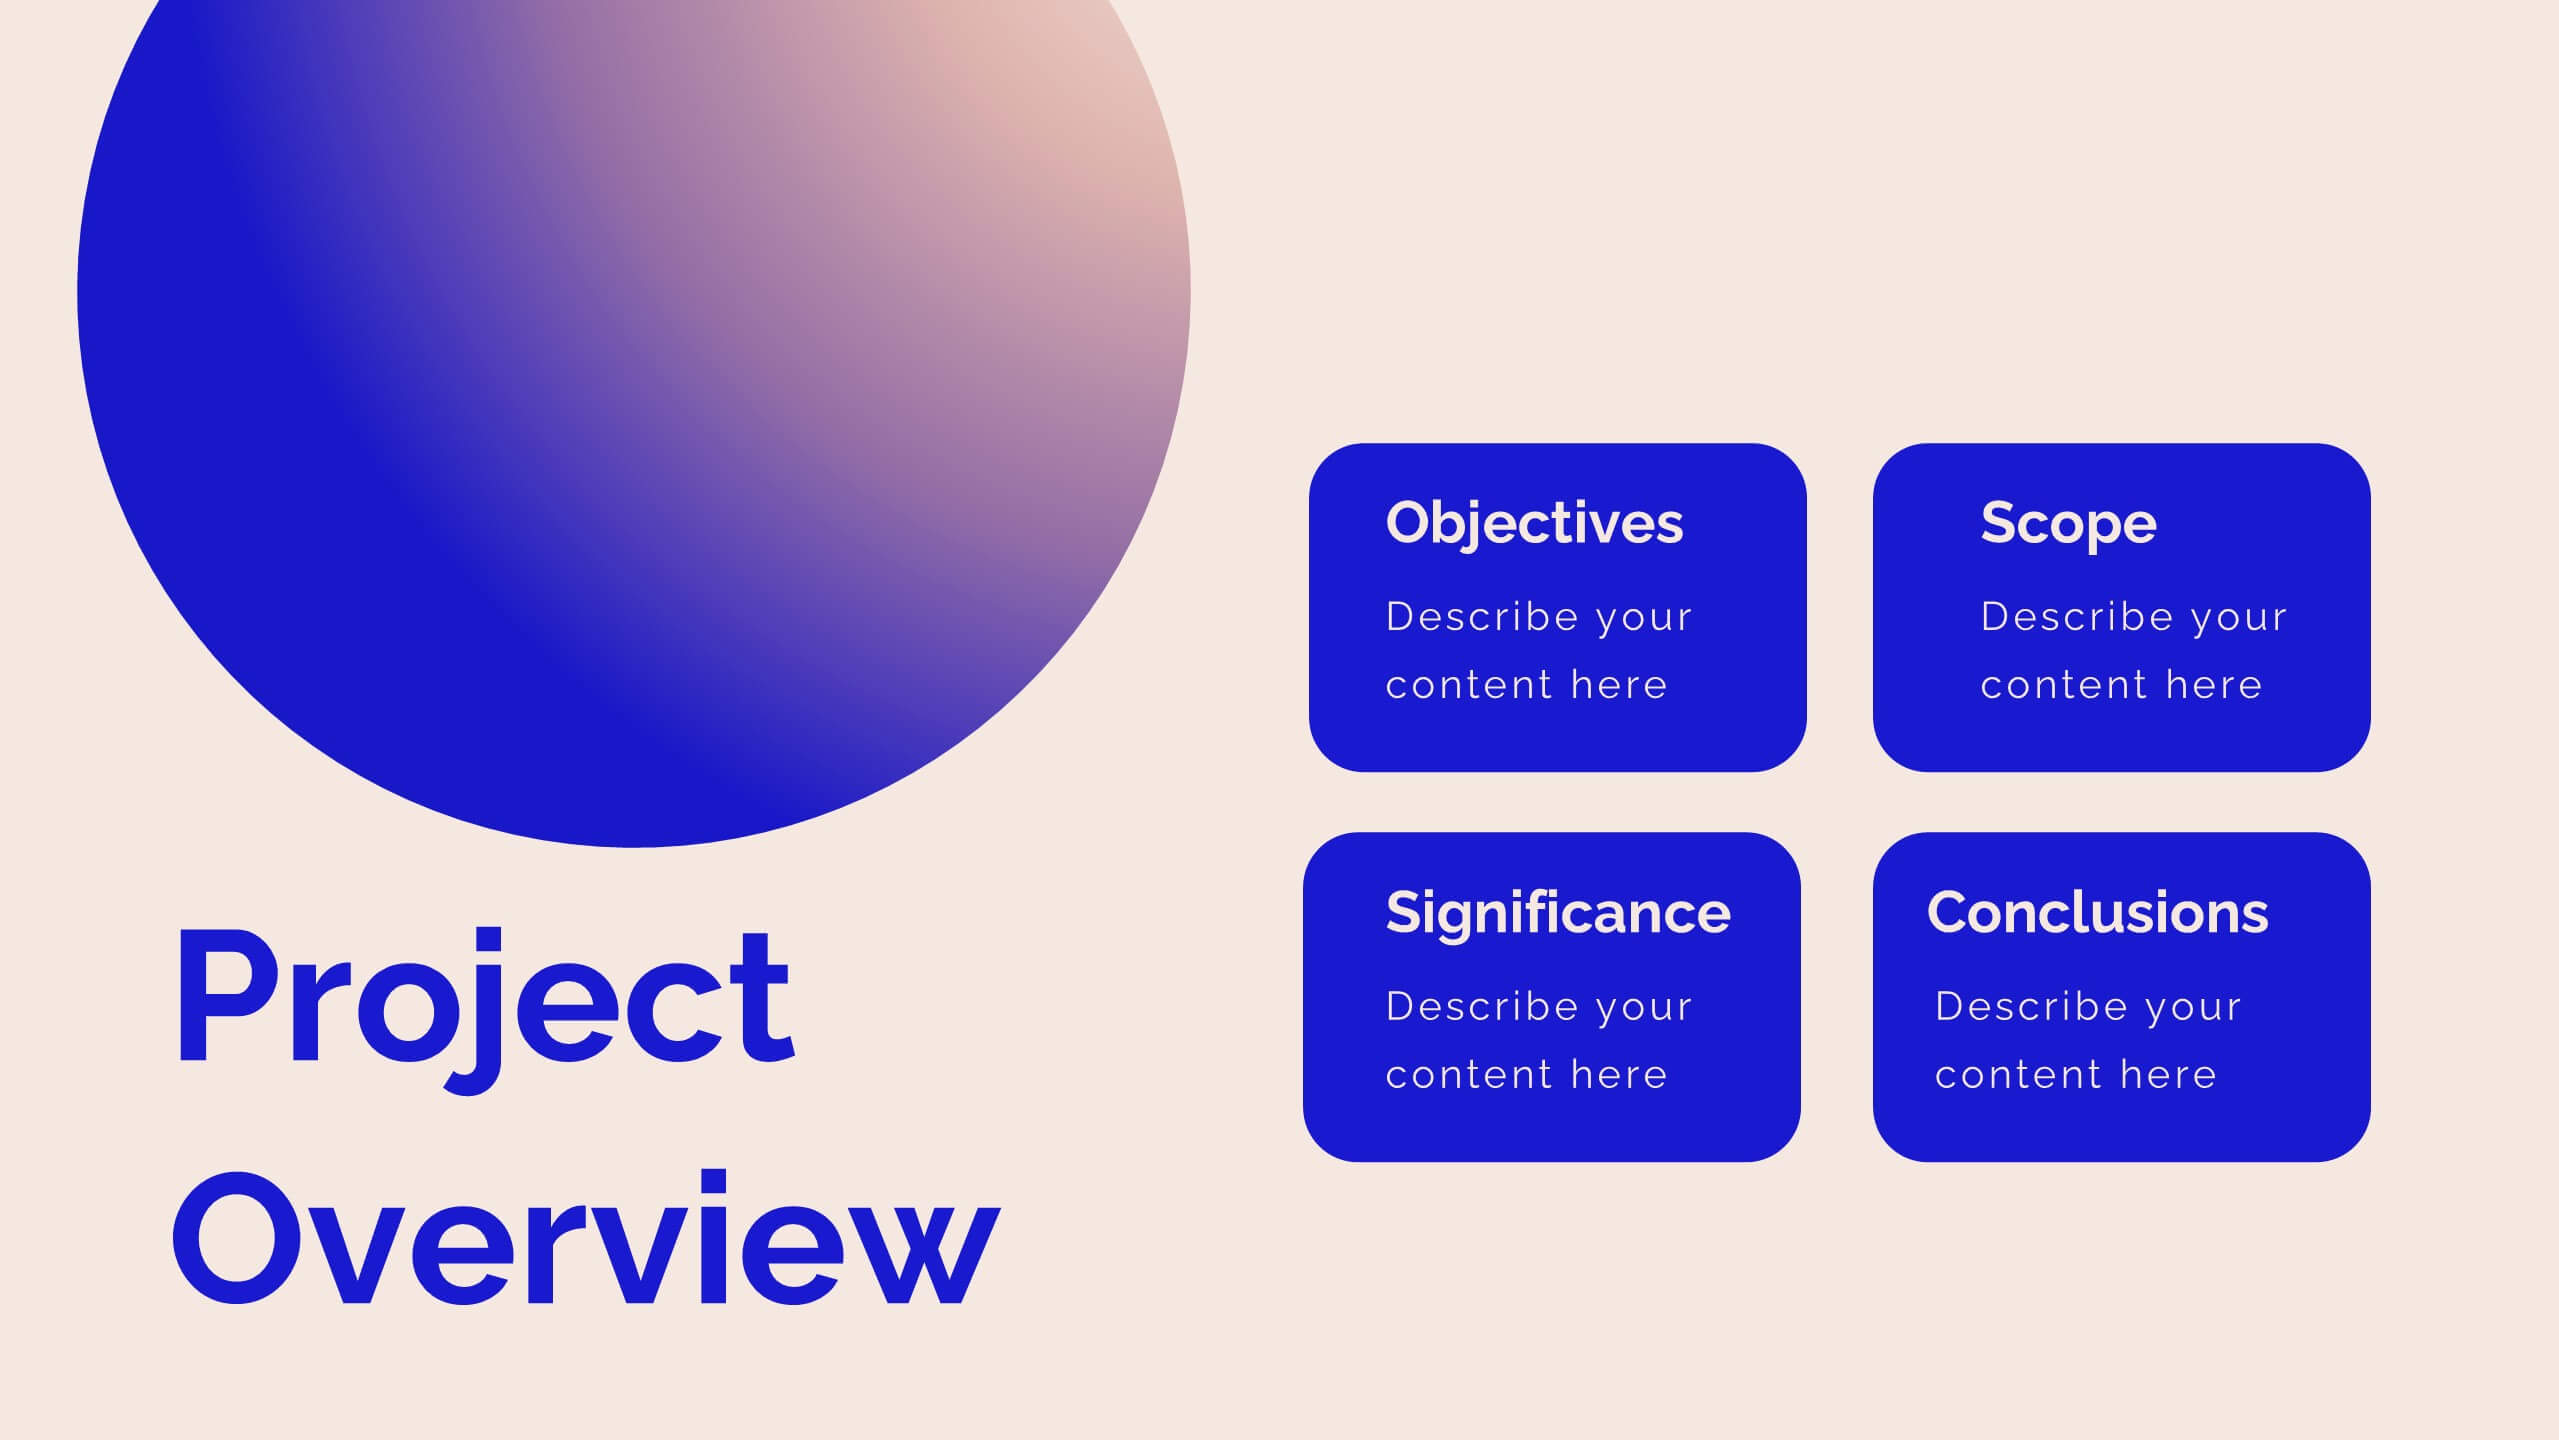
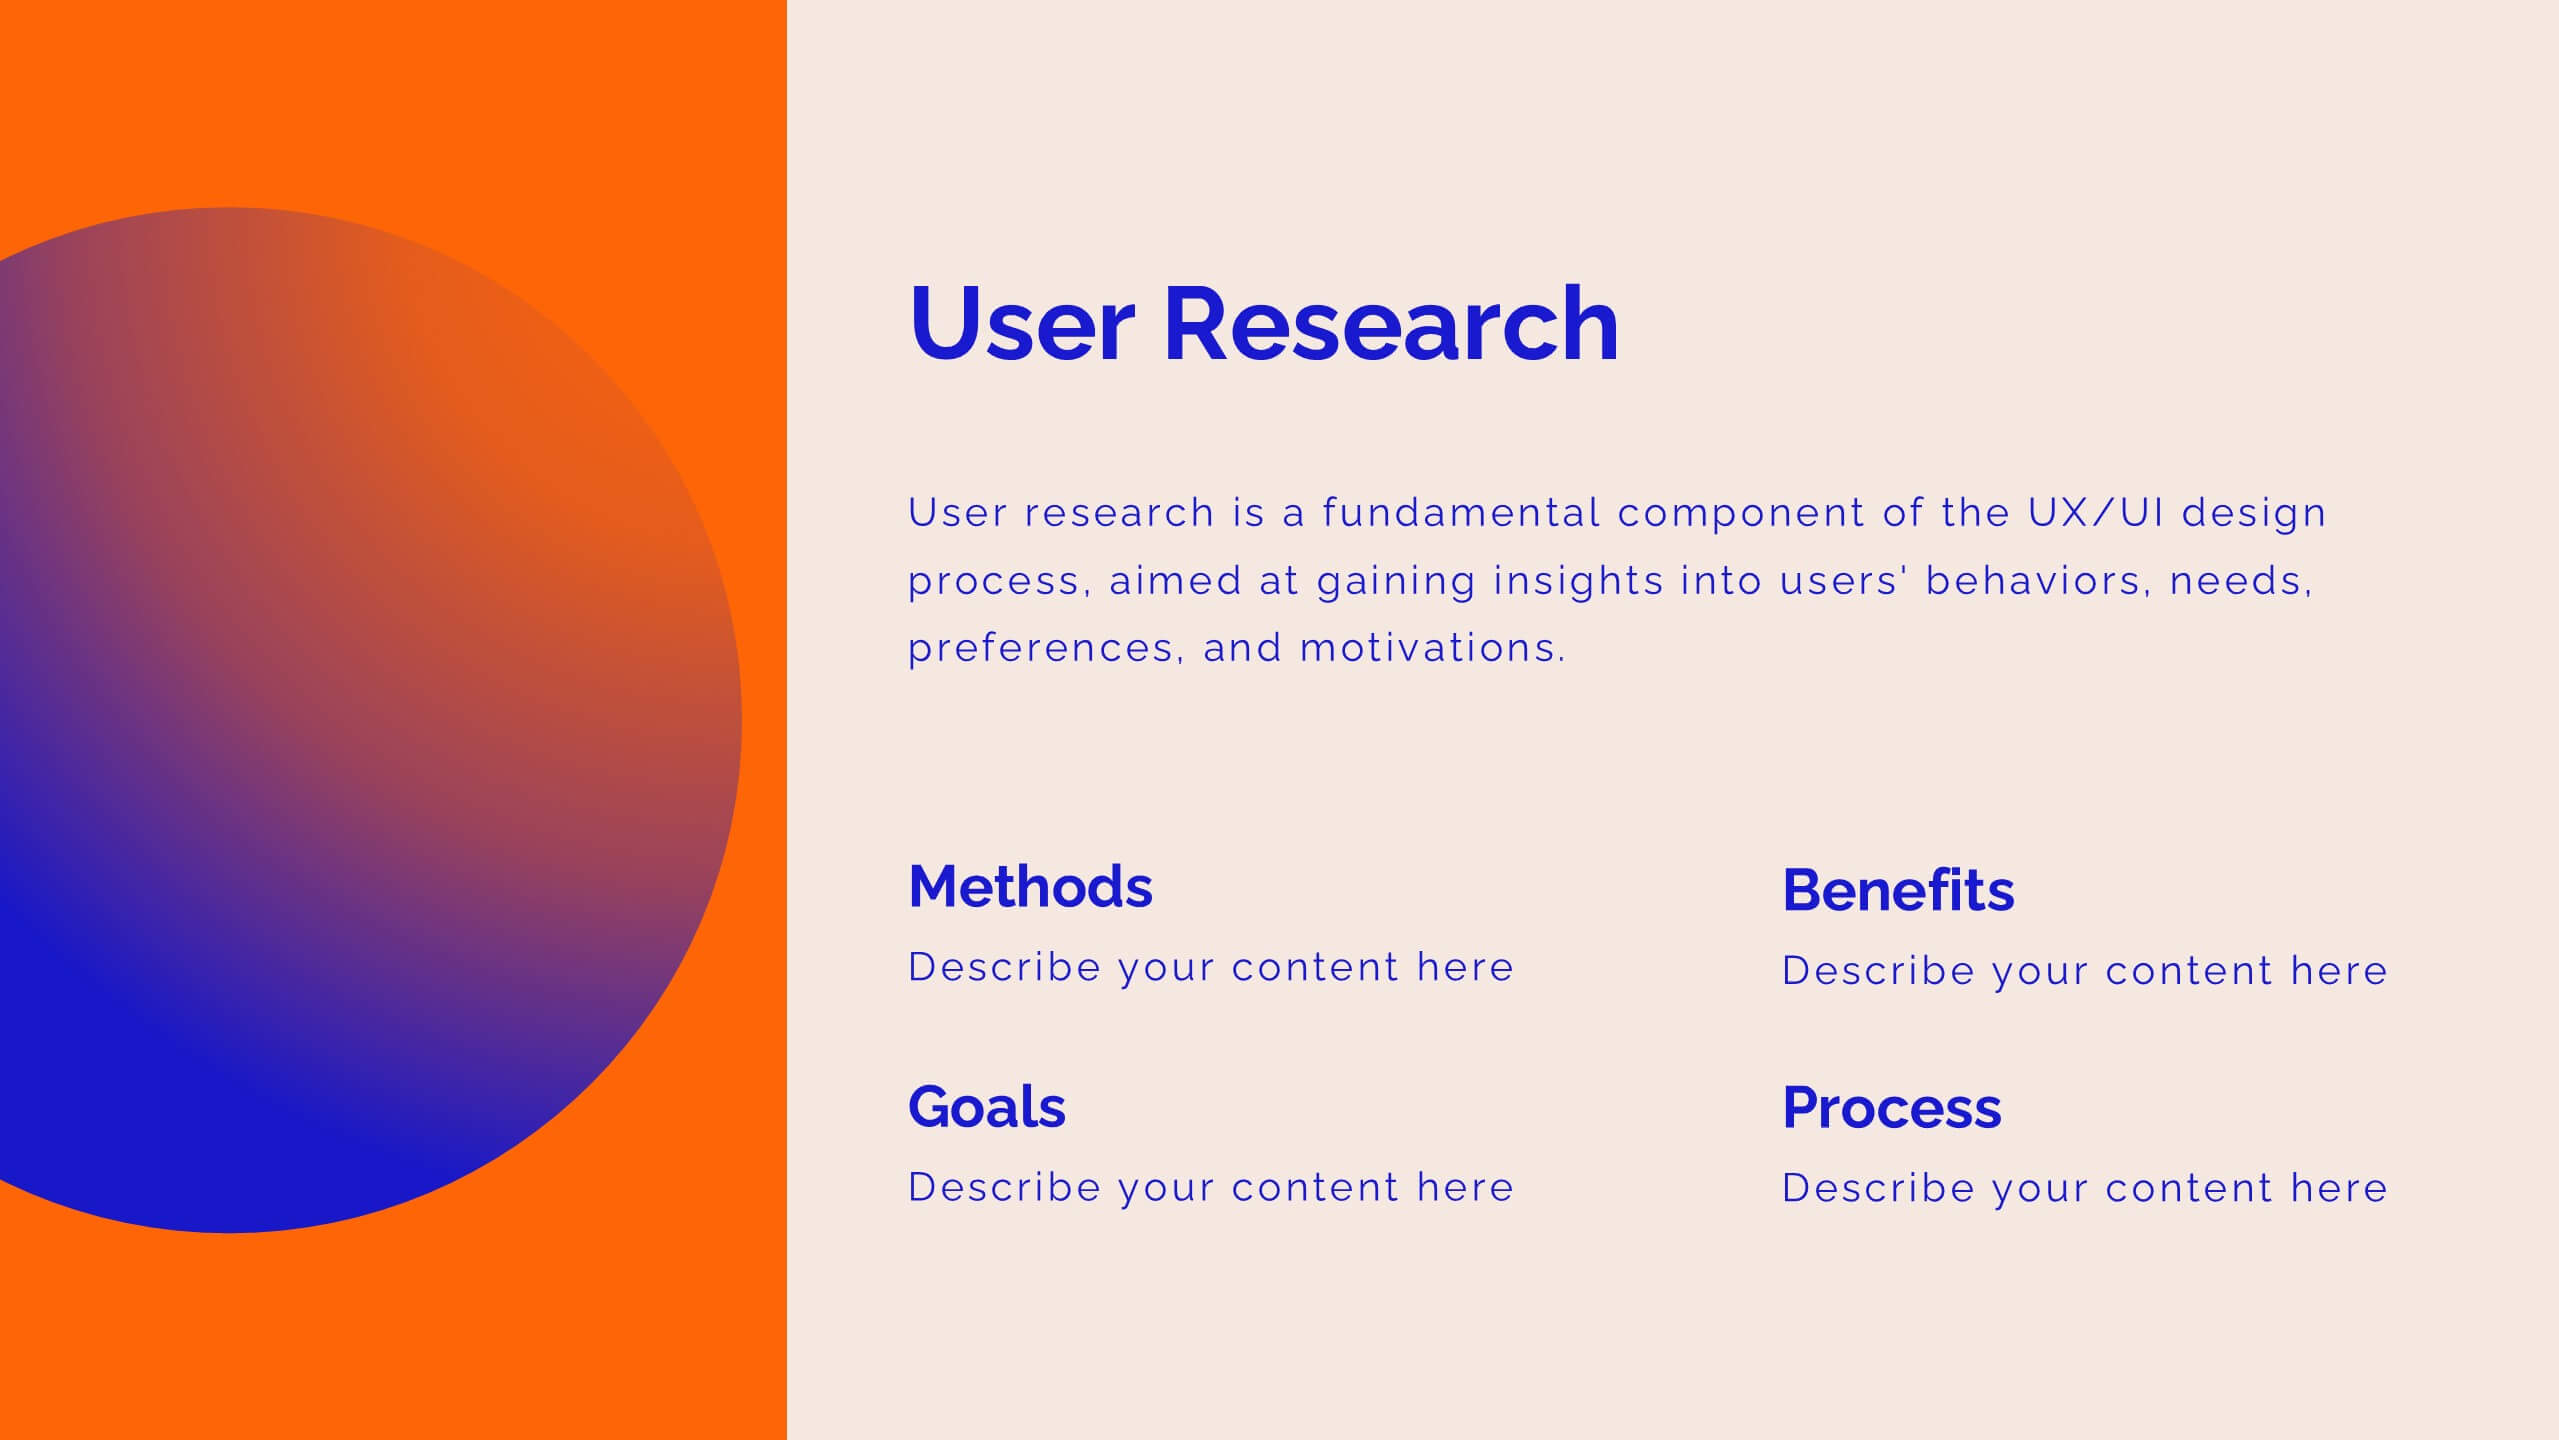
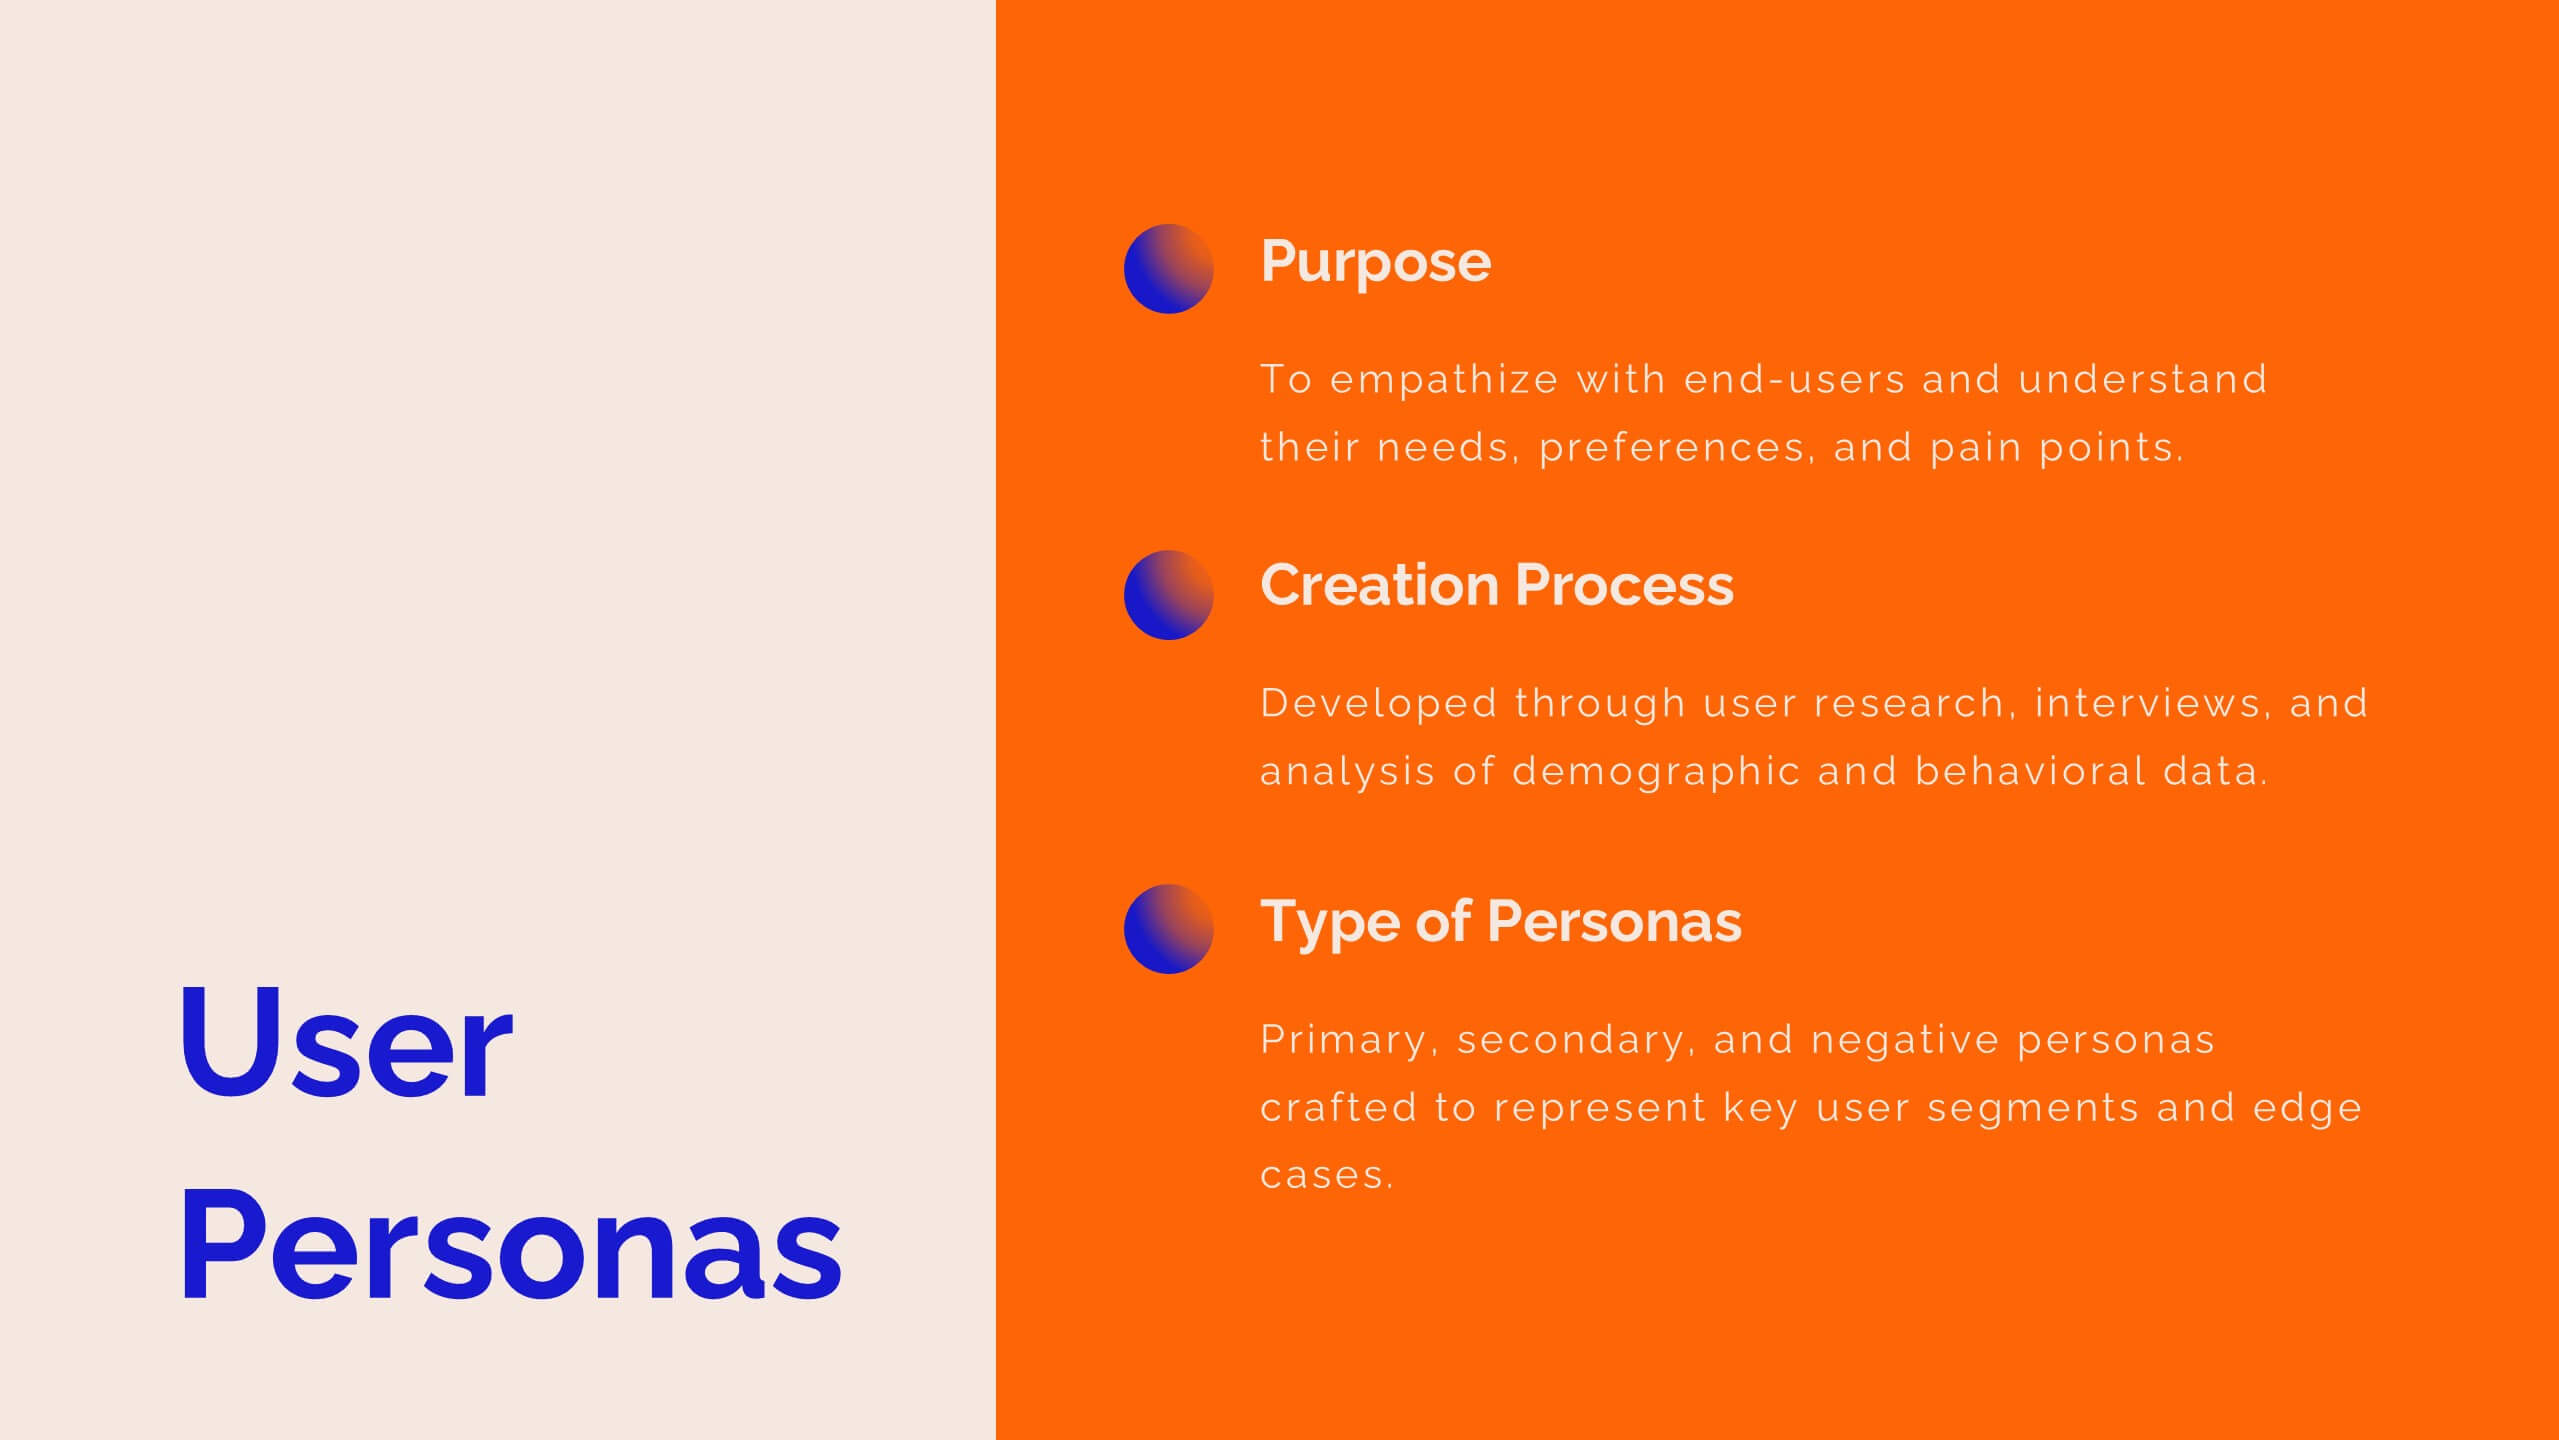
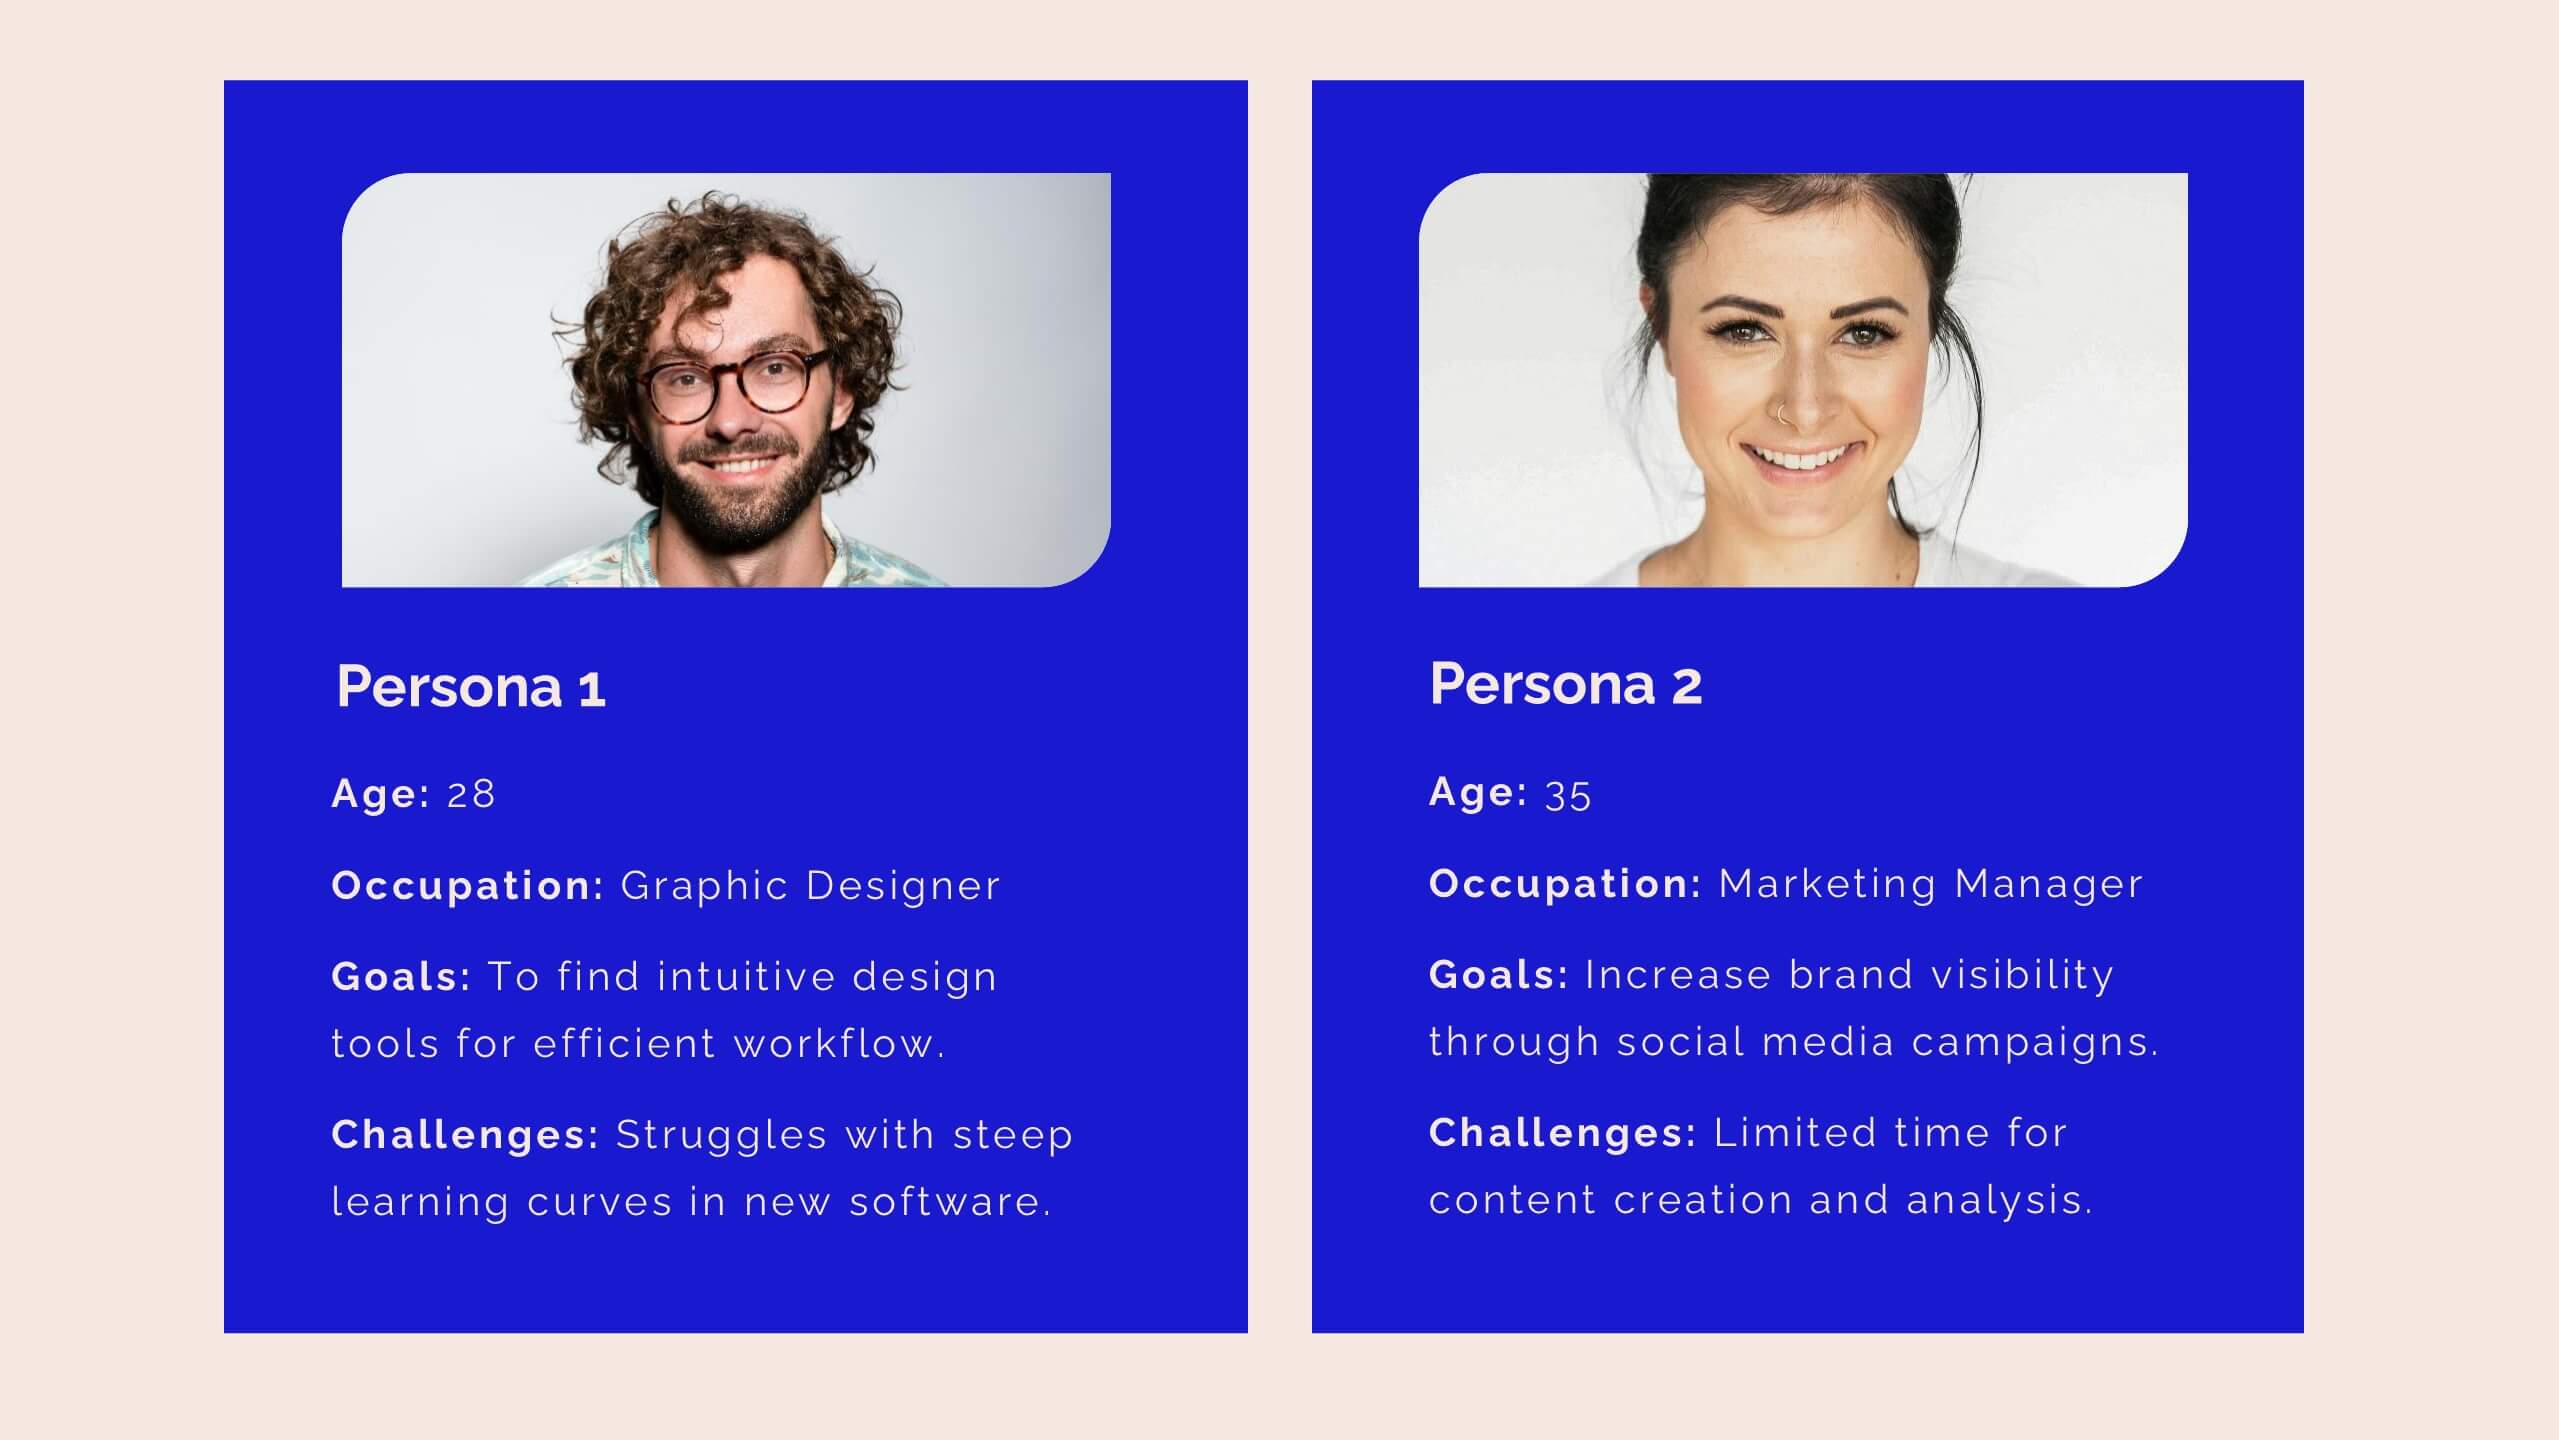
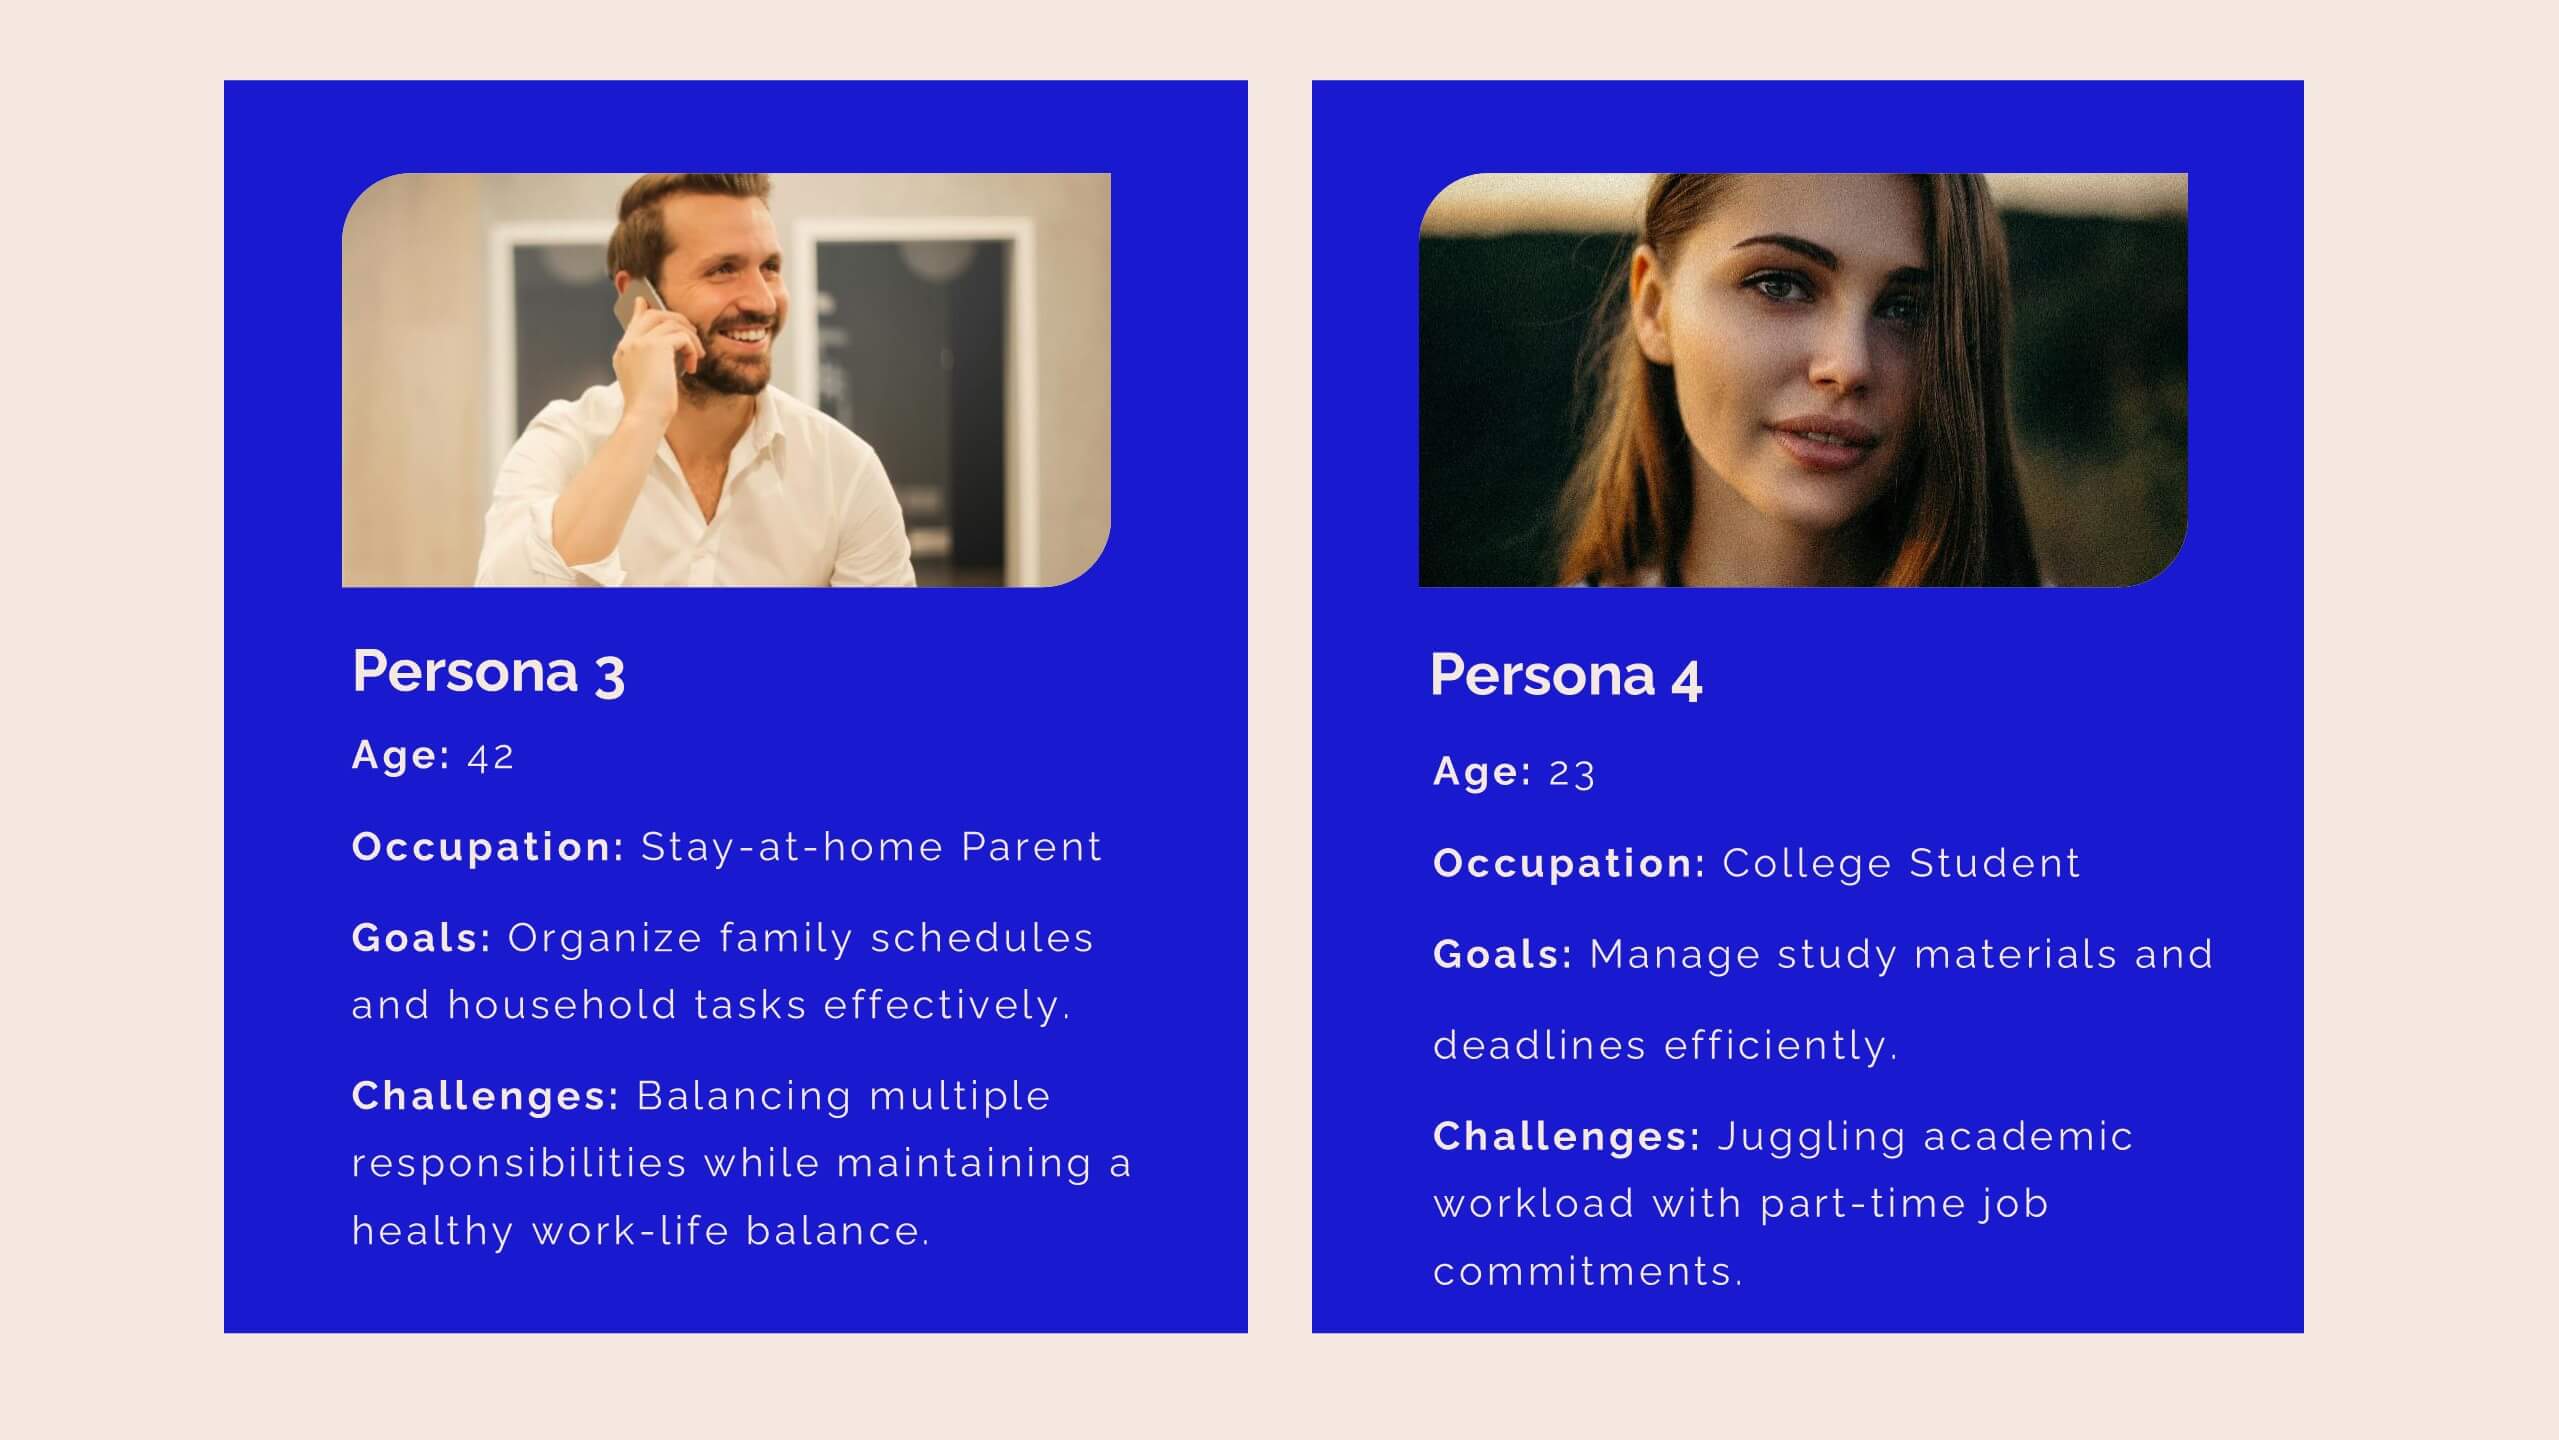
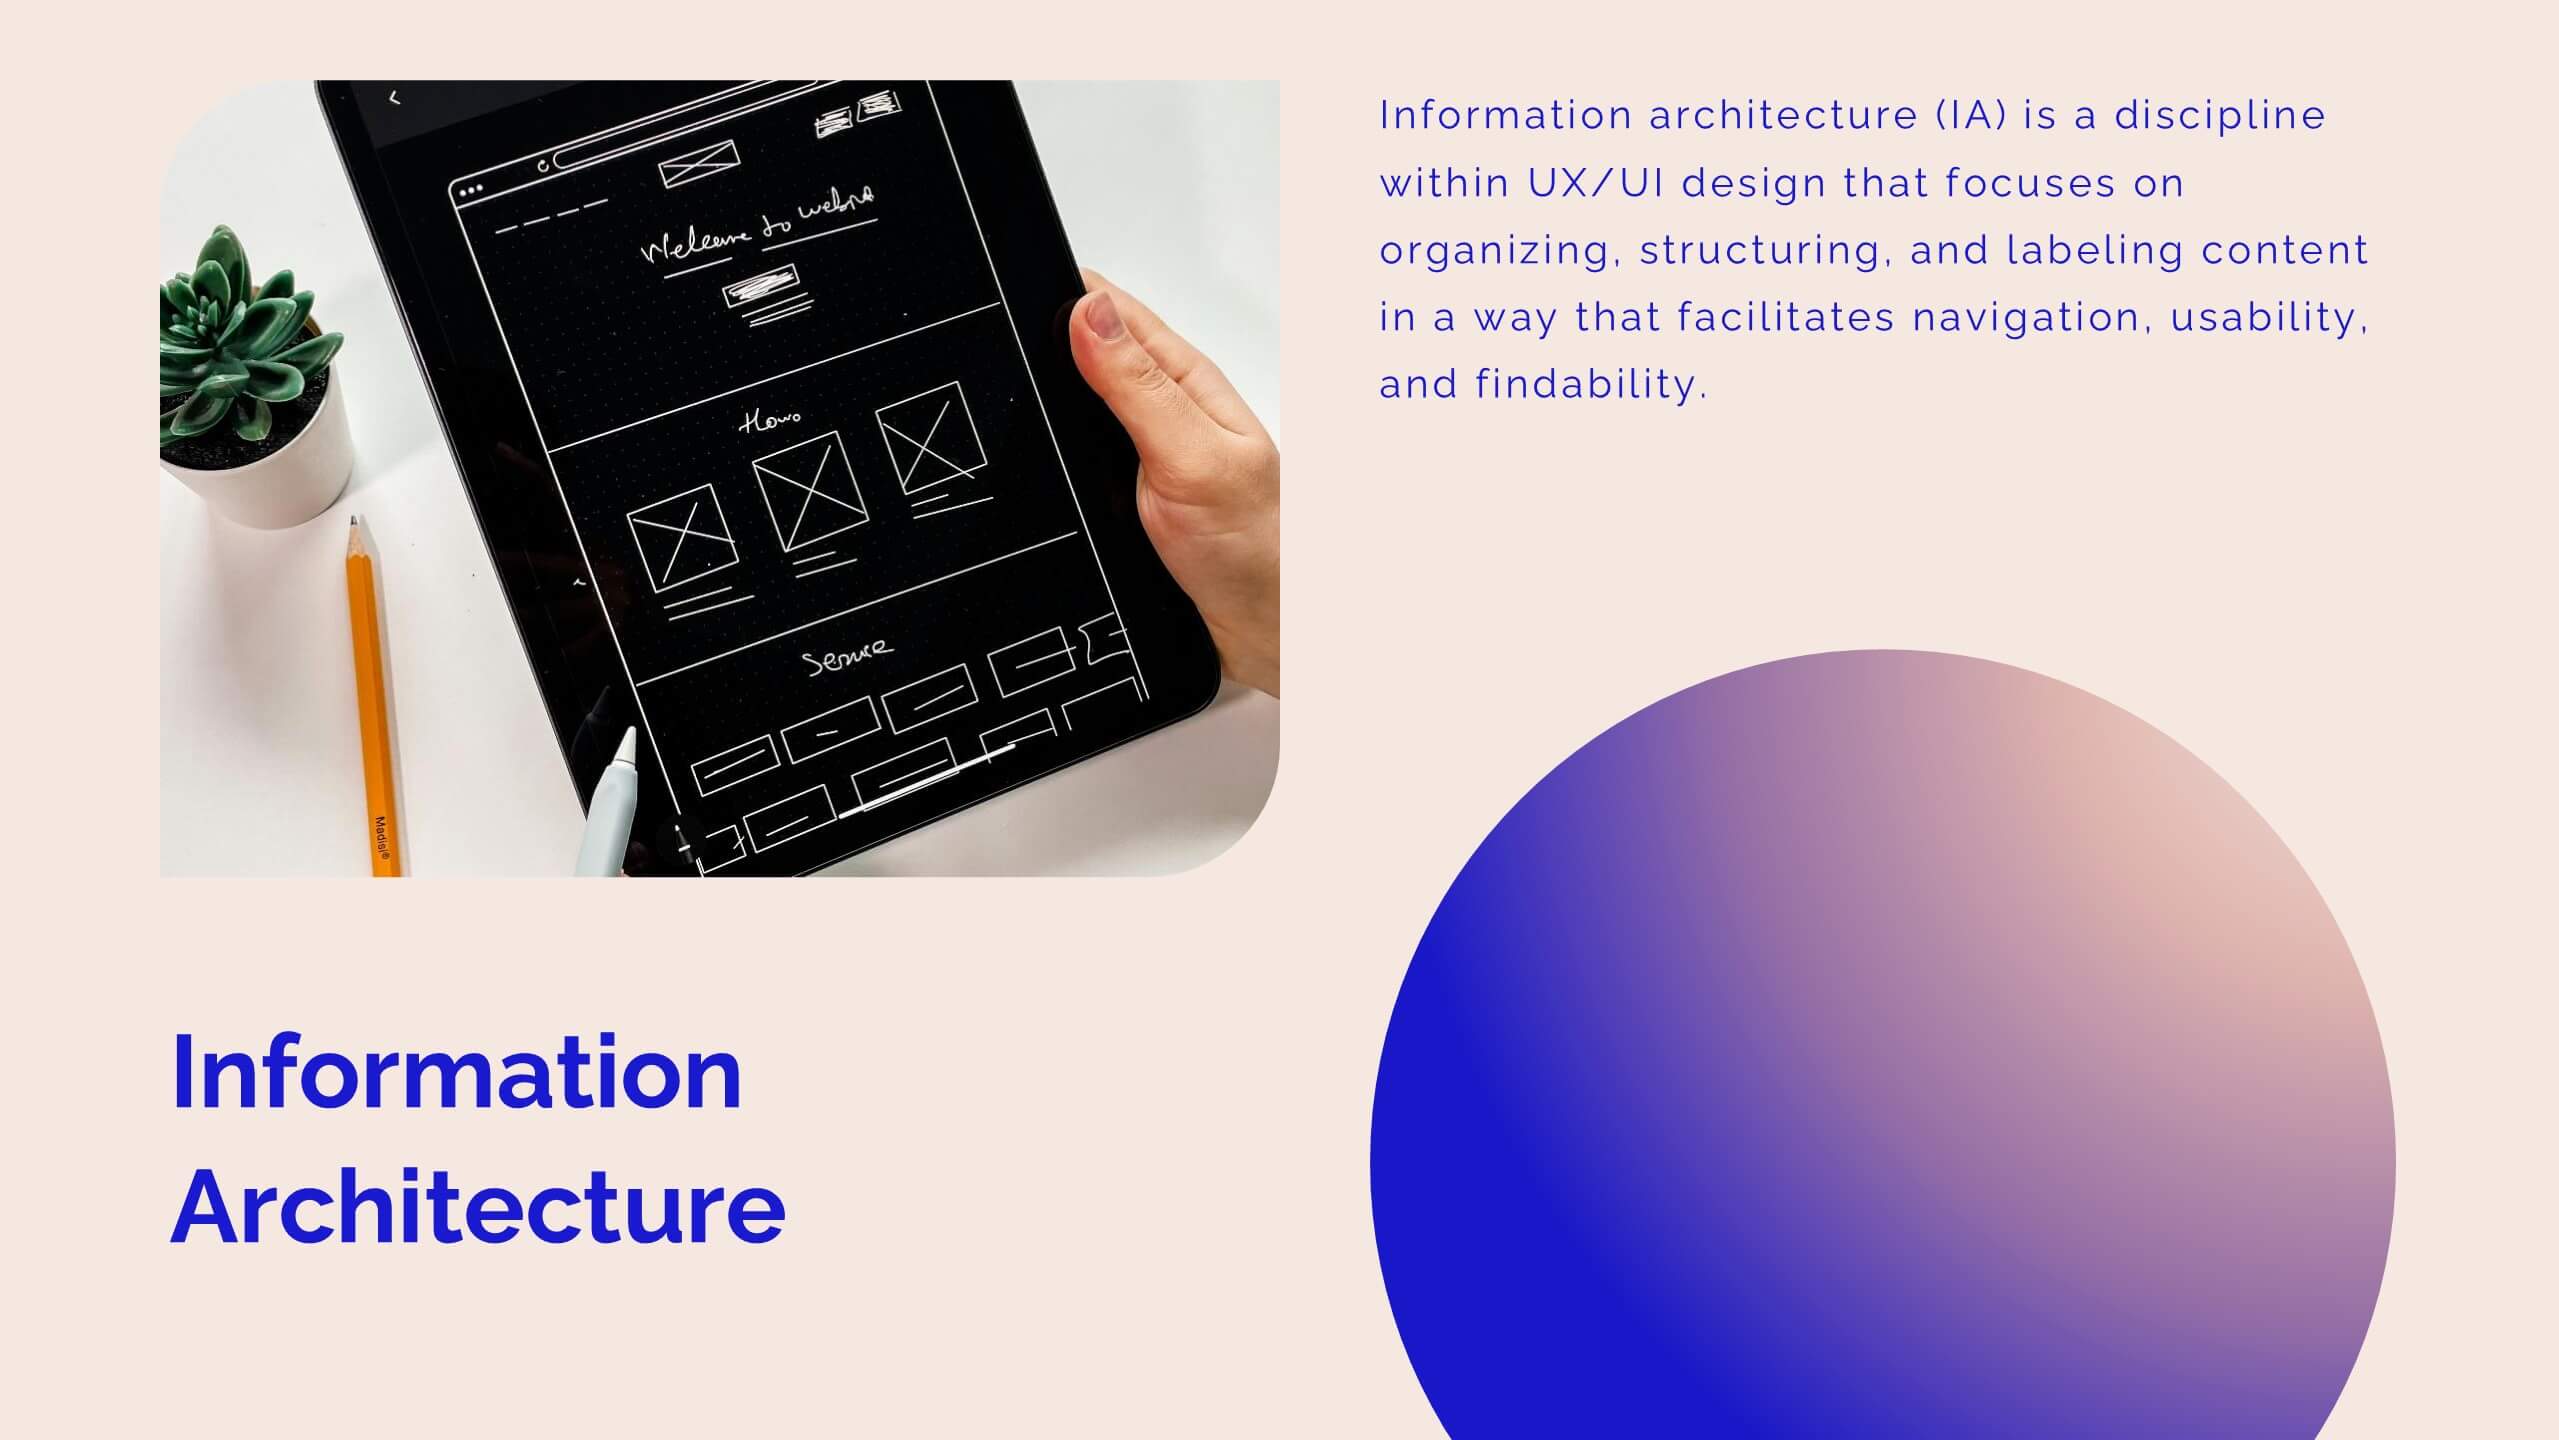
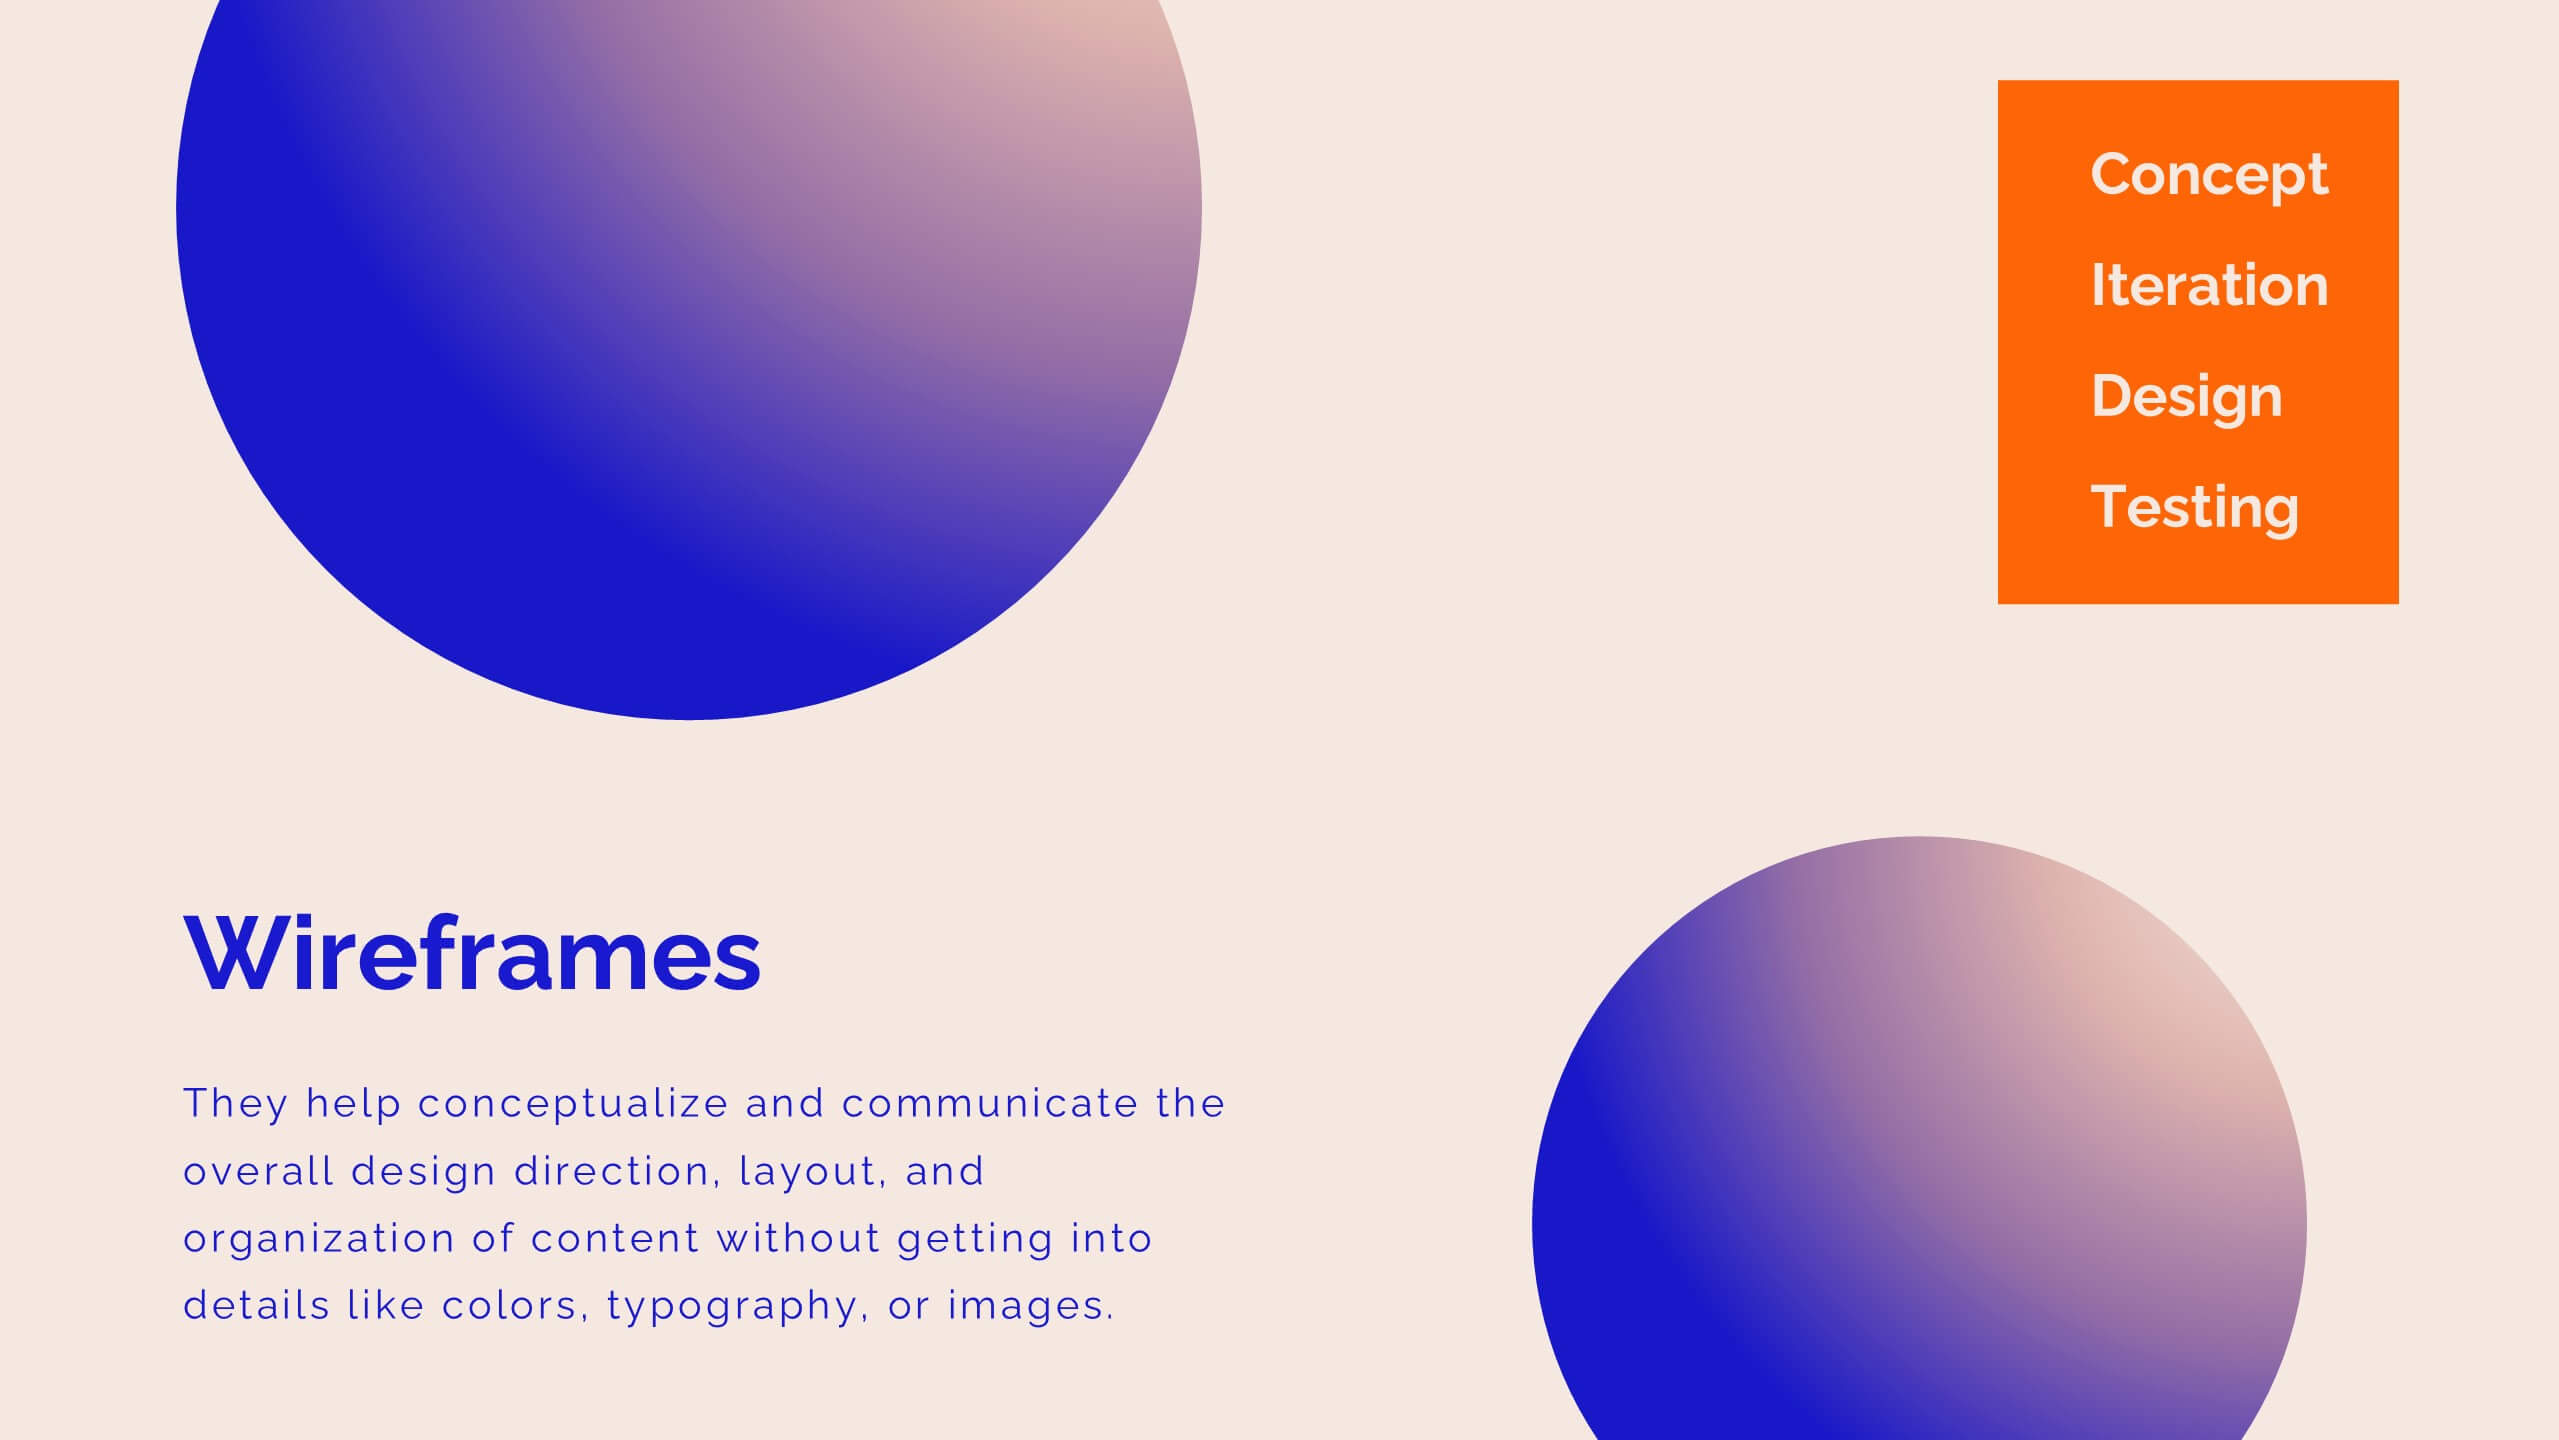
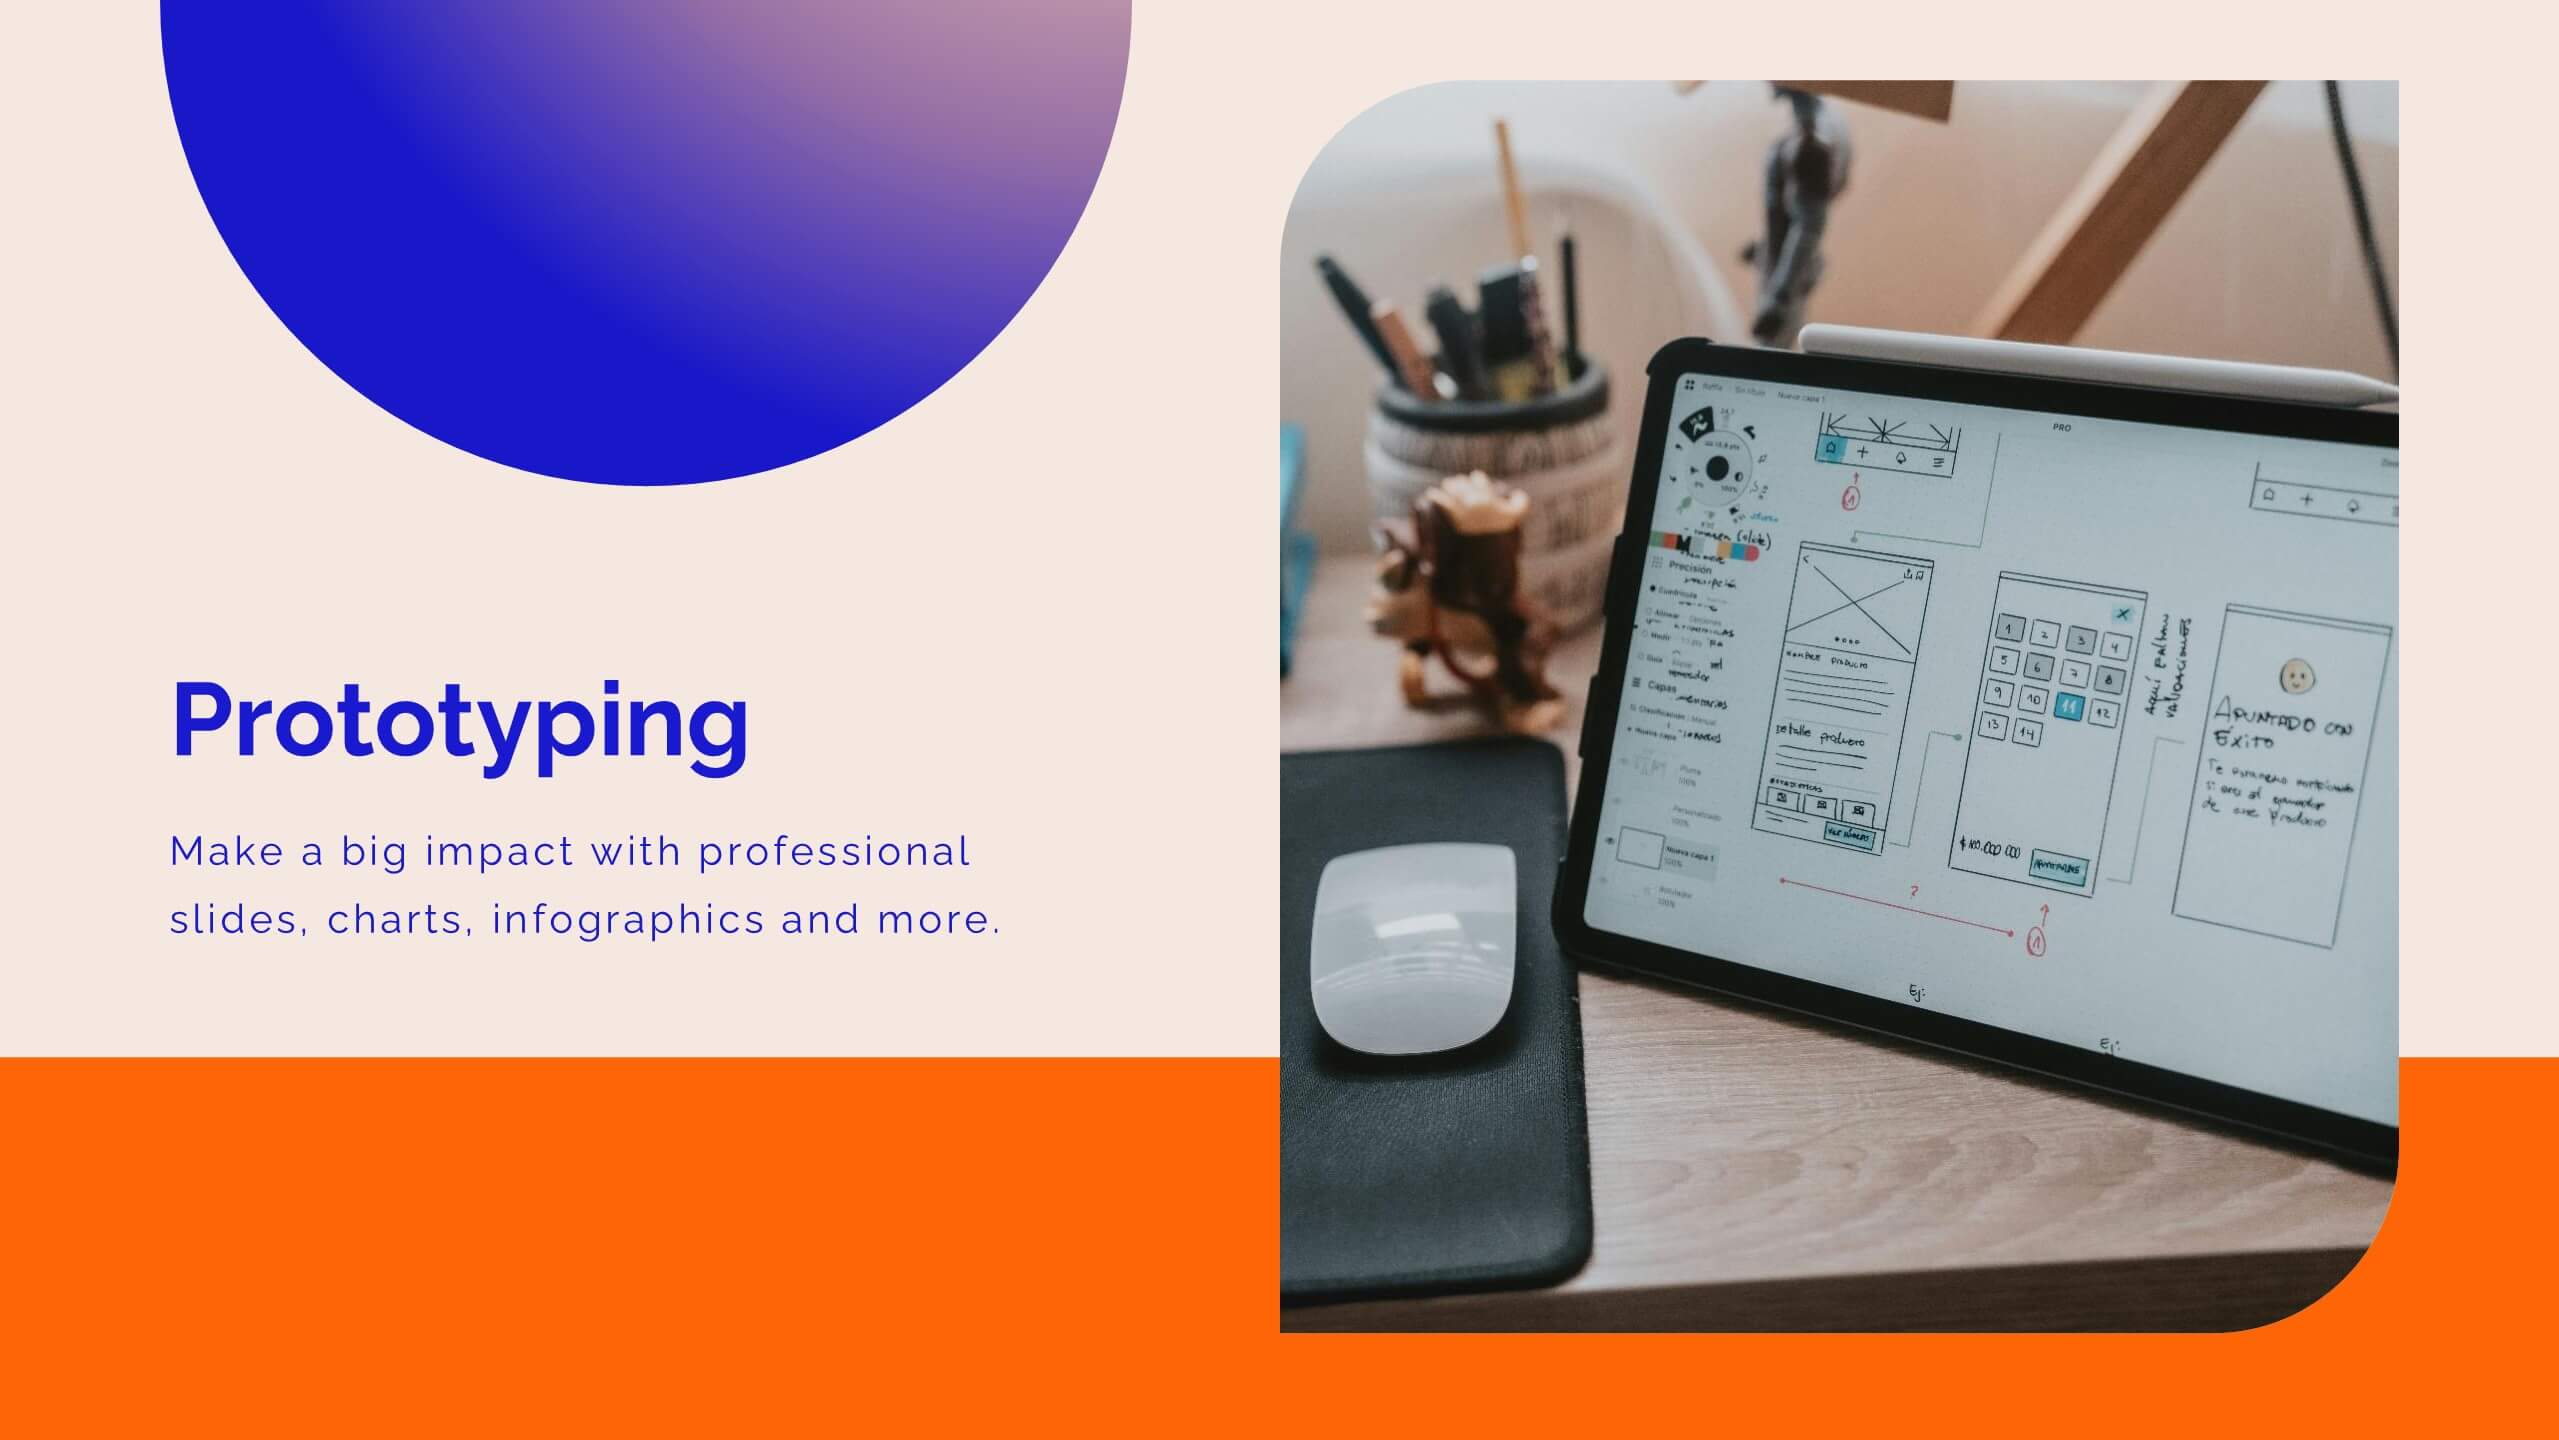
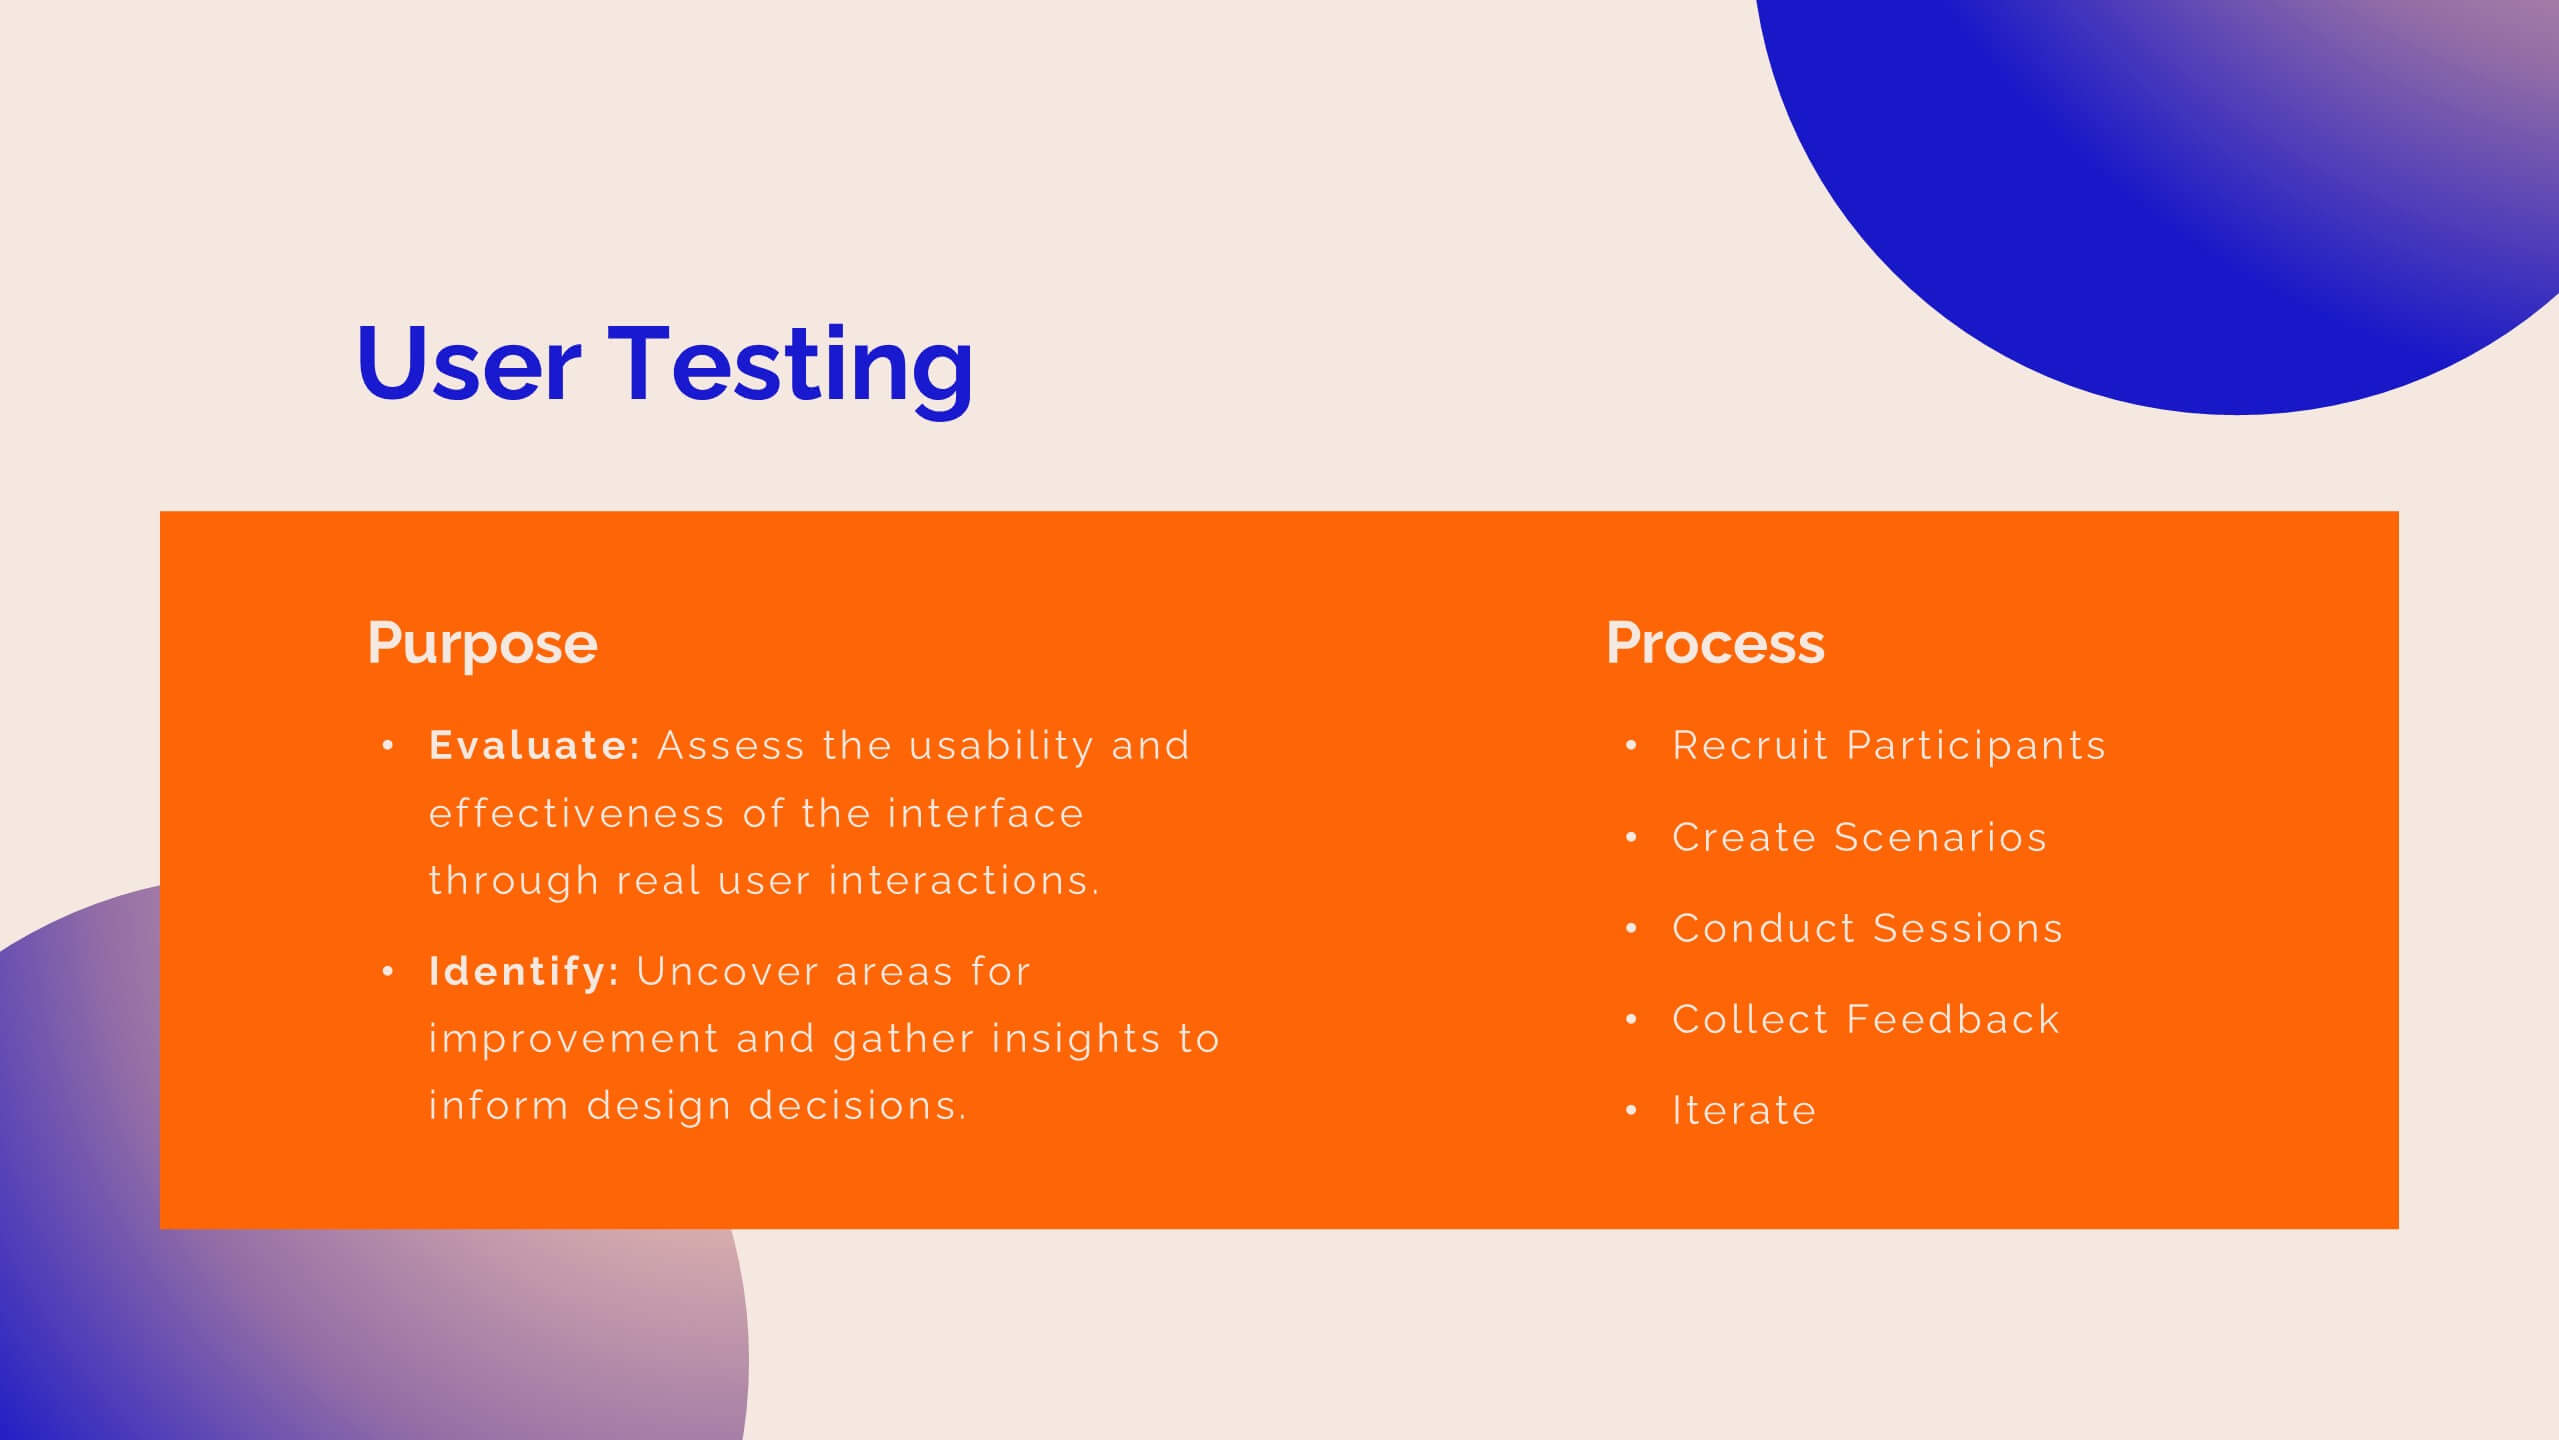
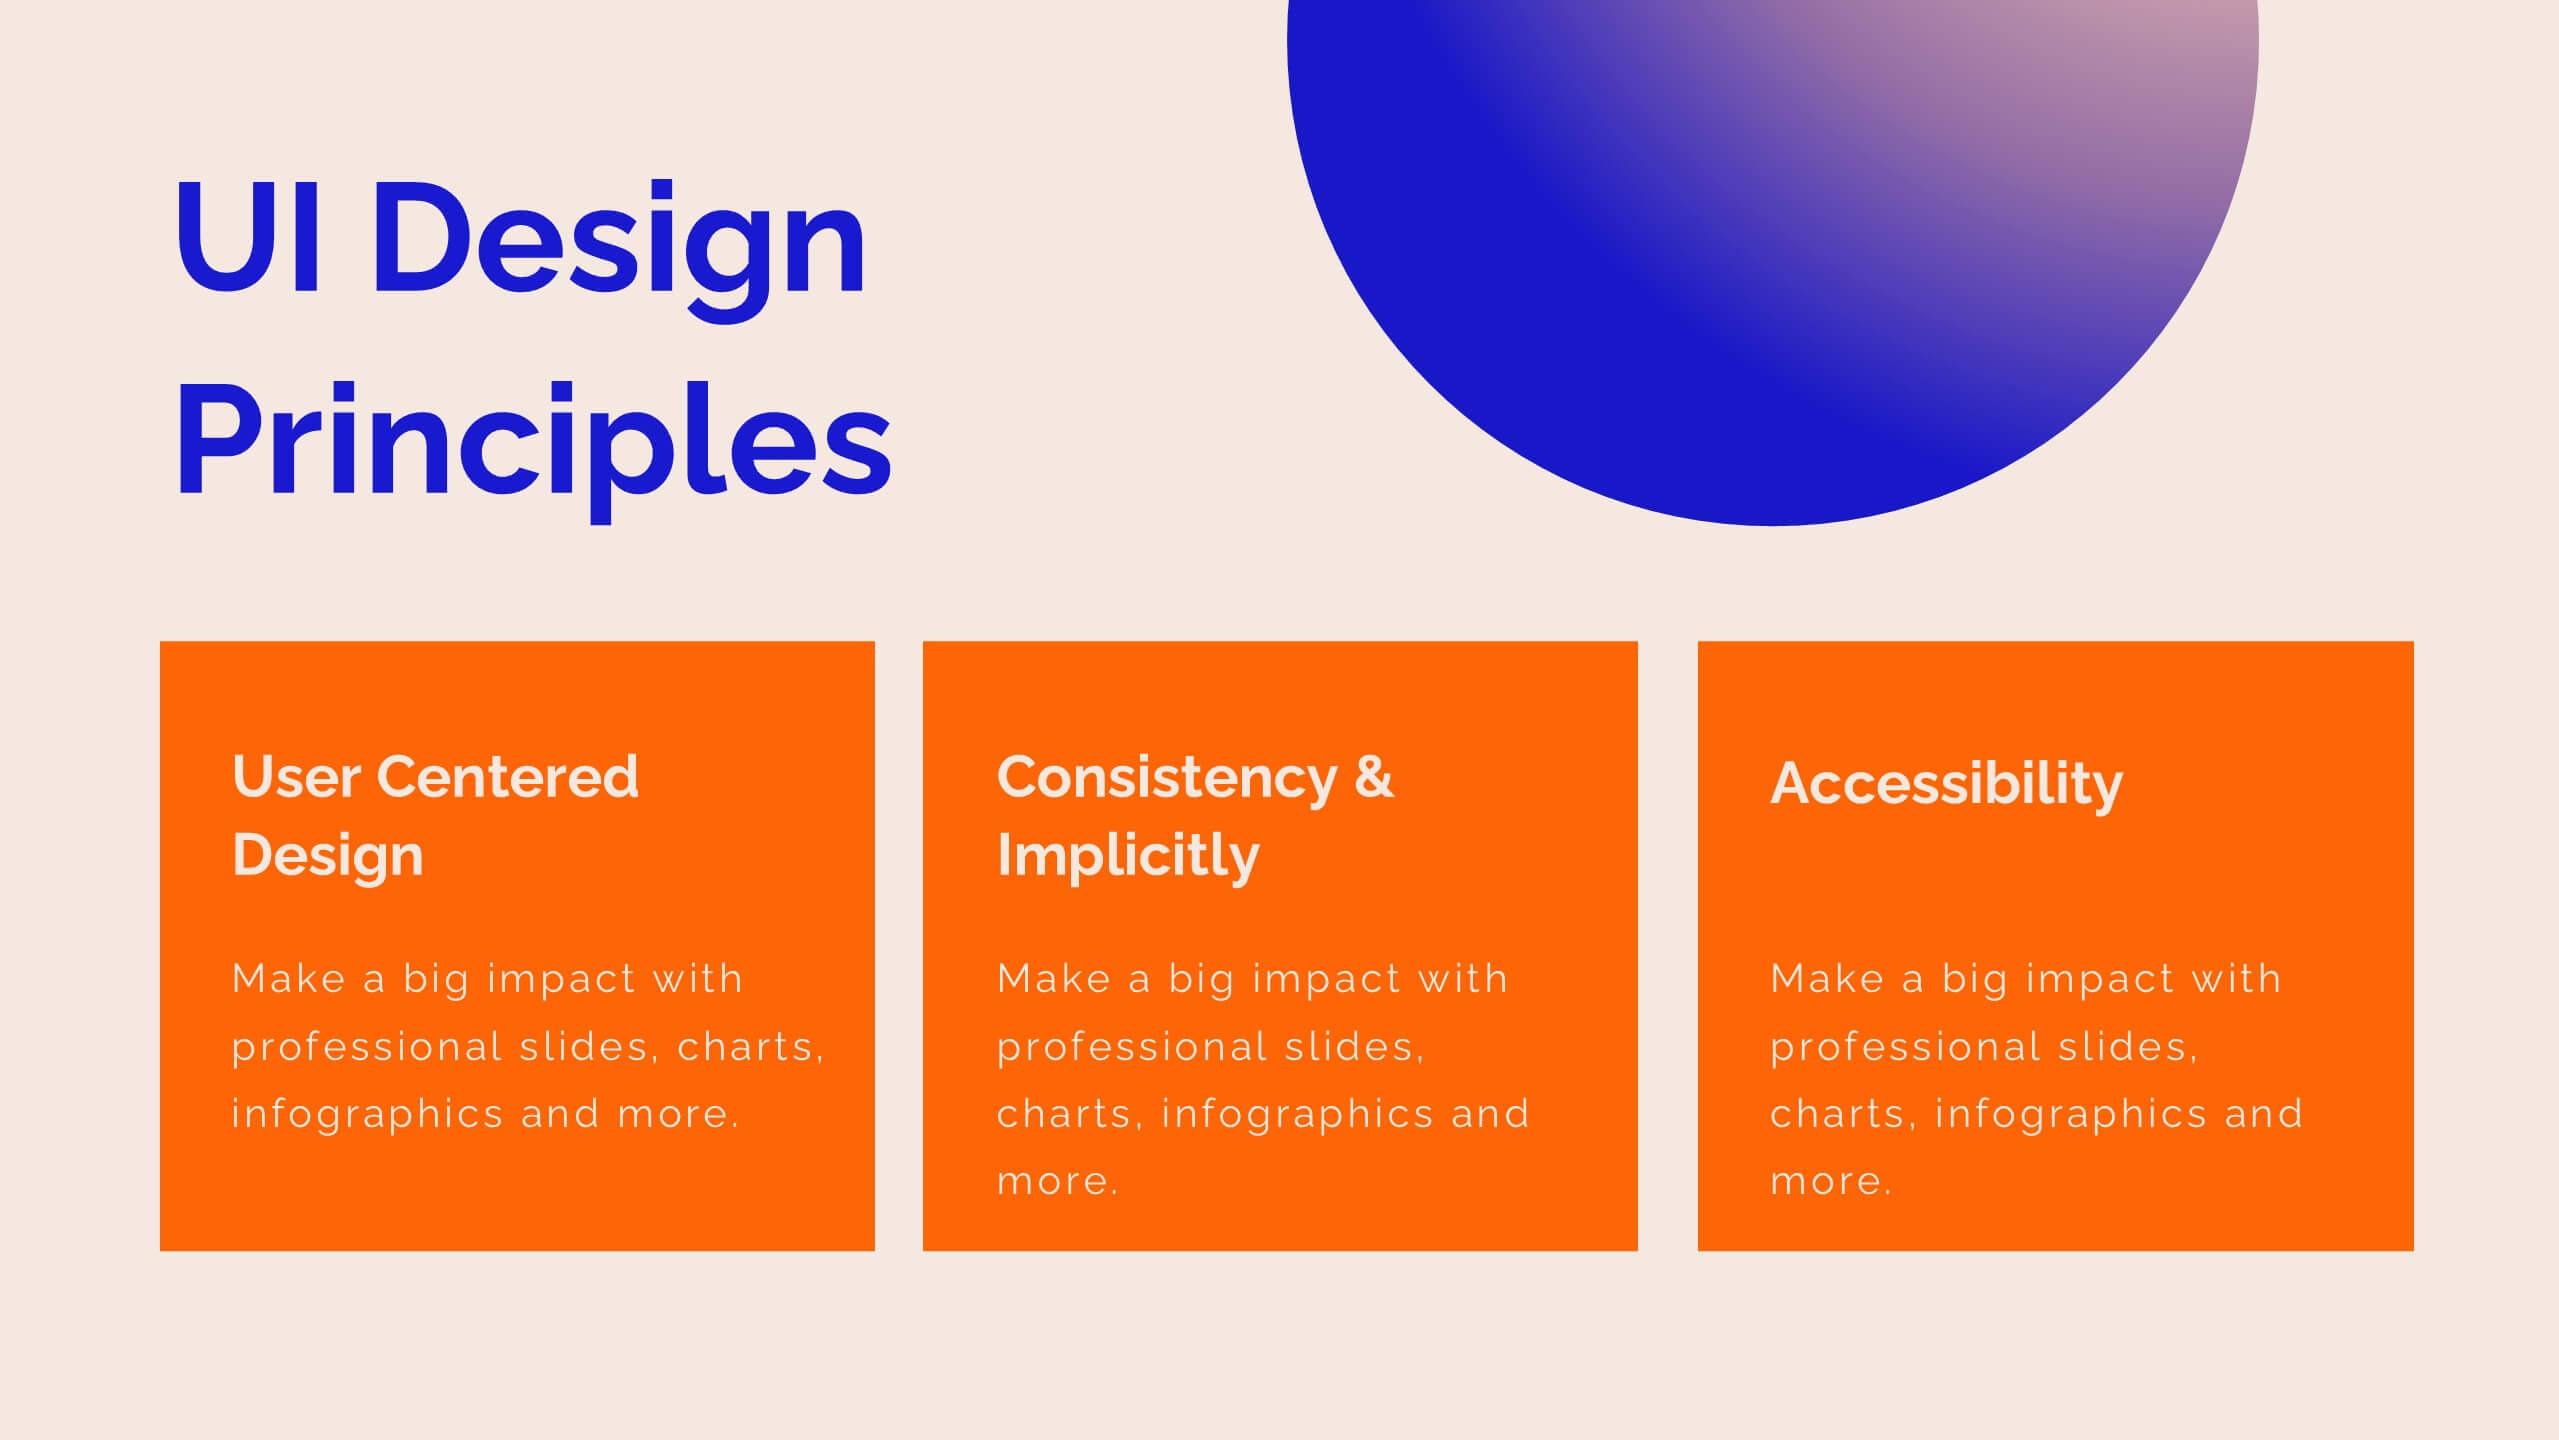
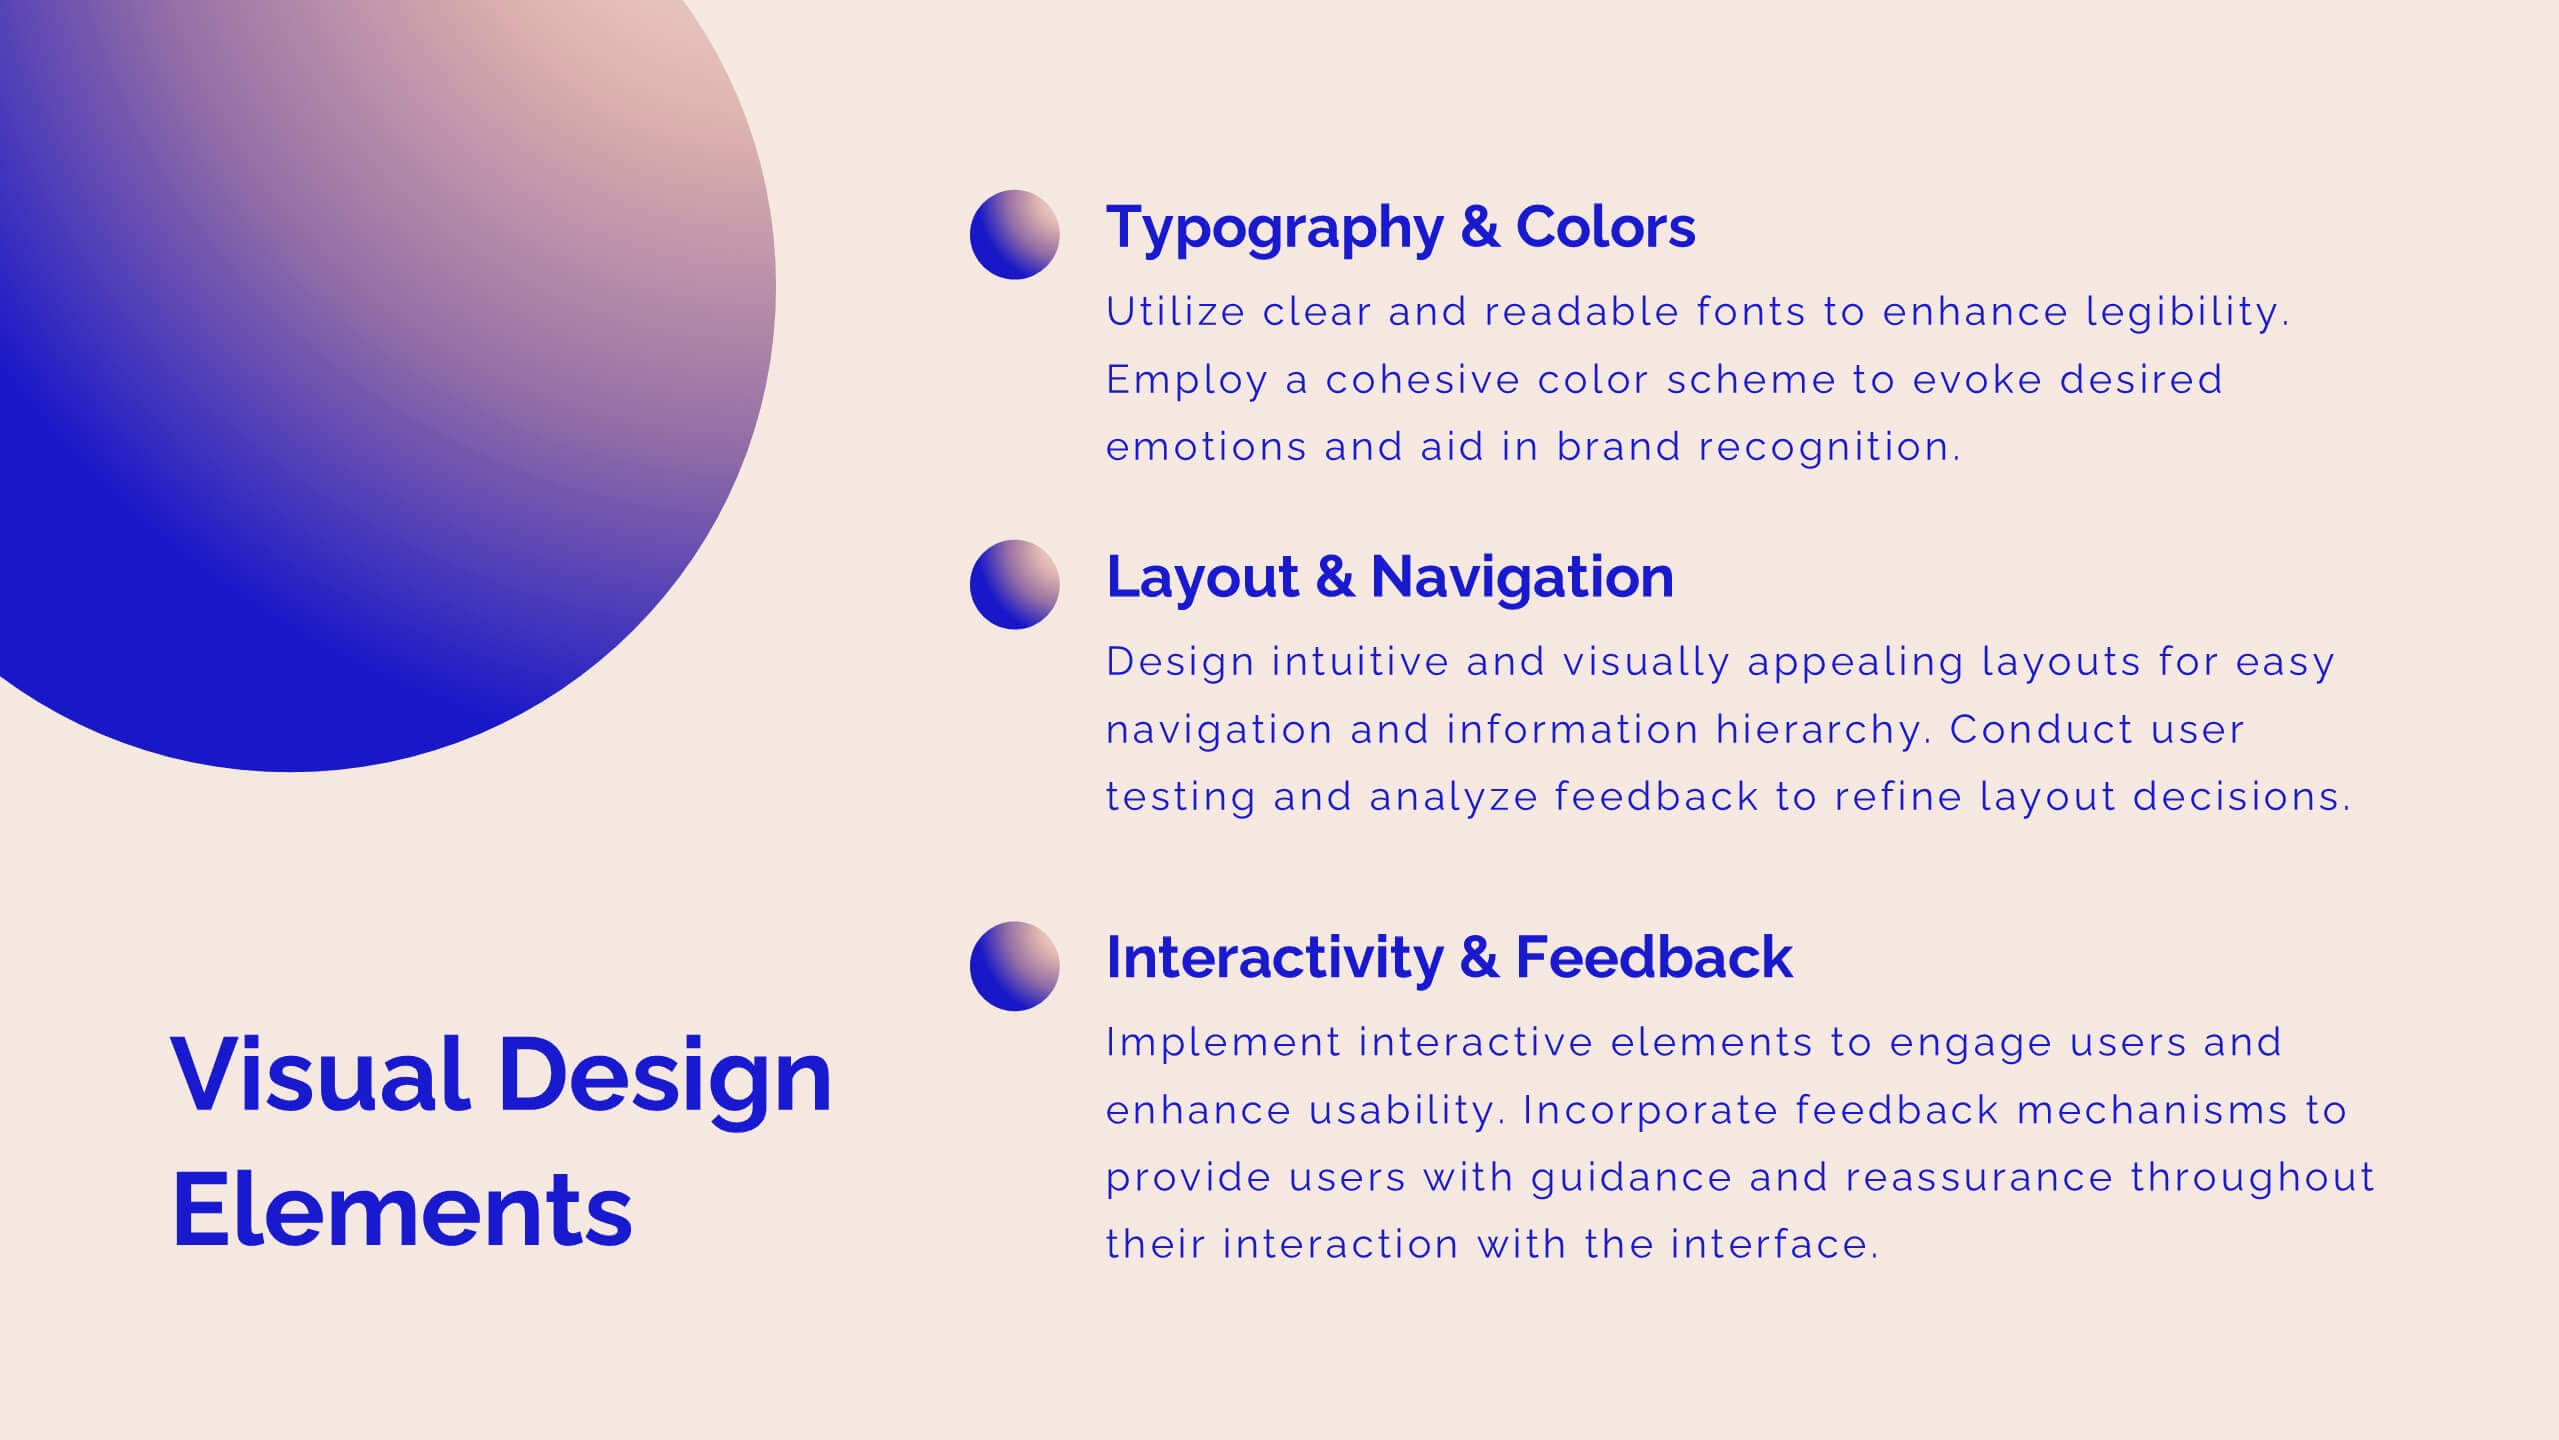
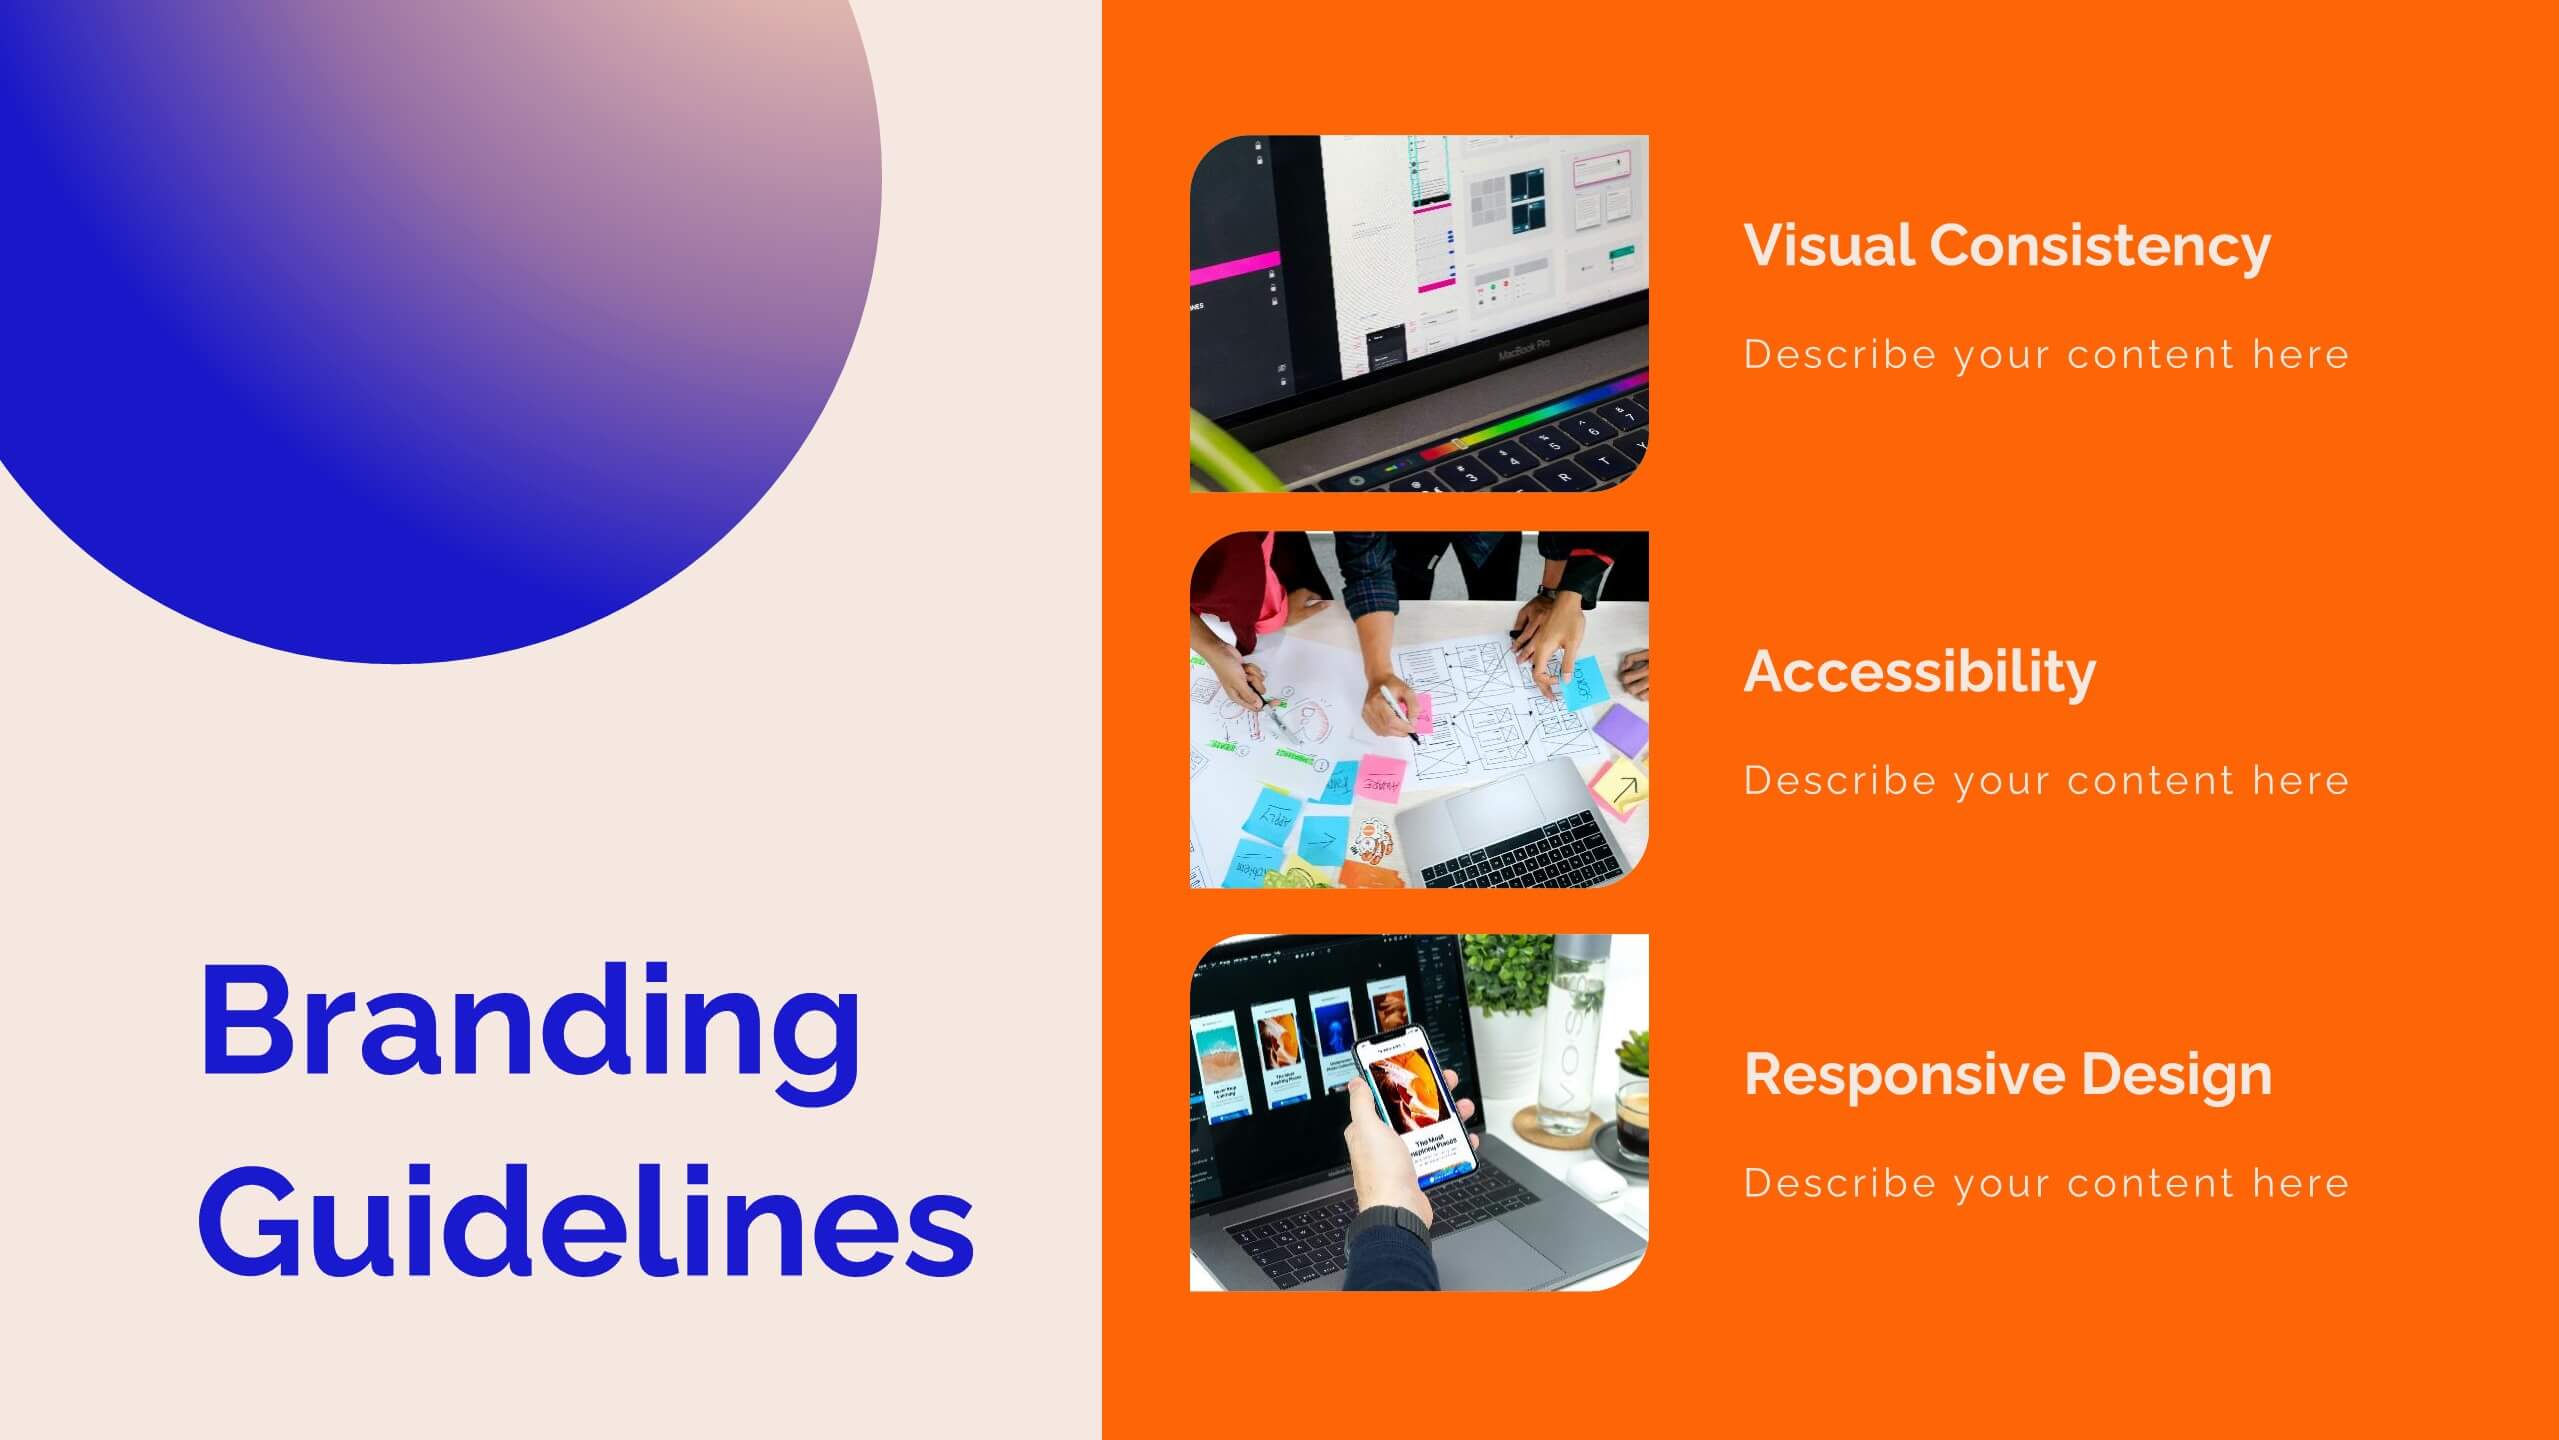
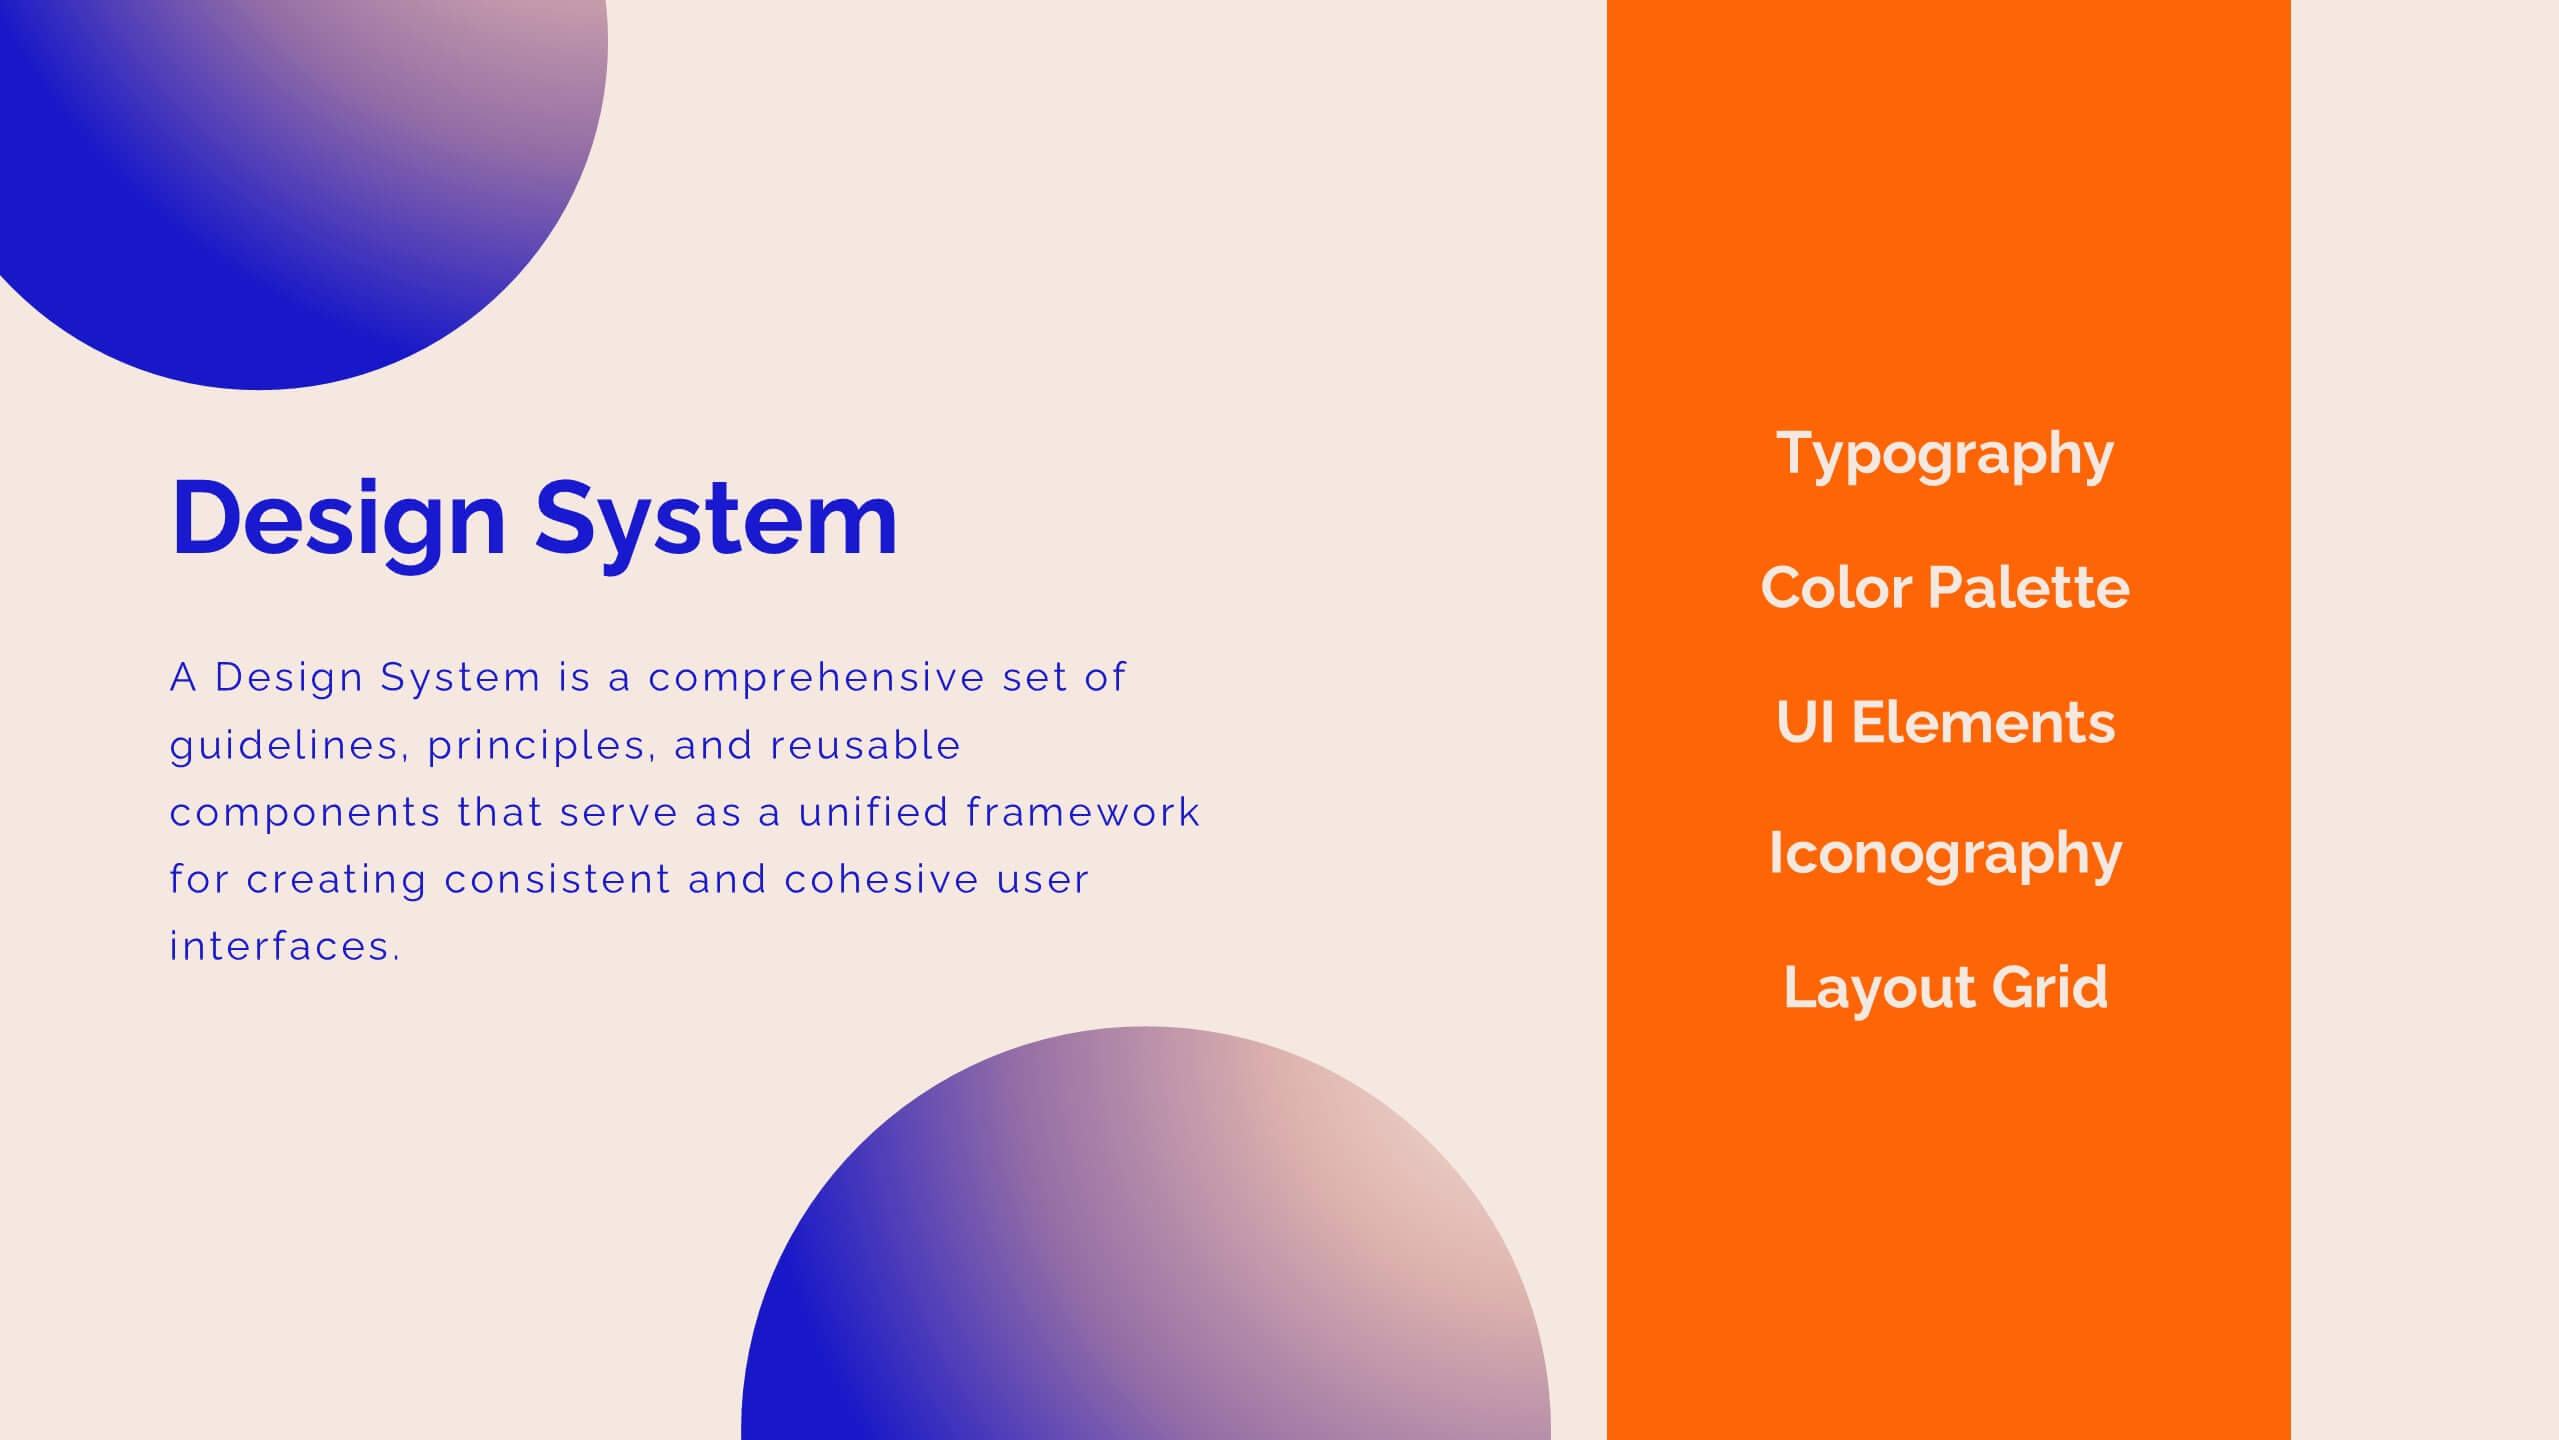
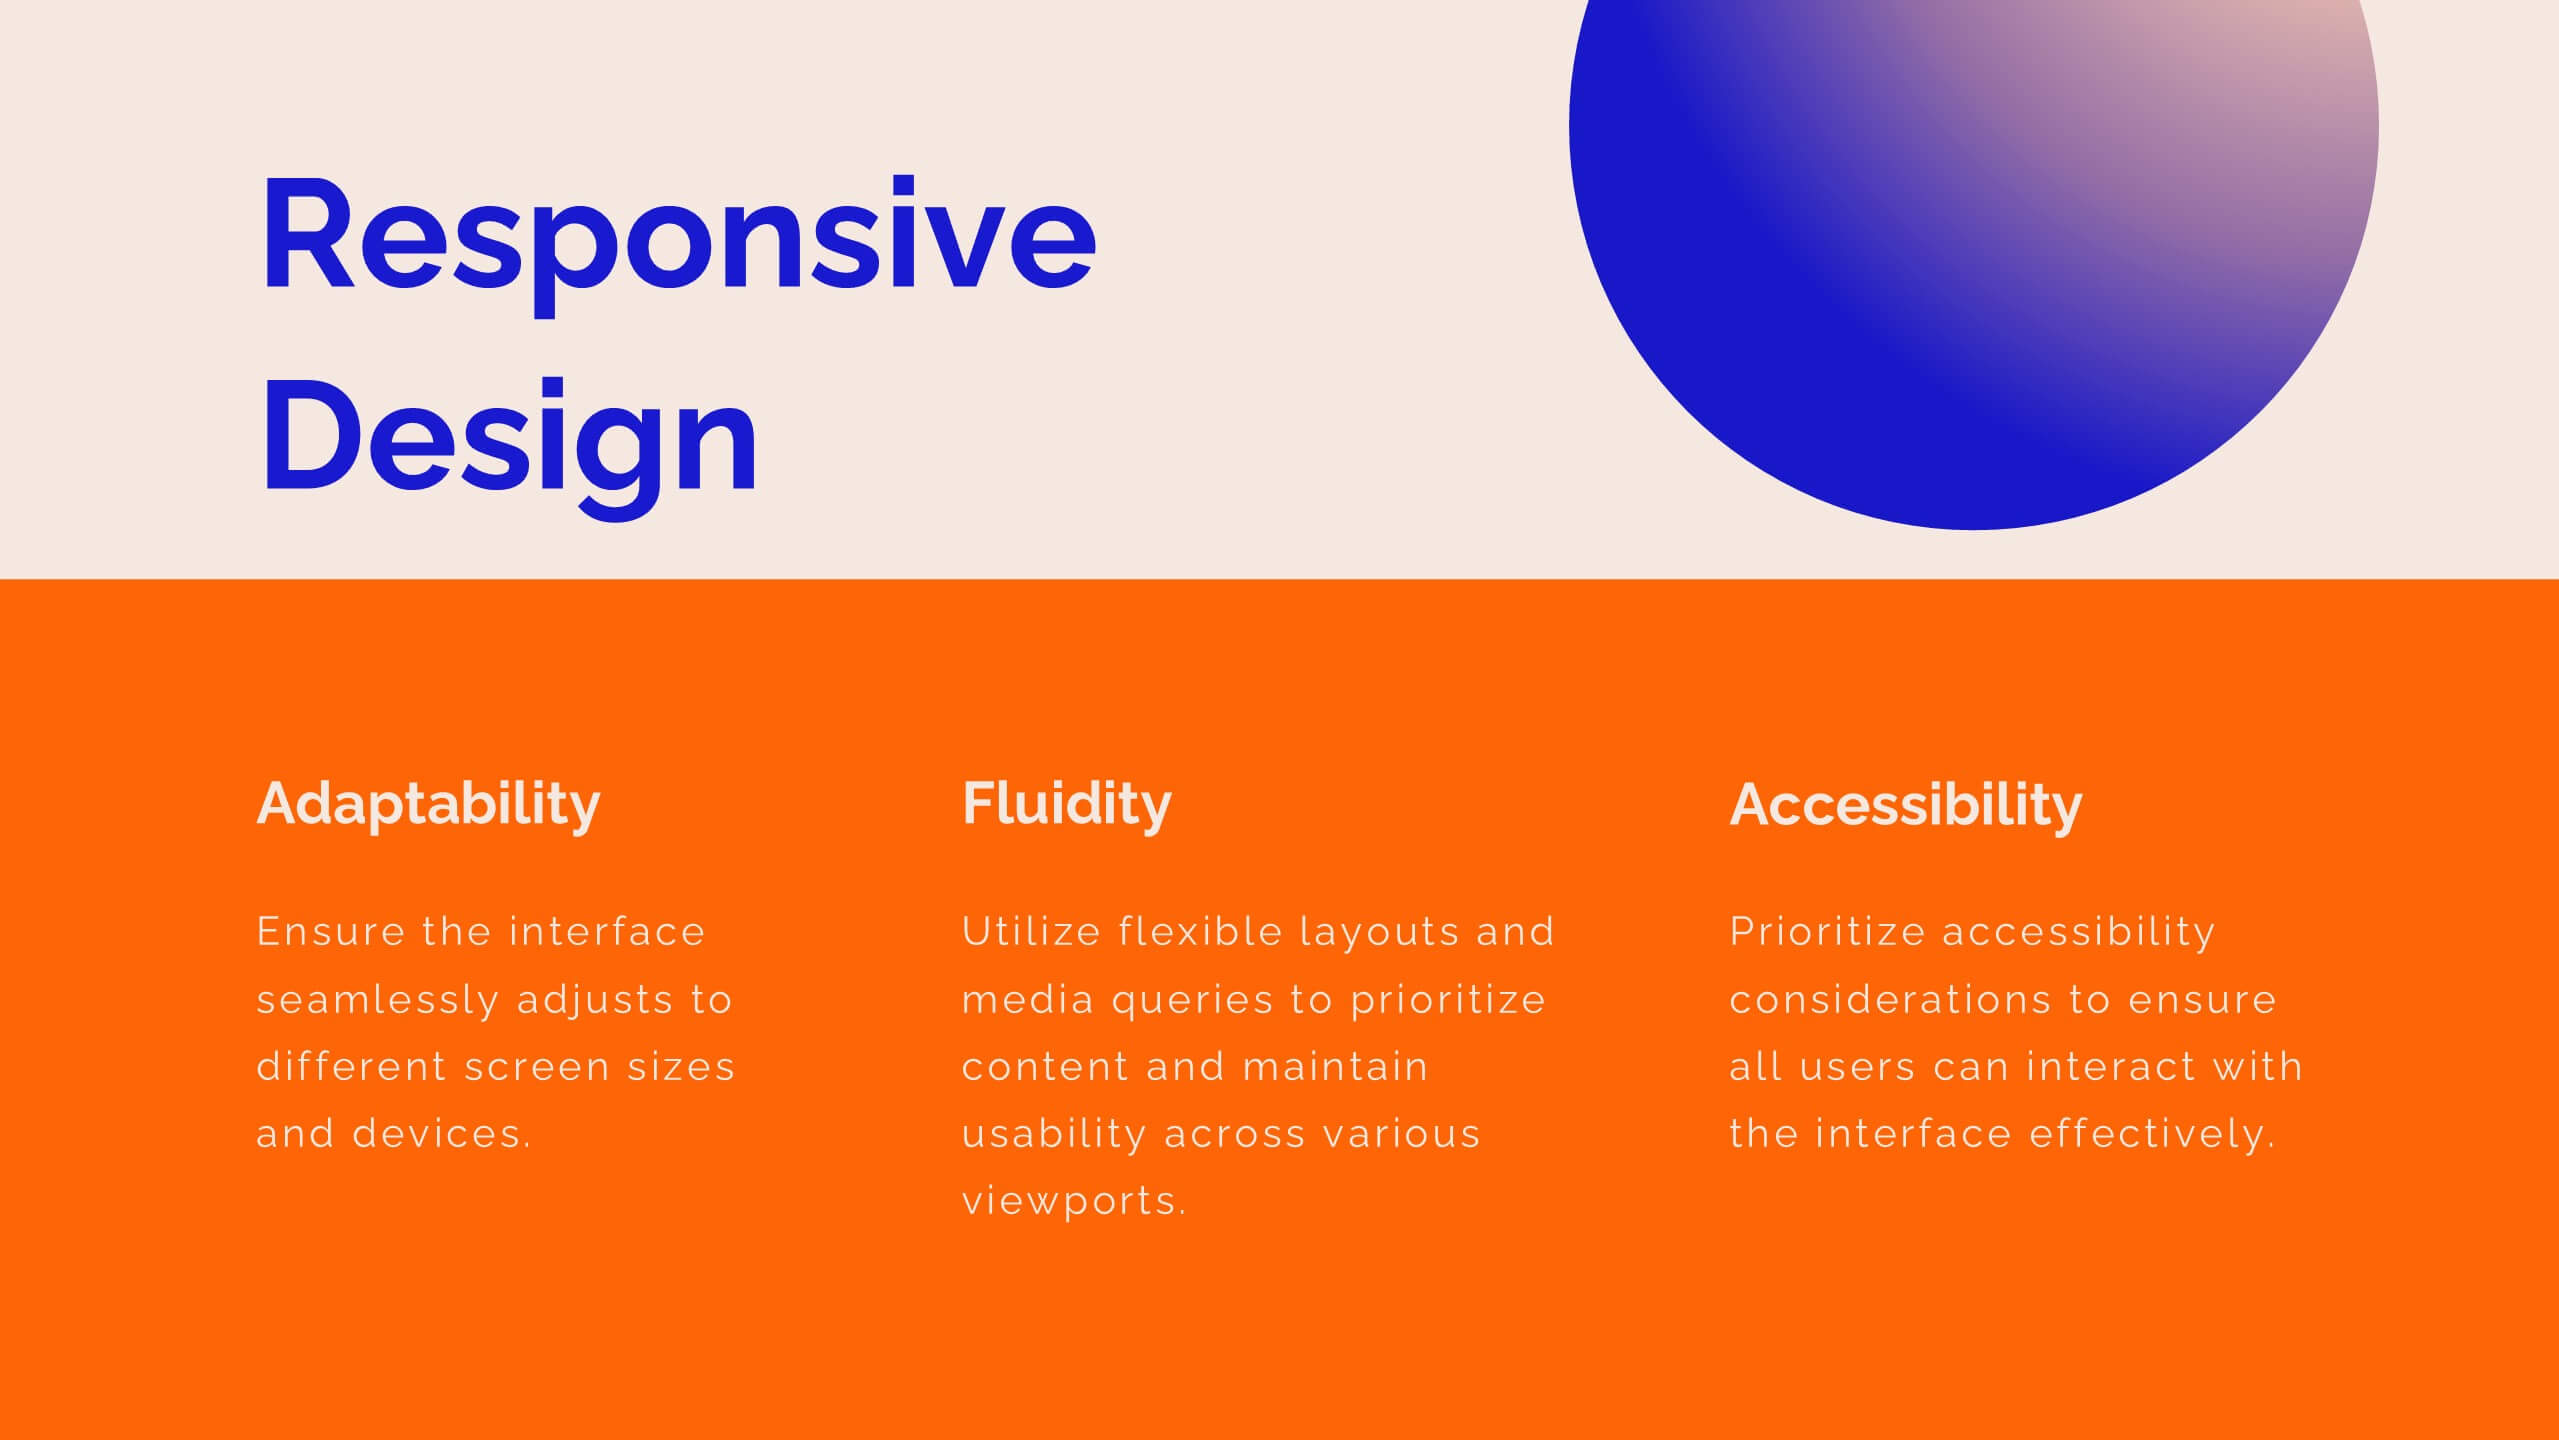
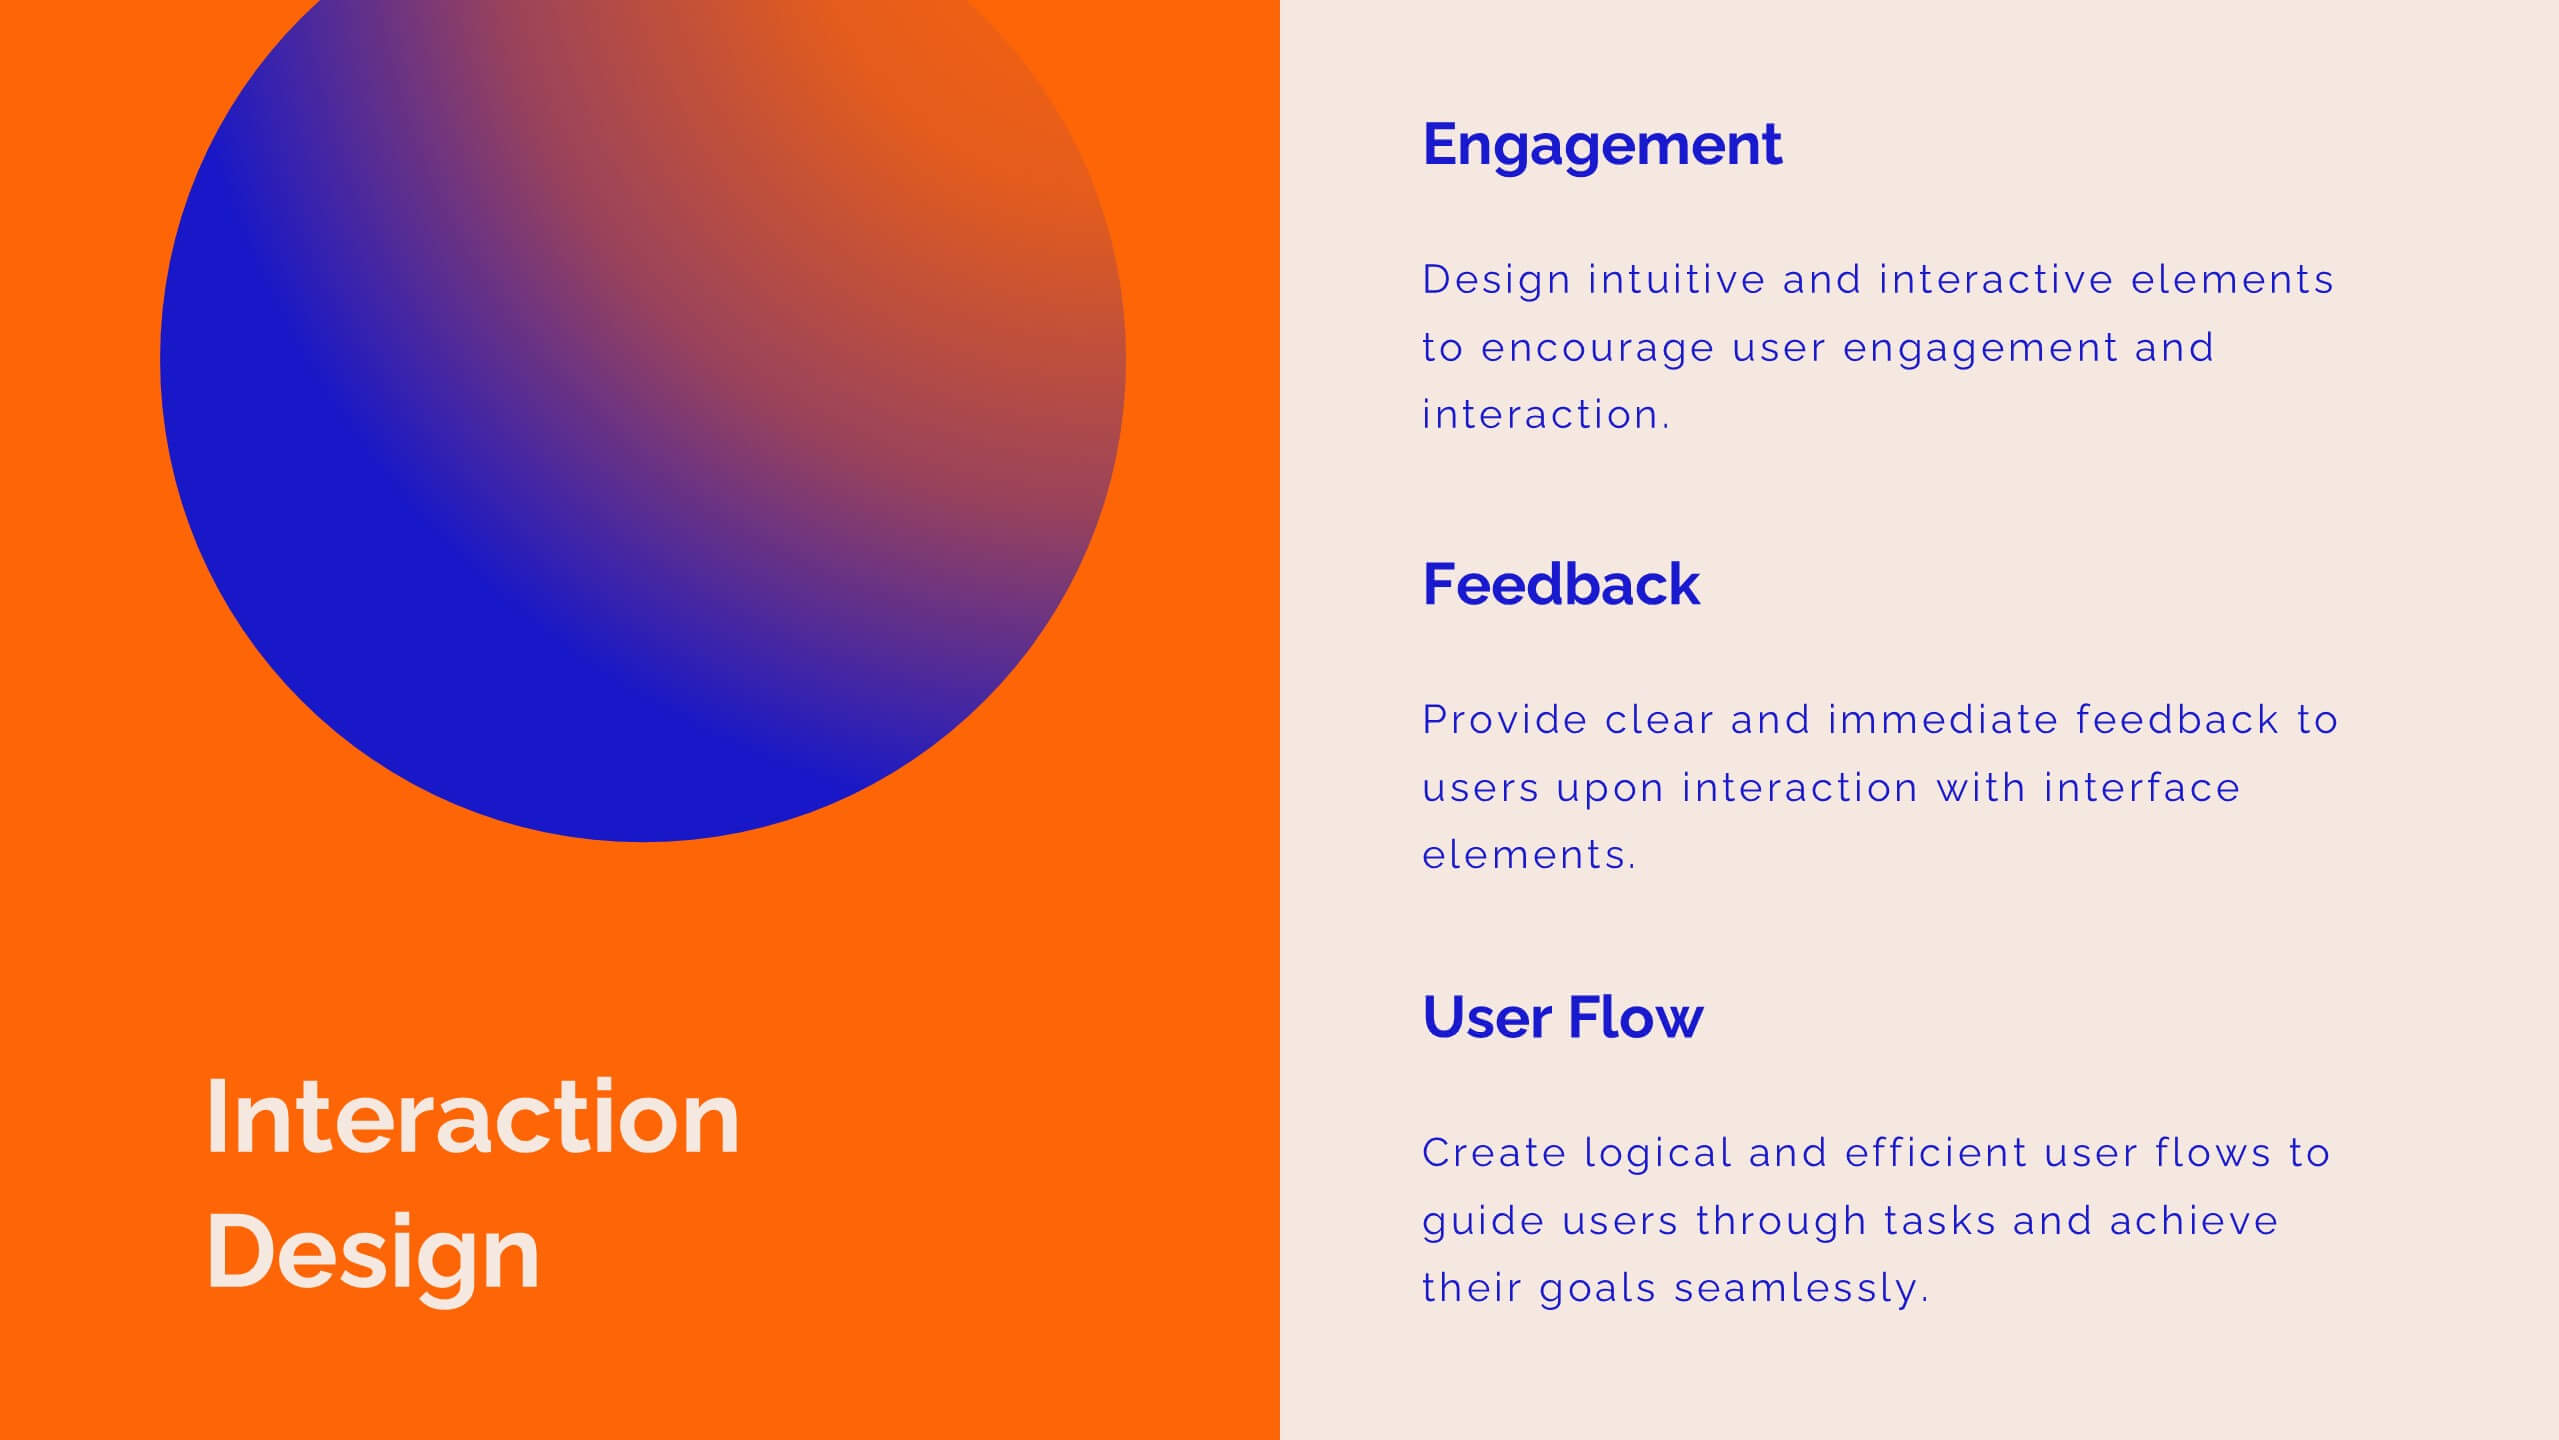
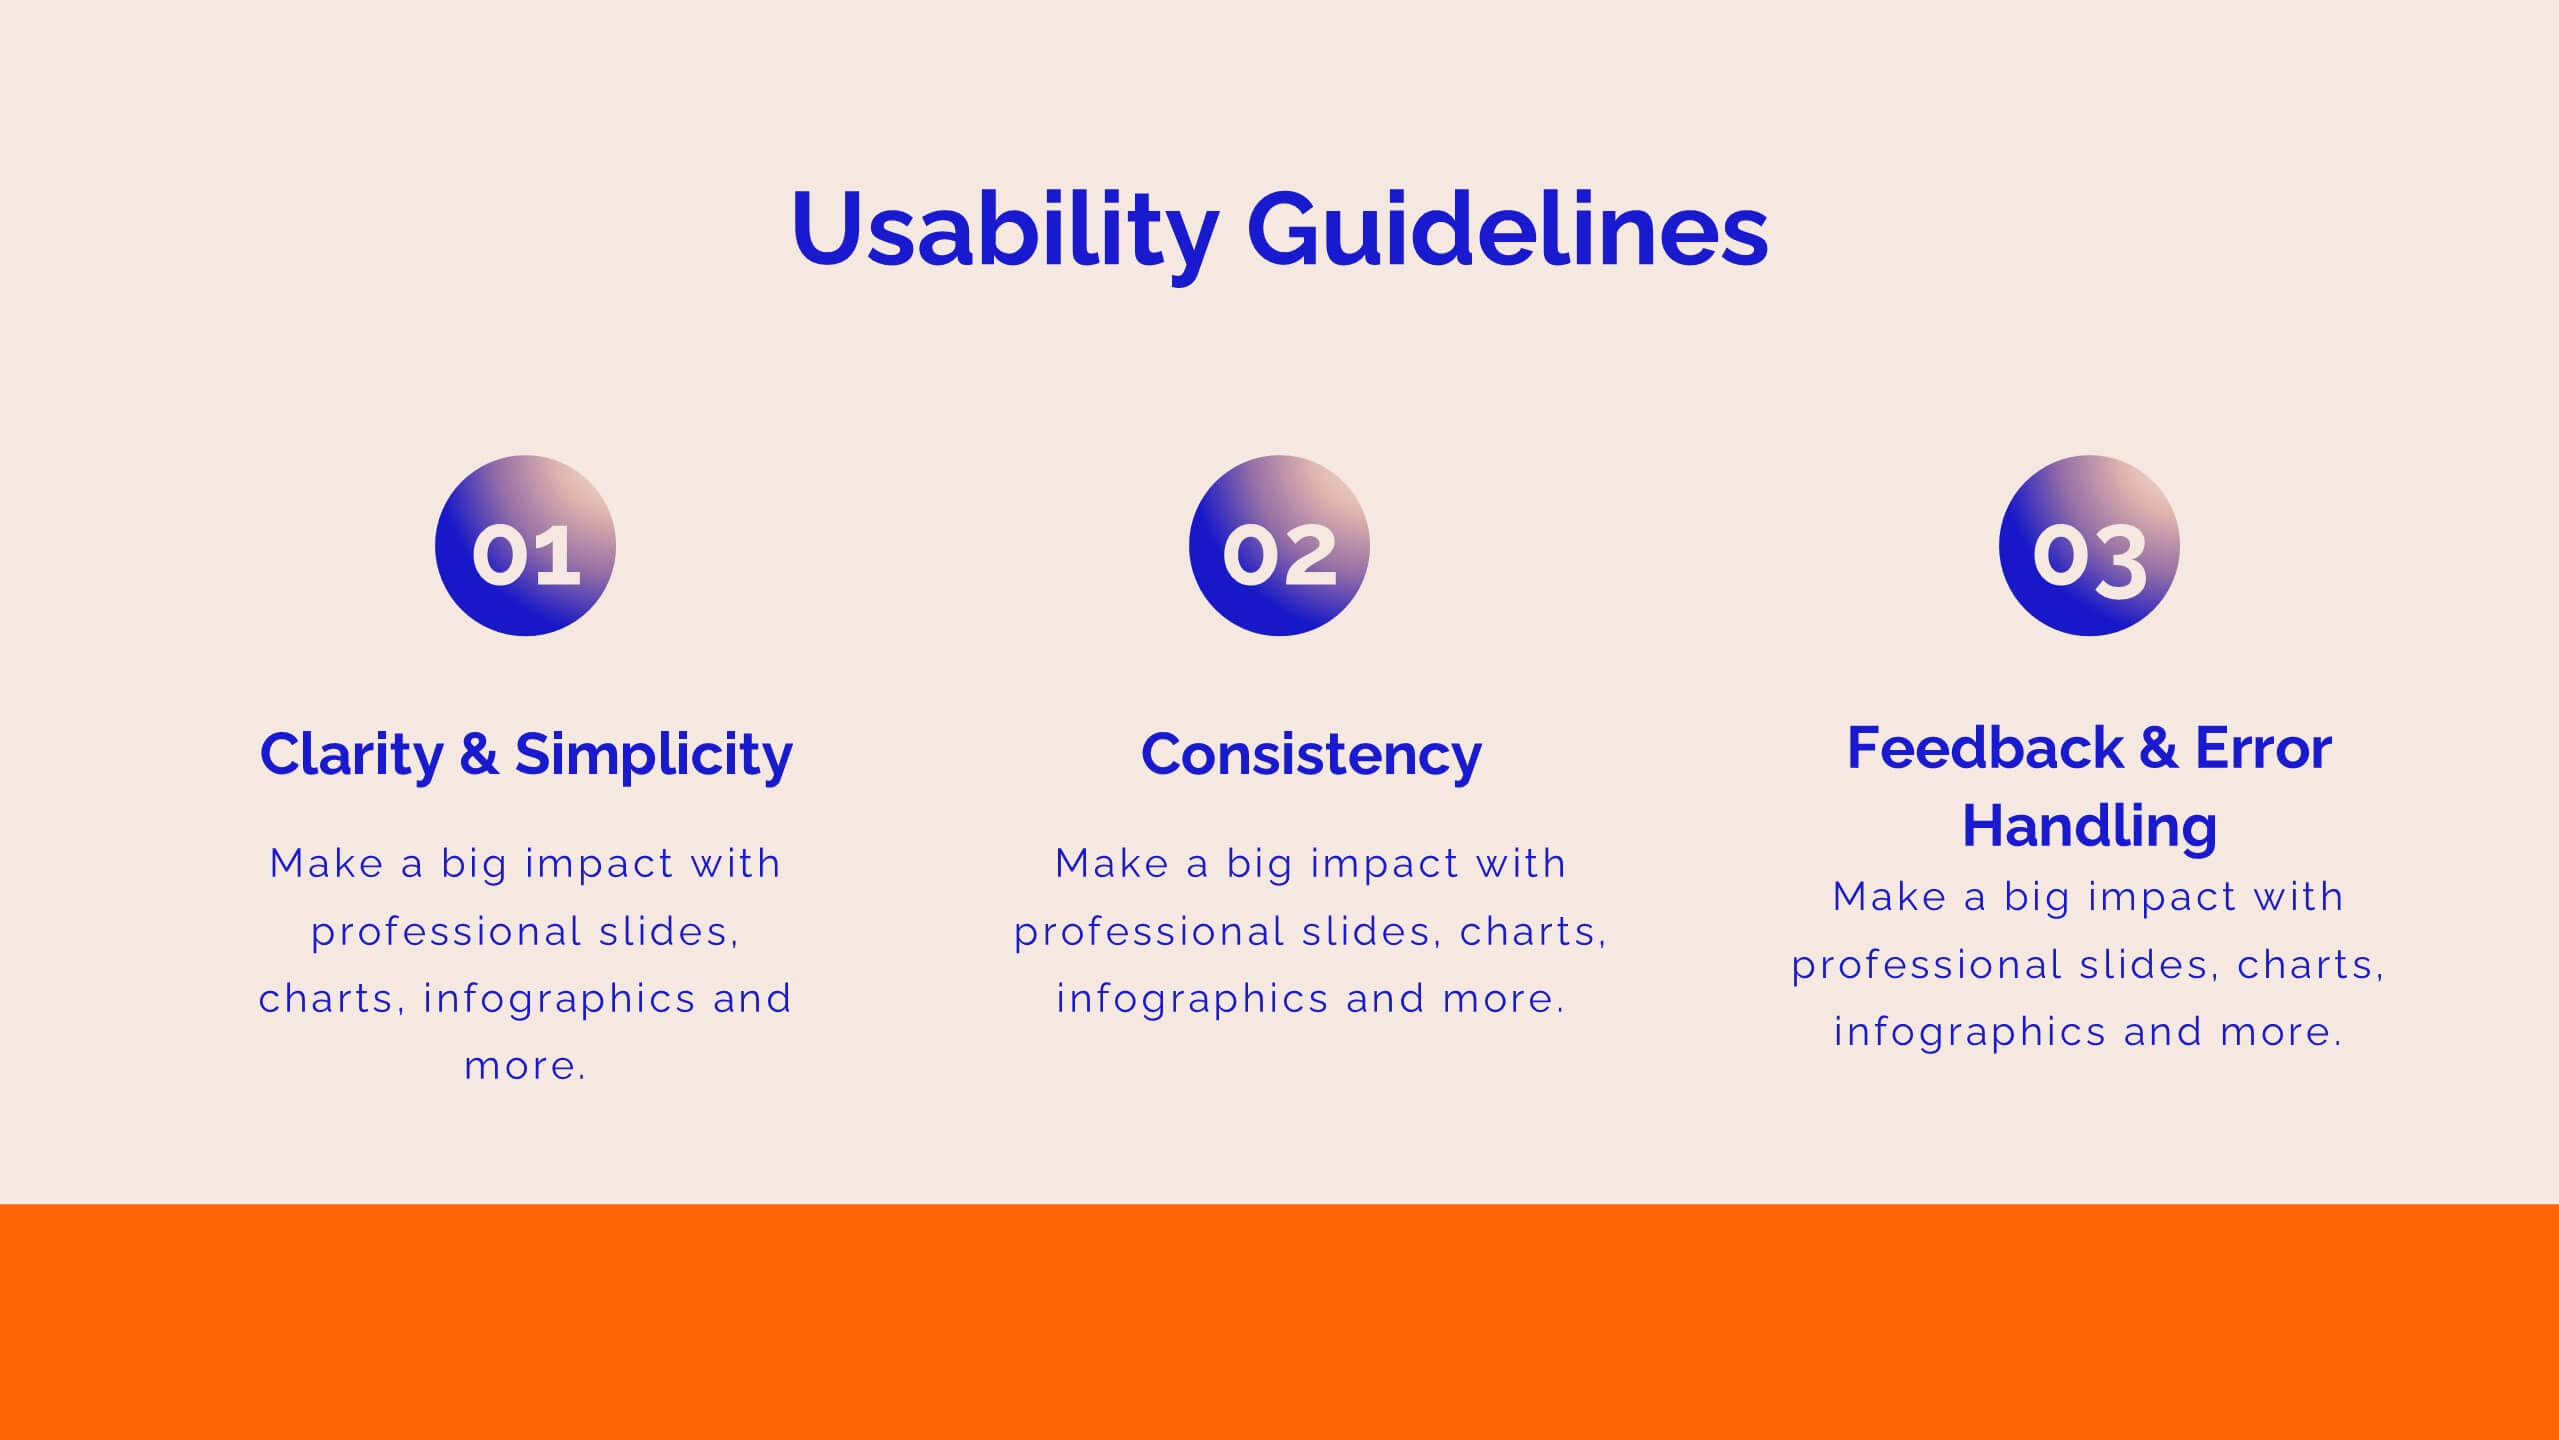
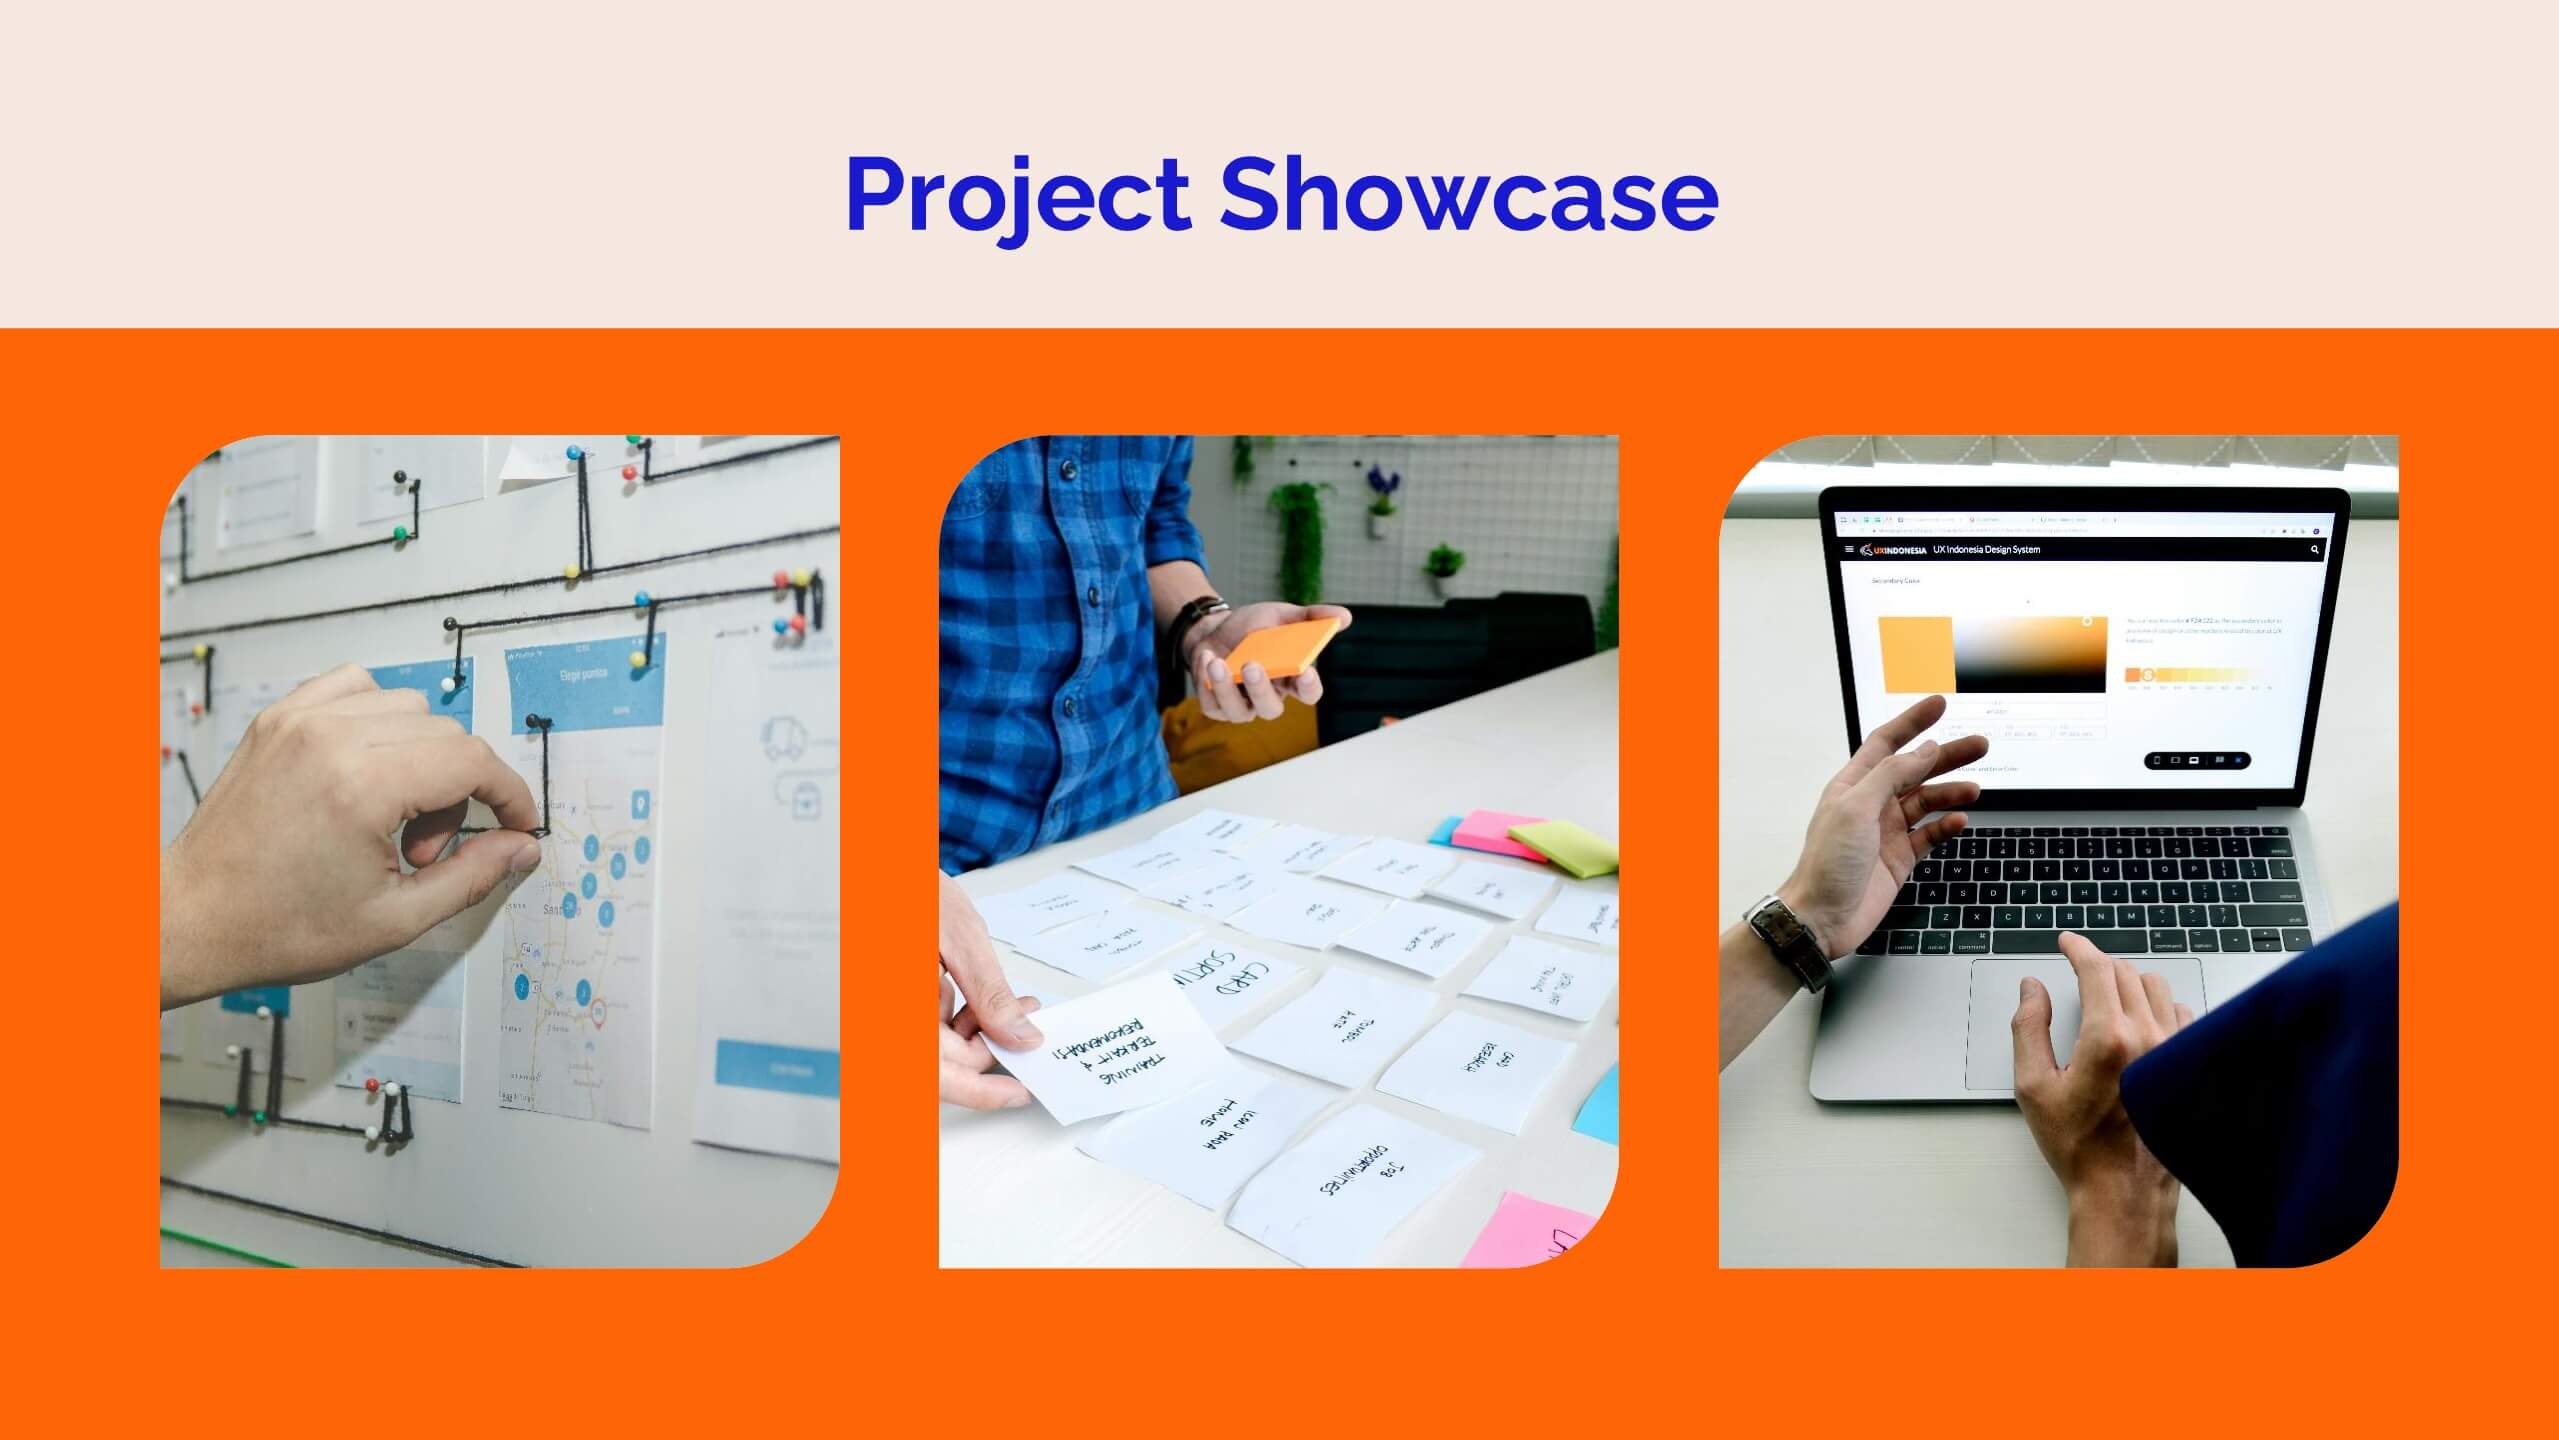
Niobium UX Research Report Presentation
Present your UX research findings with clarity and style using this vibrant UX research report template! It includes sections for user personas, wireframes, user testing, and design principles, making it ideal for sharing research insights. Fully customizable and compatible with PowerPoint, Keynote, and Google Slides, it's perfect for UX professionals and design teams.


3 diapositivas
Search Engine Optimization Strategy Presentation
Stand out in your next presentation with this dynamic visual breakdown of digital visibility tactics. Perfect for marketers, business owners, or SEO specialists, this colorful circular infographic highlights the key pillars of a search strategy in a way that's both professional and easy to follow. Compatible with PowerPoint, Keynote, and Google Slides.


5 diapositivas
Wedding Reception Program Infographics
Embrace the romance with our wedding reception program infographics, the quintessential guide for couples, wedding planners, and event organizers. This template, bathed in soothing light blue and light pink hues, provides an elegant backdrop for your wedding reception's flow of events. With a creative, vertical design, it offers an aesthetically pleasing layout that outlines the festivities, from heartfelt toasts to the final dance. It includes whimsical graphics, versatile icons, and customizable image placeholders, ensuring each moment is beautifully represented. Infuse personality and seamless organization into your special day, making it memorable for everyone involved.


23 diapositivas
Quest Corporate Strategy Proposal Presentation
Unlock success with this powerful corporate strategy template! Detail strategic objectives, market trends, and growth opportunities. Ideal for business leaders aiming to drive growth. Compatible with PowerPoint, Keynote, and Google Slides, this template ensures your strategy is clear, professional, and compelling. Make your vision a reality with impactful presentations.


7 diapositivas
Clinical Psychology Infographic
Clinical psychology is a field of psychology that focuses on diagnosing and treating mental, emotional, and behavioral disorders in individuals. This infographic template is designed to provide a deep understanding of clinical psychology, mental health disorders, treatment methods, and the vital role psychologists play in guiding individuals toward wellness. Compatible with Powerpoint, Keynote, and Google Slides. Discuss the importance of societal understanding and support for mental health, aiming to reduce stigma and foster a supportive environment. Empower yourself with knowledge and understanding through our infographic.


4 diapositivas
Effective Team Communication
Break down communication impact with this data-driven walkie-talkie infographic. Perfect for showing percentage-based contributions, roles, or workflow efficiency across teams. Fully customizable in PowerPoint, Keynote, and Google Slides.


6 diapositivas
Five Key Pillars of Organizational Strength Presentation
Highlight the foundational strengths of your business with the Five Key Pillars of Organizational Strength presentation. This visual framework uses classical column structures to represent five core principles, ideal for showcasing leadership values, corporate strategy, operational focus, or departmental roles. Each pillar is clearly labeled and customizable, making it easy to align with your organization’s unique message. Fully editable in PowerPoint, Keynote, and Google Slides, this template is perfect for board meetings, company culture decks, or executive planning sessions.


14 diapositivas
Business Innovation and Idea Development Presentation
Drive Business Innovation and Idea Development with this dynamic and structured template, perfect for illustrating creative processes, strategic growth, and idea execution. Designed with a lightbulb-themed layout, this presentation helps break down complex concepts into clear, engaging sections. Fully customizable and compatible with PowerPoint, Keynote, and Google Slides, making it an essential tool for entrepreneurs, teams, and business leaders looking to present ideas with impact.


4 diapositivas
Insurance Business Overview Presentation
Bring clarity and professionalism to your financial presentations with this sleek and modern design. Ideal for outlining key insights, policies, or service breakdowns, it visually communicates business protection and stability. Fully customizable and compatible with PowerPoint, Keynote, and Google Slides for an engaging and polished presentation experience.


5 diapositivas
Law and Justice Education Infographics
Law and Justice play a critical role in ensuring that people are treated fairly and that their rights are protected. This unique vertical Infographic template is designed to visually present information about legal education and the justice system. The template includes various graphics, charts, and icons that can be customized to fit your specific data and message. Use this to cover different topics related to law and justice, such as legal education, the court system, criminal justice, and more. The infographics are designed to make your information easy to understand and visually appealing.


5 diapositivas
Hidden Layers Iceberg Presentation
Reveal what lies beneath the surface with this Hidden Layers Iceberg Presentation. Ideal for explaining visible outcomes versus underlying causes, it’s perfect for business, psychology, or education topics. Clearly segmented layers with labeled callouts enhance clarity. Fully customizable in PowerPoint, Keynote, and Google Slides for effortless professional use.


7 diapositivas
Project Management Process Infographic
Navigate the vast arena of project management with our project management infographic. Anchored on a clear white base, the design is adorned with the calm of green, the trustworthiness of blue, and the innovative spirit of purple. Engage with meticulously designed infographics, tailored icons, and flexible image placeholders, providing a comprehensive visual guide to the realms of project planning, execution, and evaluation. Perfectly sculpted for Powerpoint, Keynote, or Google Slides. An invaluable asset for project managers, team leaders, consultants, or anyone in the corporate landscape wanting to visualize and optimize project stages.


7 diapositivas
Supply Chain Infographic Presentation Template
A Supply Chain is a strategic business process that can help organizations improve capacity, reduce cost and risk, attain growth potential and create value. A supply chain consists of these activity points: Suppliers, Manufacturing, Distribution, retailer, Customers. This template will help you to create a supply chain that meets your needs. It includes six clear steps, fill each box with details about what you want in each part of the supply chain. With this template, you’ll get a clear picture of what’s working in your supply chain and where there are opportunities for improvement.


5 diapositivas
Eco-Friendly Practices Summary Presentation
Bring your green initiatives to life with a vibrant, city-inspired visual that makes sustainability easy to explain and engaging to explore. This presentation helps you outline key eco-friendly efforts, goals, and results in a clean, modern layout. Fully customizable and compatible with PowerPoint, Keynote, and Google Slides.


7 diapositivas
Supply Chain Stock Infographic Presentation
A Supply Chain Infographic is a visual representation of information related to the flow of goods and services from suppliers to customers. This template is perfect for businesses and organizations involved in supply chain management, logistics, and procurement who want to communicate complex information in a clear way. This infographic can help engage stakeholders, promote understanding of supply chain-related issues, and drive positive change in the industry. Compatible with Powerpoint, Keynote, and Google Slides this template can be easily edited with different colors, fonts, and text.


6 diapositivas
Organizational Objectives and Key Results Presentation
Showcase your strategic goals and measurable outcomes with the Organizational Objectives and Key Results template. Designed with a sleek radial key layout, it’s ideal for mapping priorities and tracking progress. Fully editable in Canva, PowerPoint, and Google Slides, allowing easy customization of colors, icons, and text to fit your objectives.