Education Services Infographic
PowerPoint Template and Google Slides Theme


Características
Etiquetas
- Eliminar de favoritos
Plantilla de PowerPoint
1 MB
Plantilla de Google Slides
Enlace externo
Plantilla de Keynote
1 MB
Recomendar
- Eliminar de favoritos
Plantilla de PowerPoint
1 MB
Plantilla de Google Slides
Enlace externo
Plantilla de Keynote
1 MB
6 diapositivas
Iceberg Business Infographic
Delve beneath the surface with our Iceberg Business Infographic, perfect for Powerpoint, Google Slides, and Keynote. This infographic is designed to illustrate the underlying factors that impact an organization's success. The iceberg metaphor visually represents the concept that only a small part of a company's situation is visible above the surface, while much more is hidden below. The customizable segments can be used to detail various aspects of business operations, risks, and opportunities that are not immediately apparent. By employing this Iceberg Business infographic, you can effectively communicate the complexities of business strategies.
- Eliminar de favoritos
Plantilla de PowerPoint
1 MB
Plantilla de Google Slides
Enlace externo
Plantilla de Keynote
1 MB
5 diapositivas
Key Drivers Behind Success Strategy Presentation
Highlight the building blocks of your business strategy with the Key Drivers Behind Success Strategy Presentation. This sleek, horizontal infographic uses a timeline-style layout with four labeled checkpoints—perfect for showcasing essential success factors, strategic pillars, or operational milestones. Ideal for leadership updates or corporate planning decks. Fully editable in Canva, PowerPoint, Keynote, and Google Slides.
- Eliminar de favoritos
Plantilla de PowerPoint
1 MB
Plantilla de Google Slides
Enlace externo
Plantilla de Keynote
1 MB
3 diapositivas
Agriculture Sector Insights Presentation
Bring data to life with a presentation that captures the essence of growth and sustainability. Ideal for showcasing trends, production metrics, or environmental insights, this design blends visual storytelling with professional clarity. Fully editable and compatible with PowerPoint, Keynote, and Google Slides for effortless customization and impactful delivery.
- Eliminar de favoritos
Plantilla de PowerPoint
1 MB
Plantilla de Google Slides
Enlace externo
Plantilla de Keynote
1 MB
6 diapositivas
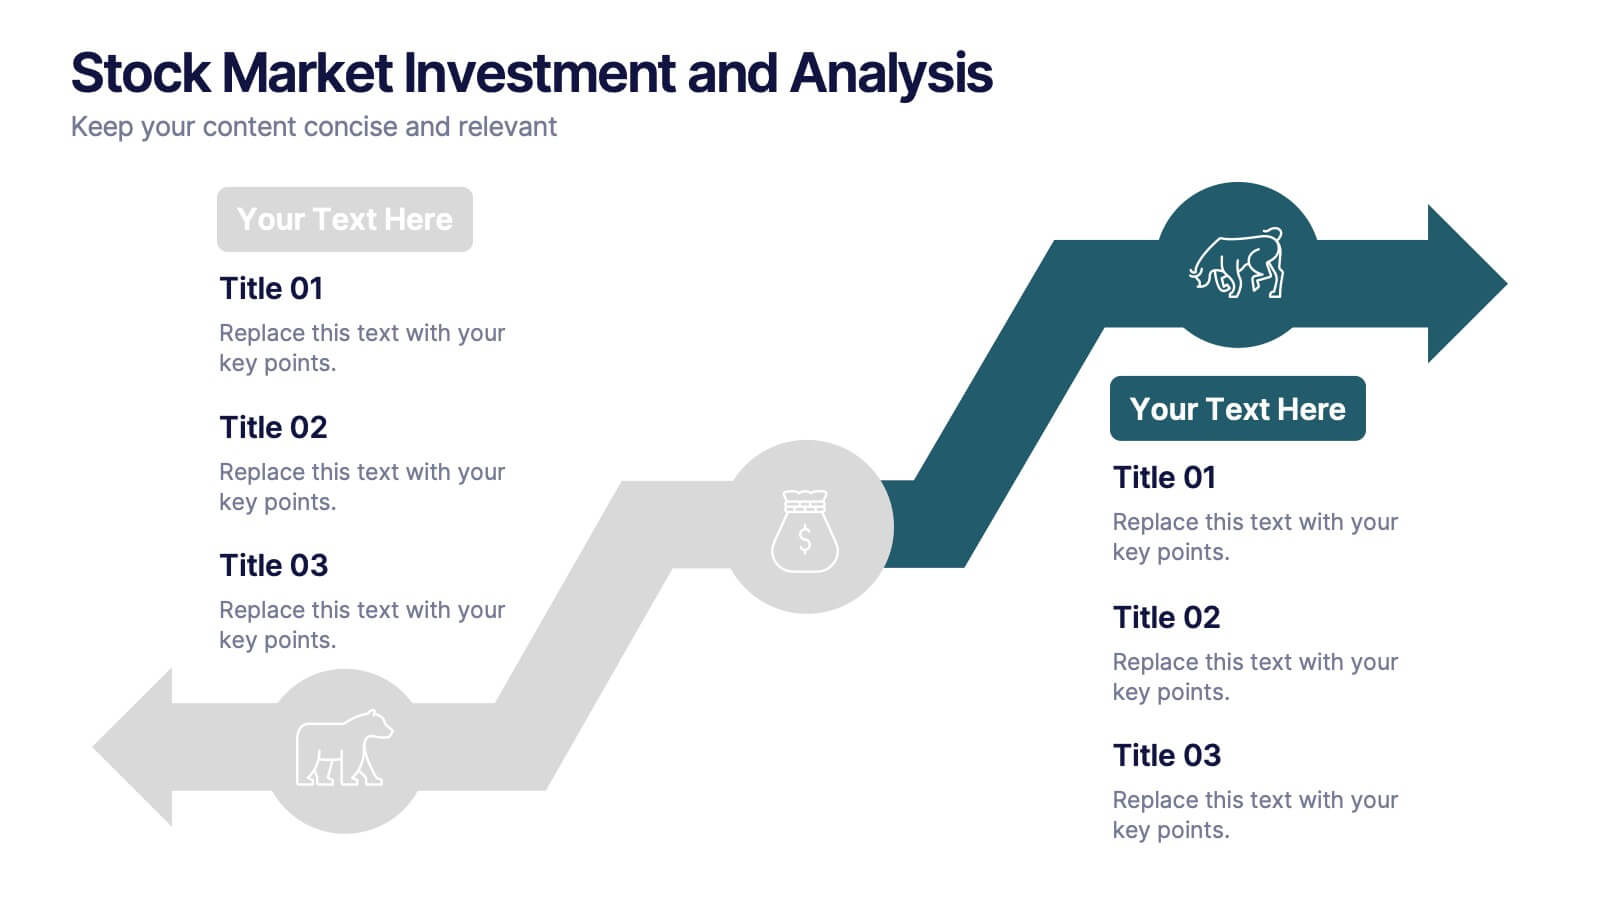
Stock Market Investment and Analysis Presentation
Showcase your market insights with this dynamic zigzag arrow diagram—perfect for highlighting bullish vs. bearish trends, financial analysis, and investment milestones. The slide features a split-path layout with icons and editable text areas to clearly compare strategies or illustrate turning points. Fully customizable in PowerPoint, Keynote, and Google Slides.
- Eliminar de favoritos
Plantilla de PowerPoint
1 MB
Plantilla de Google Slides
Enlace externo
Plantilla de Keynote
1 MB
6 diapositivas
Consumer Decision Infographic
Consumer decision-making refers to the process through which individuals make choices about purchasing goods or services. This infographic template visually represents the process that consumers go through when making purchasing decisions. This template can be used to serve as a valuable tool to help your audience understand the steps consumers go through before making a purchase. This infographic is designed to provide insights for businesses to tailor their marketing strategies accordingly. Fully customizable and compatible with Powerpoint, Keynote, and Google Slides. Include statistics and data to highlight trends in consumer behavior.
- Eliminar de favoritos
Plantilla de PowerPoint
1 MB
Plantilla de Google Slides
Enlace externo
Plantilla de Keynote
1 MB
6 diapositivas
WFH Tools and Productivity Tips
Level up your work-from-home game with this modern visual wheel that breaks down essential tools and actionable tips to boost productivity. Perfect for remote teams, solo entrepreneurs, or virtual training sessions, this layout keeps key info easy to digest and visually engaging. Fully compatible with PowerPoint, Keynote, and Google Slides.
- Eliminar de favoritos
Plantilla de PowerPoint
1 MB
Plantilla de Google Slides
Enlace externo
Plantilla de Keynote
1 MB
6 diapositivas
Creative Thinking and Innovation Presentation
Unleash Creative Thinking and Innovation with this engaging infographic. Featuring a visually dynamic brain puzzle design, this template is perfect for presenting problem-solving strategies, brainstorming techniques, and creative business solutions. Fully editable and compatible with PowerPoint, Keynote, and Google Slides.
- Eliminar de favoritos
Plantilla de PowerPoint
1 MB
Plantilla de Google Slides
Enlace externo
Plantilla de Keynote
1 MB
4 diapositivas
Root Cause Analysis for Problem Solving
Tackle problems from the inside out with this structured and easy-to-follow layout. This root cause analysis template helps you clearly map out underlying issues and visualize their impact in one slide. Ideal for team discussions, audits, and presentations—fully editable in PowerPoint, Keynote, and Google Slides for maximum flexibility.
- Eliminar de favoritos
Plantilla de PowerPoint
1 MB
Plantilla de Google Slides
Enlace externo
Plantilla de Keynote
2 MB
4 diapositivas
Device Mockup Display Slide Presentation
Showcase your digital products with this device mockup slide. Ideal for highlighting landing pages, dashboards, or app interfaces, the layout includes clean typography and vibrant shapes for visual balance. Fully editable in PowerPoint, Keynote, and Google Slides—customize text, colors, and images to fit your tech brand or presentation style.
- Eliminar de favoritos
Plantilla de PowerPoint
1 MB
Plantilla de Google Slides
Enlace externo
Plantilla de Keynote
1 MB
6 diapositivas
Arrow Mapping for Growth Journey
Showcase progress and strategic development using the Arrow Mapping for Growth Journey Presentation. This vibrant arrow-style roadmap is designed to highlight five key stages—perfect for illustrating phases of growth, milestones, or business transformations. Use it to map out project timelines, organizational development, or customer onboarding flows. Fully editable in PowerPoint, Keynote, and Google Slides, it’s ideal for business strategists, consultants, and marketing teams.
- Eliminar de favoritos
Plantilla de PowerPoint
1 MB
Plantilla de Google Slides
Enlace externo
Plantilla de Keynote
1 MB
7 diapositivas
Communication Infographic Presentation Template
Communication Infographics are a more professional way of presenting facts and a great way to share your marketing strategy and goals with your team. Our template includes a variety of infographic elements, including bullet points, call to actions and persuasive slogans. This template design is ideal for presentations on subjects such as content marketing, sales, social media strategy, and many more. Our Communication Template includes graphic illustrations, slides and text boxes for your topics. In this template you can easily add your own text and images to create a meaningful presentation.
- Eliminar de favoritos
Plantilla de PowerPoint
1 MB
Plantilla de Google Slides
Enlace externo
Plantilla de Keynote
1 MB
5 diapositivas
Customer Relationship Strategy Presentation
Refine your approach to customer interactions with the "Customer Relationship Strategy" presentation templates. Perfect for delineating clear, actionable strategies to enhance client engagement and satisfaction, these templates are a must-have for businesses focused on building lasting customer relationships. Compatible with PowerPoint, Keynote, and Google Slides, they provide the tools to effectively communicate your customer relationship policies and goals.
- Eliminar de favoritos
Plantilla de PowerPoint
1 MB
Plantilla de Google Slides
Enlace externo
Plantilla de Keynote
1 MB
5 diapositivas
Natural Disasters in the World Infographics
Natural Disasters are catastrophic events that occur as a result of natural processes or phenomena, and they can have severe impacts on human life, property, and the environment. These infographics are visually striking presentation templates that highlight various types of natural disasters that occur worldwide. It provides an overview of the most common natural disasters, their causes, and their impact on the environment and human lives. It is suitable for educational presentations, environmental discussions, disaster preparedness campaigns, and any other context where understanding natural disasters is essential.
- Eliminar de favoritos
Plantilla de PowerPoint
1 MB
Plantilla de Google Slides
Enlace externo
Plantilla de Keynote
1 MB
7 diapositivas
Steps Process Infographic Presentation Template
A steps process is a way of breaking down a task or project into a series of smaller, manageable steps. This template is perfect for showing steps processes in a fun and easy-to-understand way. It's compatible with Powerpoint, Keynote, and Google Slides, so you can use it on any device. This template has attention-grabbing colors to make your presentation stand out. It is also customizable with step charts, so you can make your presentation look just the way you want. With this template, you can make learning fun and easy for your students, or make your business presentations look professional.
- Eliminar de favoritos
Plantilla de PowerPoint
1 MB
Plantilla de Google Slides
Enlace externo
Plantilla de Keynote
2 MB
6 diapositivas
Bitcoin and Blockchain Technology Overview Presentation
Break down complex blockchain systems into digestible visuals with this sleek overview slide. Featuring six color-coded icons around a secure lock illustration, it’s ideal for explaining blockchain architecture, bitcoin components, or crypto processes. Fully editable in PowerPoint, Keynote, and Google Slides for seamless customization.
- Eliminar de favoritos
Plantilla de PowerPoint
1 MB
Plantilla de Google Slides
Enlace externo
Plantilla de Keynote
1 MB
6 diapositivas
Preventative Healthcare and Fitness Presentation
Promote wellness and proactive care with this colorful and clean slide layout. Featuring a clipboard-style design with stacked icons and aligned descriptions from A to E, it’s perfect for presenting fitness tips, health programs, or preventative strategies. The vibrant sections help guide viewers through key points at a glance. Fully editable and compatible with PowerPoint, Keynote, and Google Slides.
- Eliminar de favoritos
Plantilla de PowerPoint
1 MB
Plantilla de Google Slides
Enlace externo
Plantilla de Keynote
2 MB
10 diapositivas
Corporate Governance Model Presentation
Bring clarity and structure to complex leadership systems with this clean, modern slide, perfect for explaining how key responsibilities flow across an organization. It helps simplify roles, decisions, and oversight for any business audience. Fully editable and easy to use in PowerPoint, Keynote, and Google Slides.


