


Características


¿Tienes alguna pregunta?
Recomendar


10 diapositivas
Body System Educational Overview Presentation
Dive into anatomy with a slide that makes learning the human body visual, clear, and interactive. This educational overview breaks down key body systems into simple, labeled sections—perfect for classroom teaching, medical training, or health awareness campaigns. Fully editable and compatible with PowerPoint, Keynote, and Google Slides for seamless customization.


4 diapositivas
Professional Team Profiles and Roles Presentation
Showcase your team with impact using the Professional Team Profiles and Roles Presentation. Ideal for company introductions, this slide highlights key members with photo, name, title, and a brief role description. Clean, modern layout makes it easy to customize in PowerPoint, Canva, or Google Slides to match your brand.


6 diapositivas
Strategy for Effective Solutions Presentation
Unlock strategic clarity with the Strategy for Effective Solutions template, which effectively organizes complex strategies into six interconnected segments, ideal for sequentially showcasing business insights. Its clear, systematic design supports concise communication and is compatible with PowerPoint, Keynote, and Google Slides, making it a versatile tool for professional presentations.


7 diapositivas
Editable List Slide Presentation
Organize your ideas with style and simplicity using this clean, structured layout designed for clarity and impact. Ideal for summarizing key points, checklists, or action plans, it keeps your content professional and easy to follow. Fully customizable and compatible with PowerPoint, Keynote, and Google Slides for seamless presentation design.


4 diapositivas
Target Audience Slide Deck Presentation
Make your message click instantly with a bold, puzzle-style slide that brings your audience insights to life. This presentation helps you break down key segments, user needs, and demographic details in a clear, engaging format that supports strategic decision-making. Fully compatible with PowerPoint, Keynote, and Google Slides.


7 diapositivas
Office Scenes Infographic Presentation Template
An Office Scene Infographic is a visualization of the most common types of office spaces, along with their pros and cons. This infographic template is great for a school presentation, office projects, employee onboarding programs, or planning a workplace makeover. Within this infographic, you will be able to display absolutely everything that needs to be shown within a corporate setting. This office scene template is a fully layered and customizable infographic that allows you to create your own design. Use it as an infographic, as a presentation, or even a website/app background.


8 diapositivas
Team Roles & Skills Chart Presentation
Bring your team’s strengths to life with this clean, engaging slide designed to highlight individual roles, skill levels, and key capabilities. It helps teams clearly visualize expertise, compare competencies, and communicate responsibilities with ease. Fully editable and compatible with PowerPoint, Keynote, and Google Slides.


7 diapositivas
Important Stats and Metrics by Numbers Presentation
Display key metrics with impact using this modern numeric infographic layout. Ideal for summarizing performance statistics, benchmarks, or data highlights across six categories. The circular markers and bold percentages enhance readability and focus. Fully editable in Canva—perfect for business reviews, investor decks, or analytical presentations that demand clarity.


4 diapositivas
Machine Learning Overviews Presentation
Bring your audience into the world of intelligent automation with a bold, visual layout that makes complex concepts feel simple and engaging. This presentation breaks down key processes, workflows, and insights using clear graphics that support your message. Fully customizable and compatible with PowerPoint, Keynote, and Google Slides.


12 diapositivas
Alphabet Learning and Education Presentation
Introduce concepts creatively with this bold "A"-shaped infographic designed for education topics. Each segment of the letter highlights a numbered point, making it ideal for step-by-step instructions, learning stages, or literacy development. Use it to simplify complex ideas visually. Fully editable in PowerPoint, Keynote, and Google Slides.
8 diapositivas
3-Step Arrow Process Flow Presentation
Kickstart your message with a bold, directional visual that makes every step feel clear and intentional. This presentation showcases a simple three-stage progression ideal for explaining workflows, strategies, or business processes with clarity and impact. Easy to customize and fully compatible with PowerPoint, Keynote, and Google Slides.


26 diapositivas
HIIT Workout Pink Presentation
Unleash the energy with our vibrant HIIT gym workout presentation template, a dynamic blend of pink, red, orange, and yellow, designed to bring your fitness regime to life. This energetic palette is perfect for gym owners, fitness influencers, and personal trainers aiming to showcase the high-intensity intervals that promise fast results. The template offers various graphics, icons, and image placeholders that add a visual punch to your information. Dive into creating an engaging, motivational fitness journey that highlights the benefits, routines, and transformative power of HIIT workouts, ensuring your audience is pumped and ready to go!


7 diapositivas
Executive Summary Plan Infographic Presentation
An Executive Summary Infographic is a visual representation of the key points and highlights of a longer report or document. Use this creative template as a way to present complex information in a simplified and visually appealing way, allowing busy executives and decision-makers to quickly understand the main findings and recommendations. This template includes a mix of charts, graphs, and other visual elements, along with text. This template's purpose is to help busy executives and decision-makers understand the main points of a report, without having to read through the entire document.


7 diapositivas
Fishbone Diagram Infographic Presentation Template
A Fishbone diagram, also called a cause-and-effect diagram, is a tool used to identify and analyze the potential causes of a particular problem or issue. It is named for its shape, which looks like a fish skeleton with the problem or effect as the head and the various causes as the bones. This template includes a variety of different fishbone diagrams, which are representations of fish skeletons that help show you the different causes of a problem. This template is easy to use and you can add your own information to make it look just how you want, and show how different causes are connected.


22 diapositivas
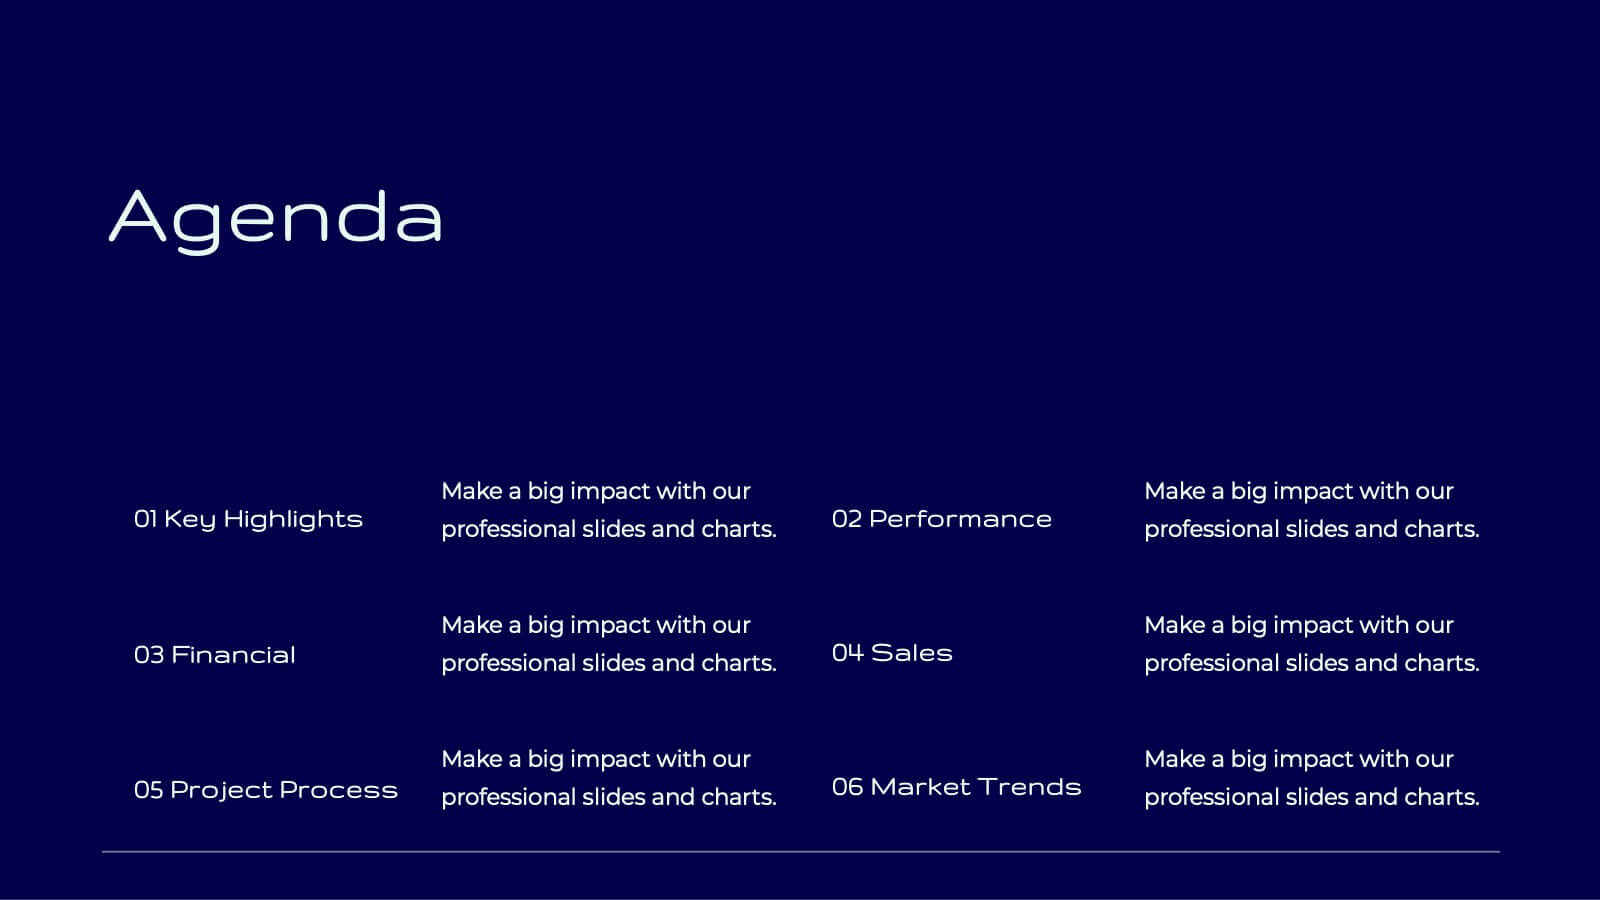
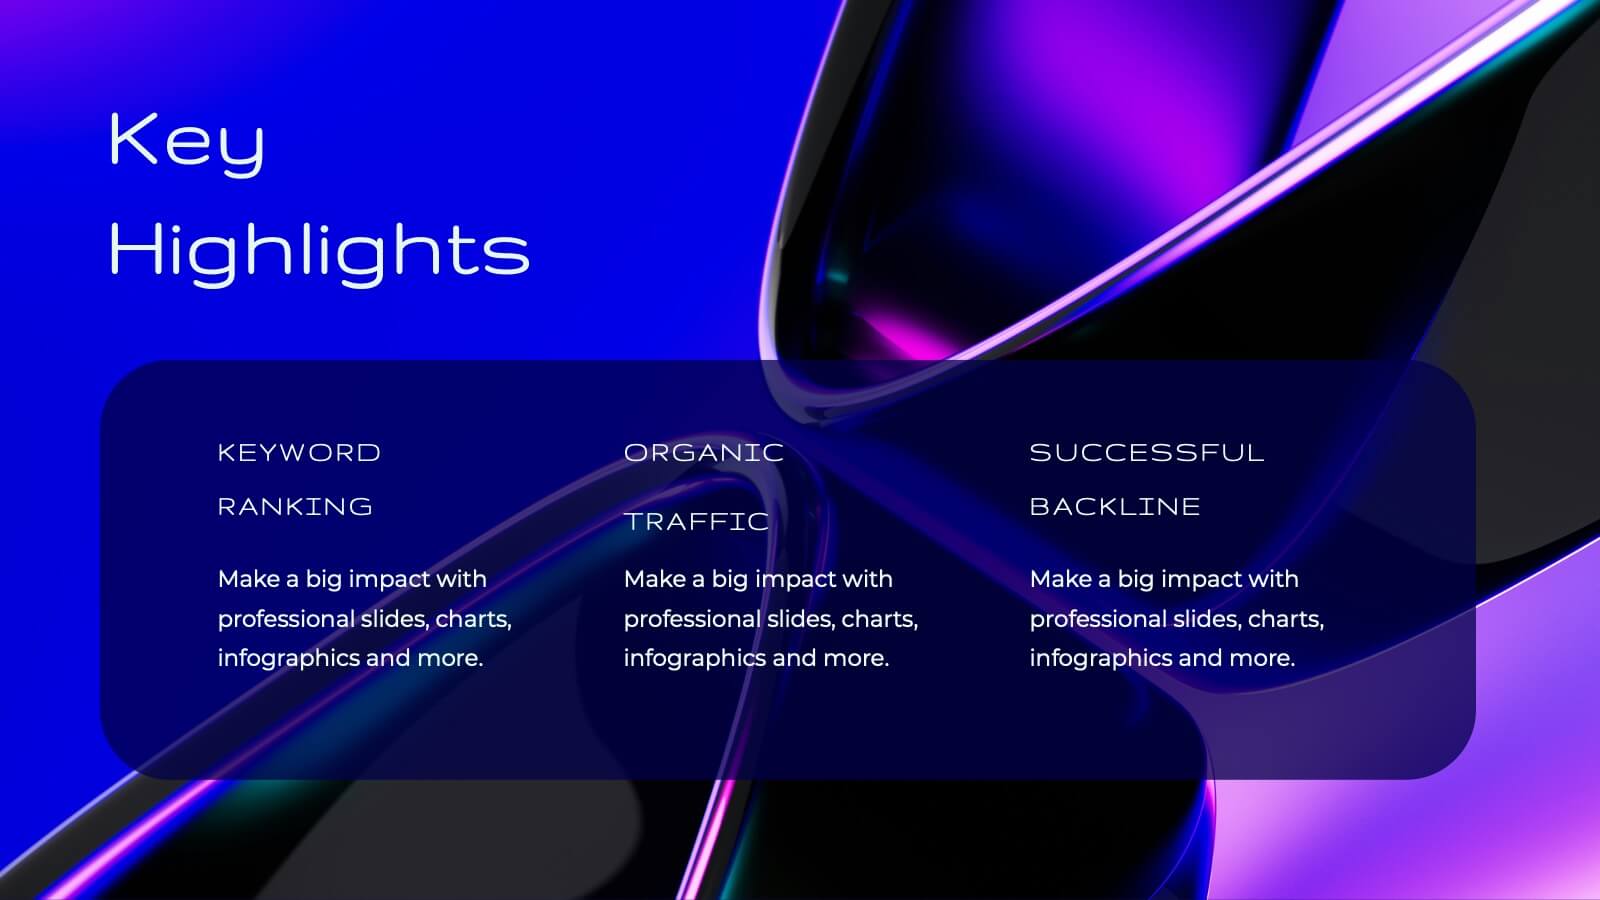
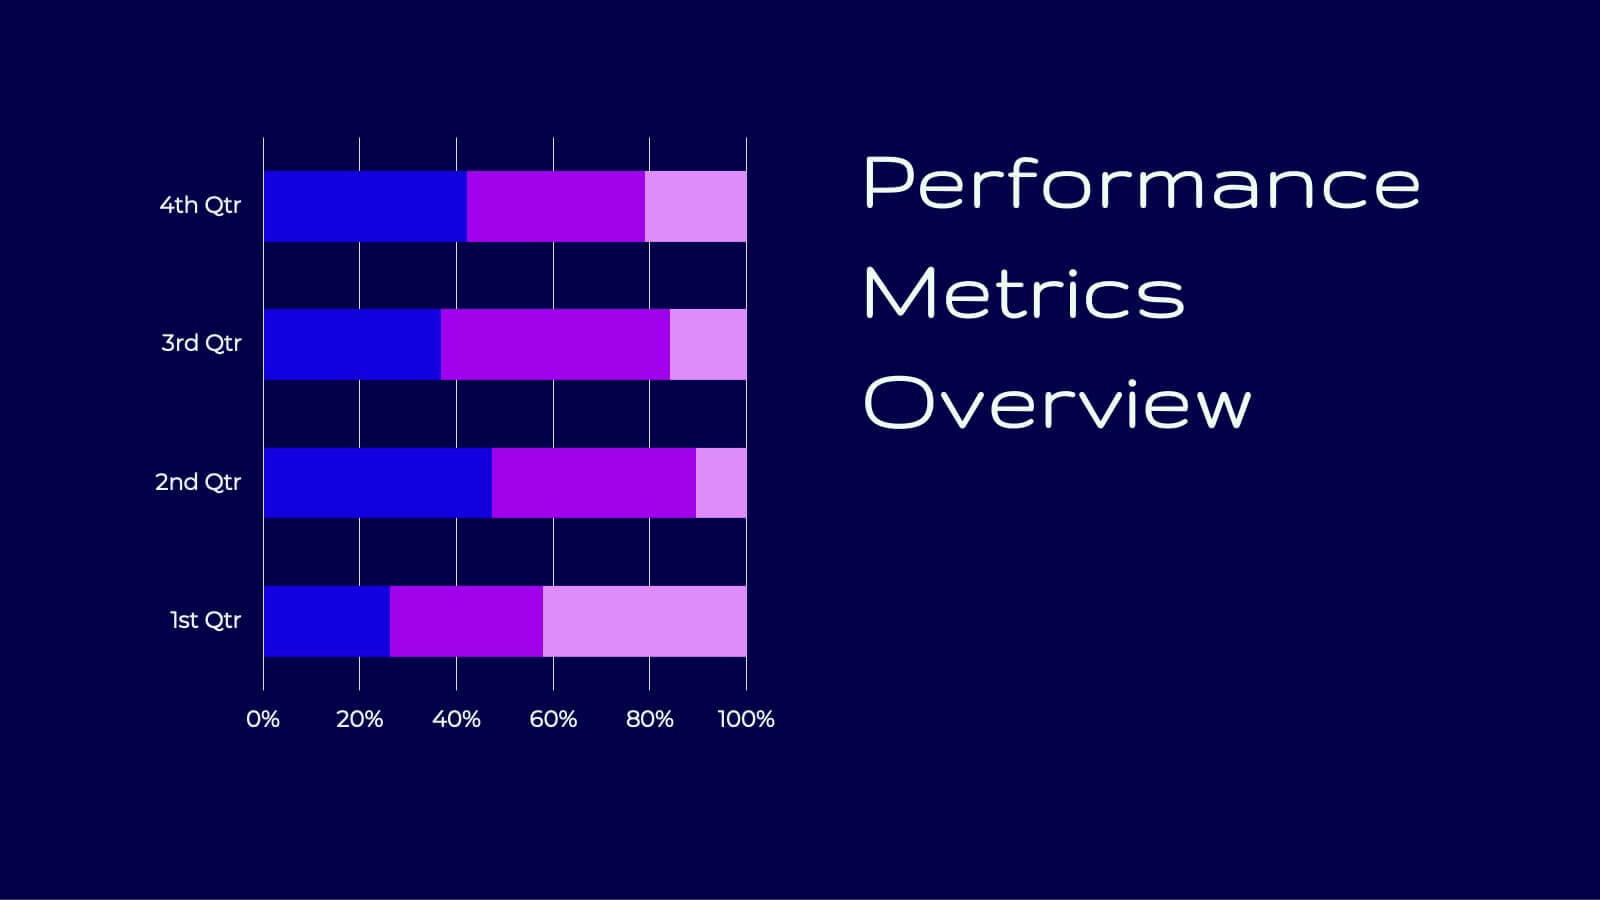
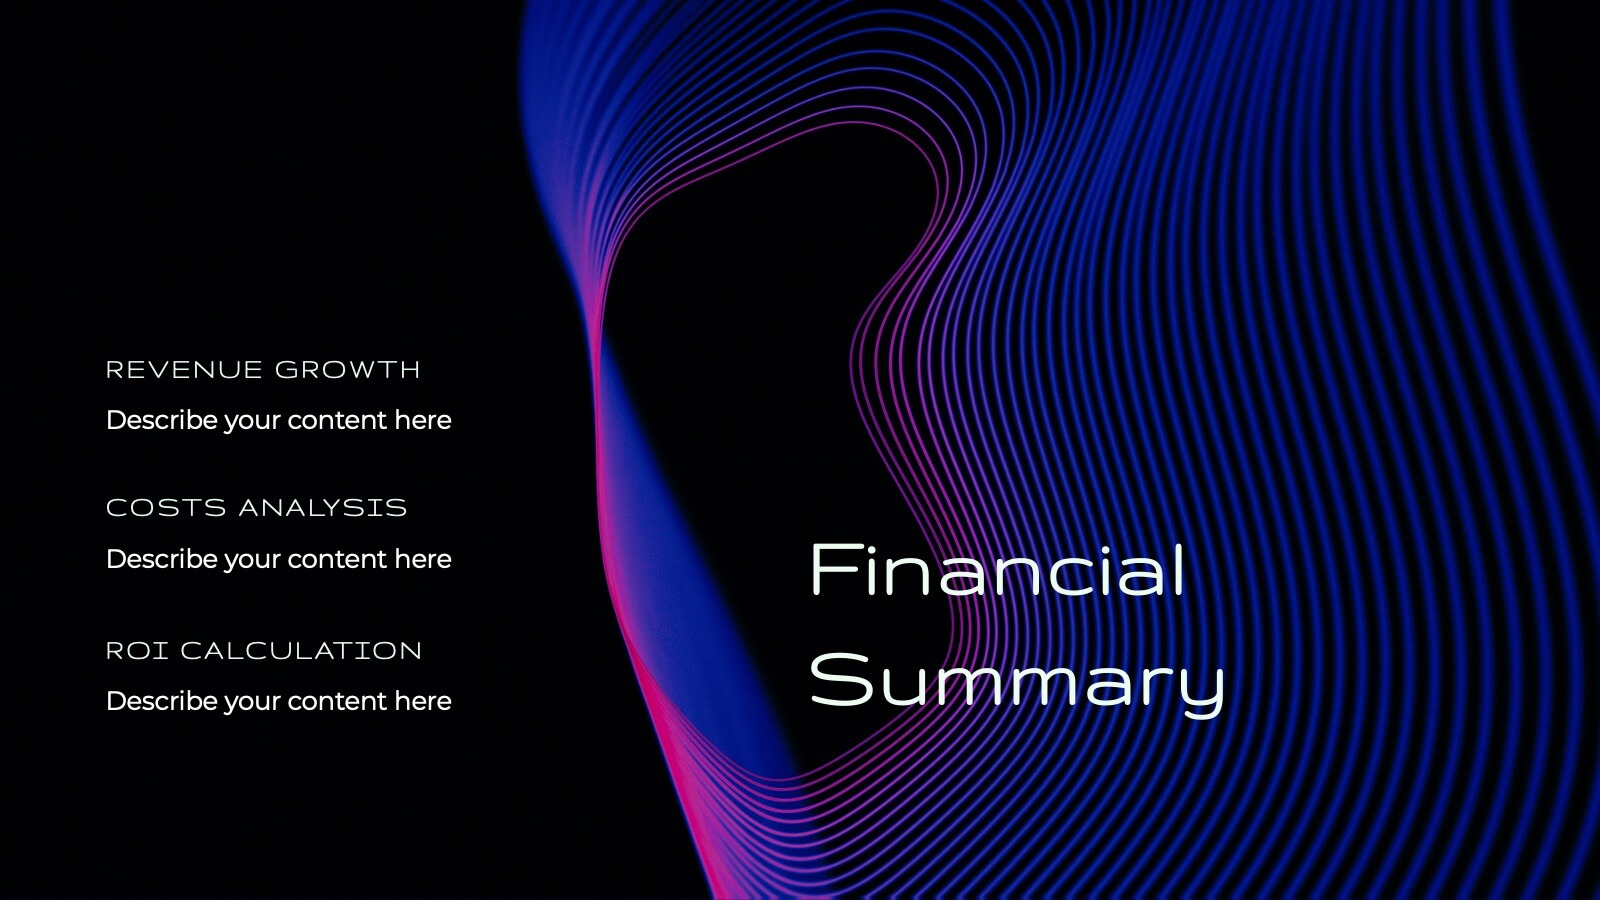
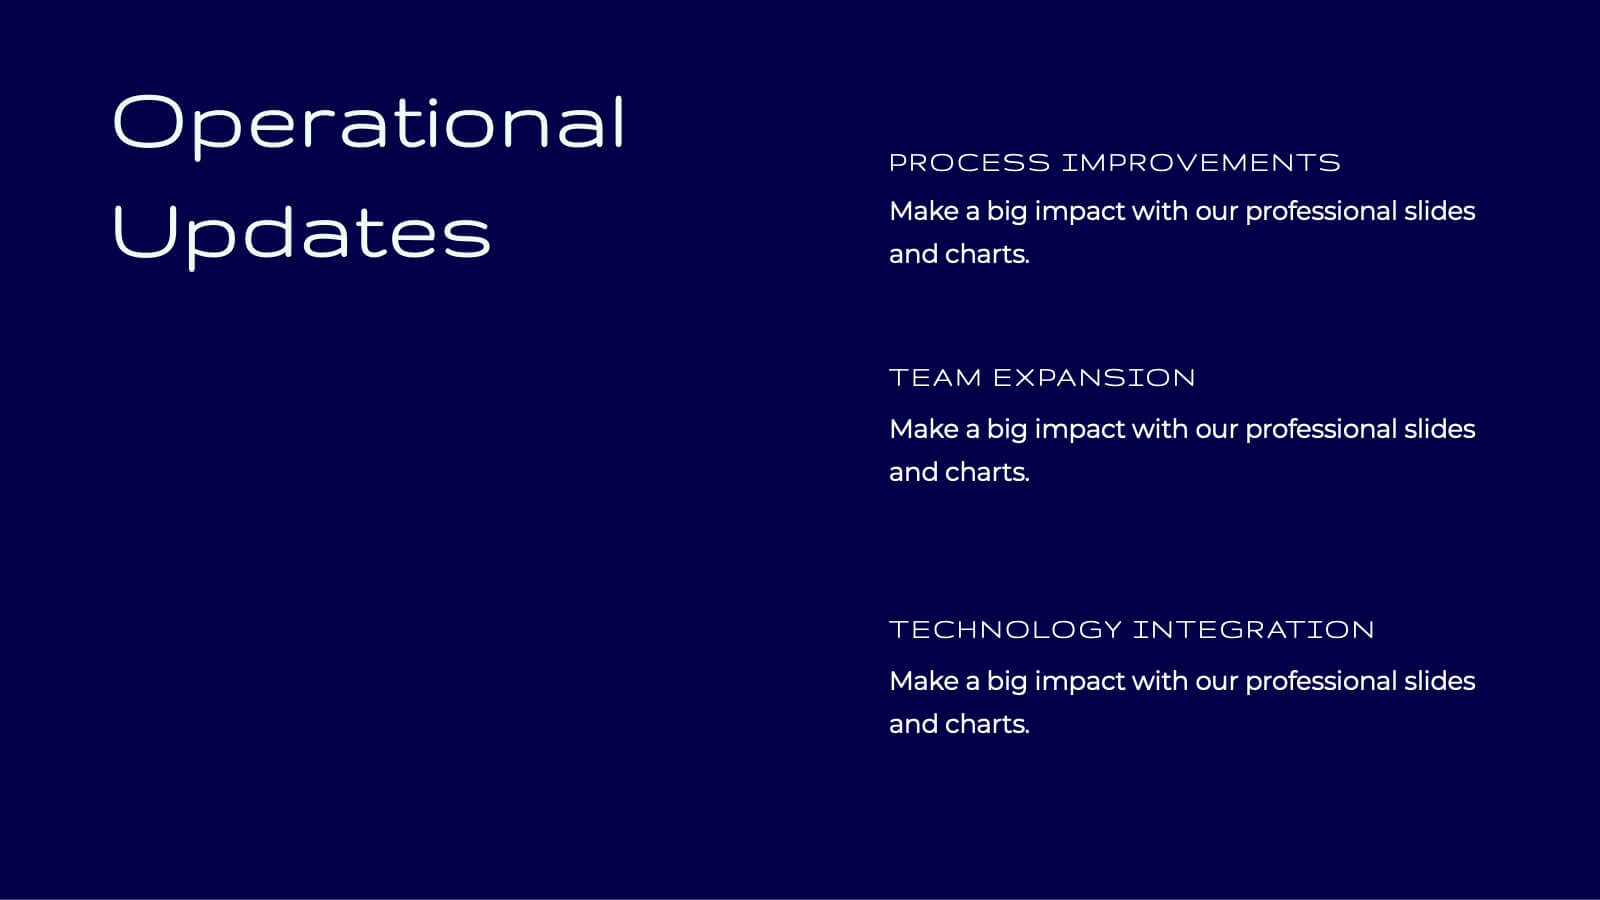
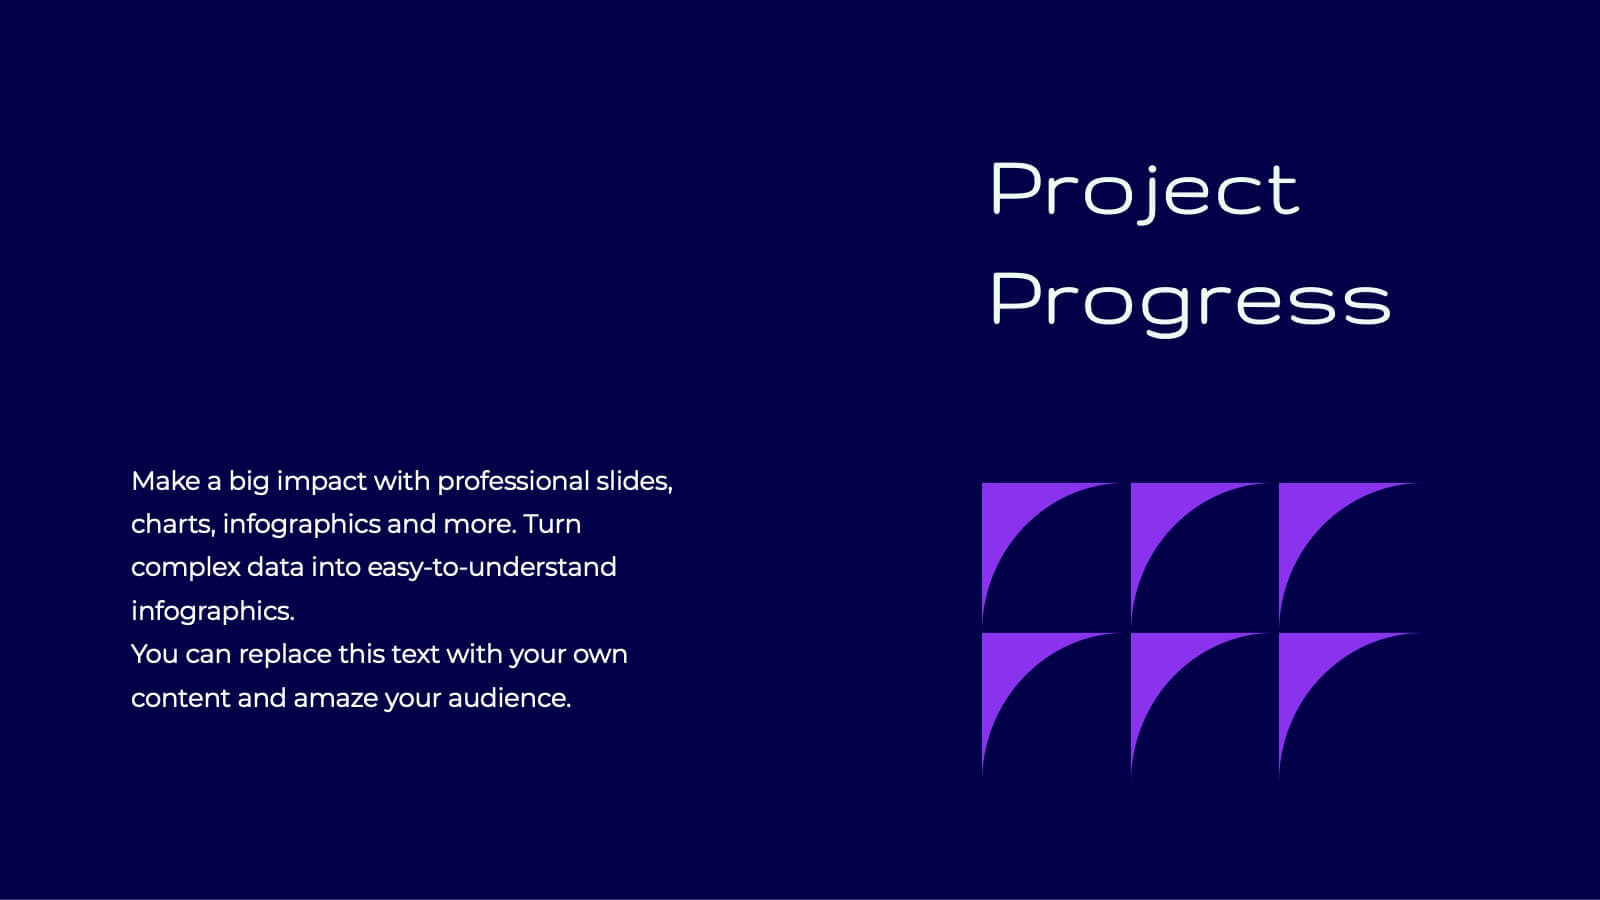
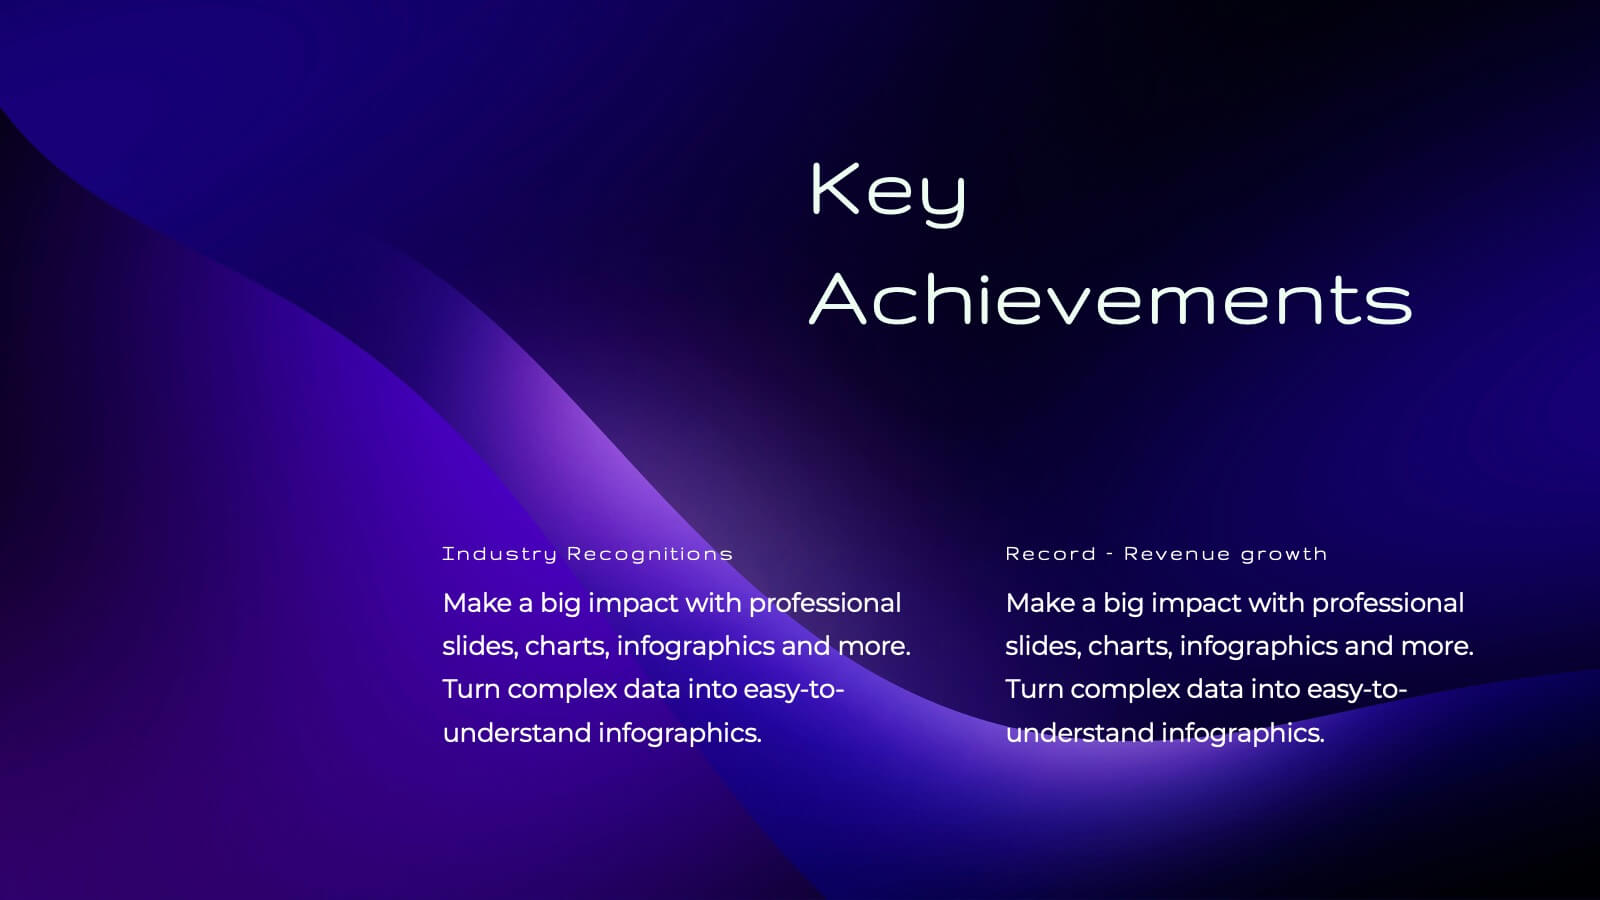
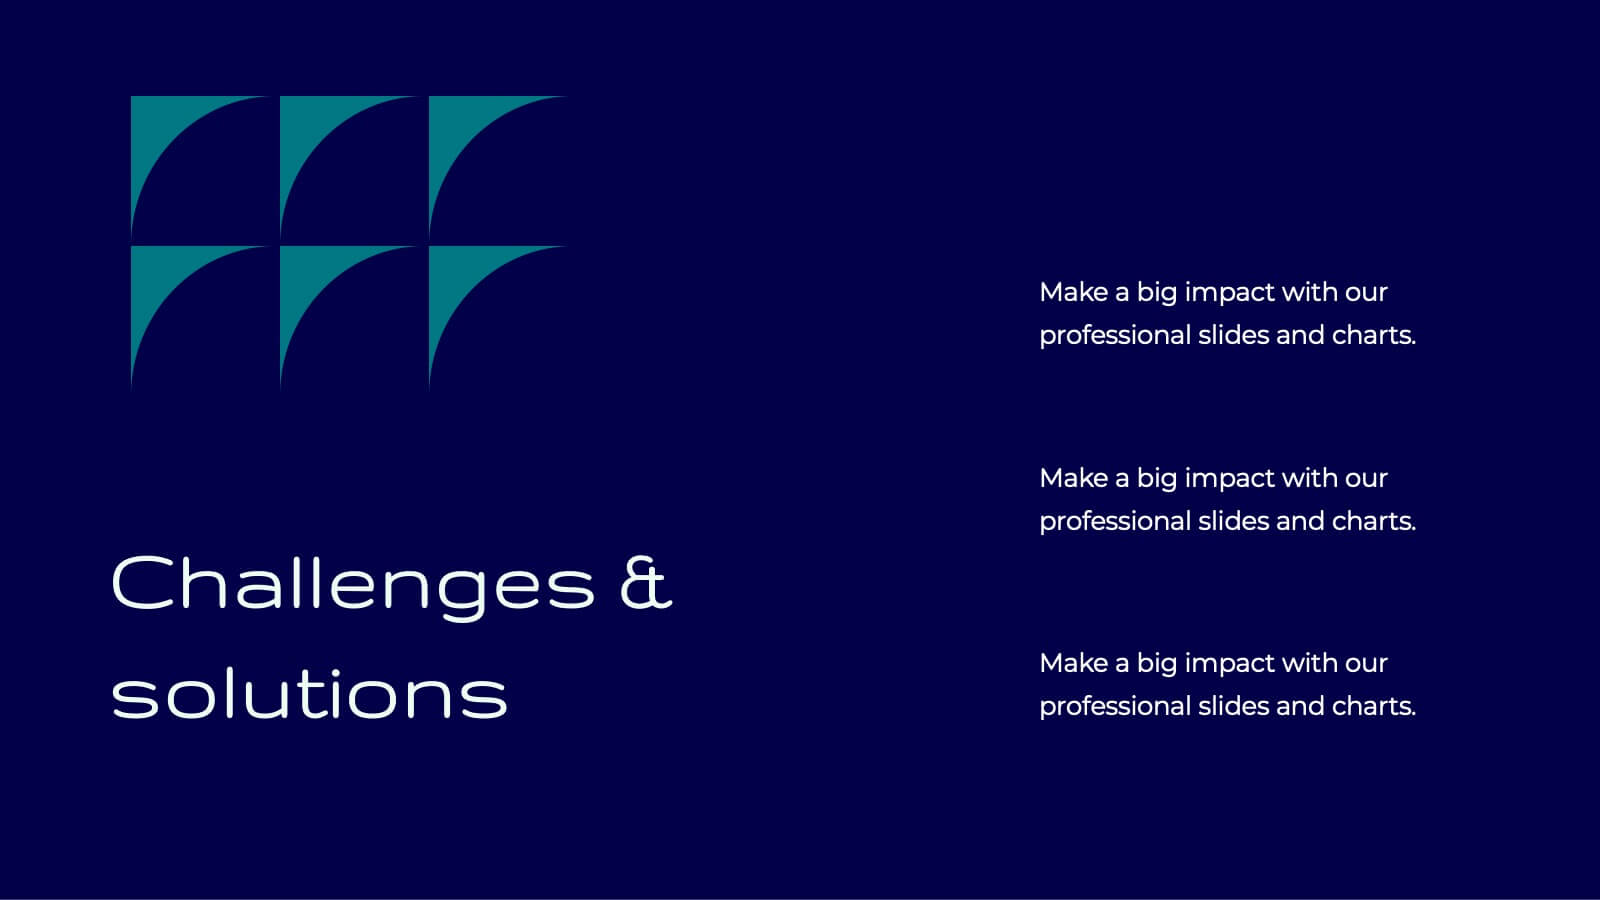
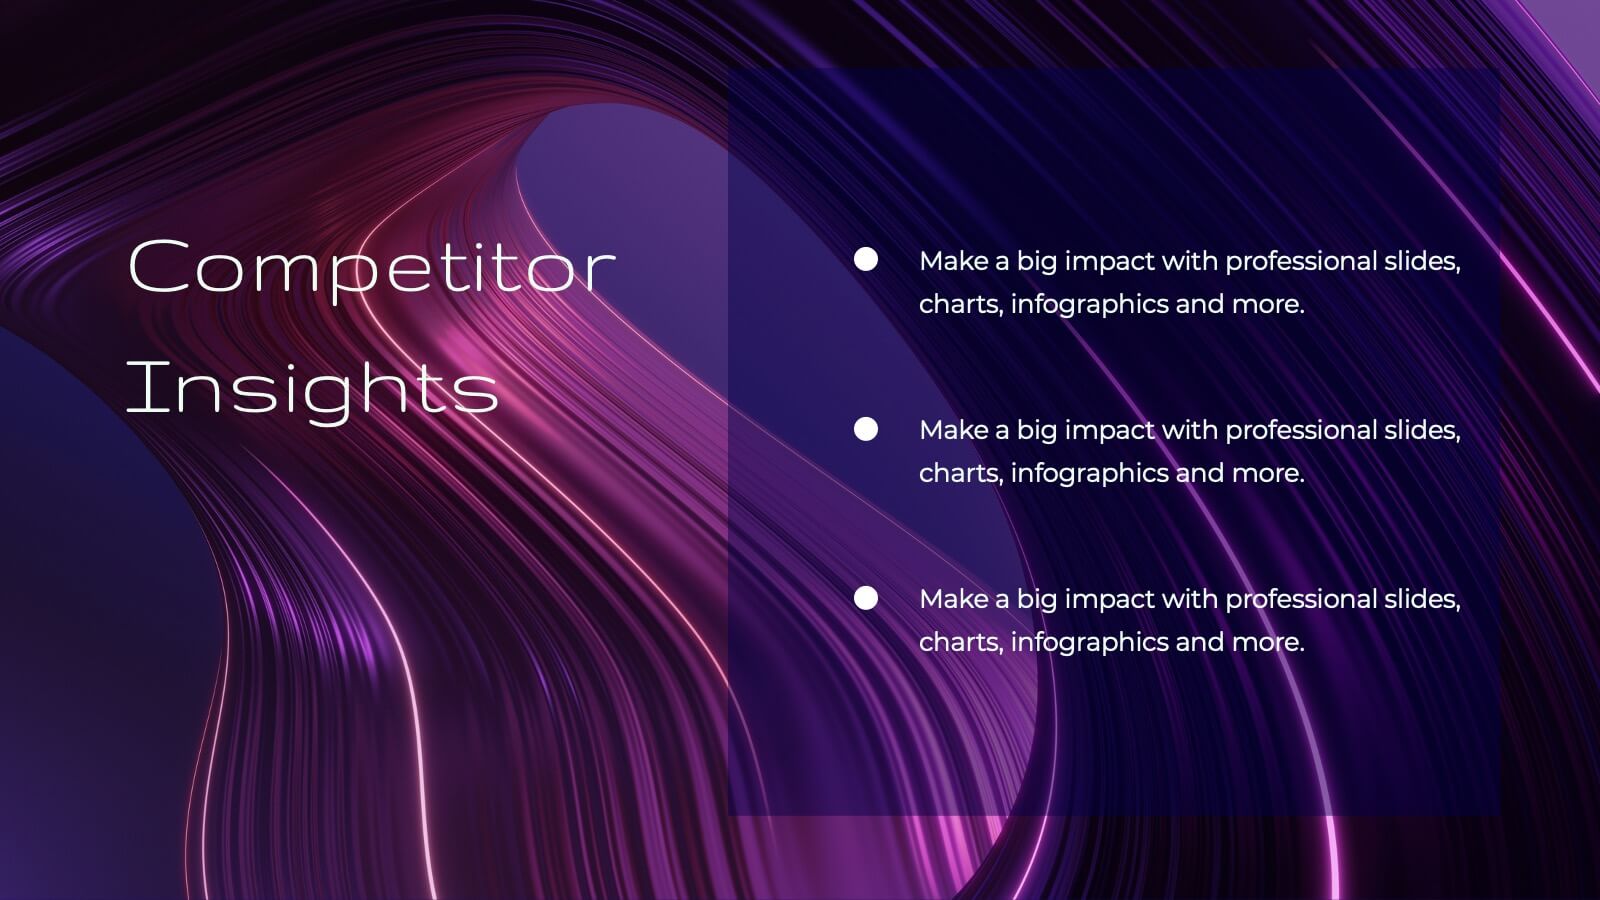
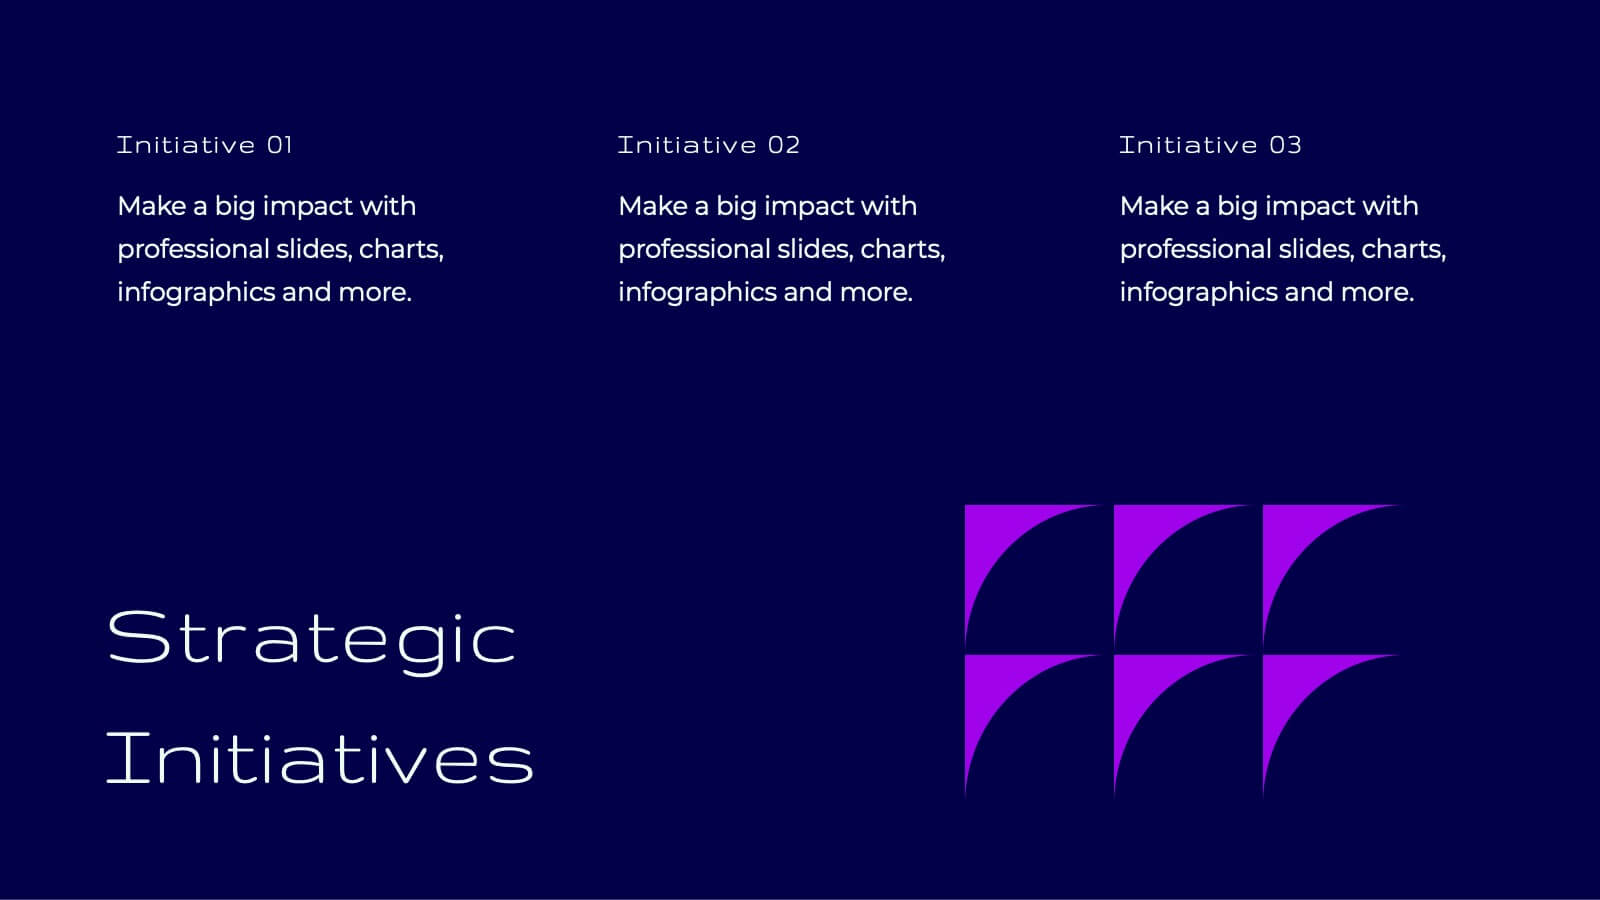
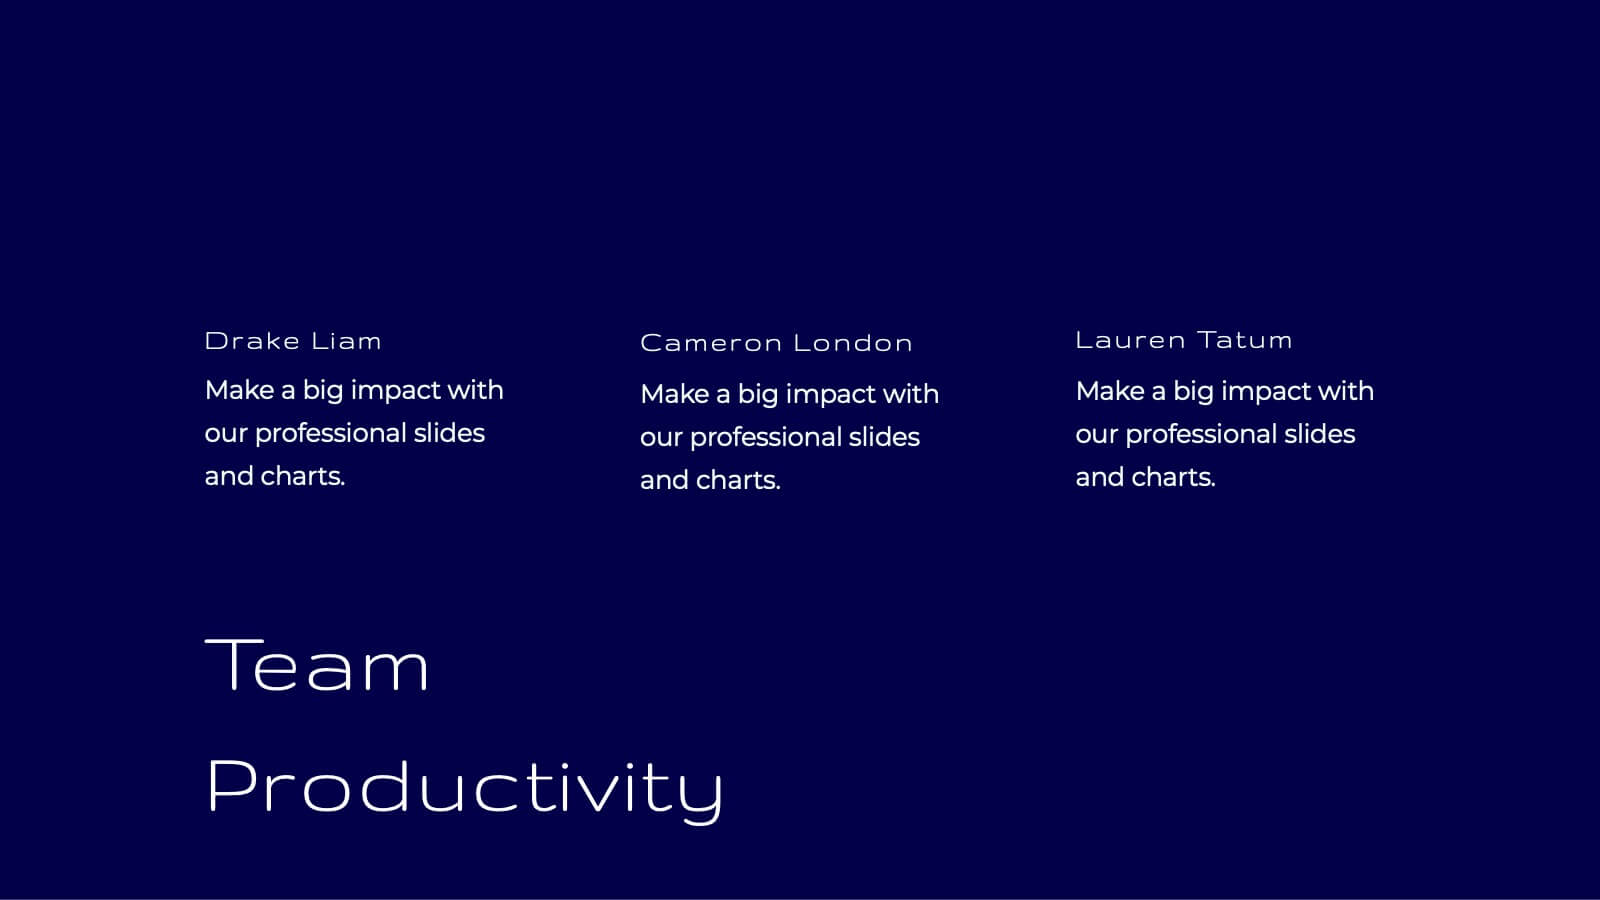
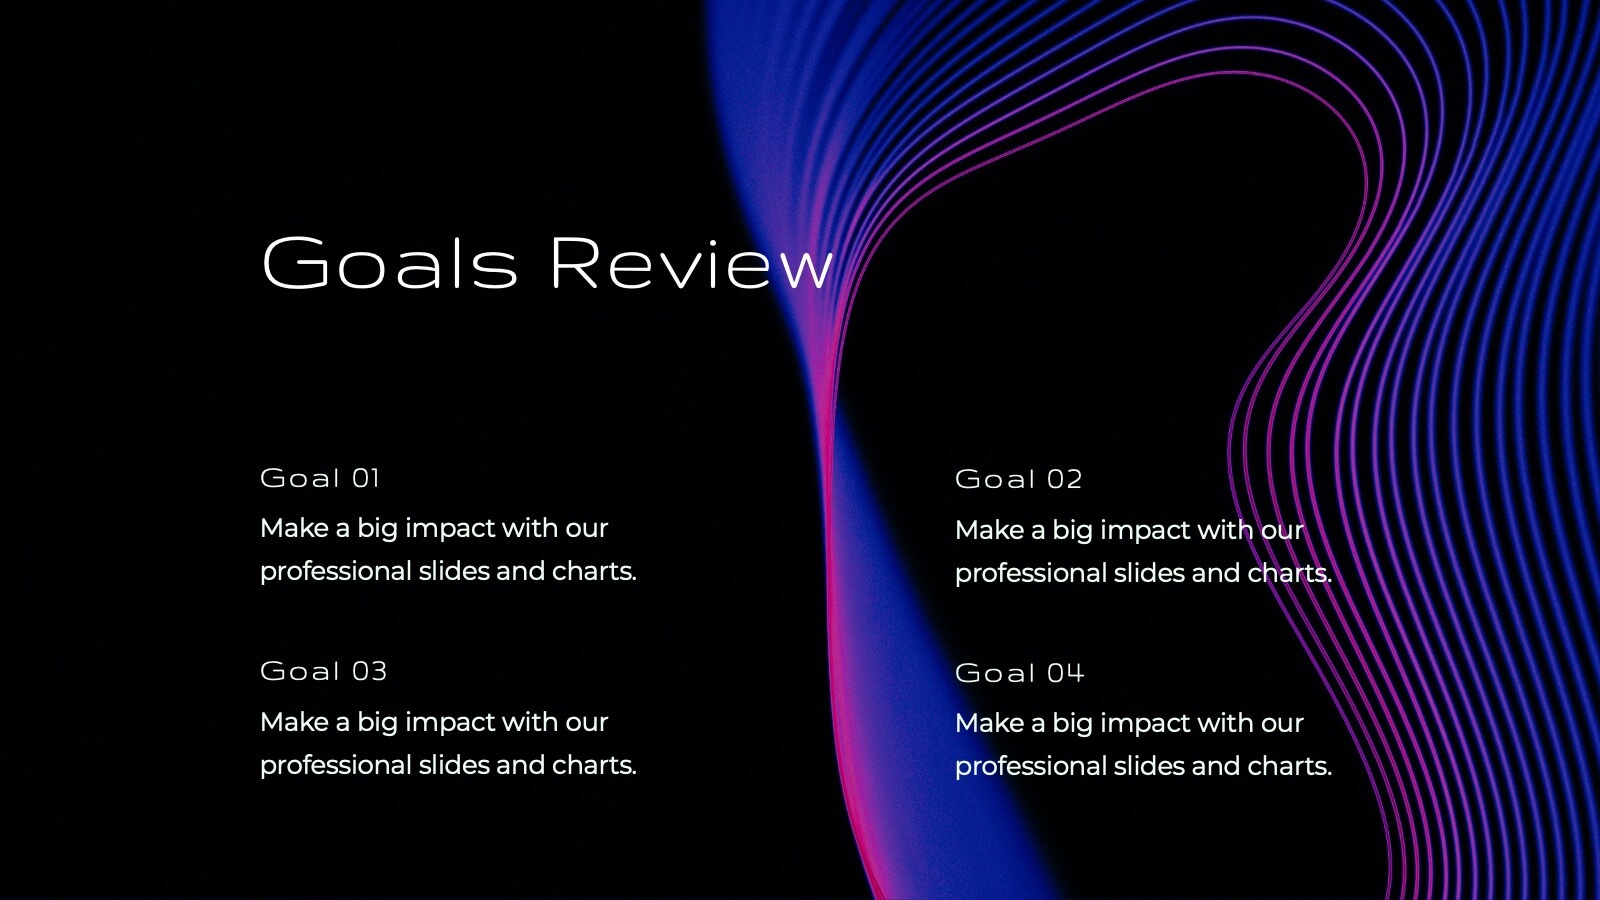
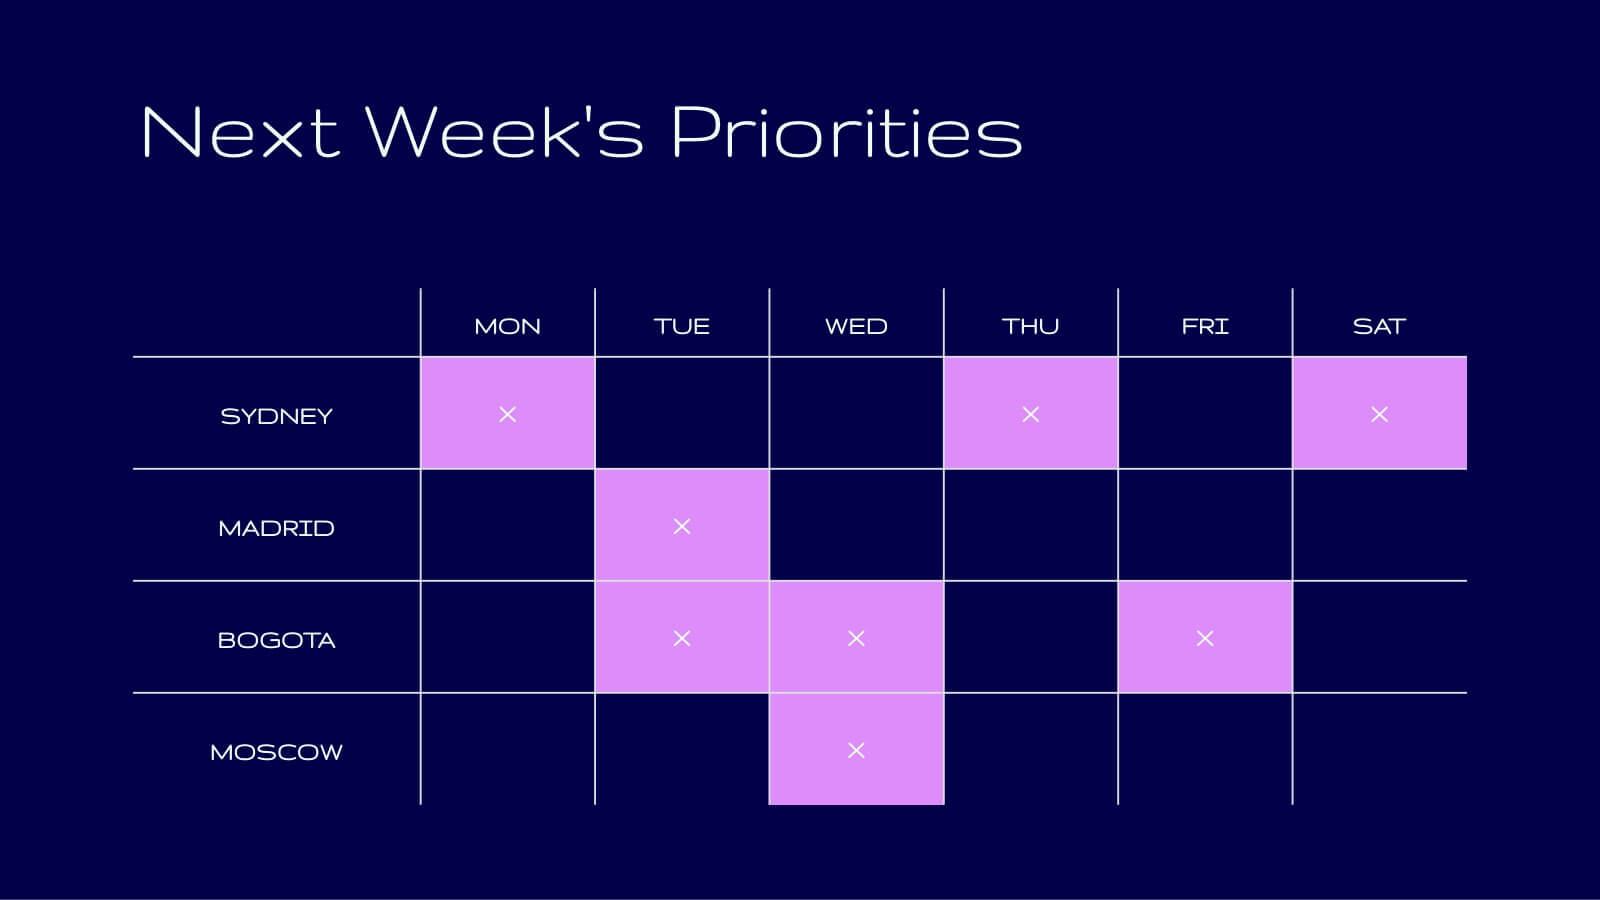
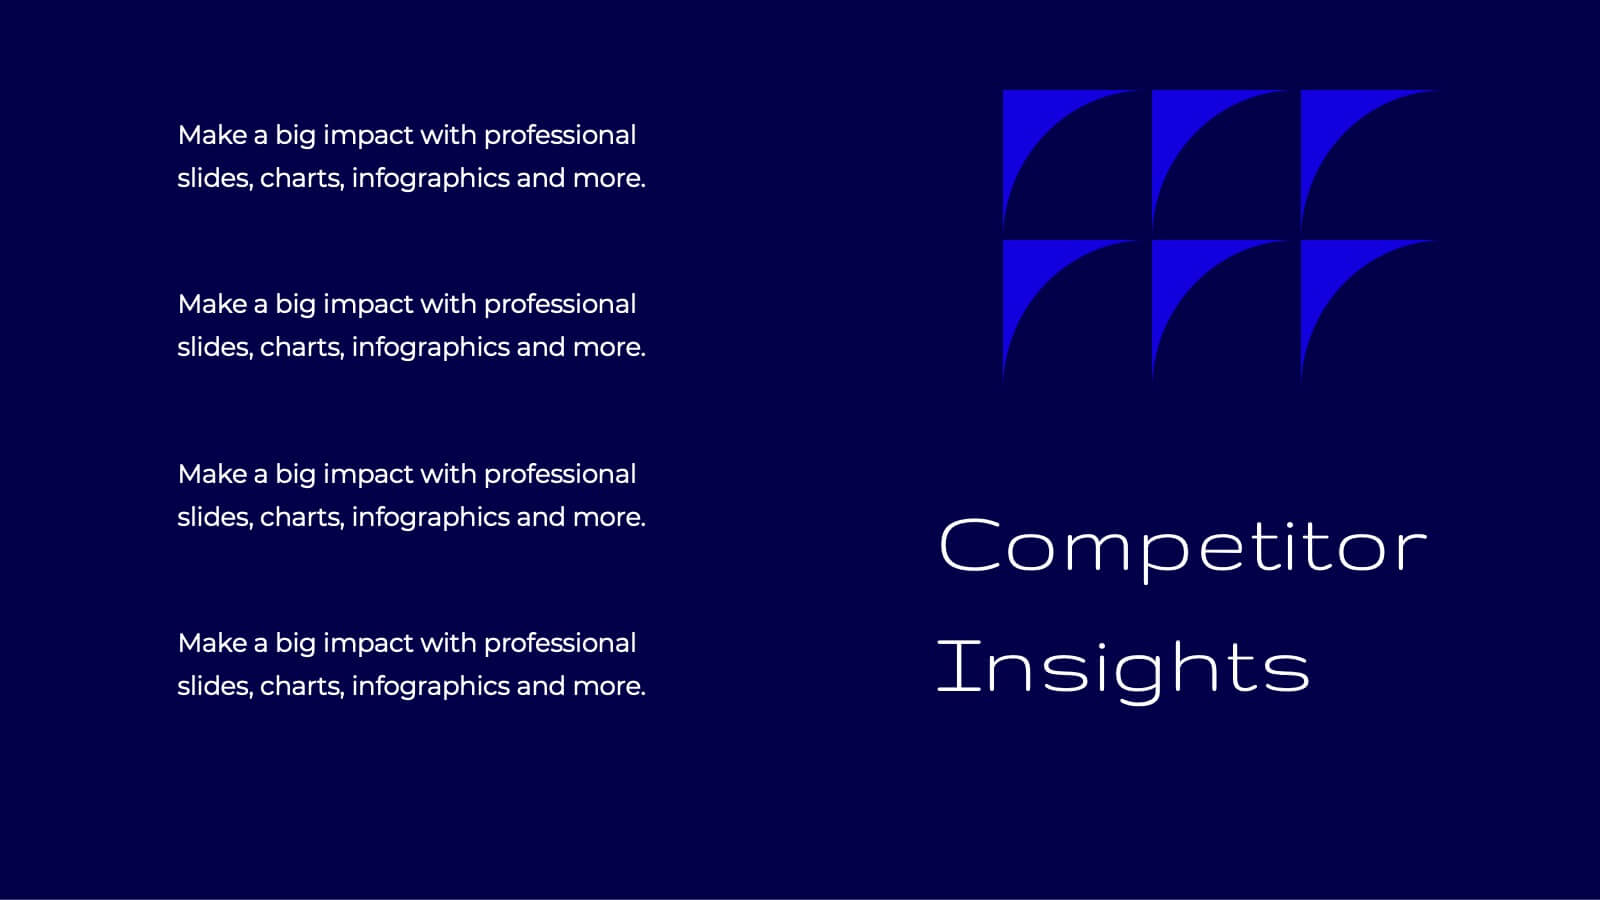
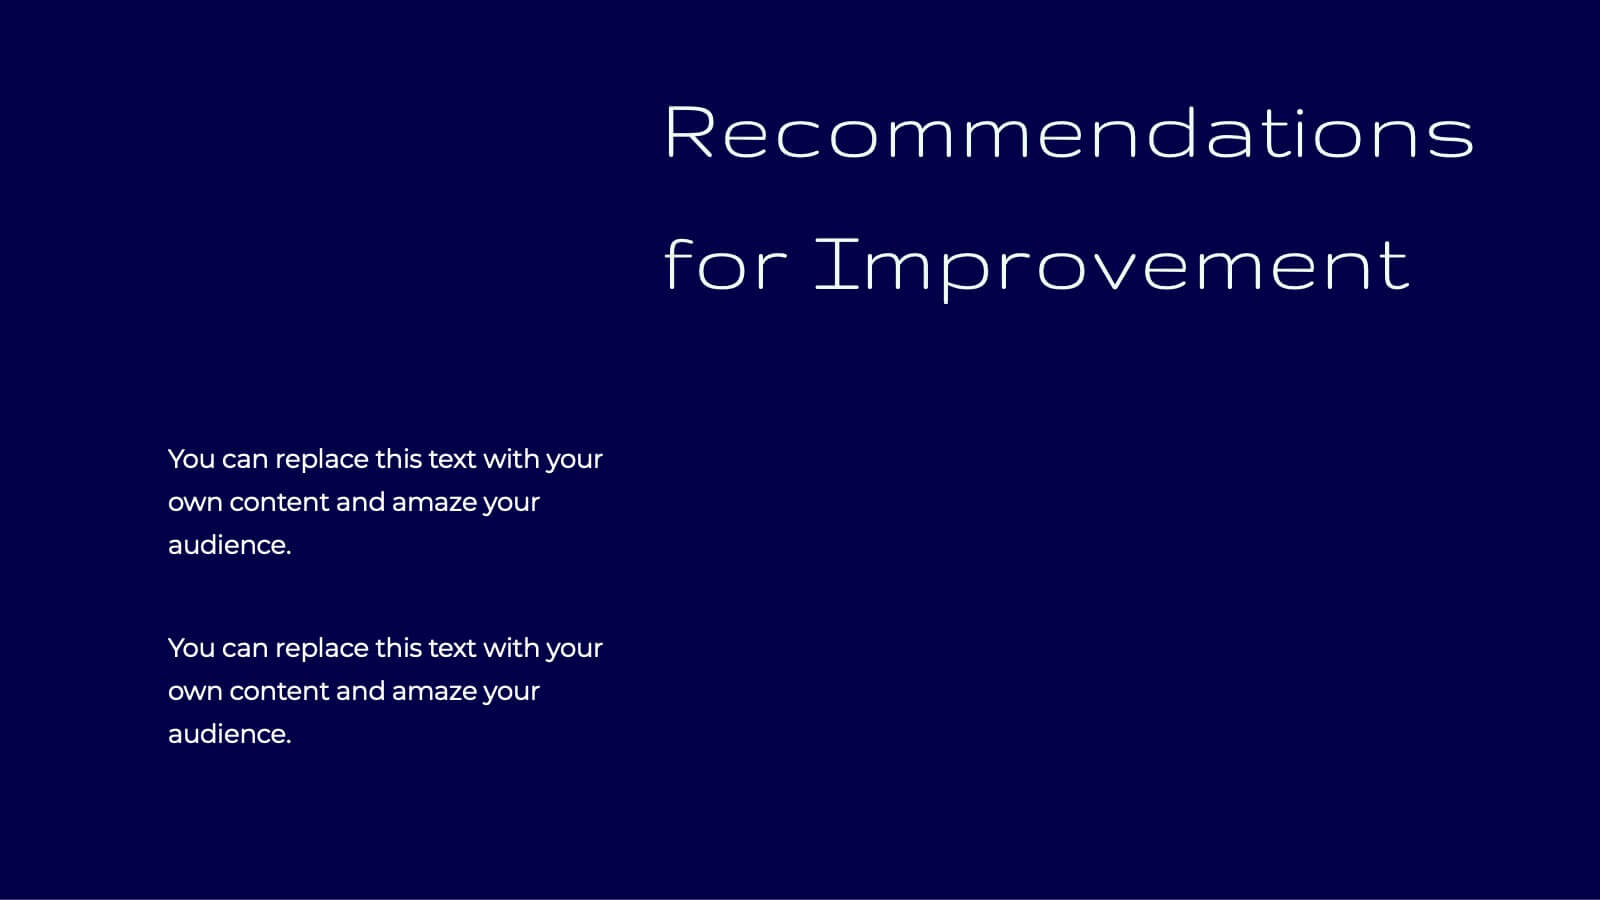
Tidal Research Findings Report Presentation
Deliver your research findings with impact using this sleek and modern report template! It covers key highlights, performance metrics, project progress, and competitor insights, making it ideal for clear, professional presentations. Perfect for summarizing challenges, solutions, and strategic initiatives. Compatible with PowerPoint, Keynote, and Google Slides for seamless reporting.


7 diapositivas
Hierarchy Infographic Presentation Template
This Hierarchy infographic template presents information in a hierarchical format and makes it easy to see the most important pieces of information without having to read through all of your content. Use this template as a starting point to create an effective hierarchy chart by copying and pasting the template into PowerPoint. It features an assortment of color schemes and styles that can be customized. Our hierarchy infographic template will help you build an amazing presentation. This isn't just an ordinary Infographic template, it features a design that will stand out in the crowd!


7 diapositivas
Fishbone Analysis Infographic Presentation
A fishbone Infographic is a technique used to brainstorm the cause of a problem. The unique design helps you understand how one thing can lead to another and is effective at helping you create a solution that reviews all aspects. Start this template off using the head of the fish as a prompt and webbing out from there, draw up to six main causal categories and then sub-categories. Use this infographic to organize your ideas and identify key factors, as well as decide how to prioritize them. This template is compatible and completely editable with Powerpoint, keynote and google slides.