


Características


¿Tienes alguna pregunta?
Recomendar

23 diapositivas
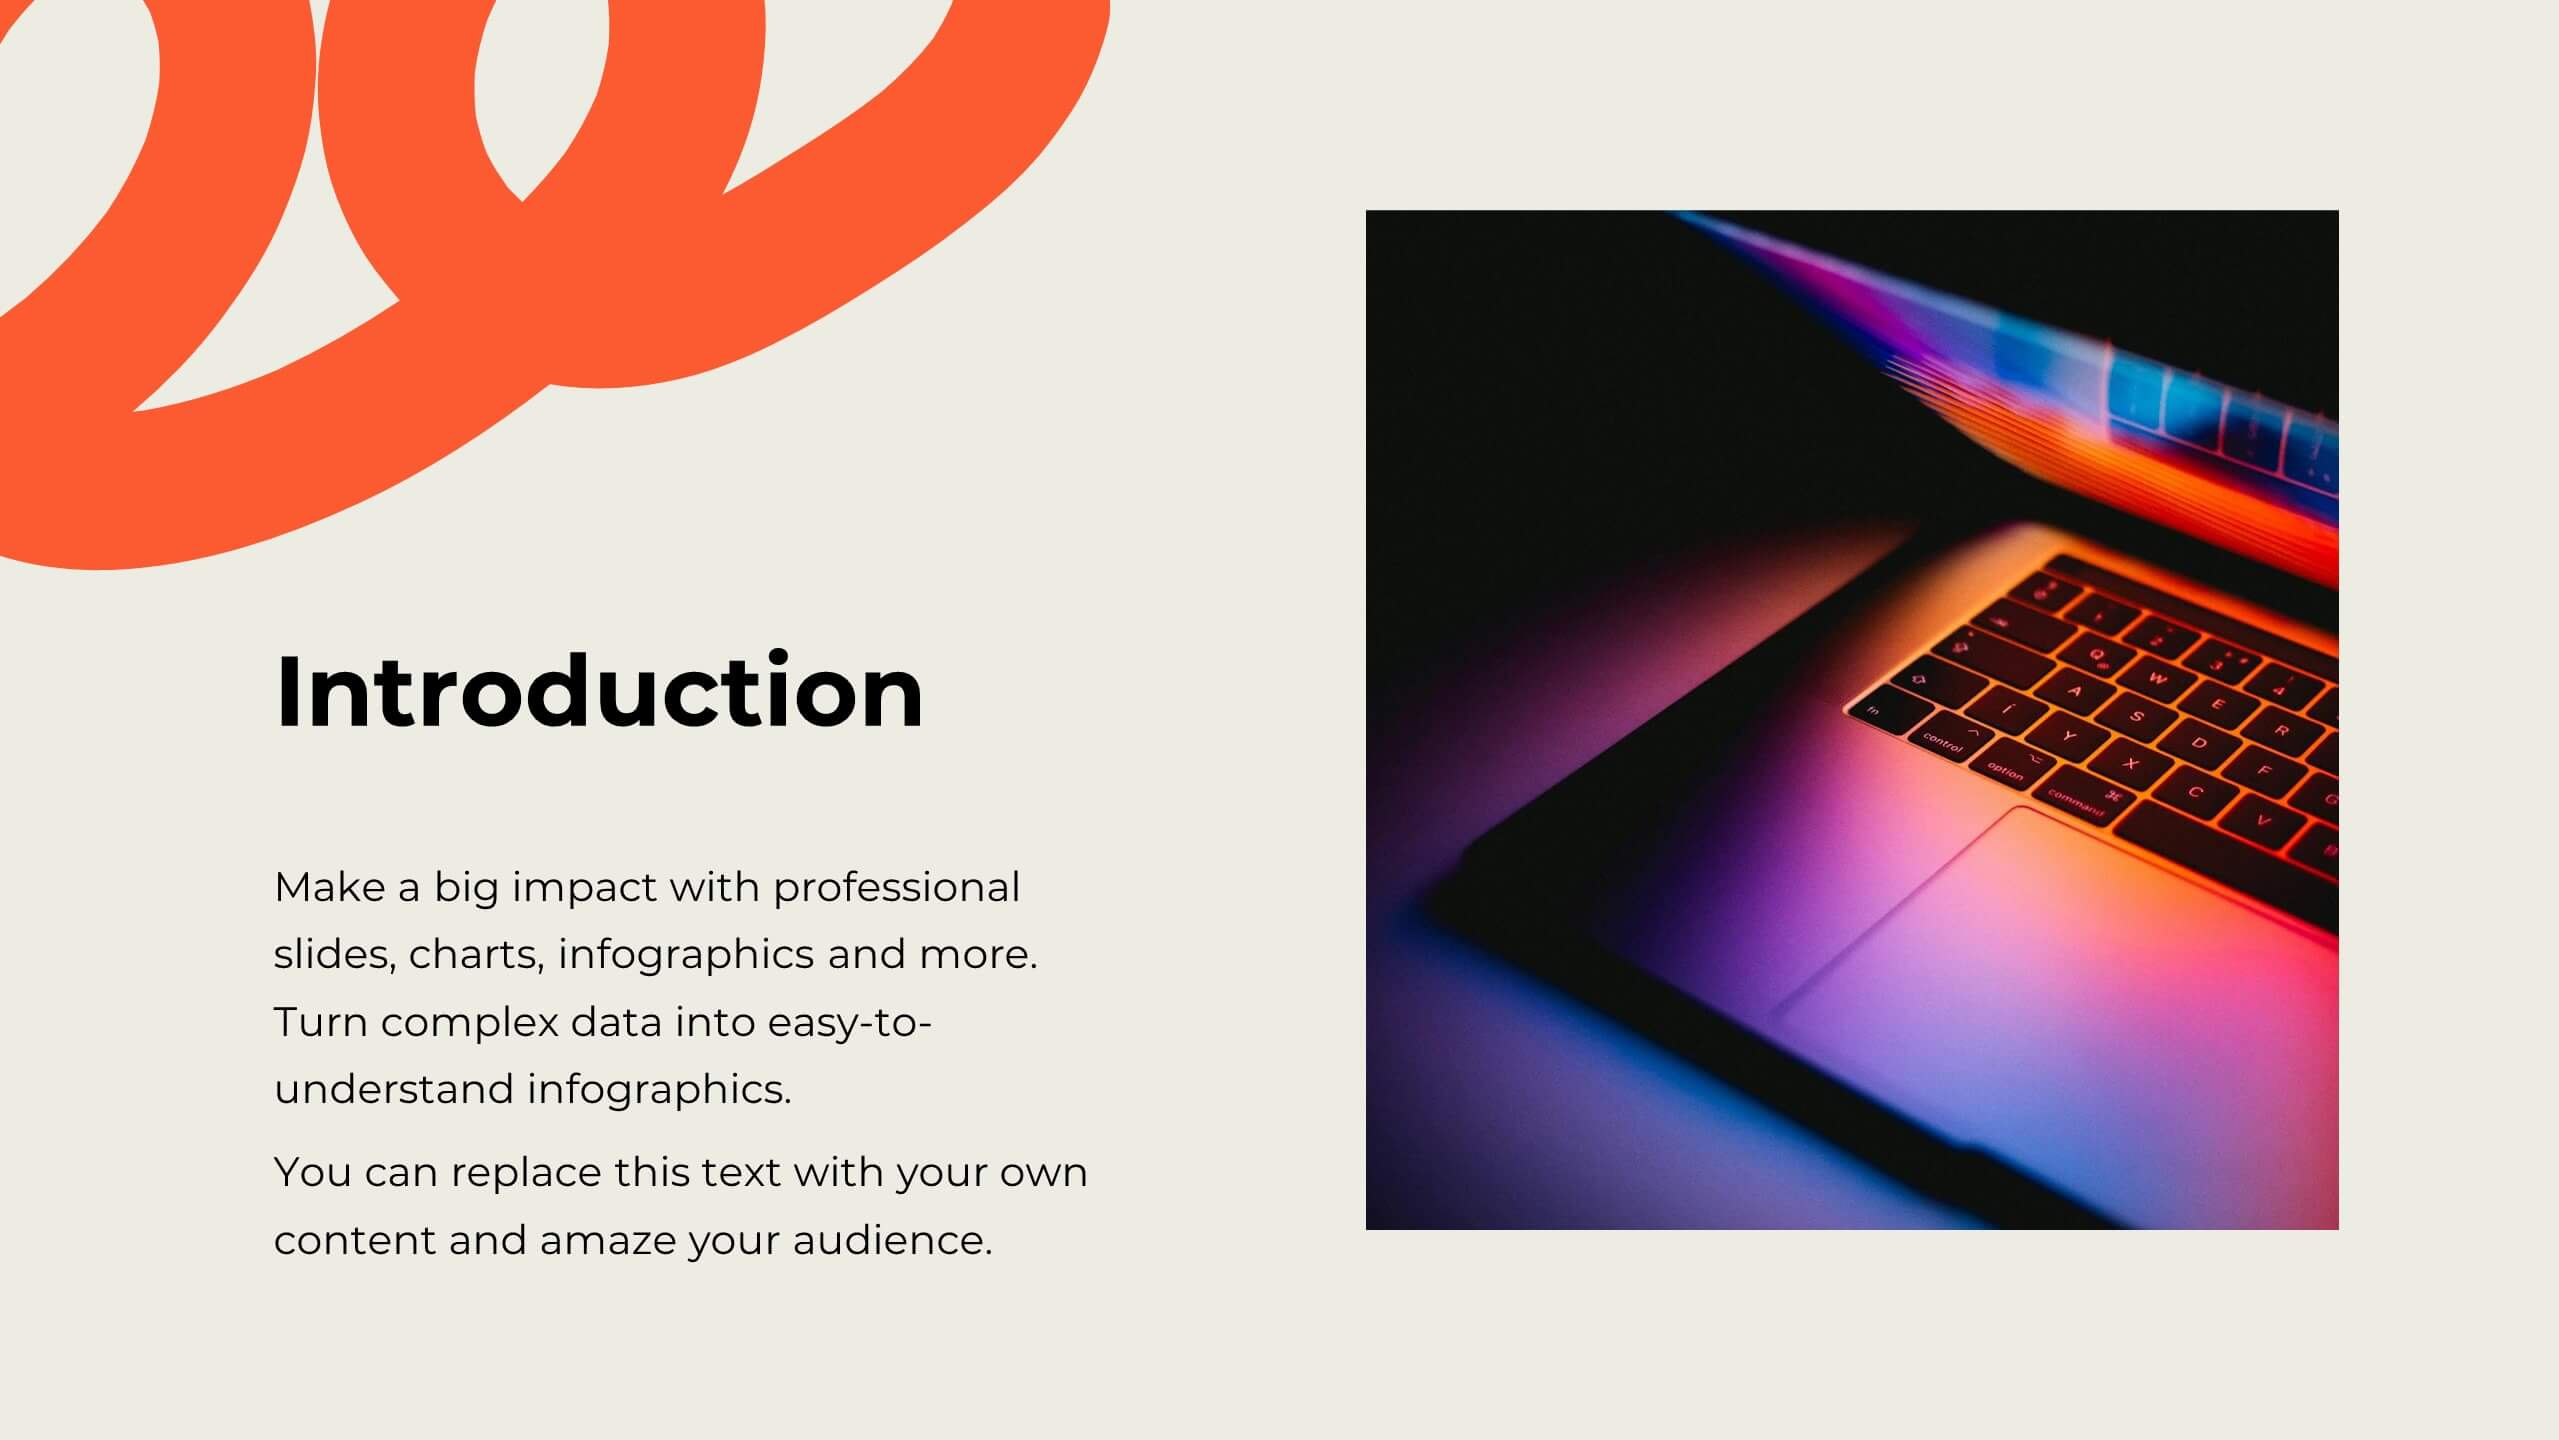
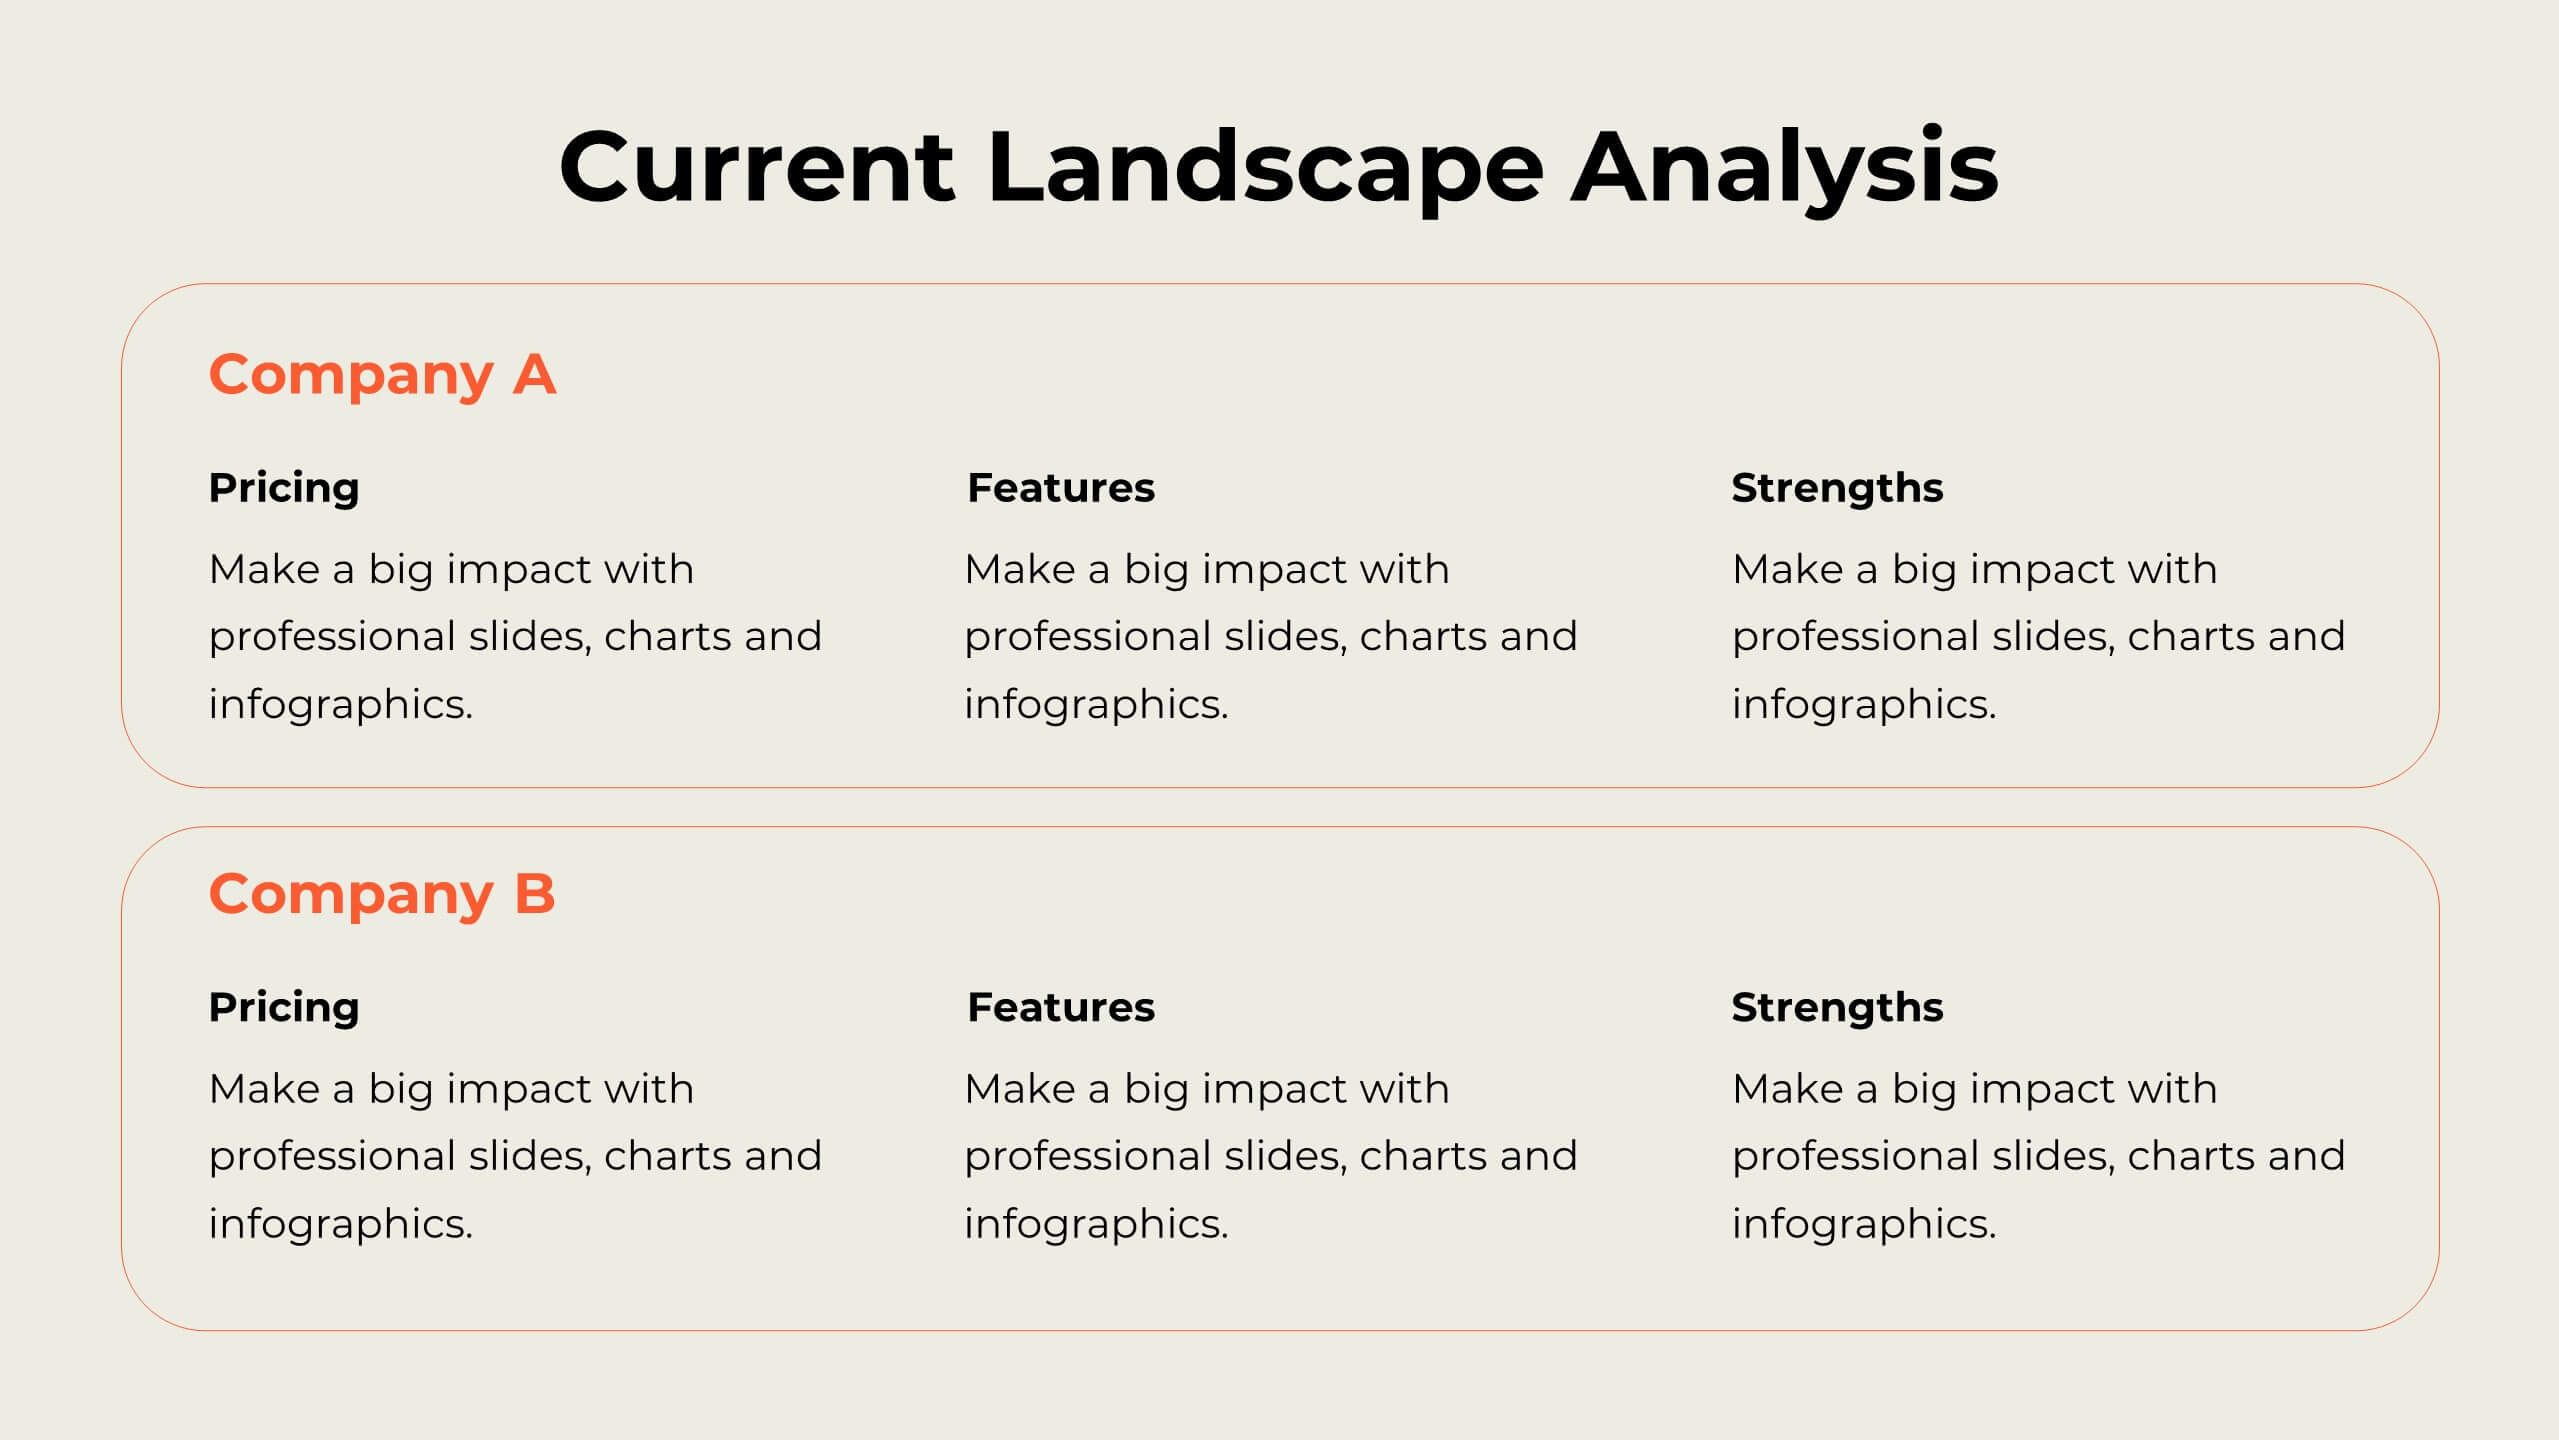
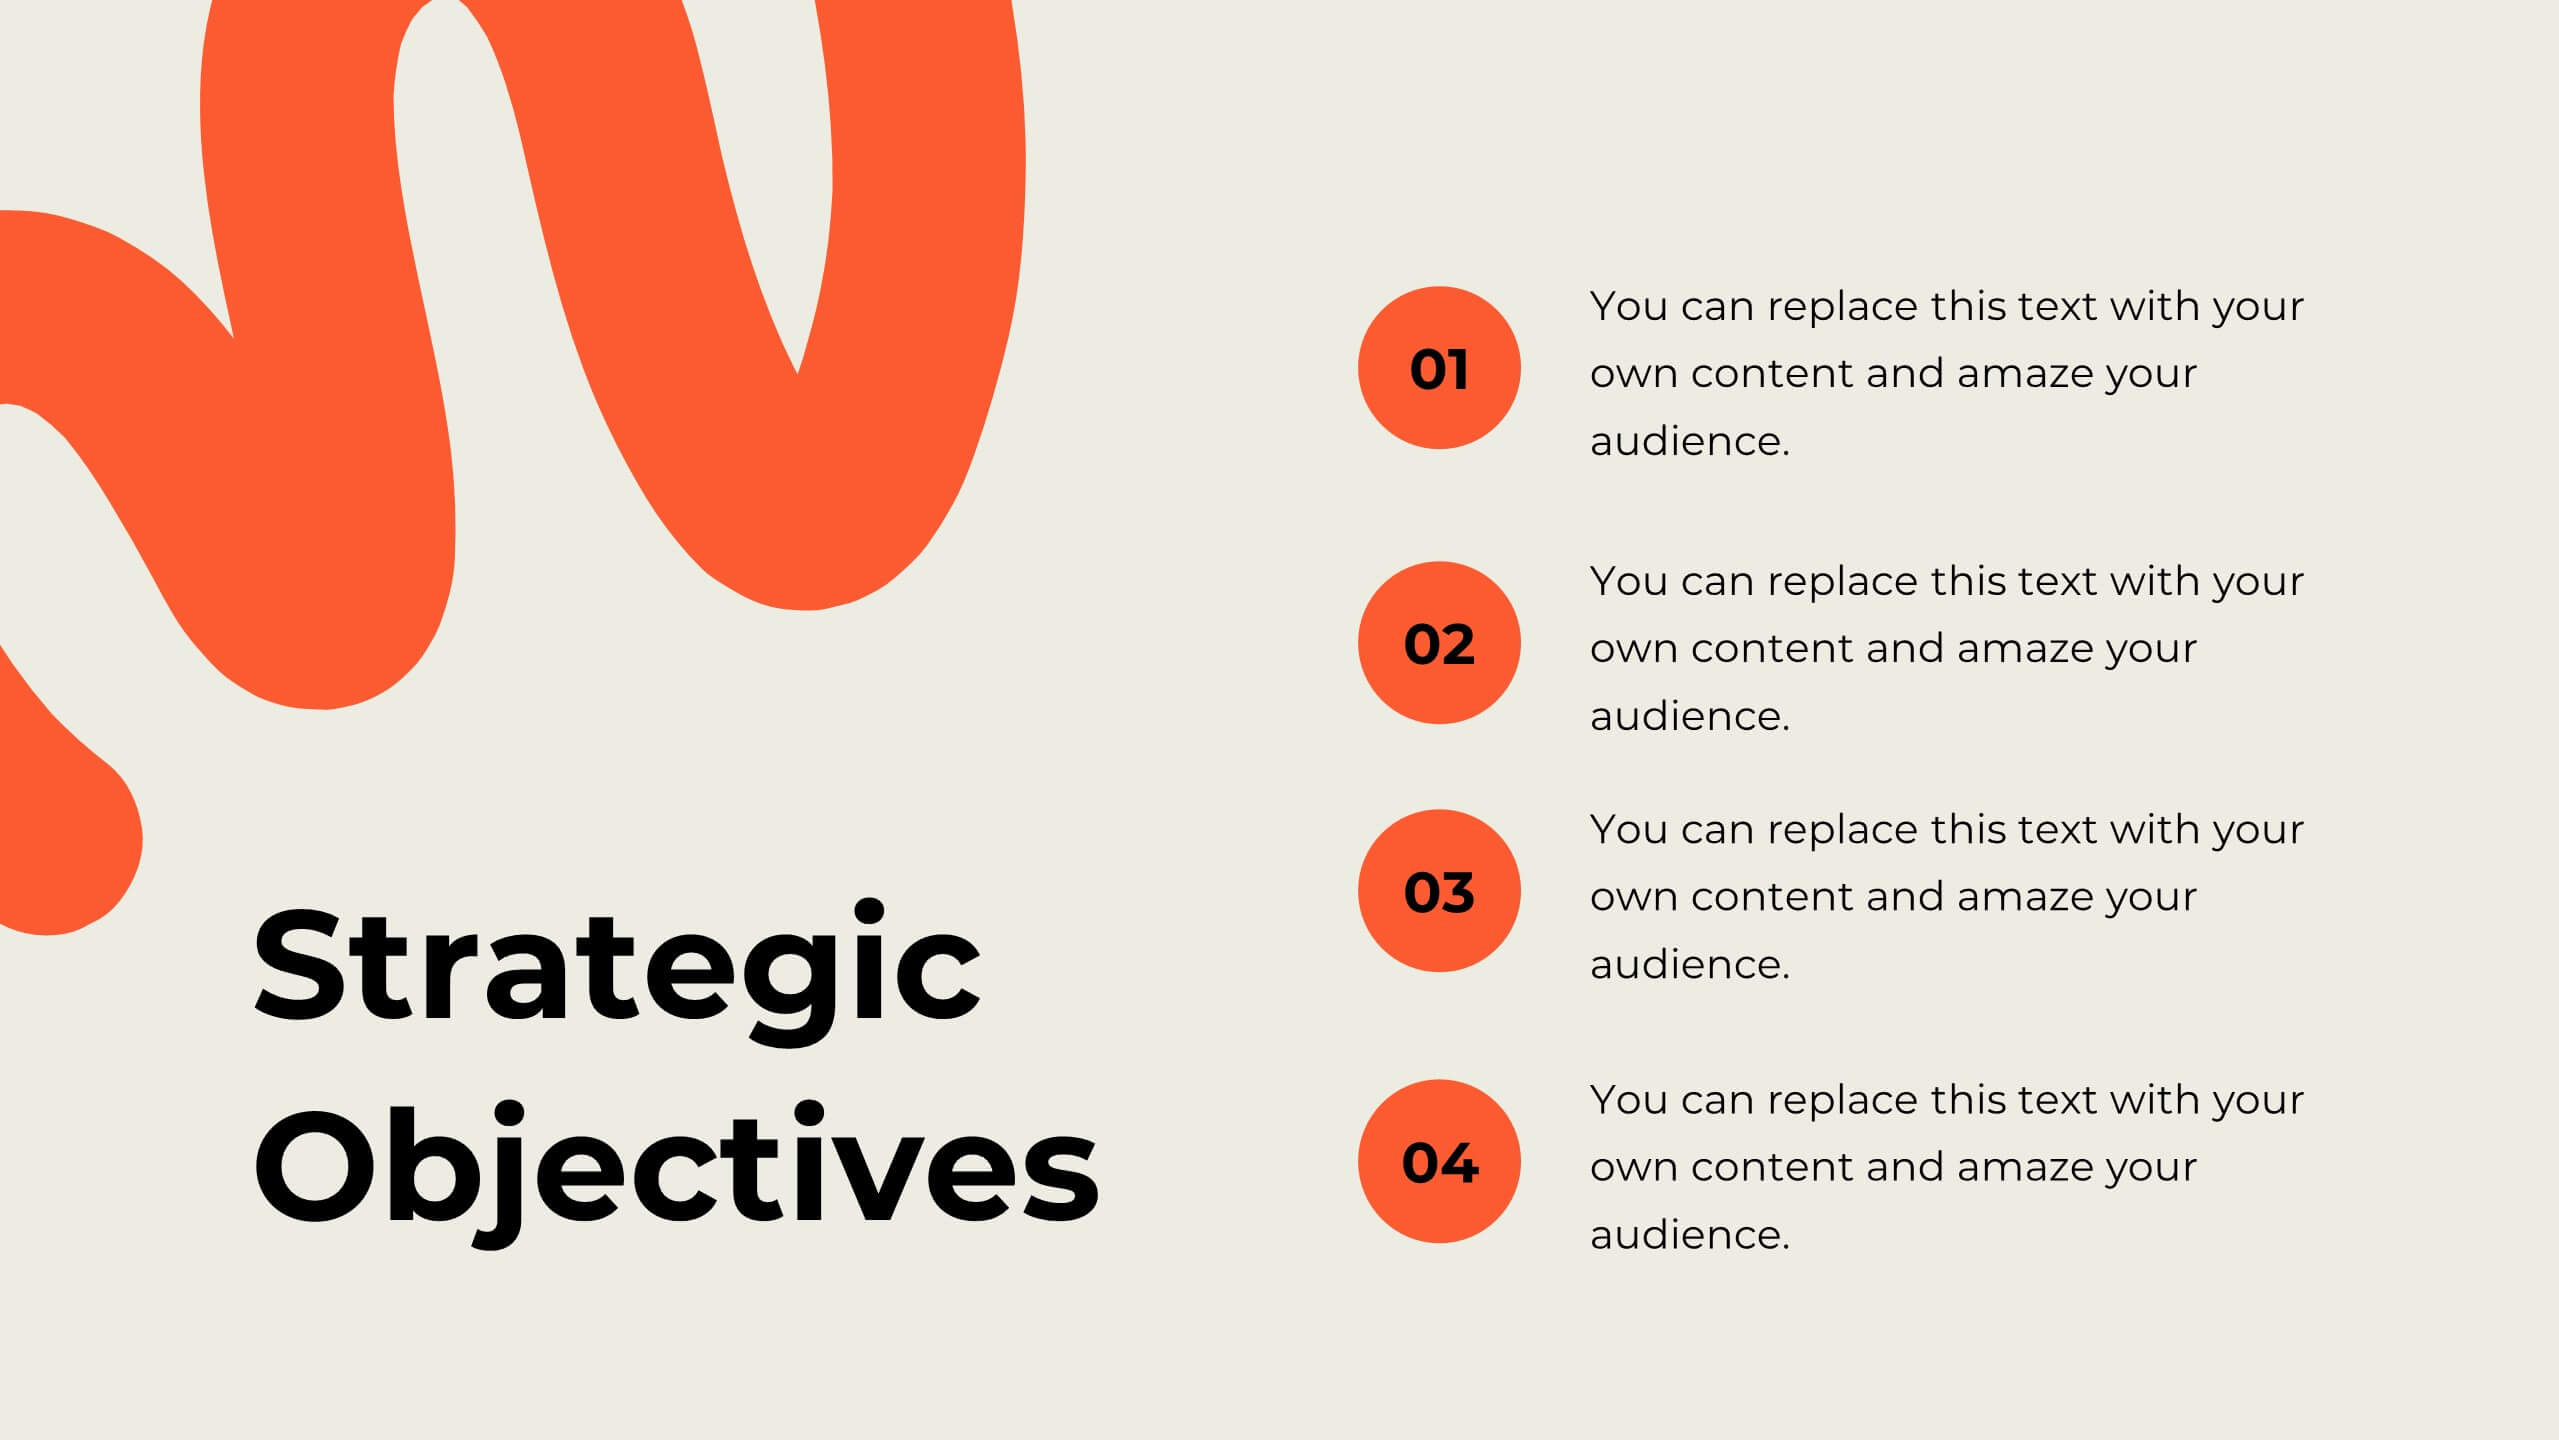
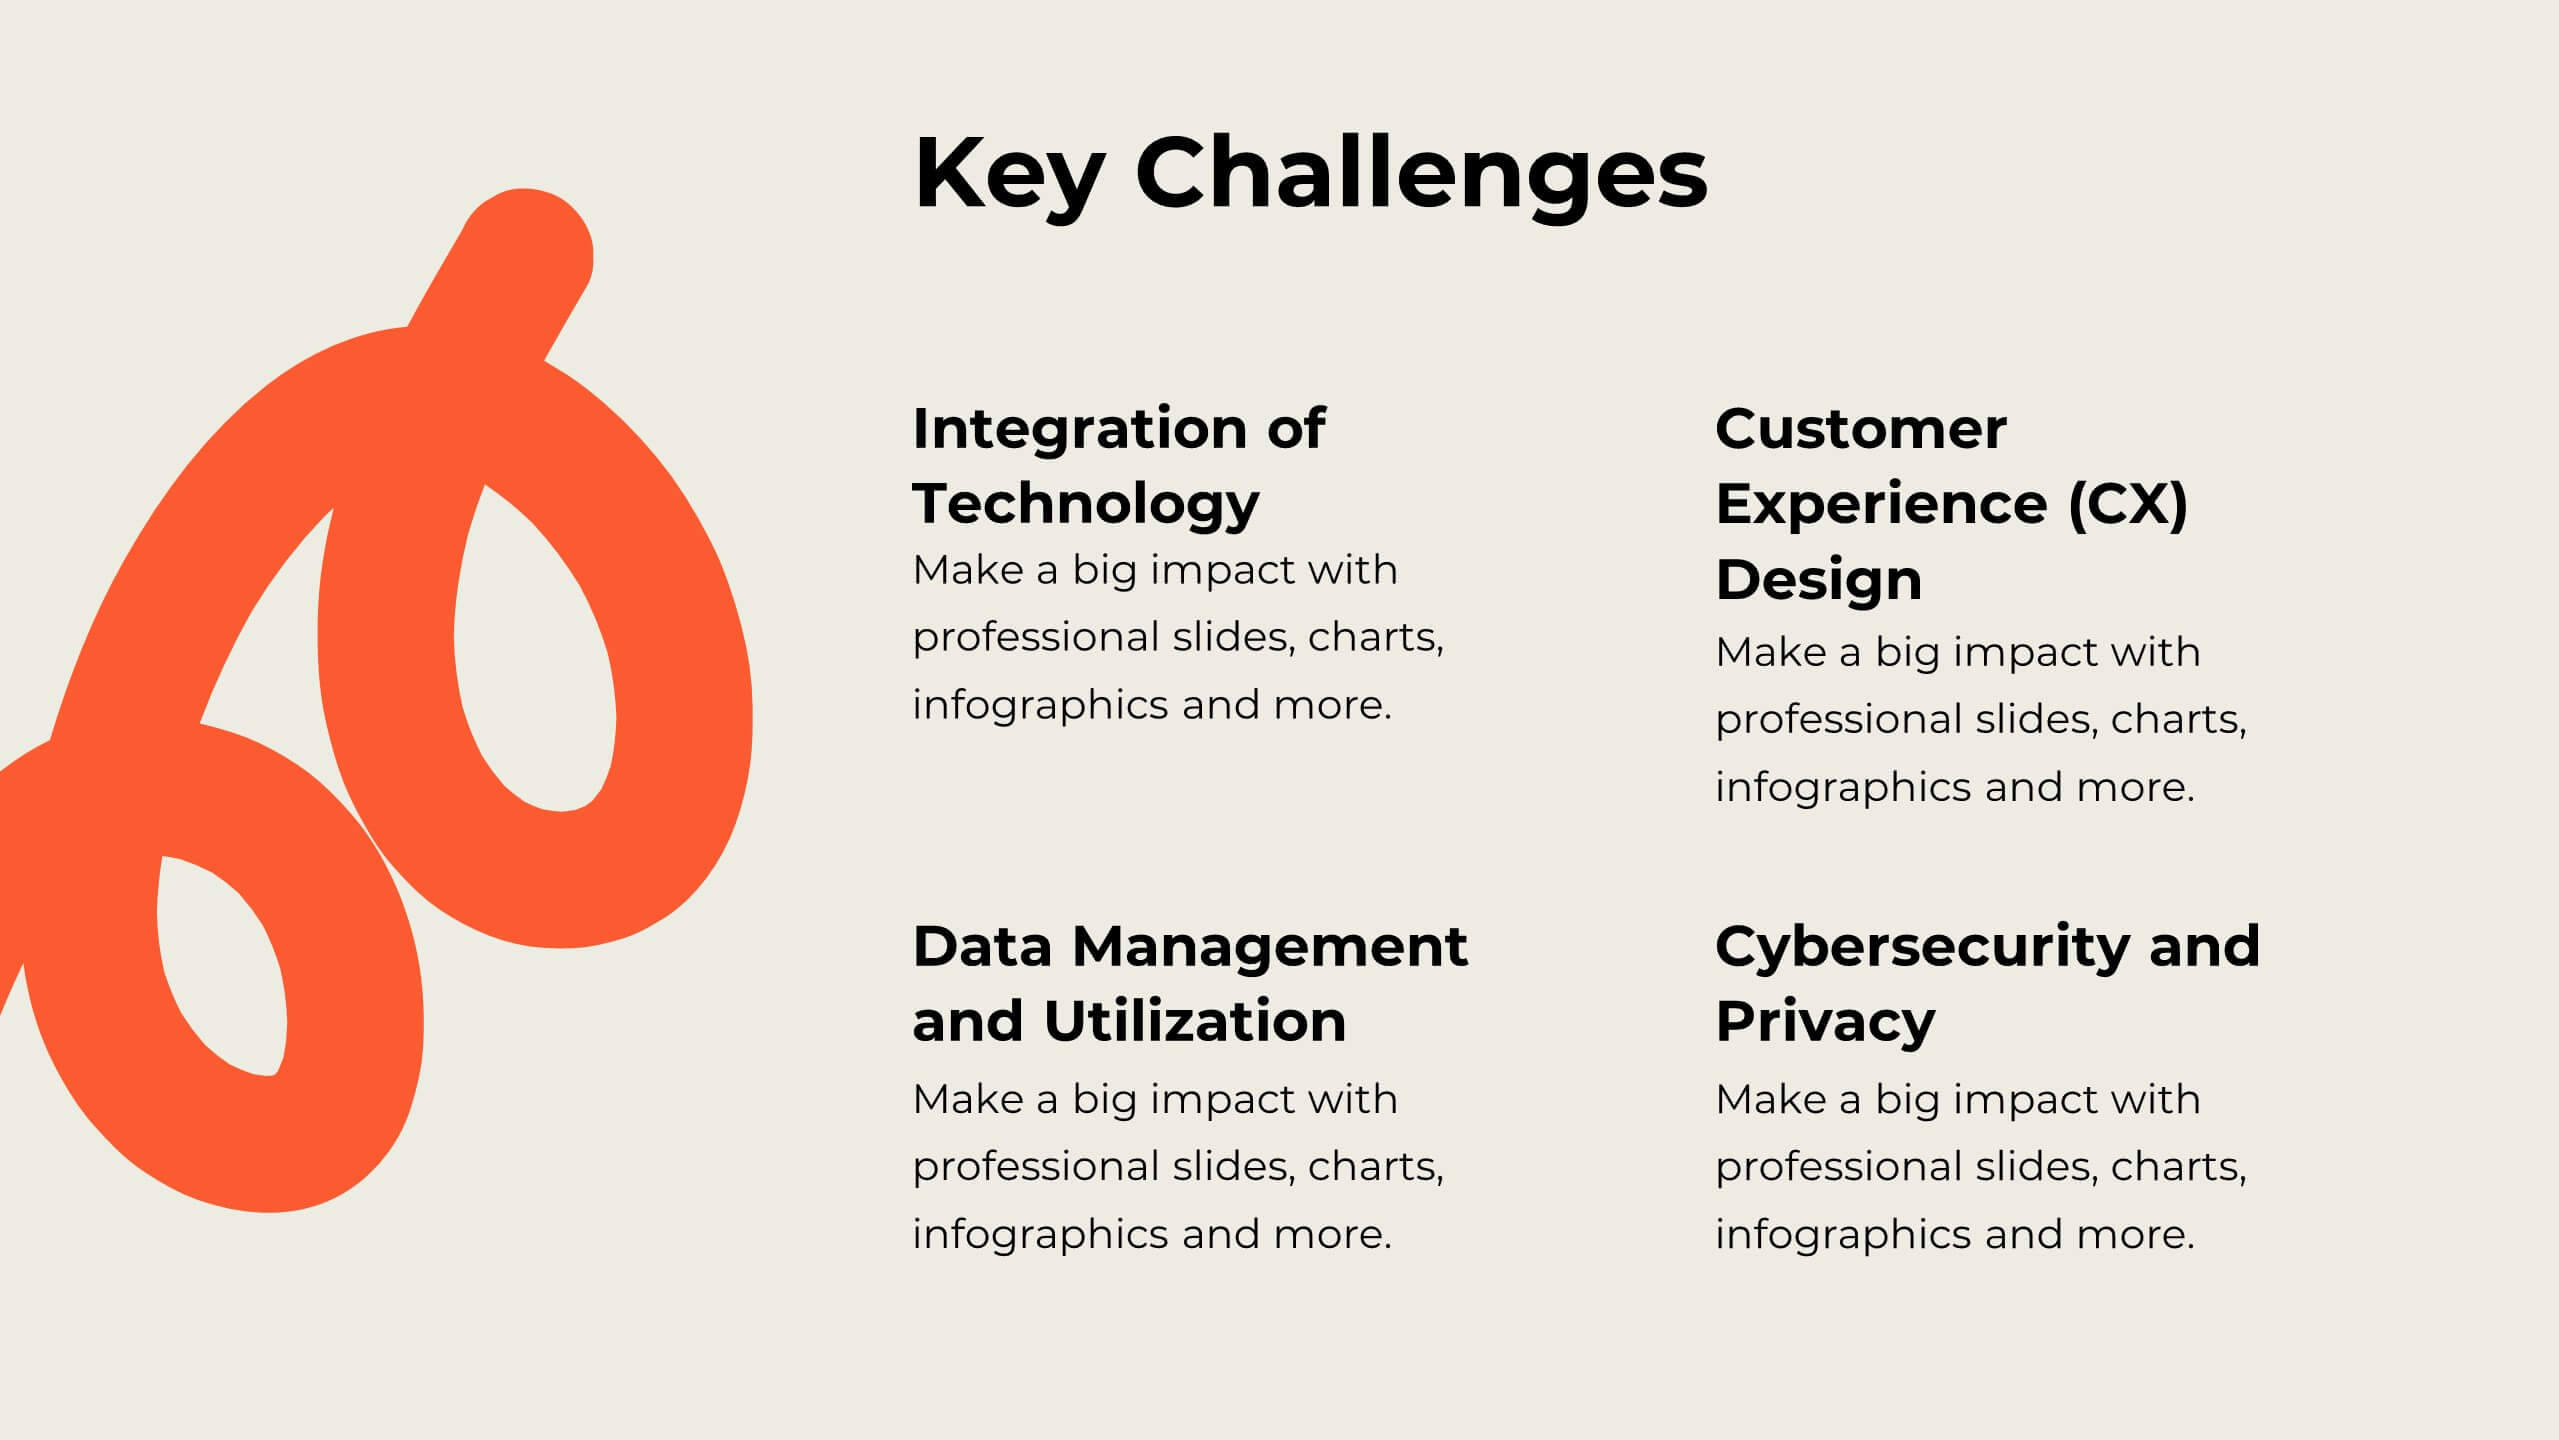
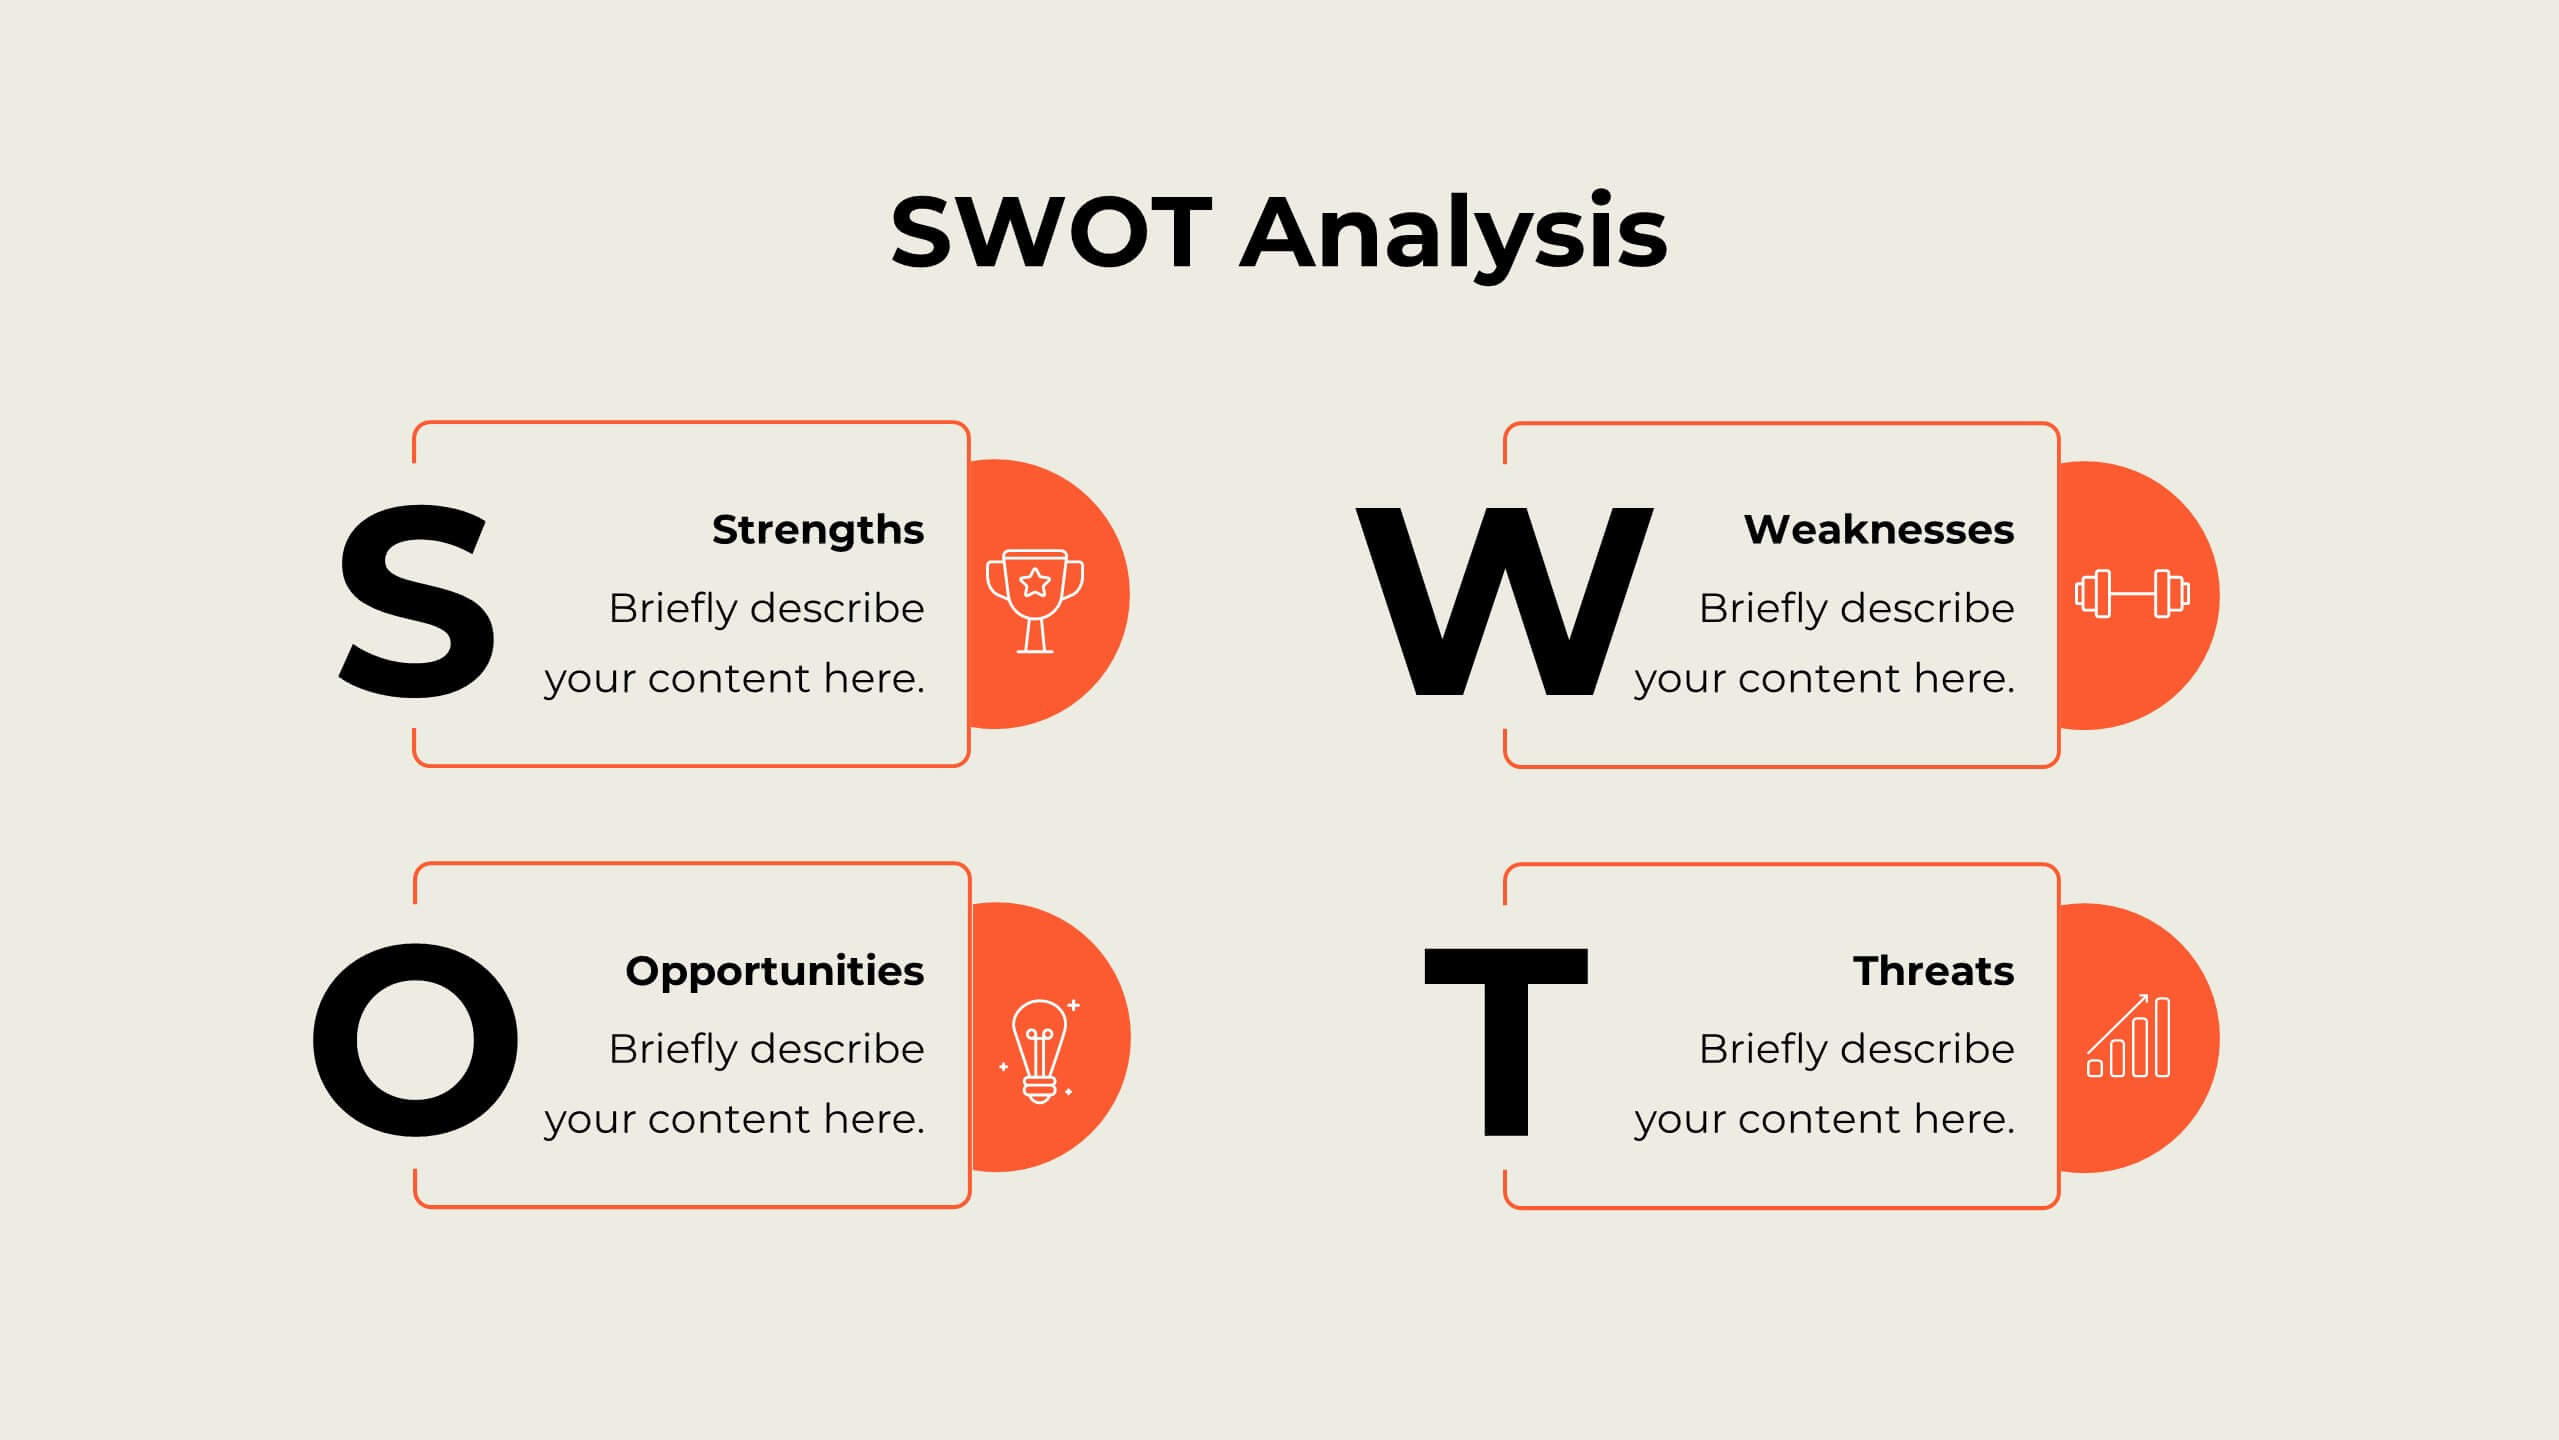
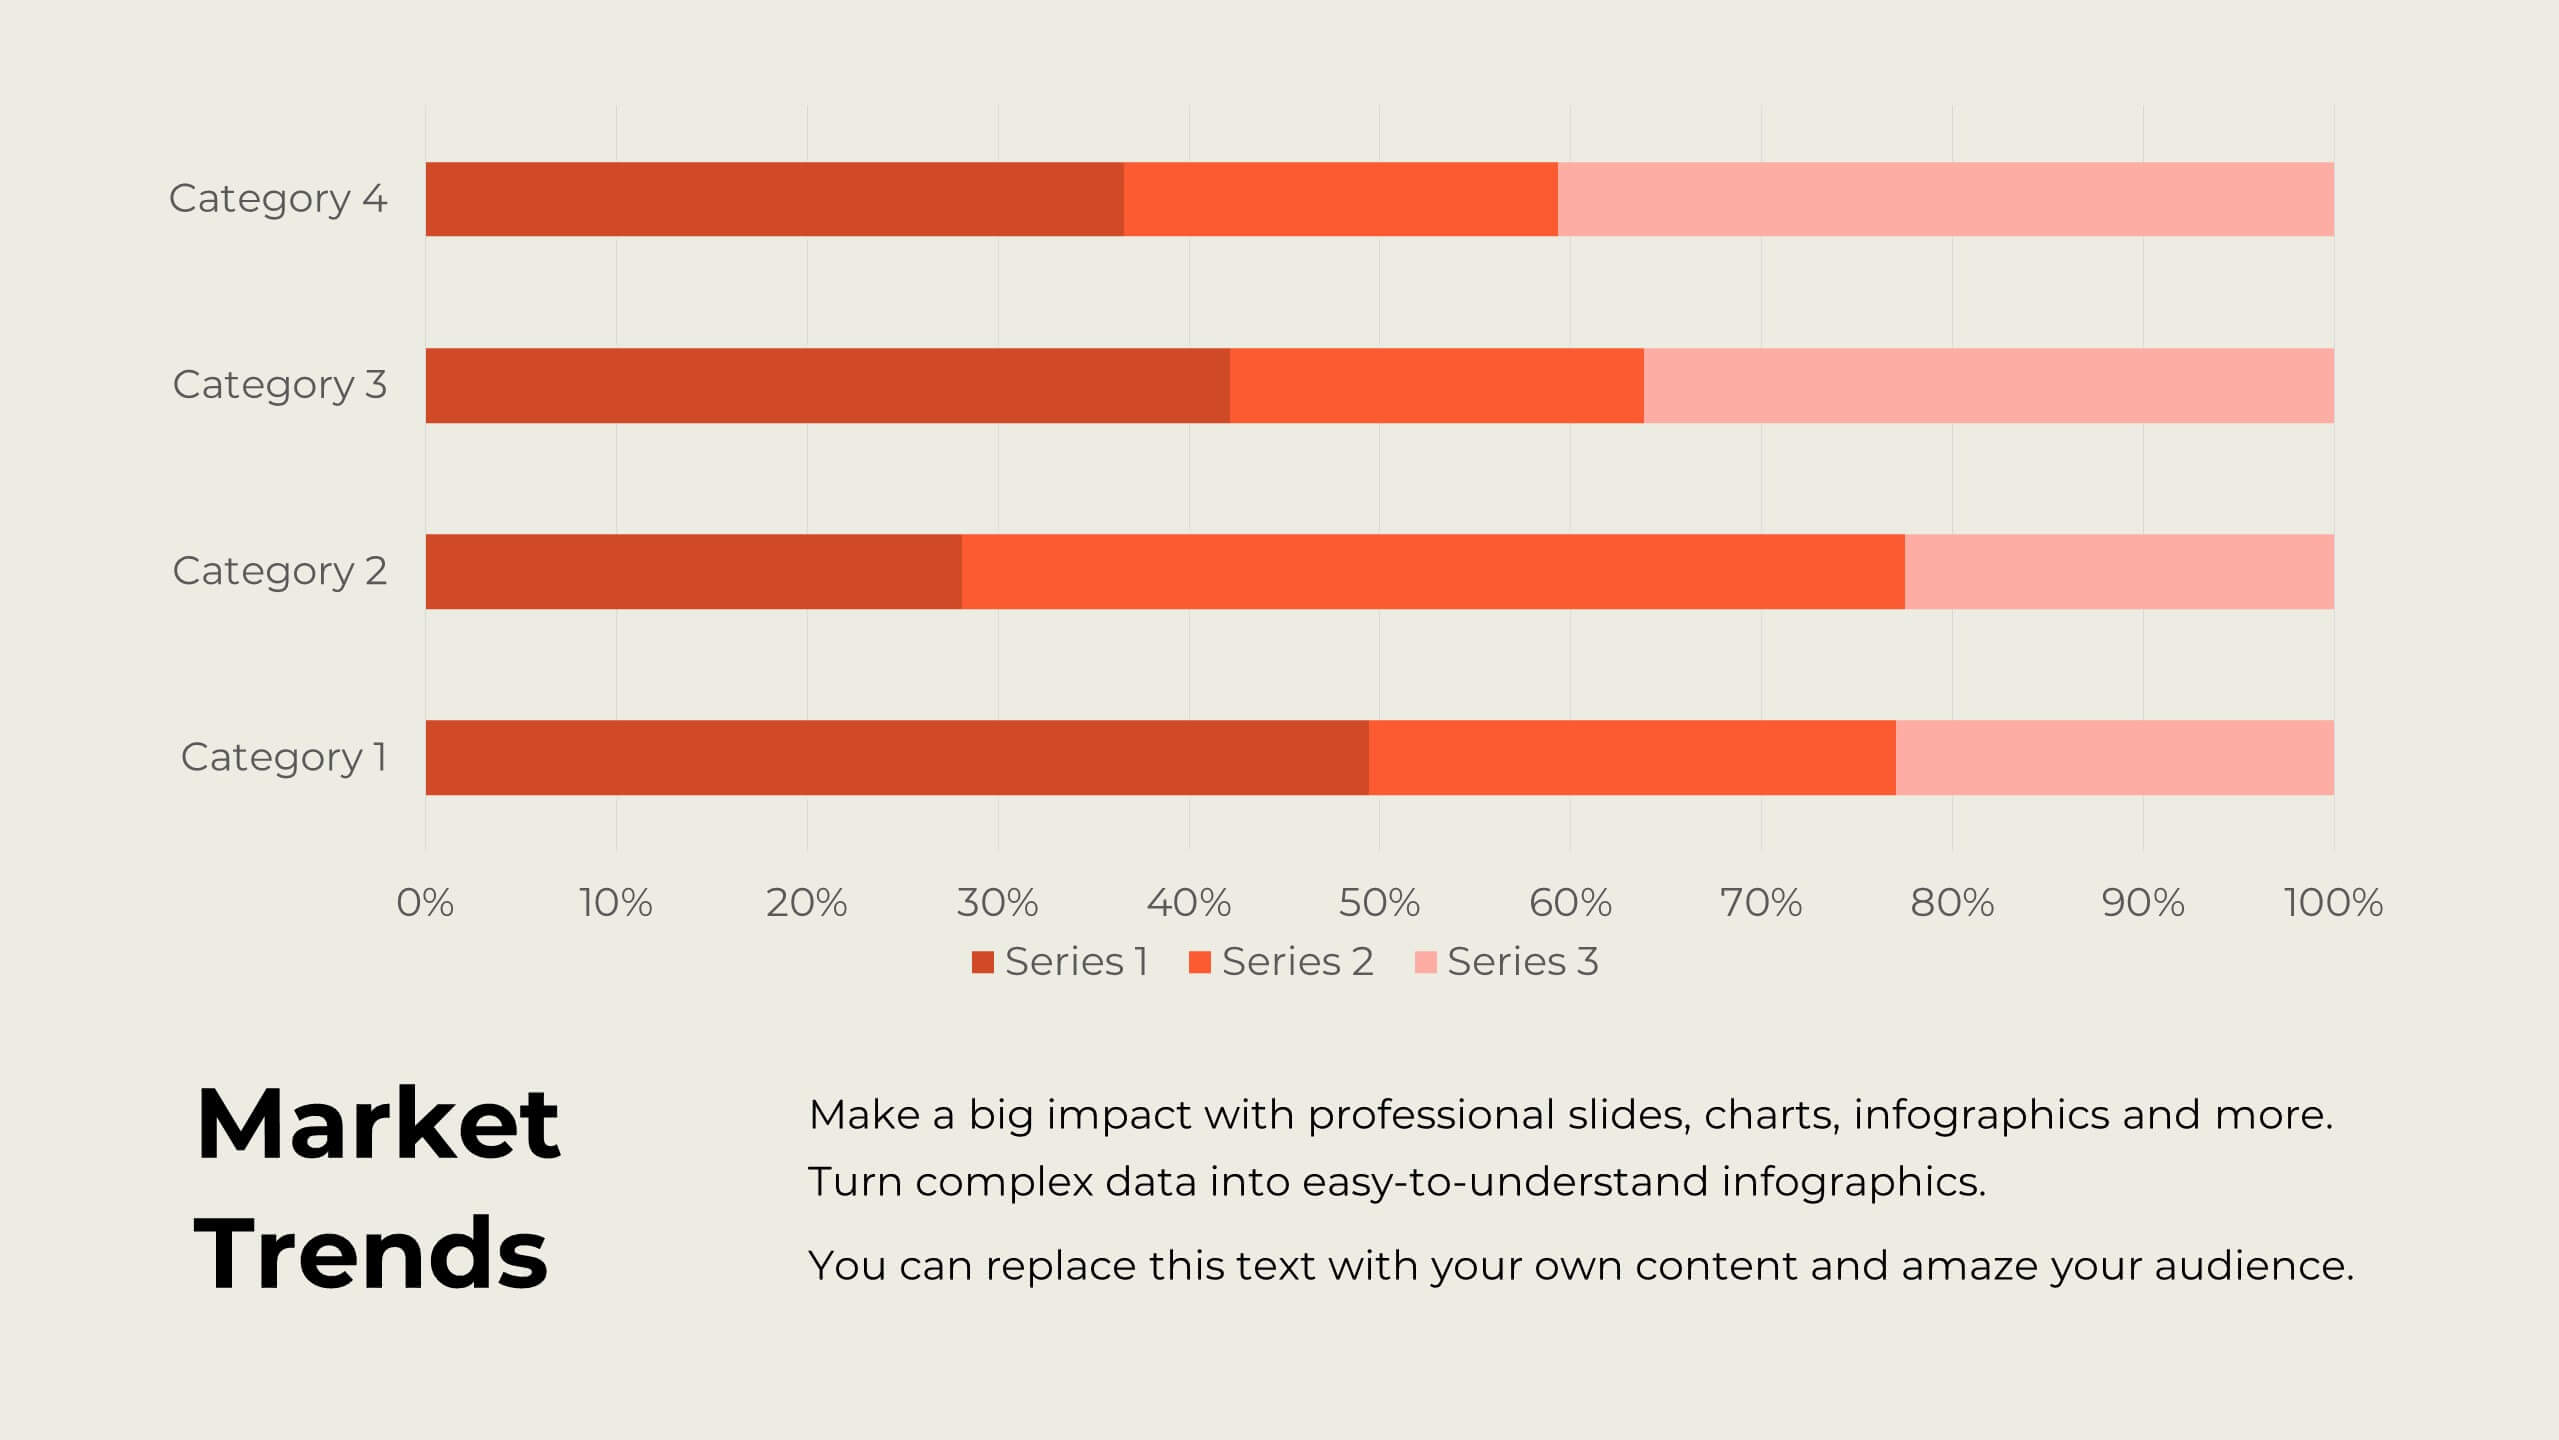
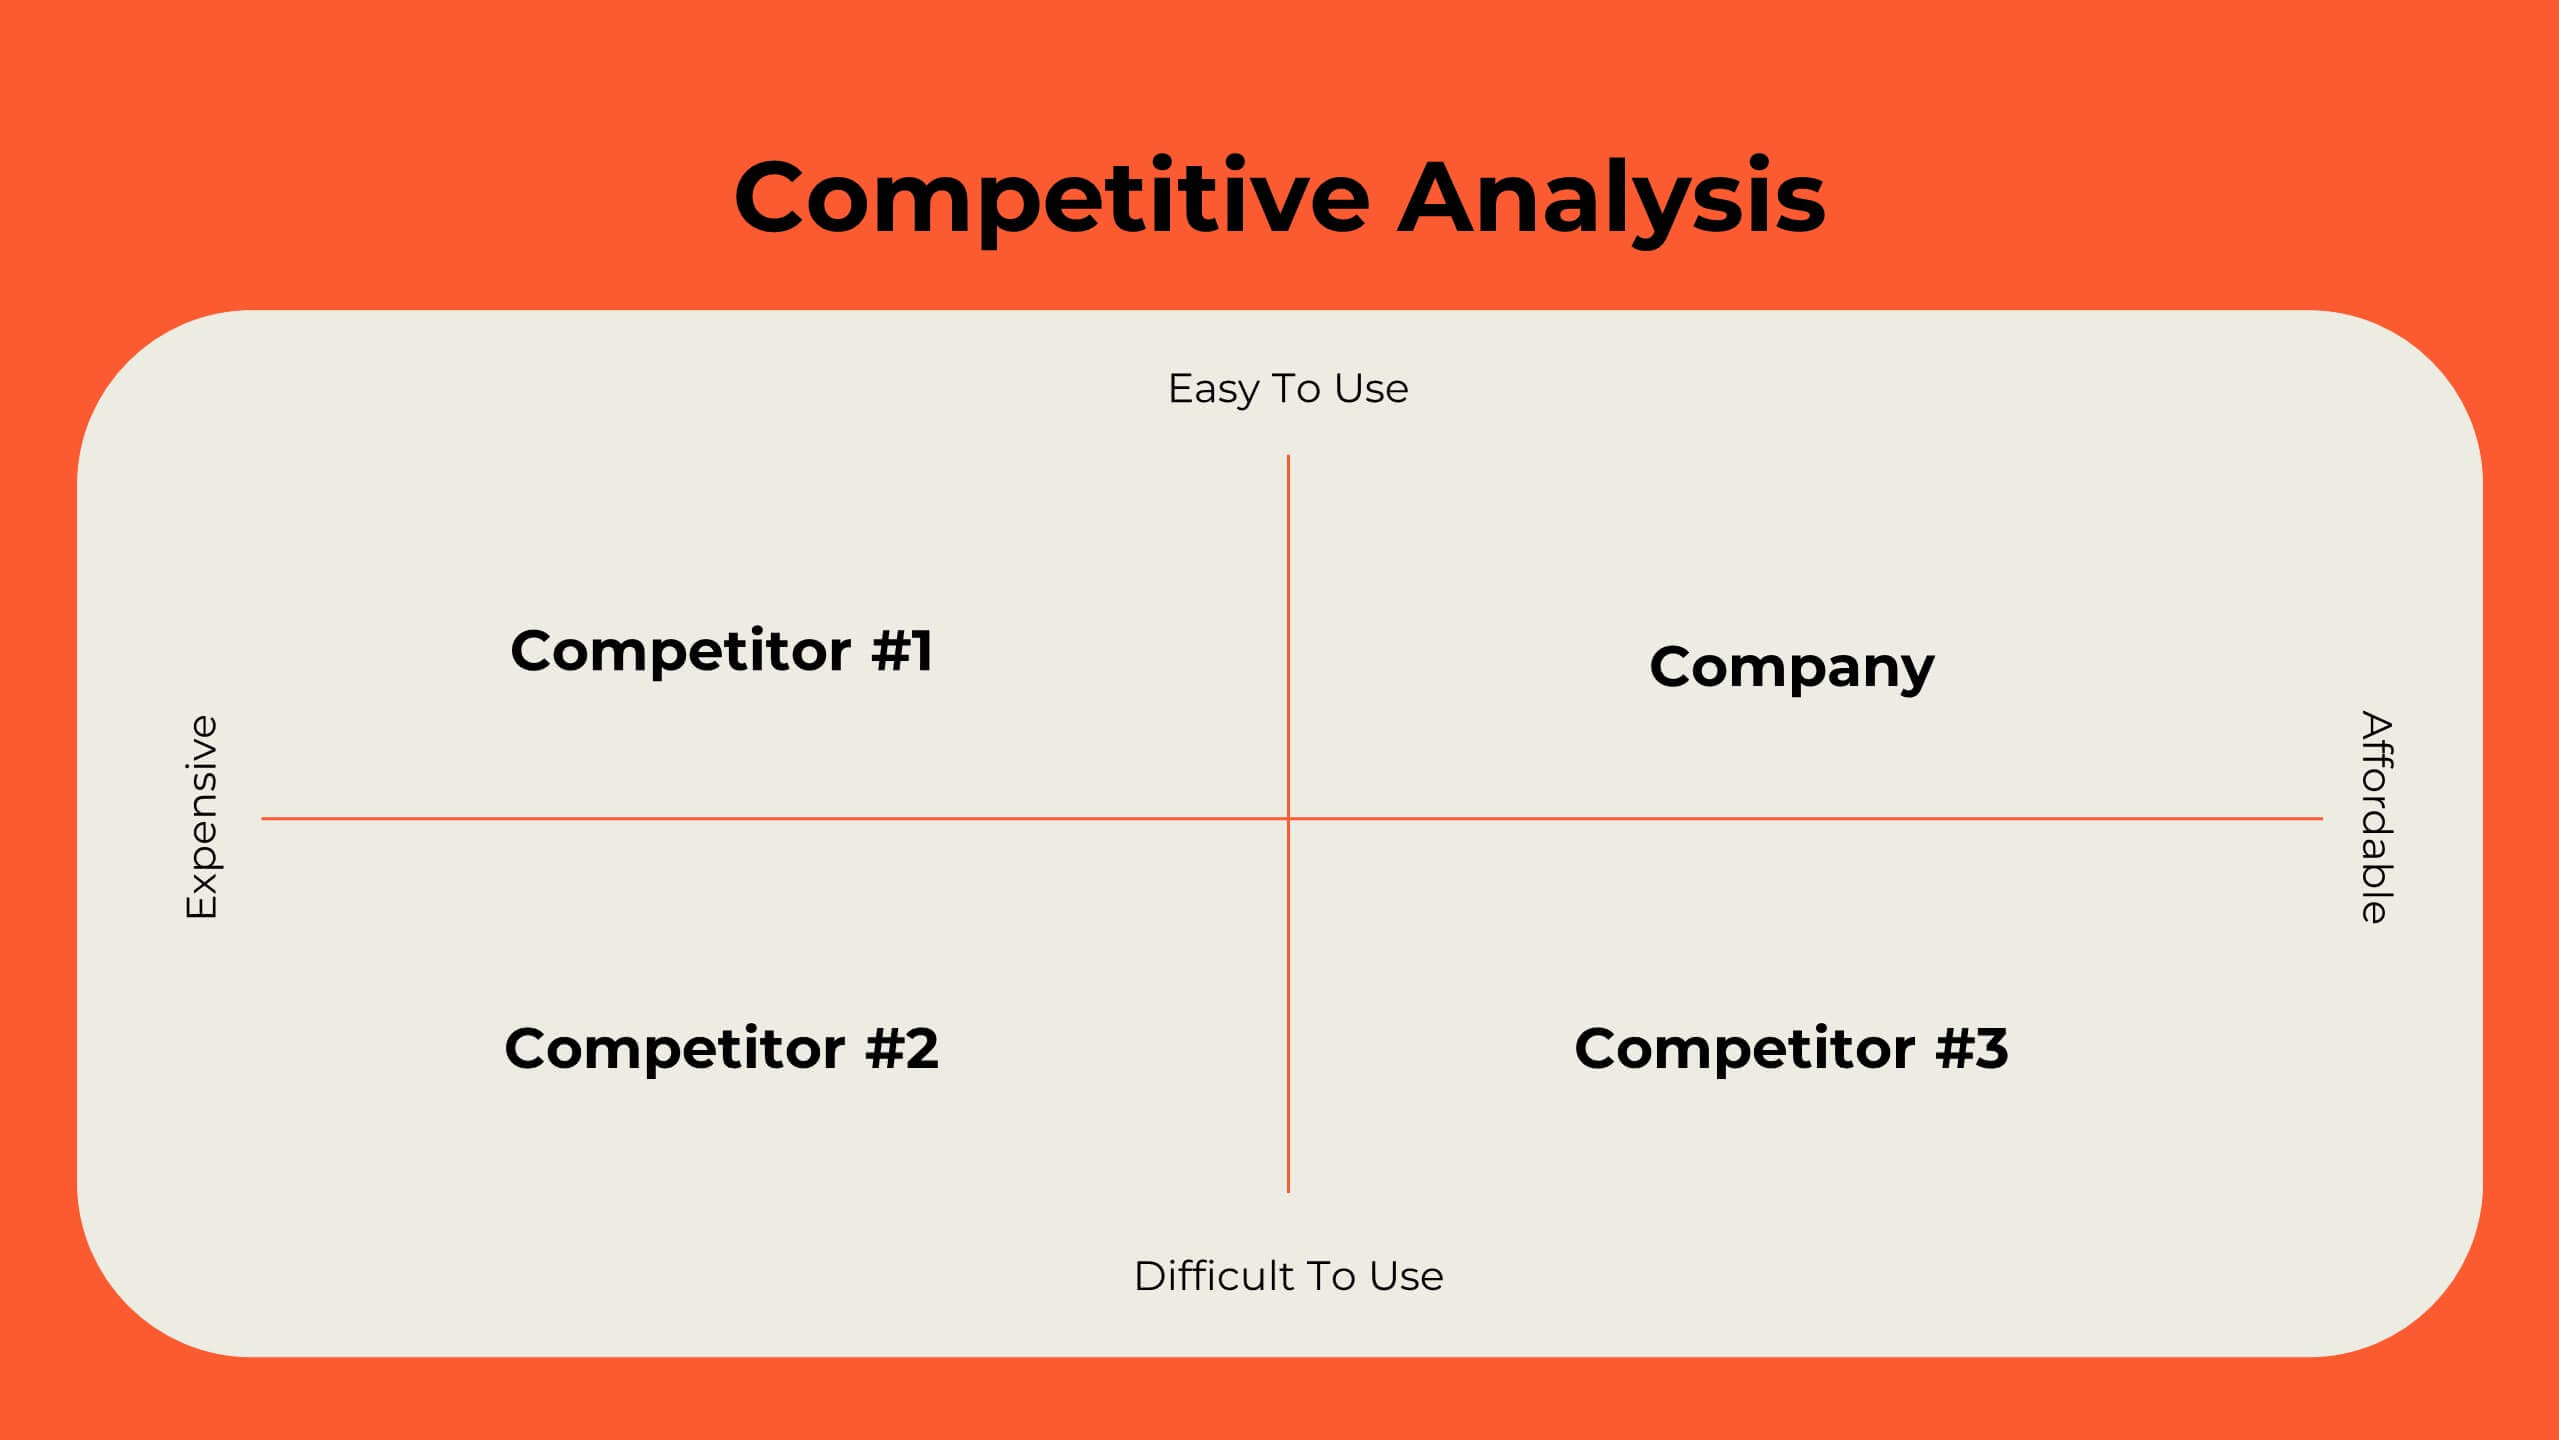
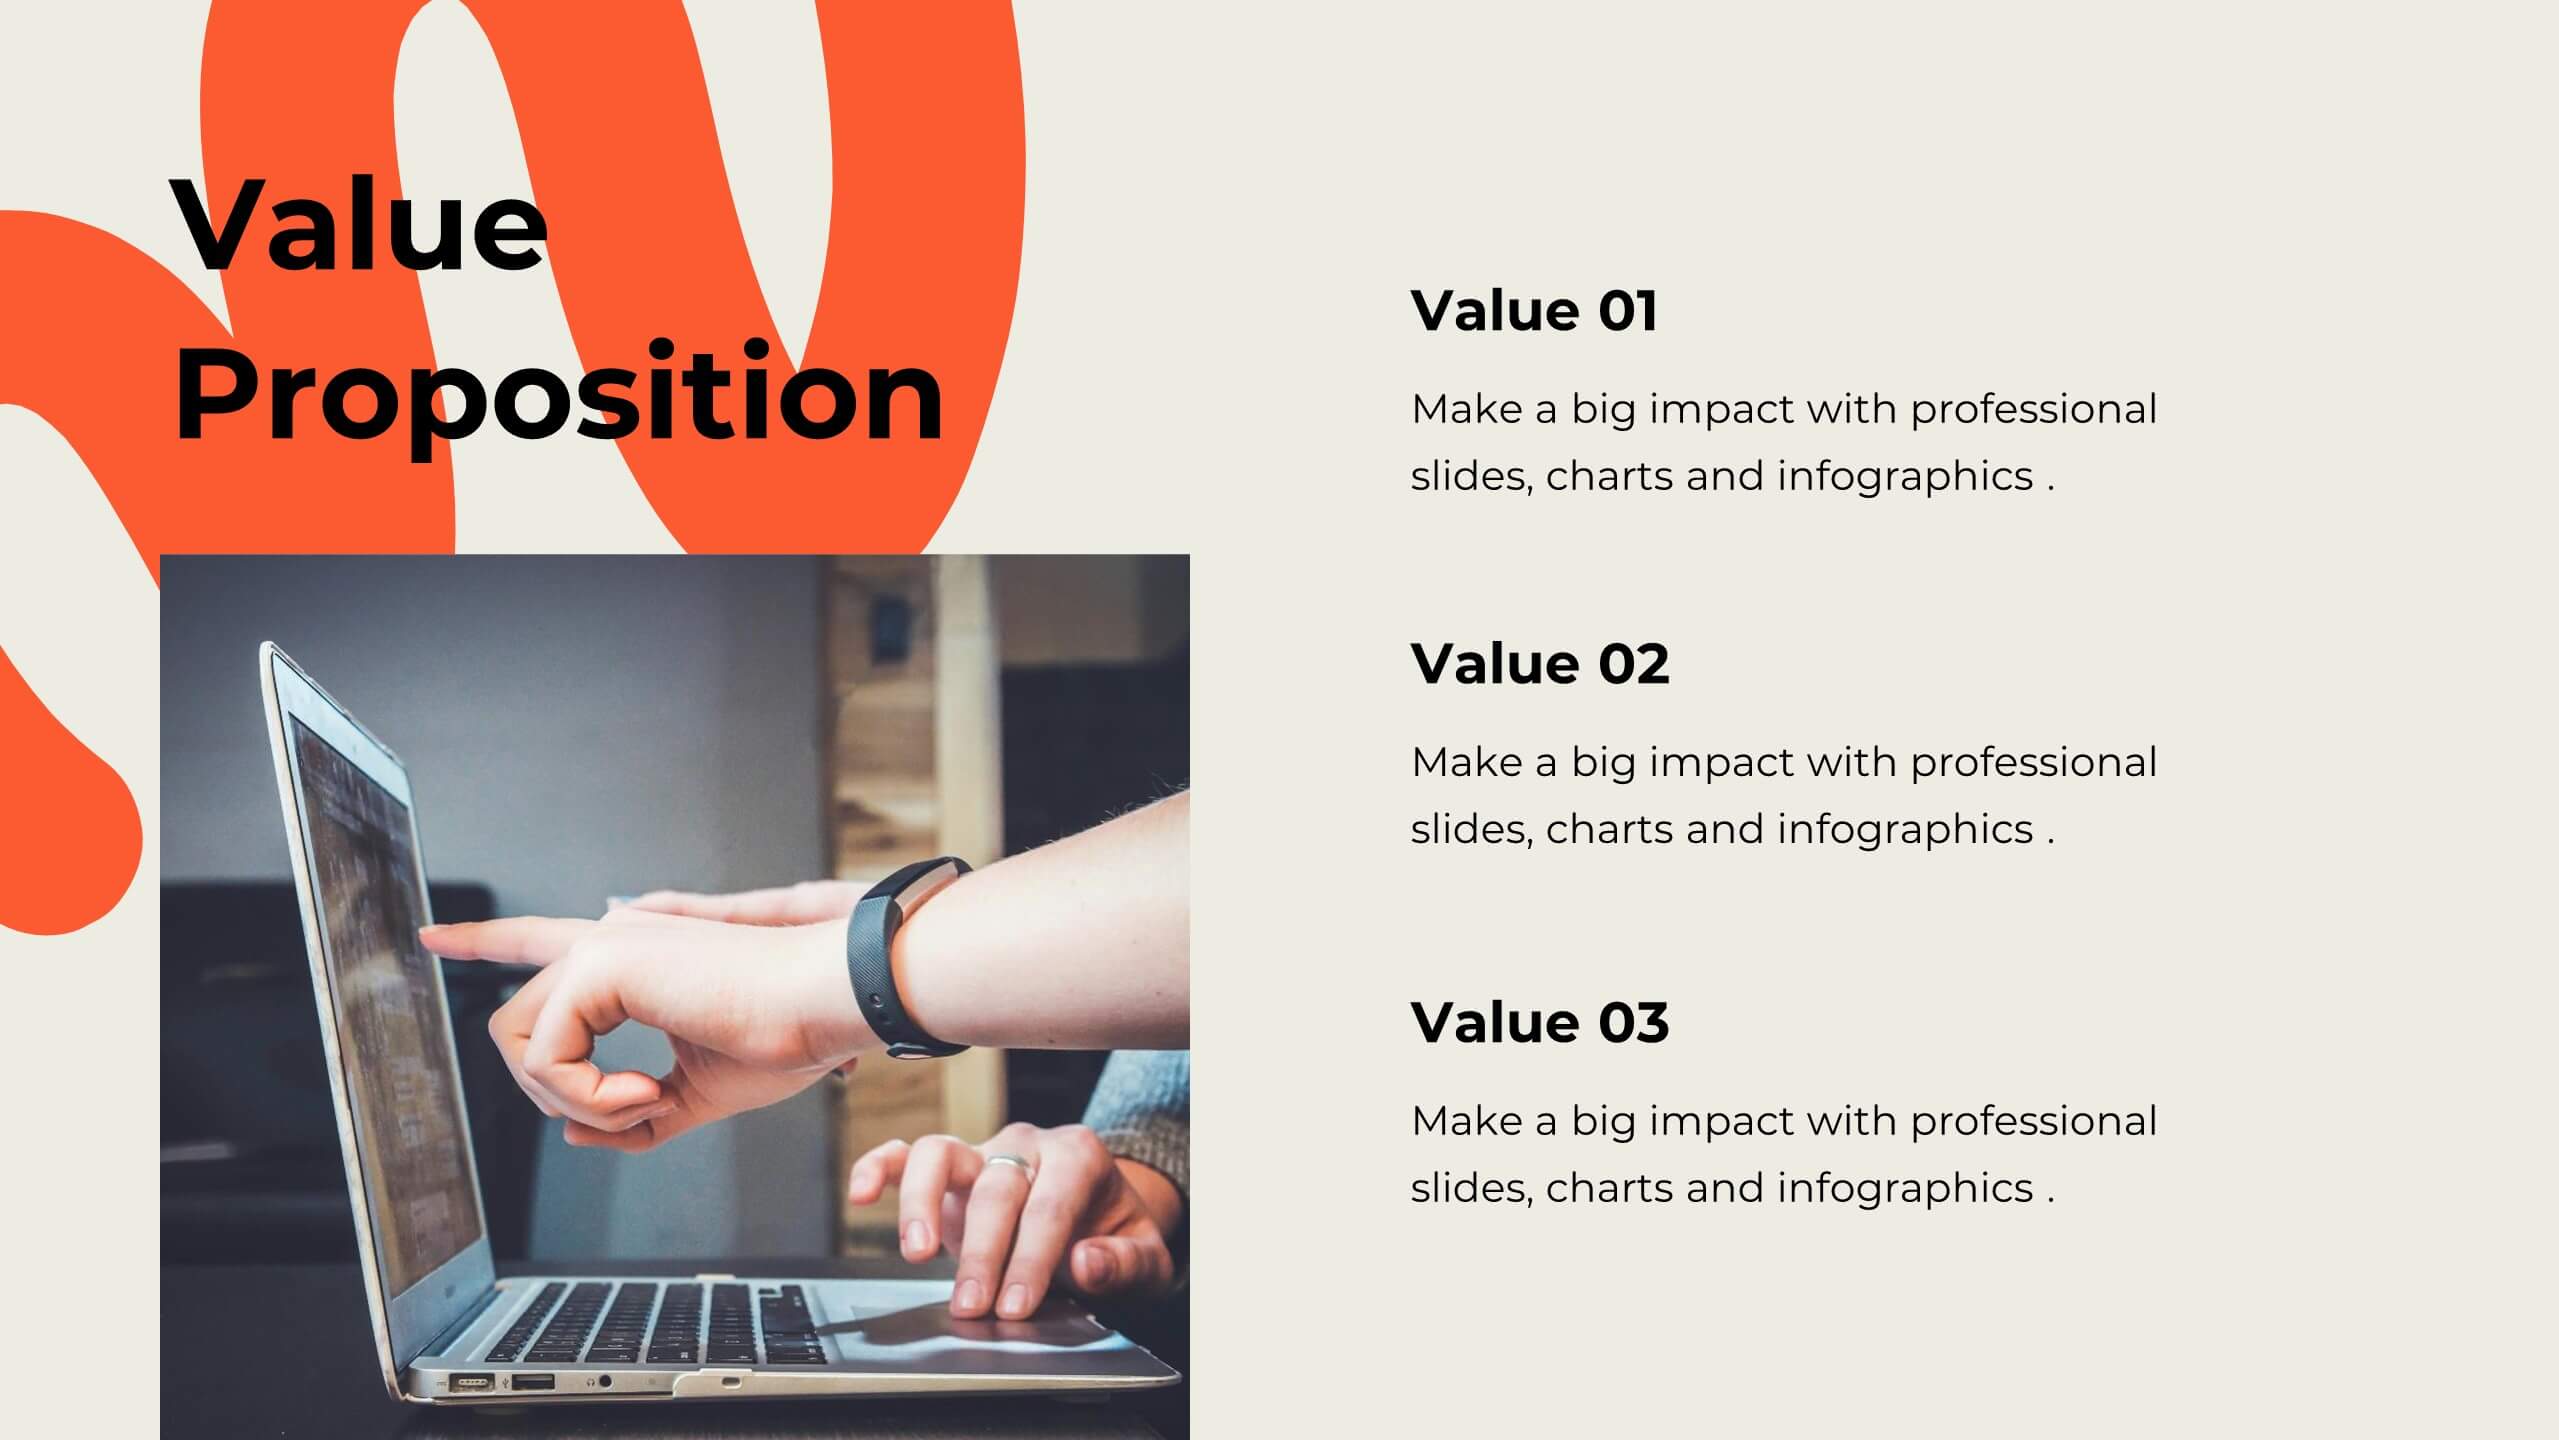
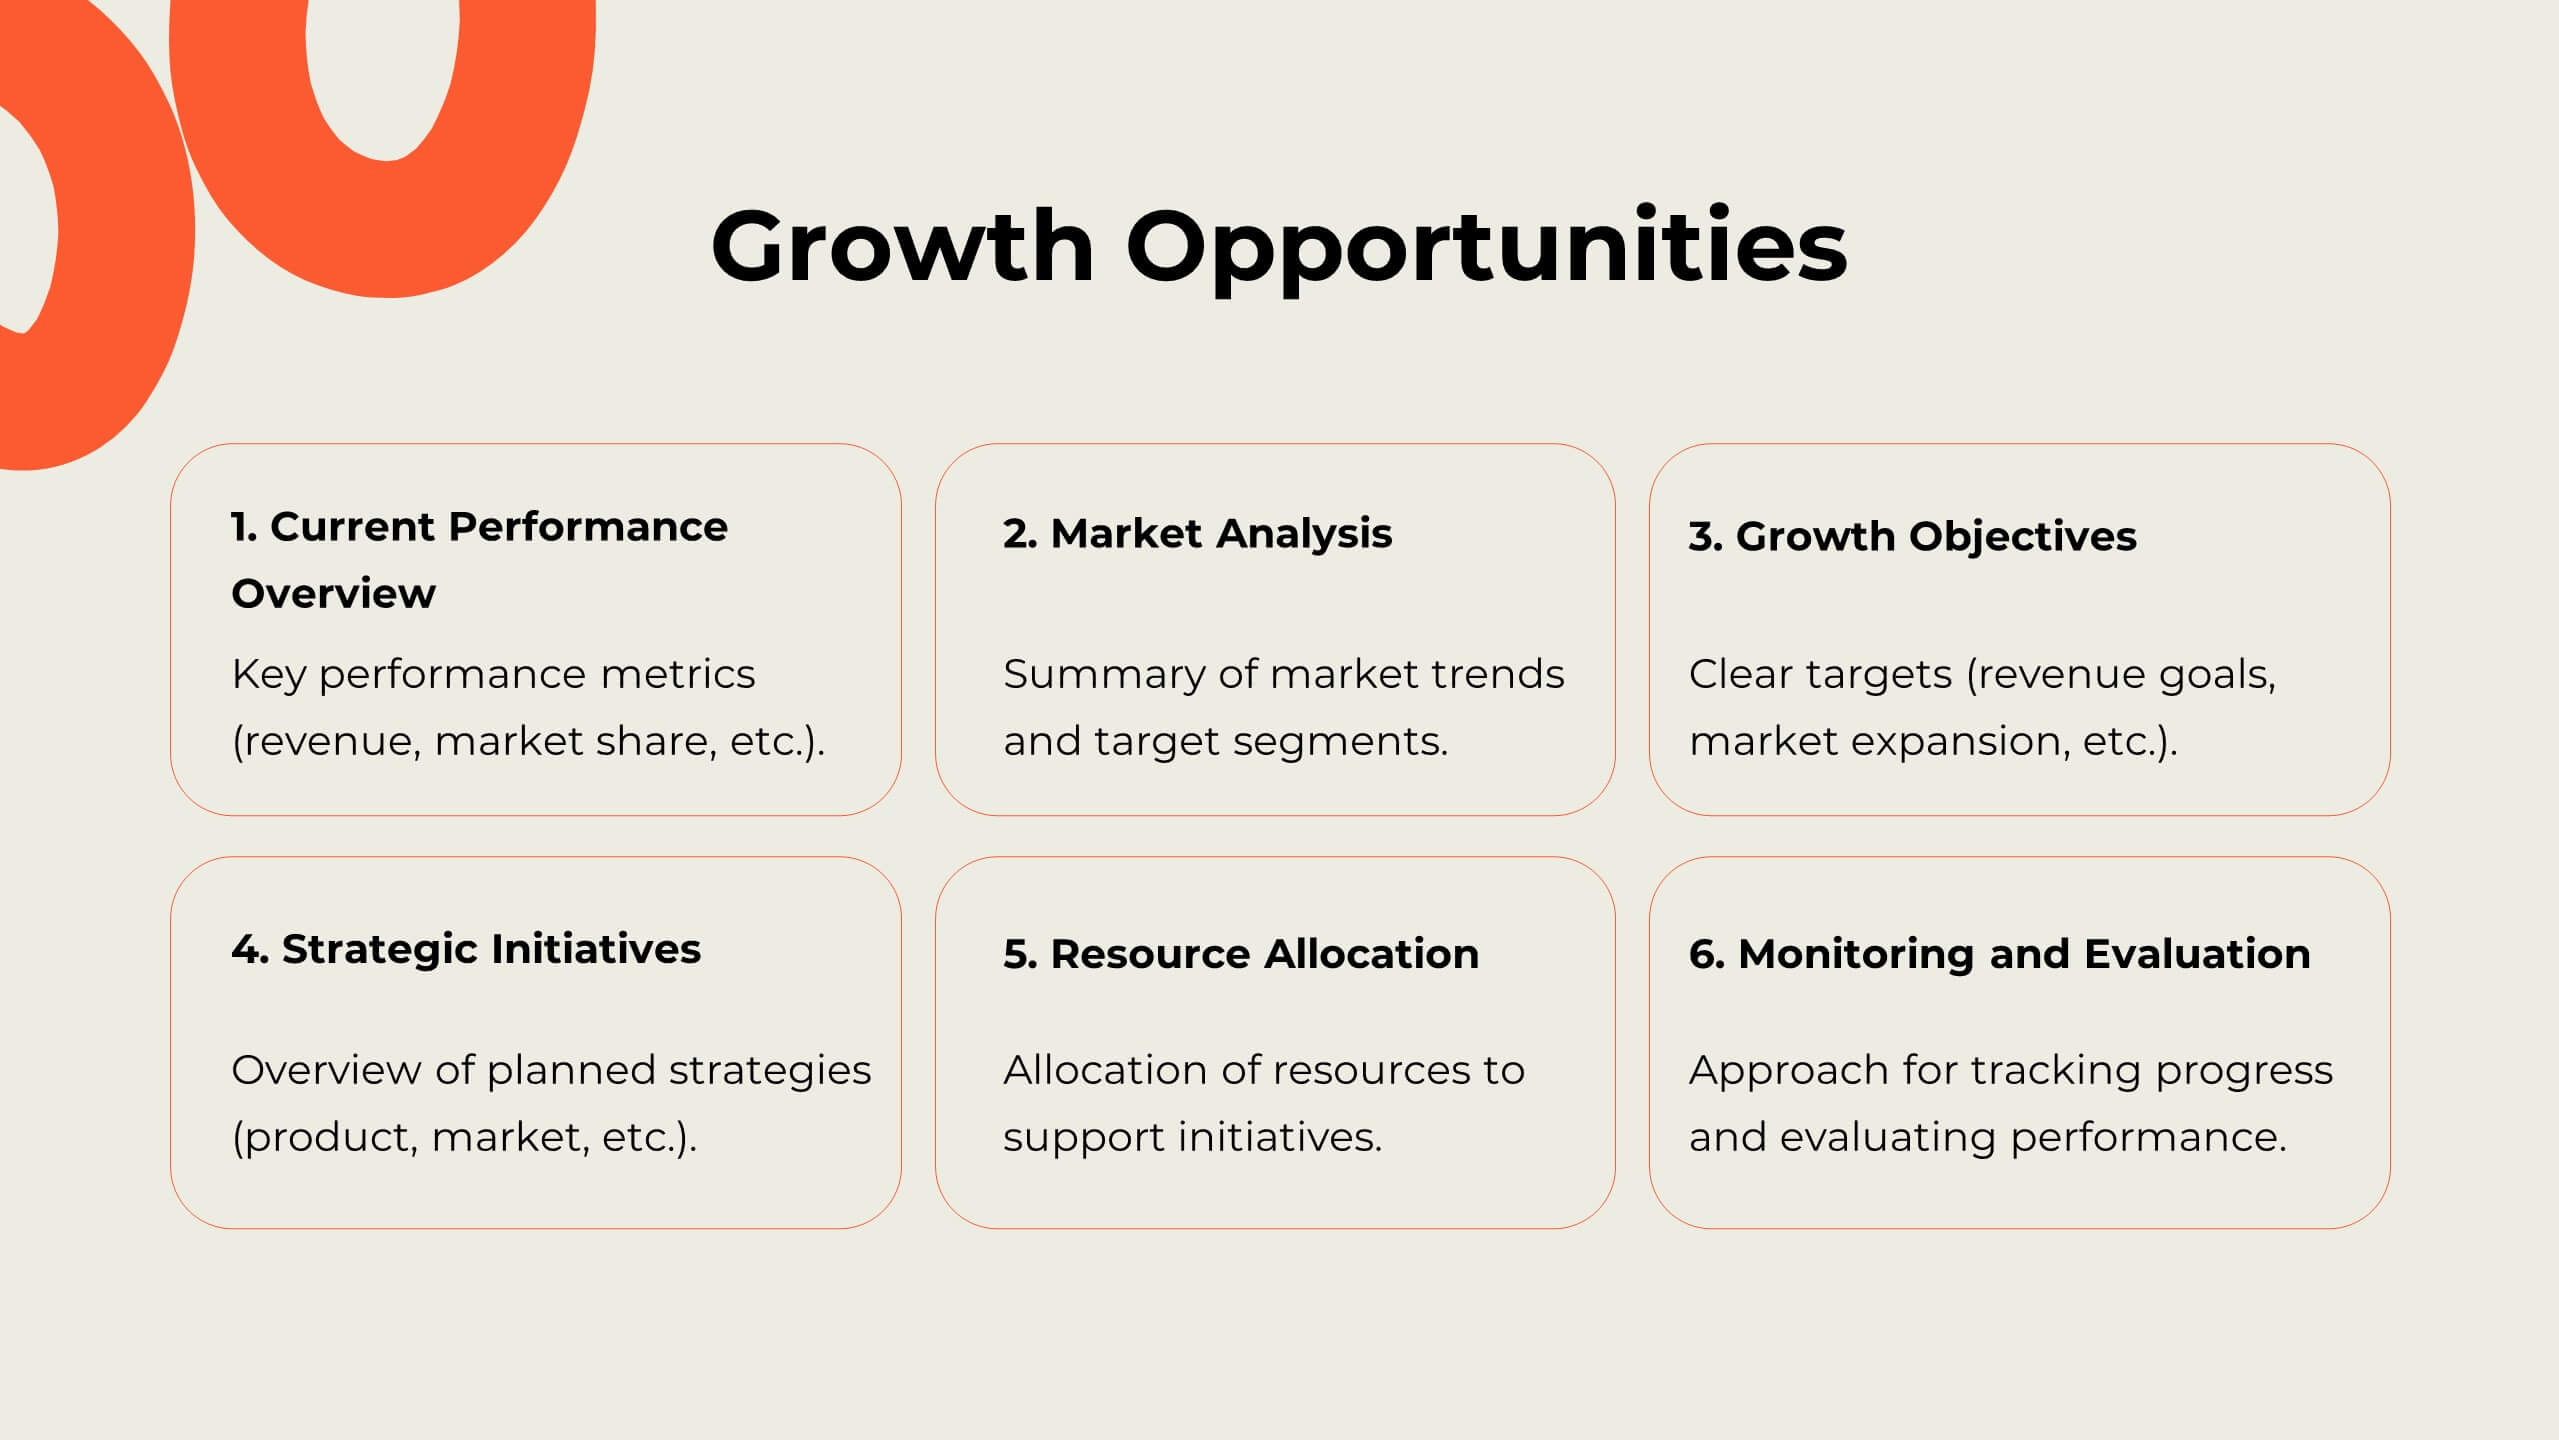
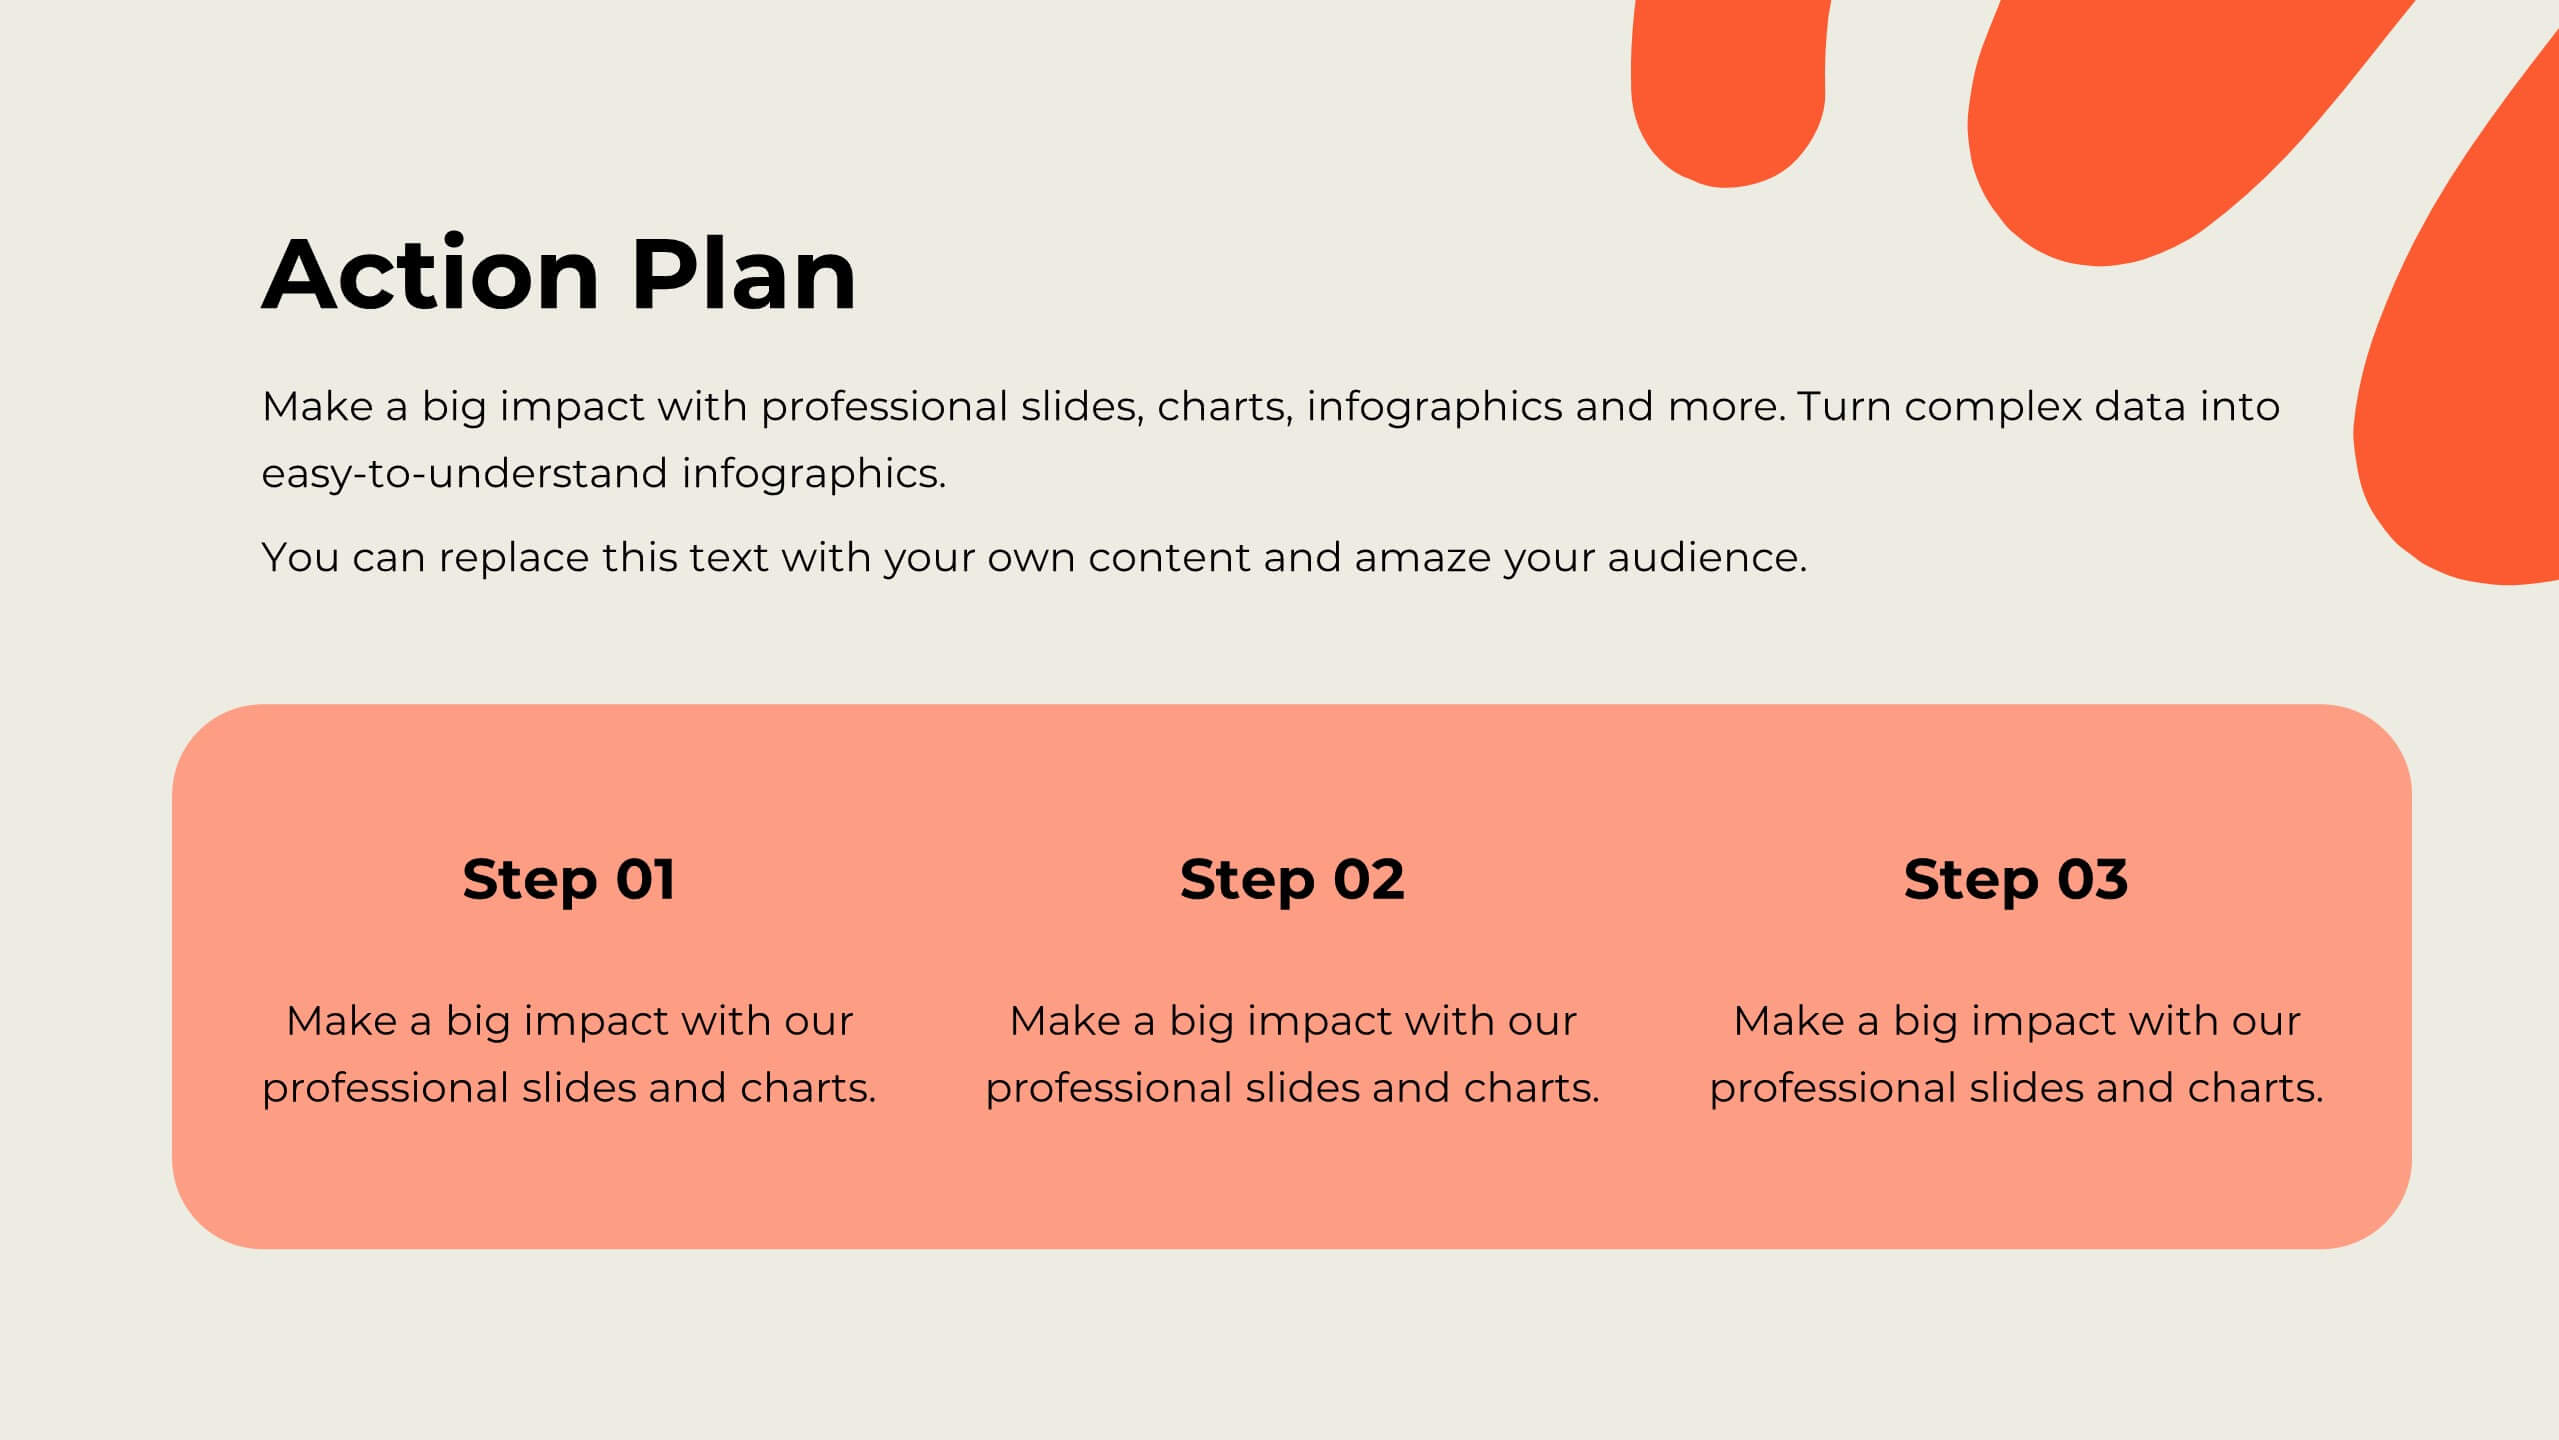
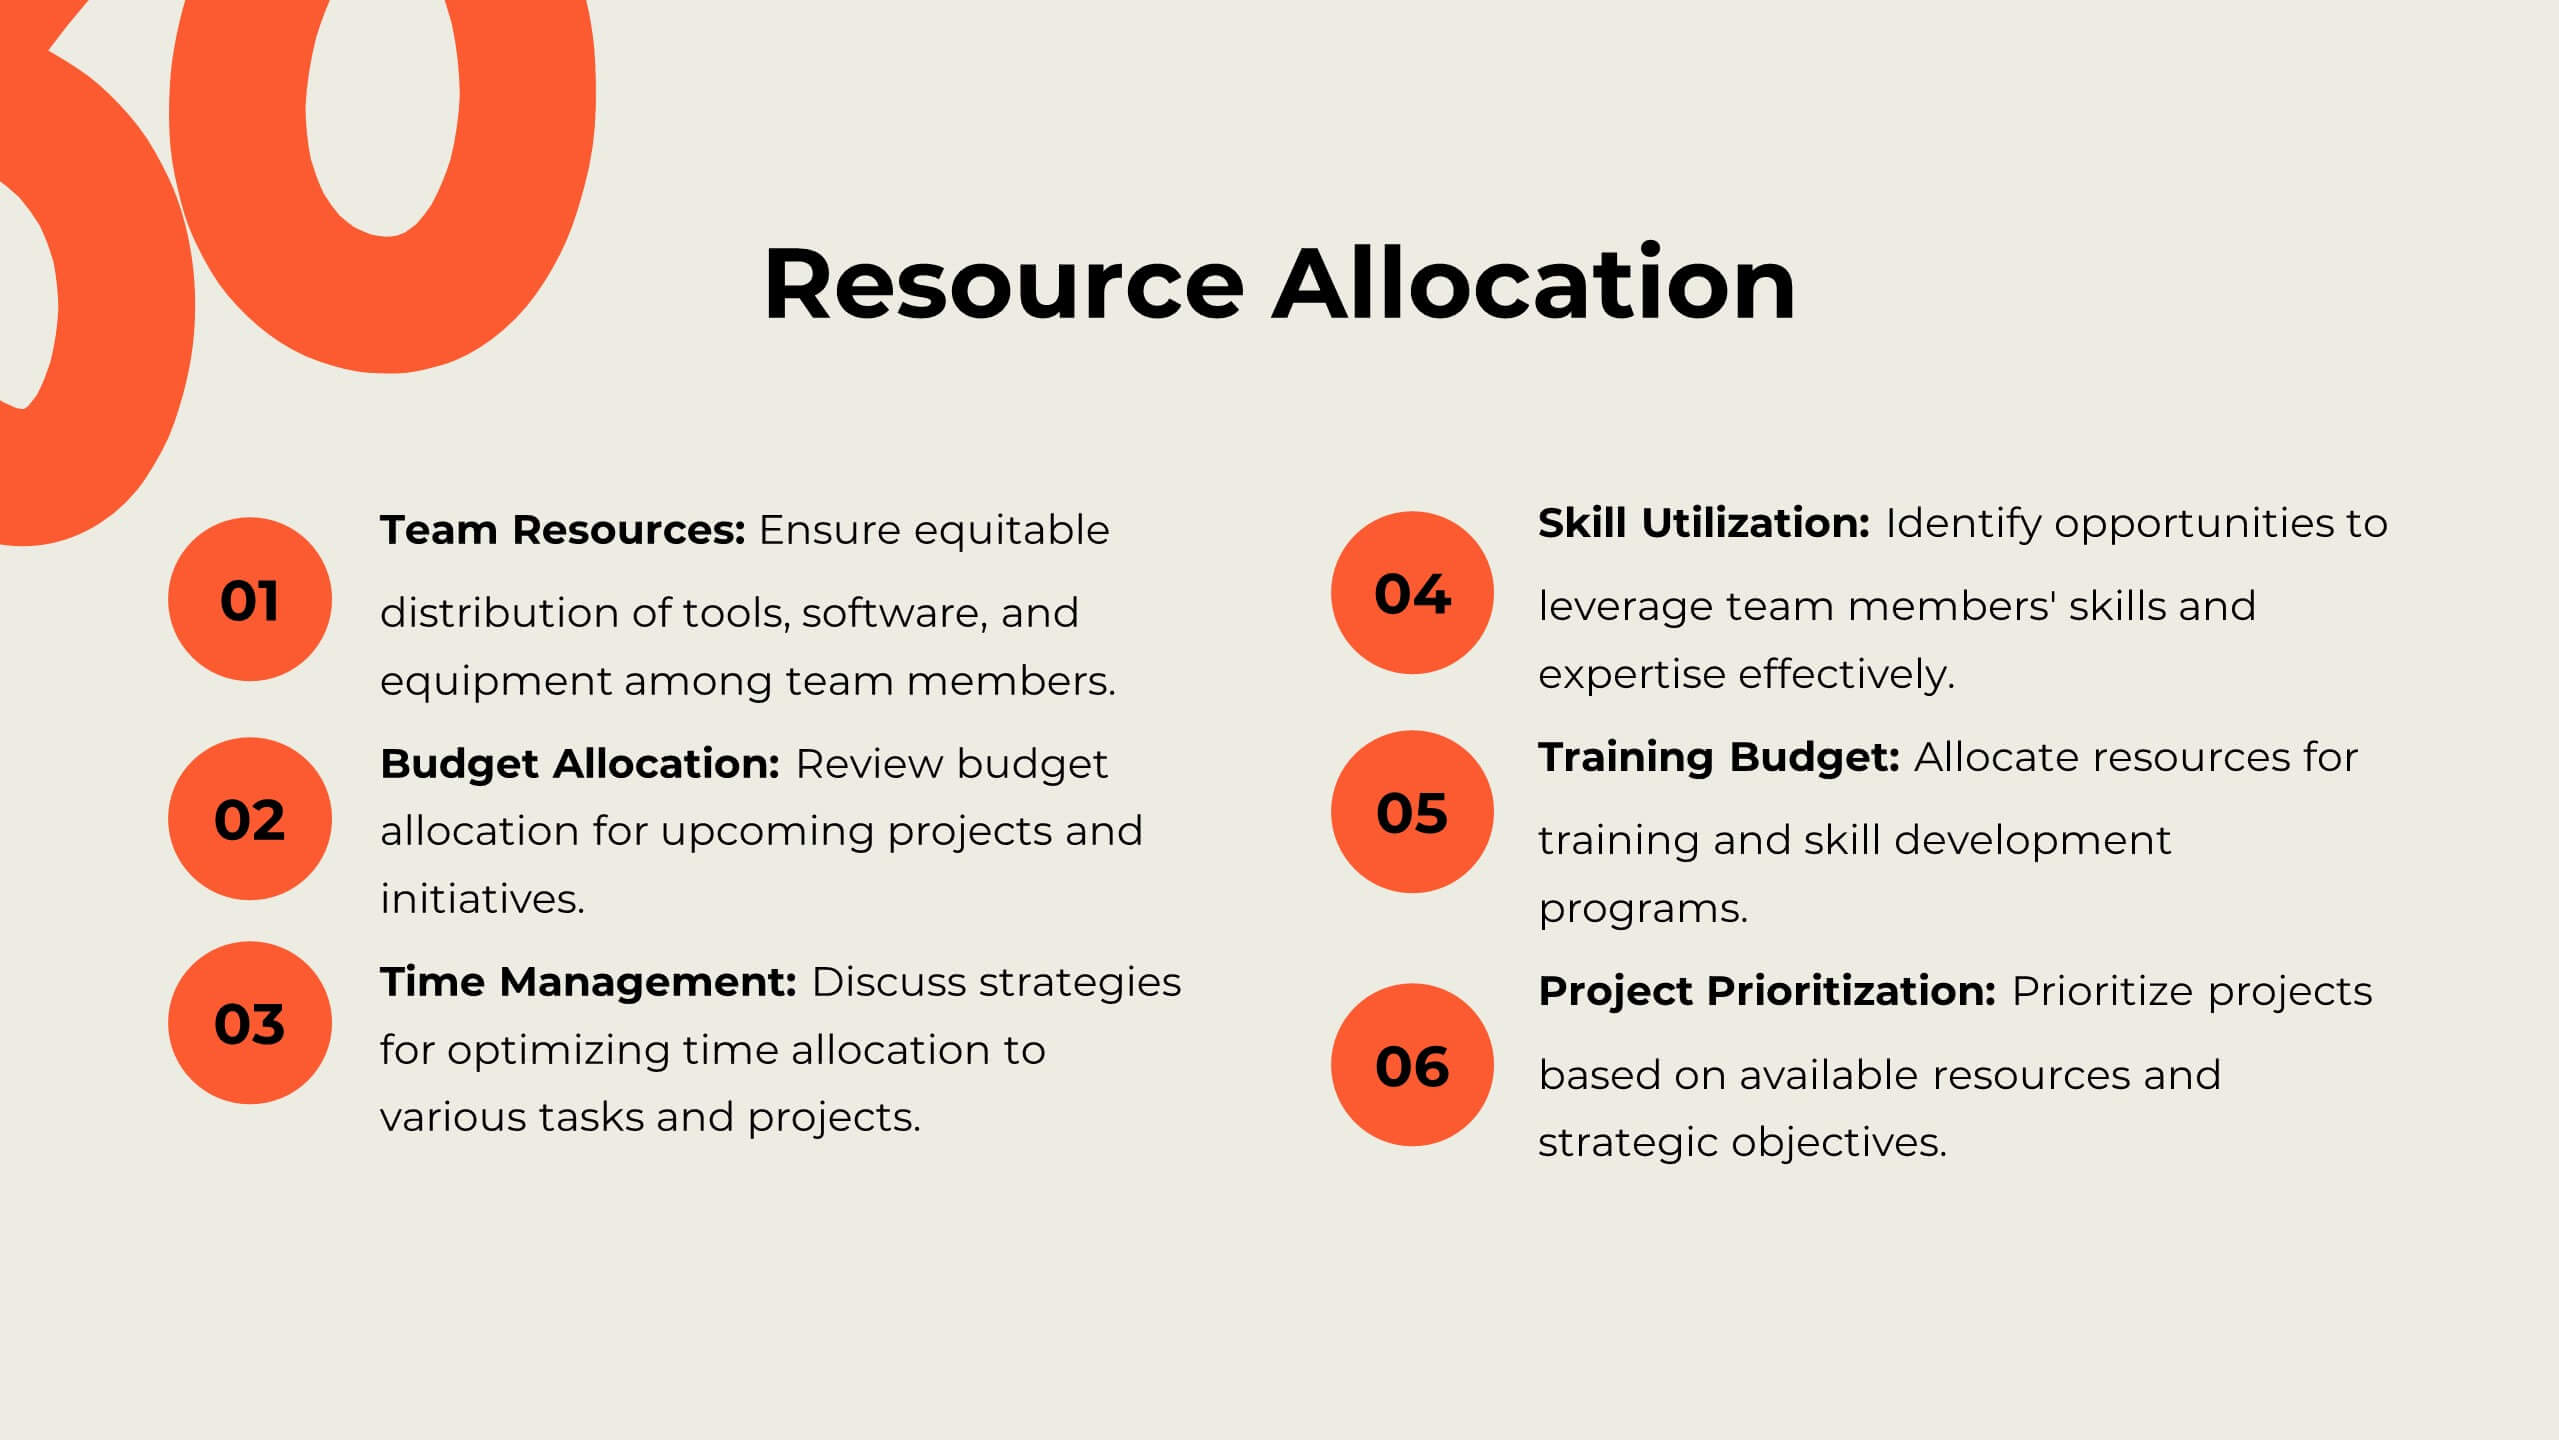
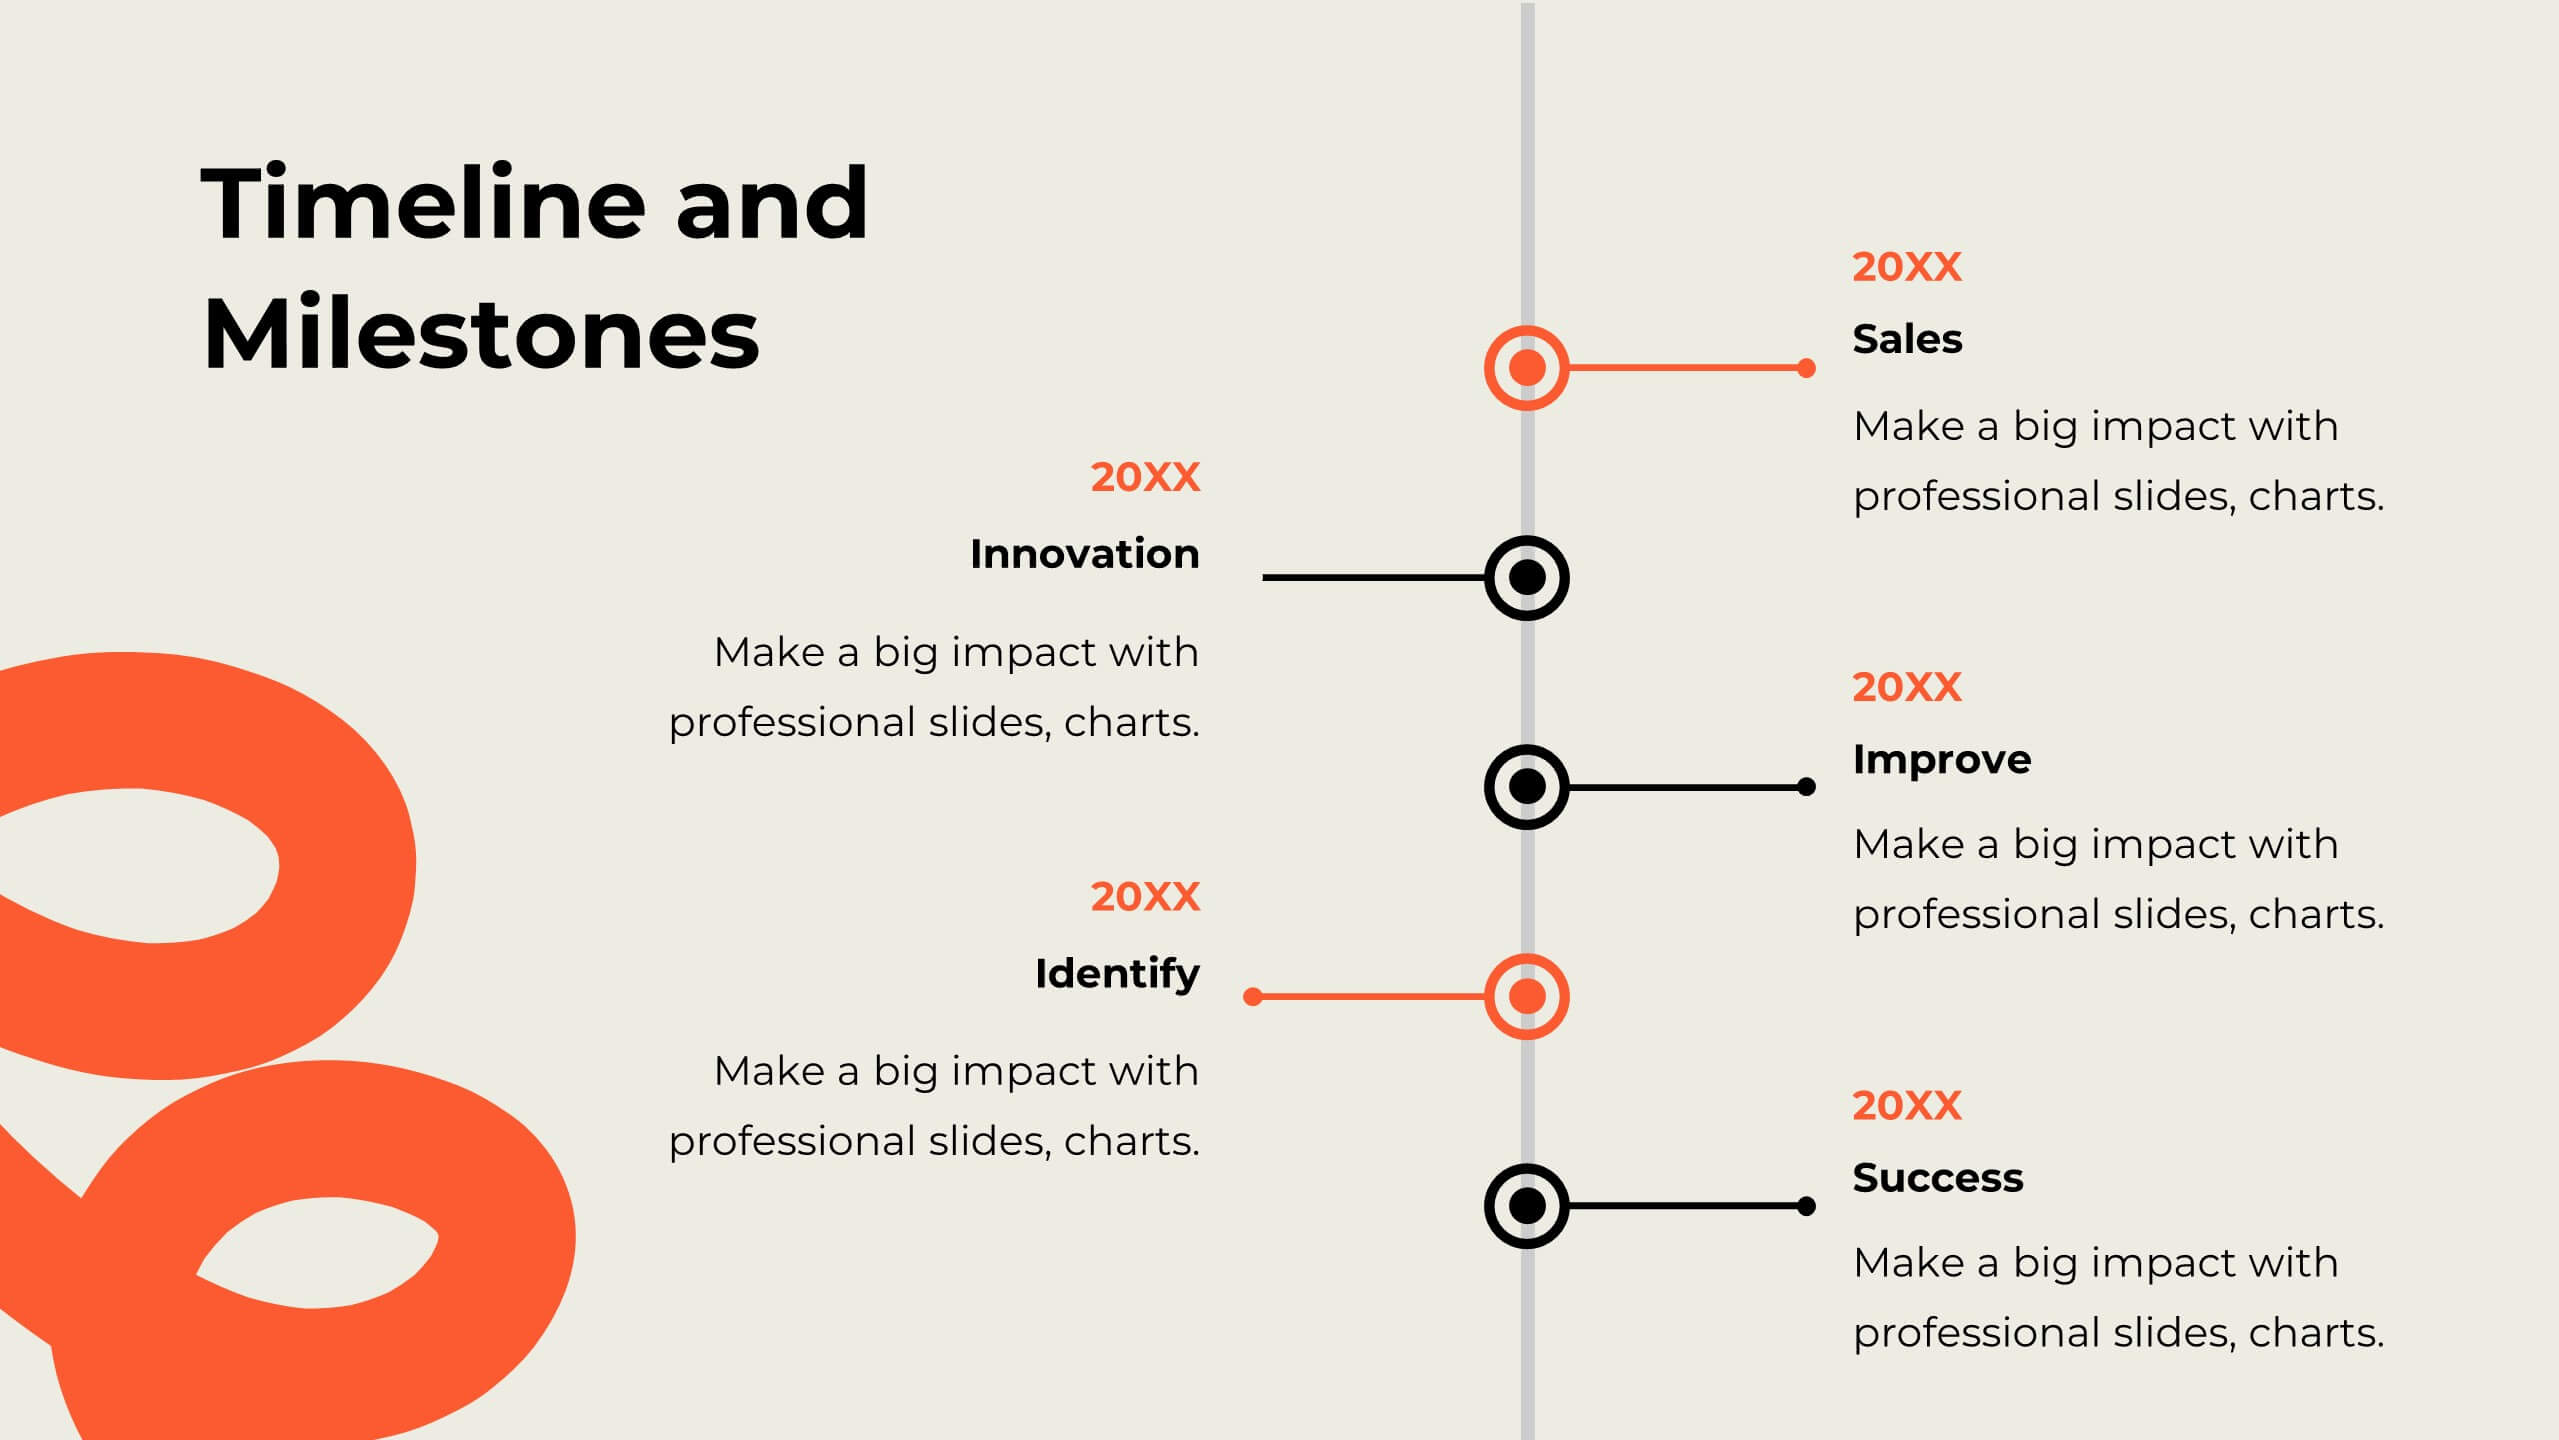
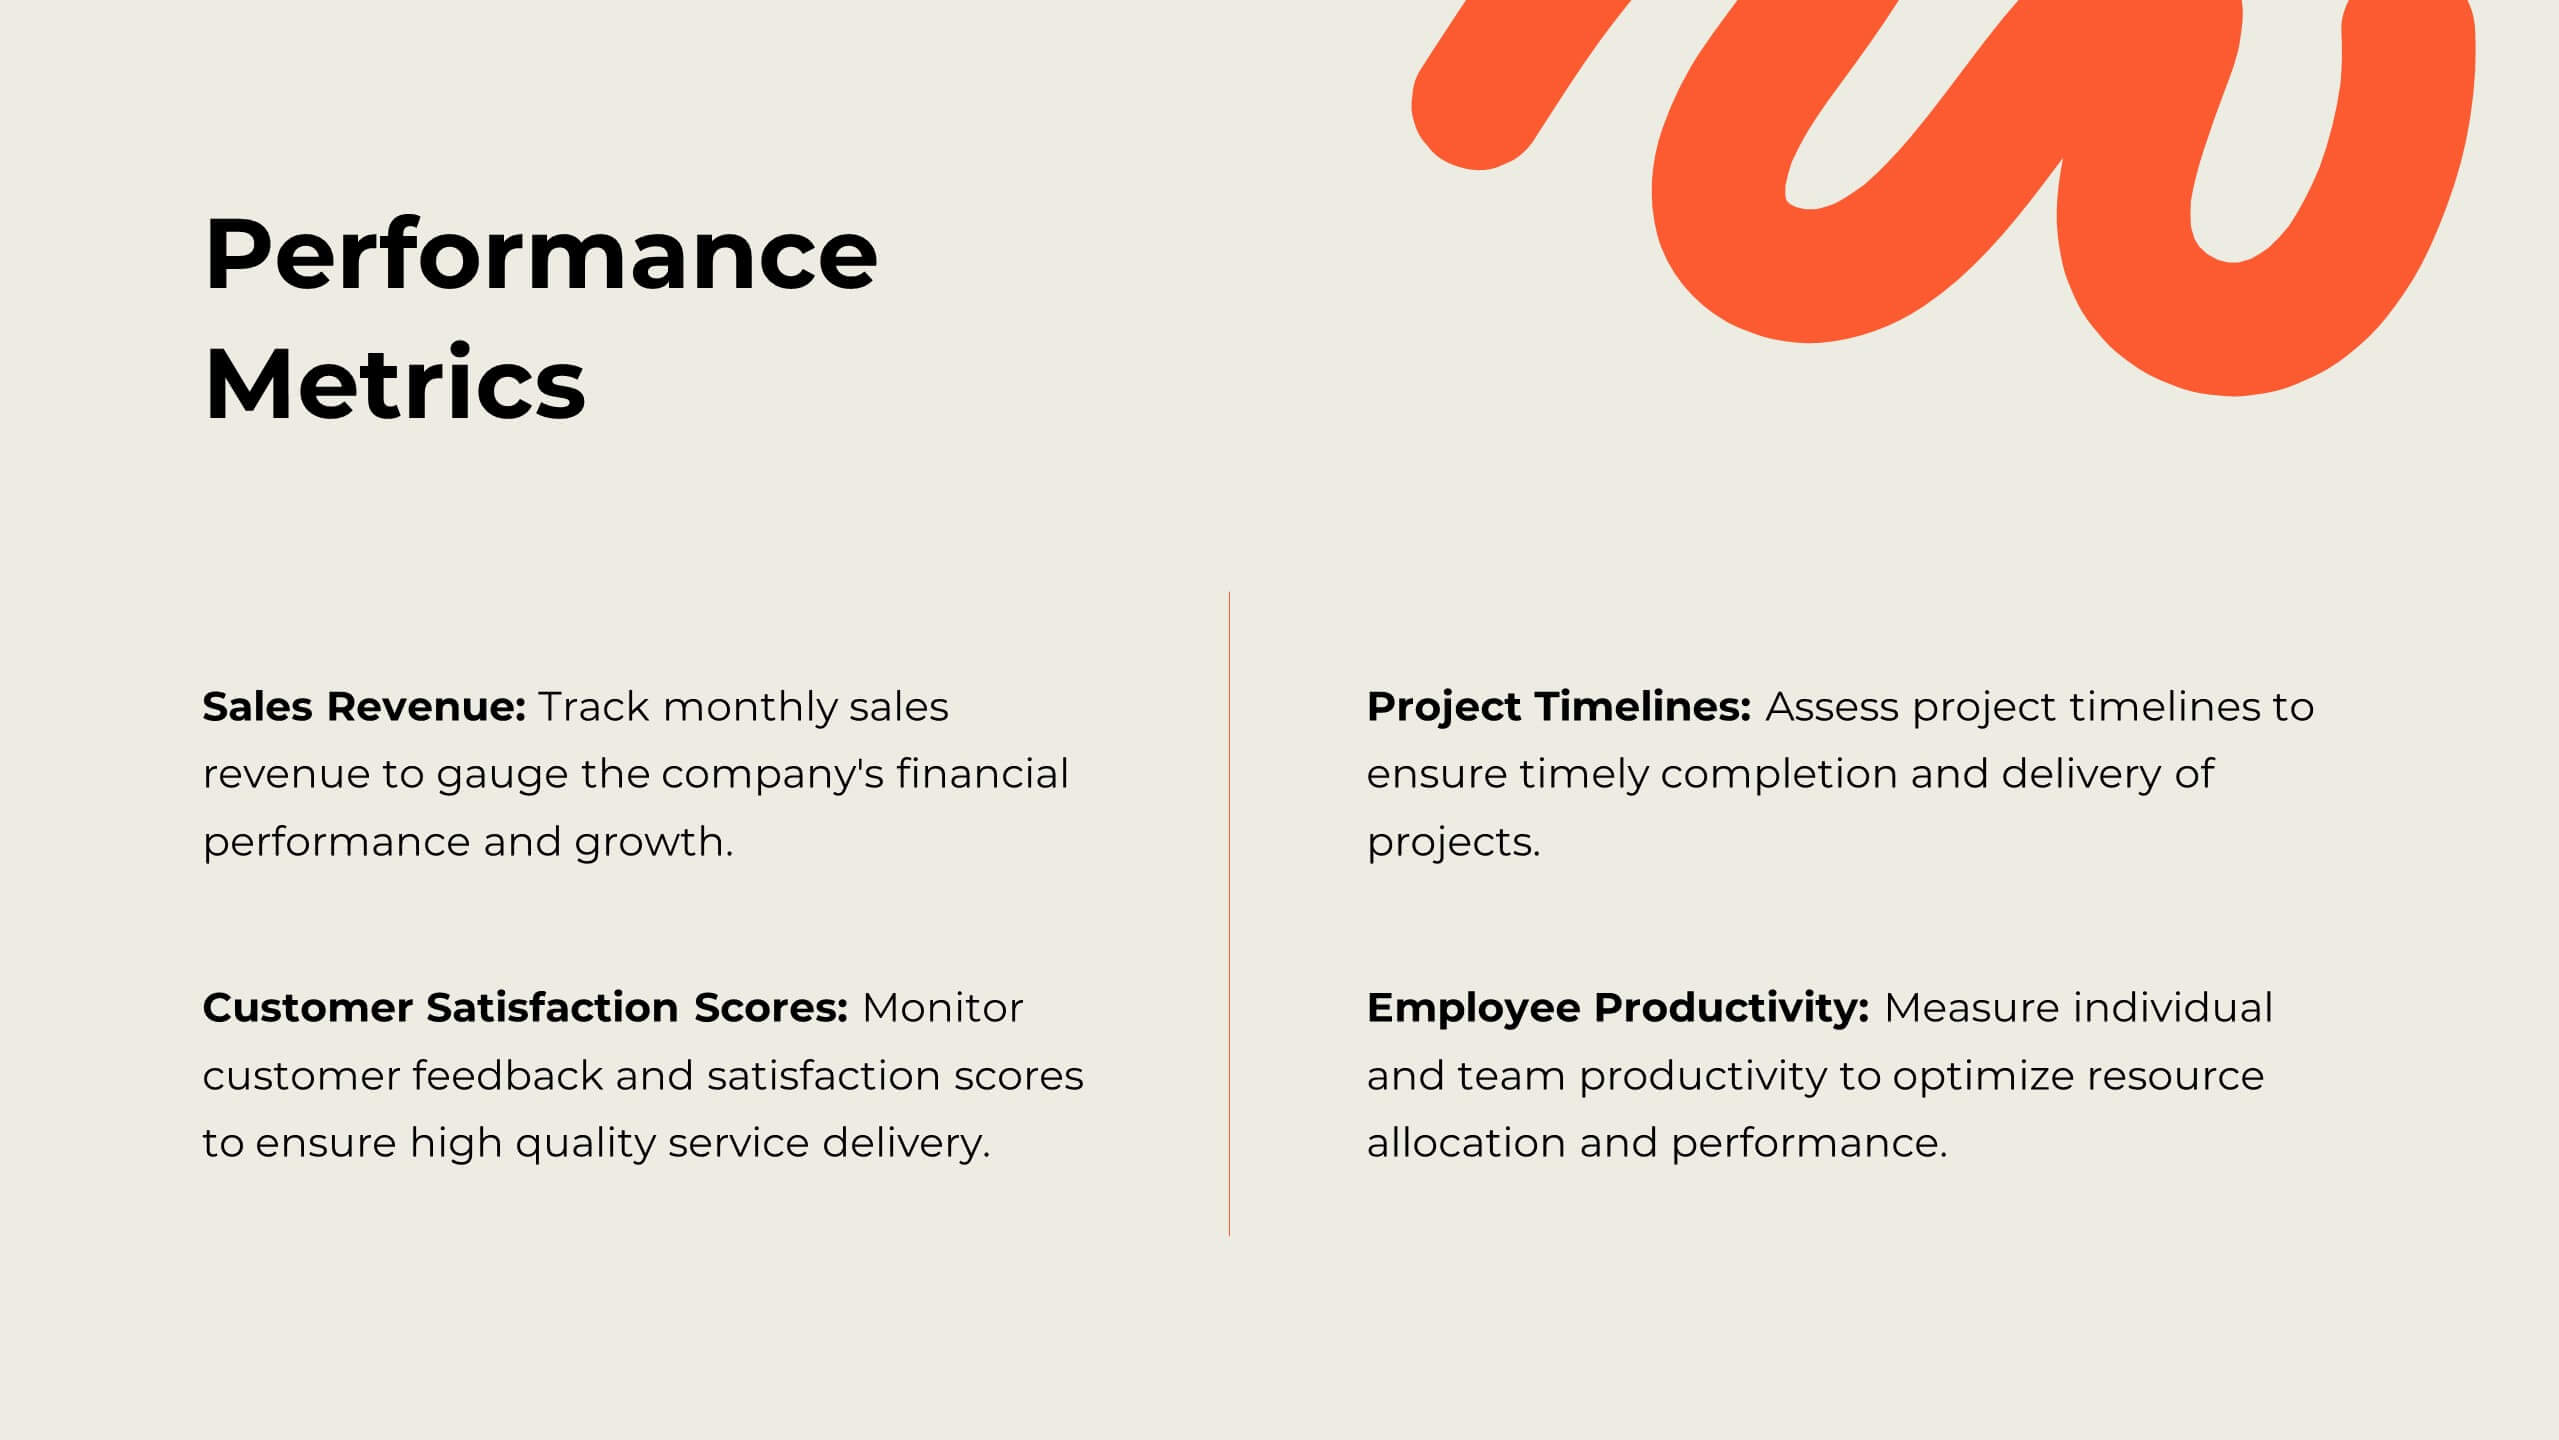
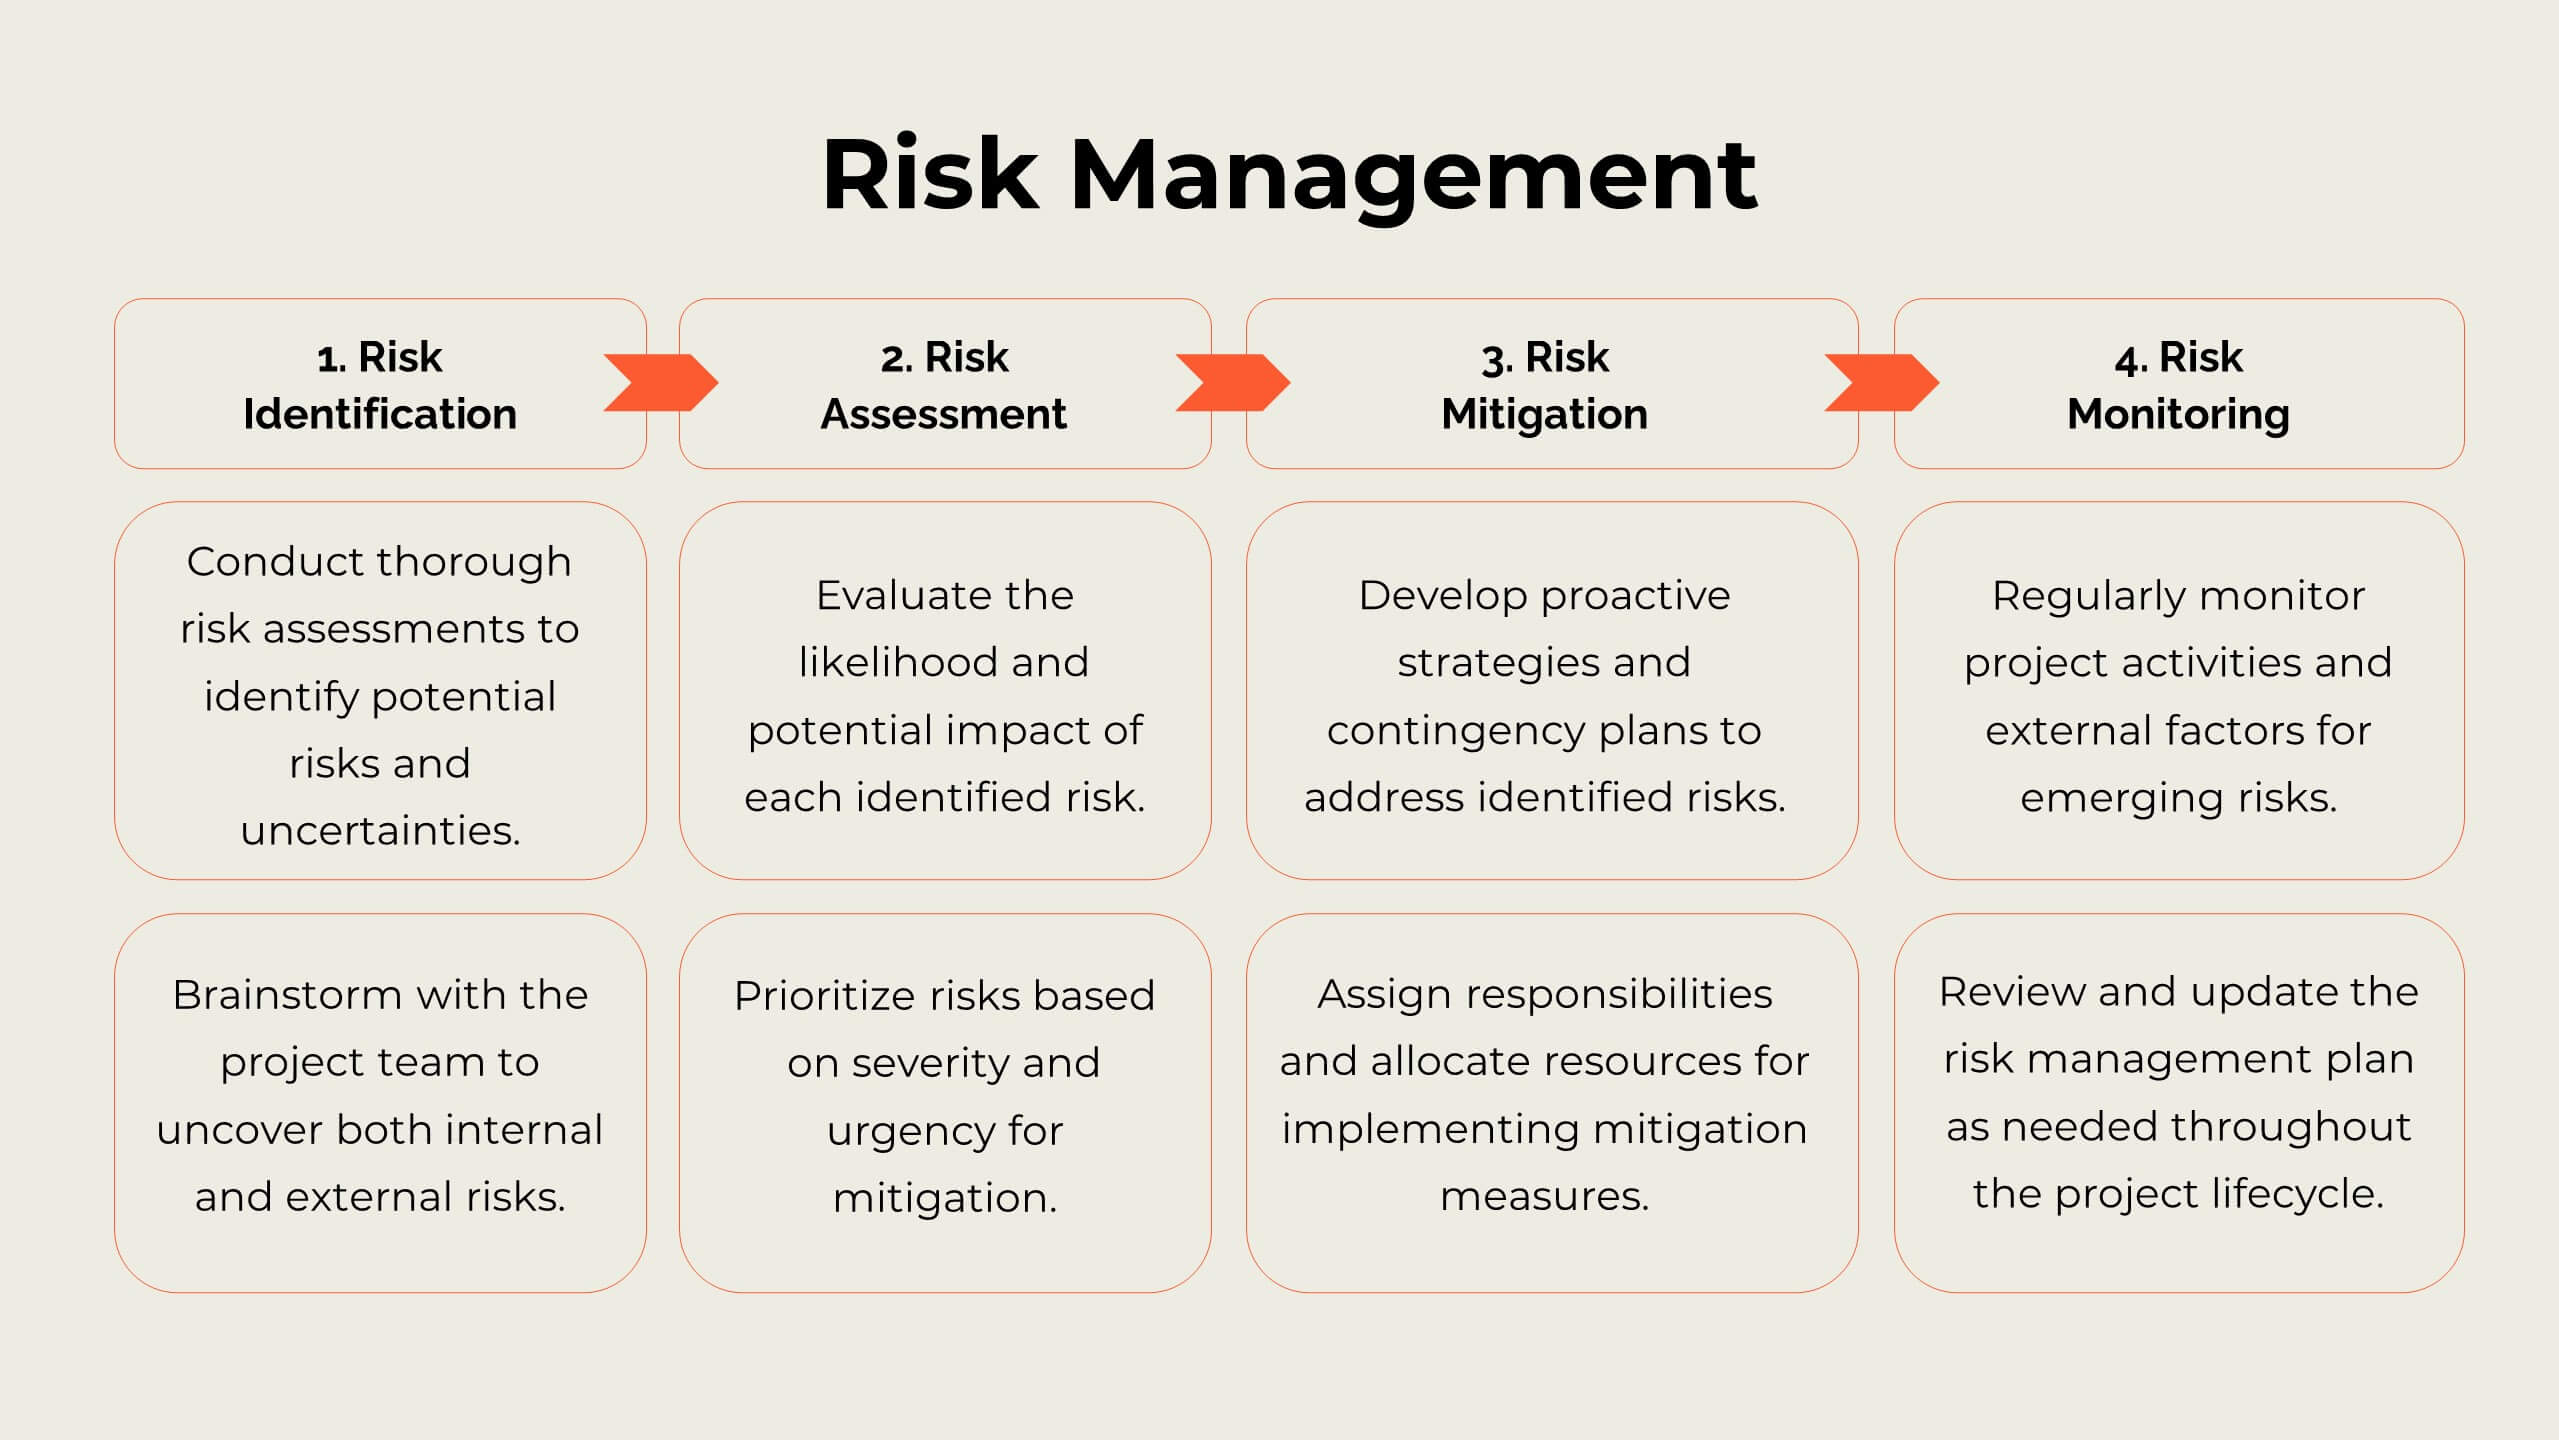
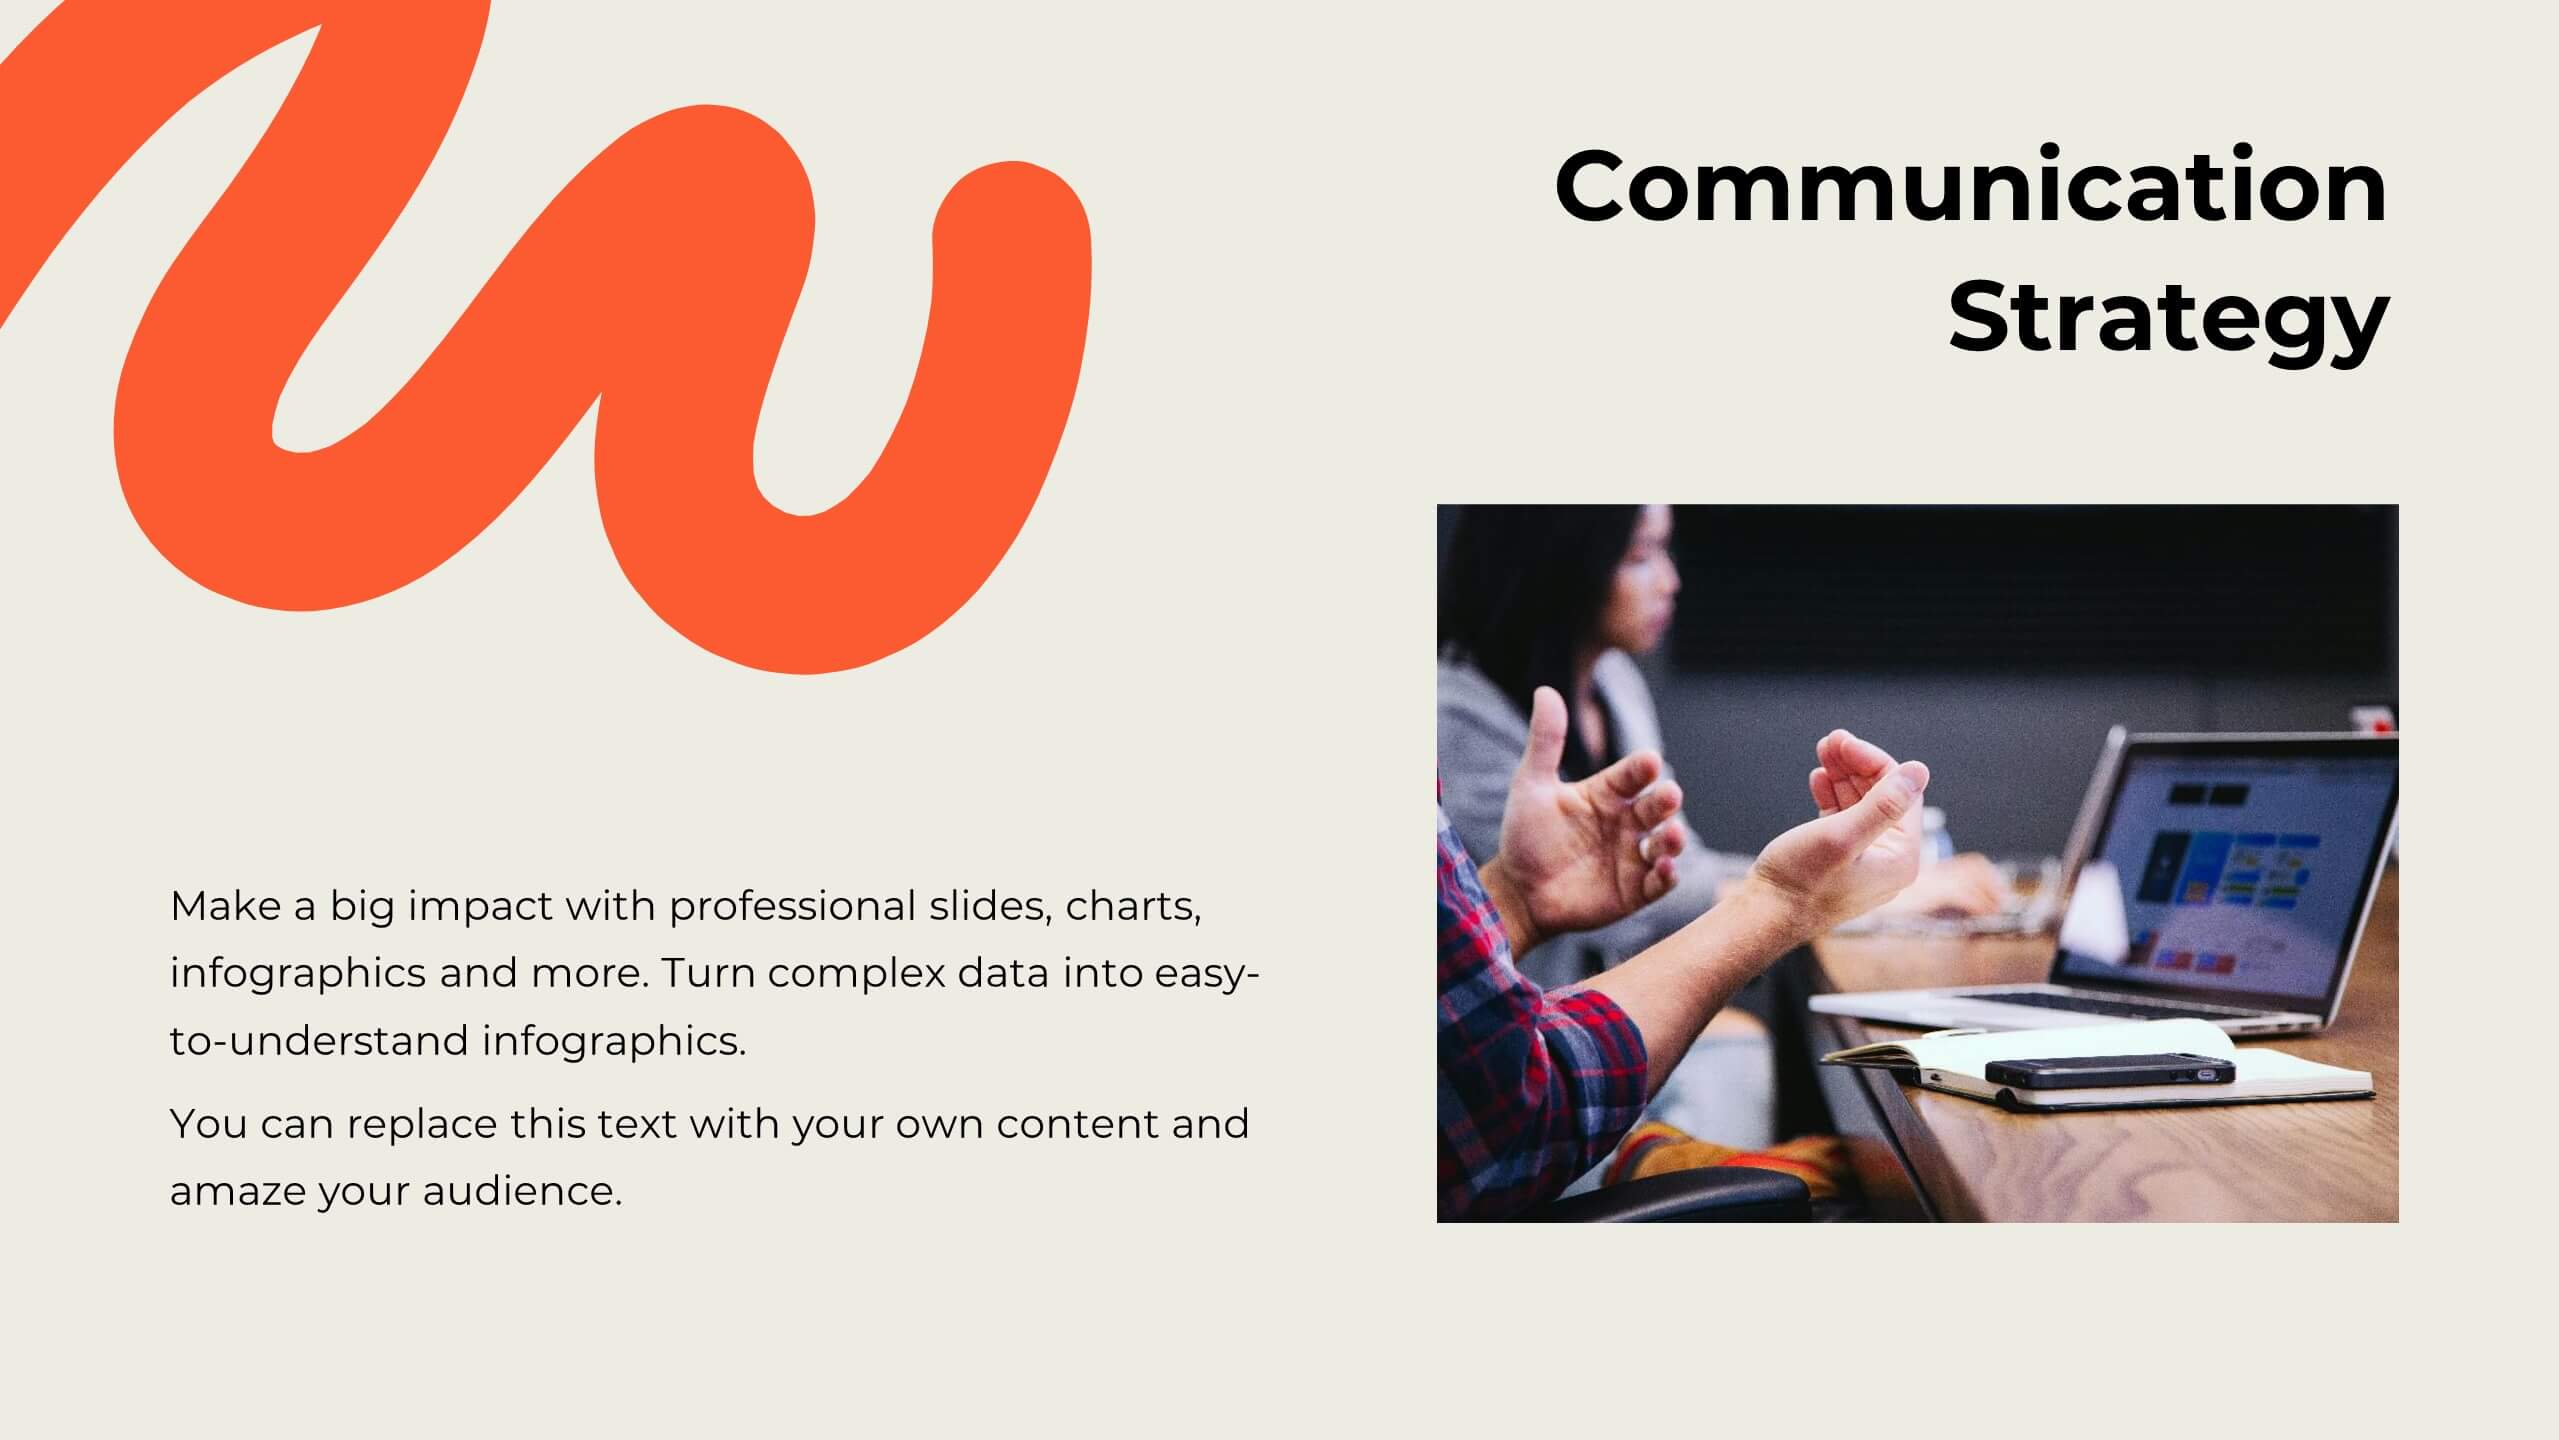
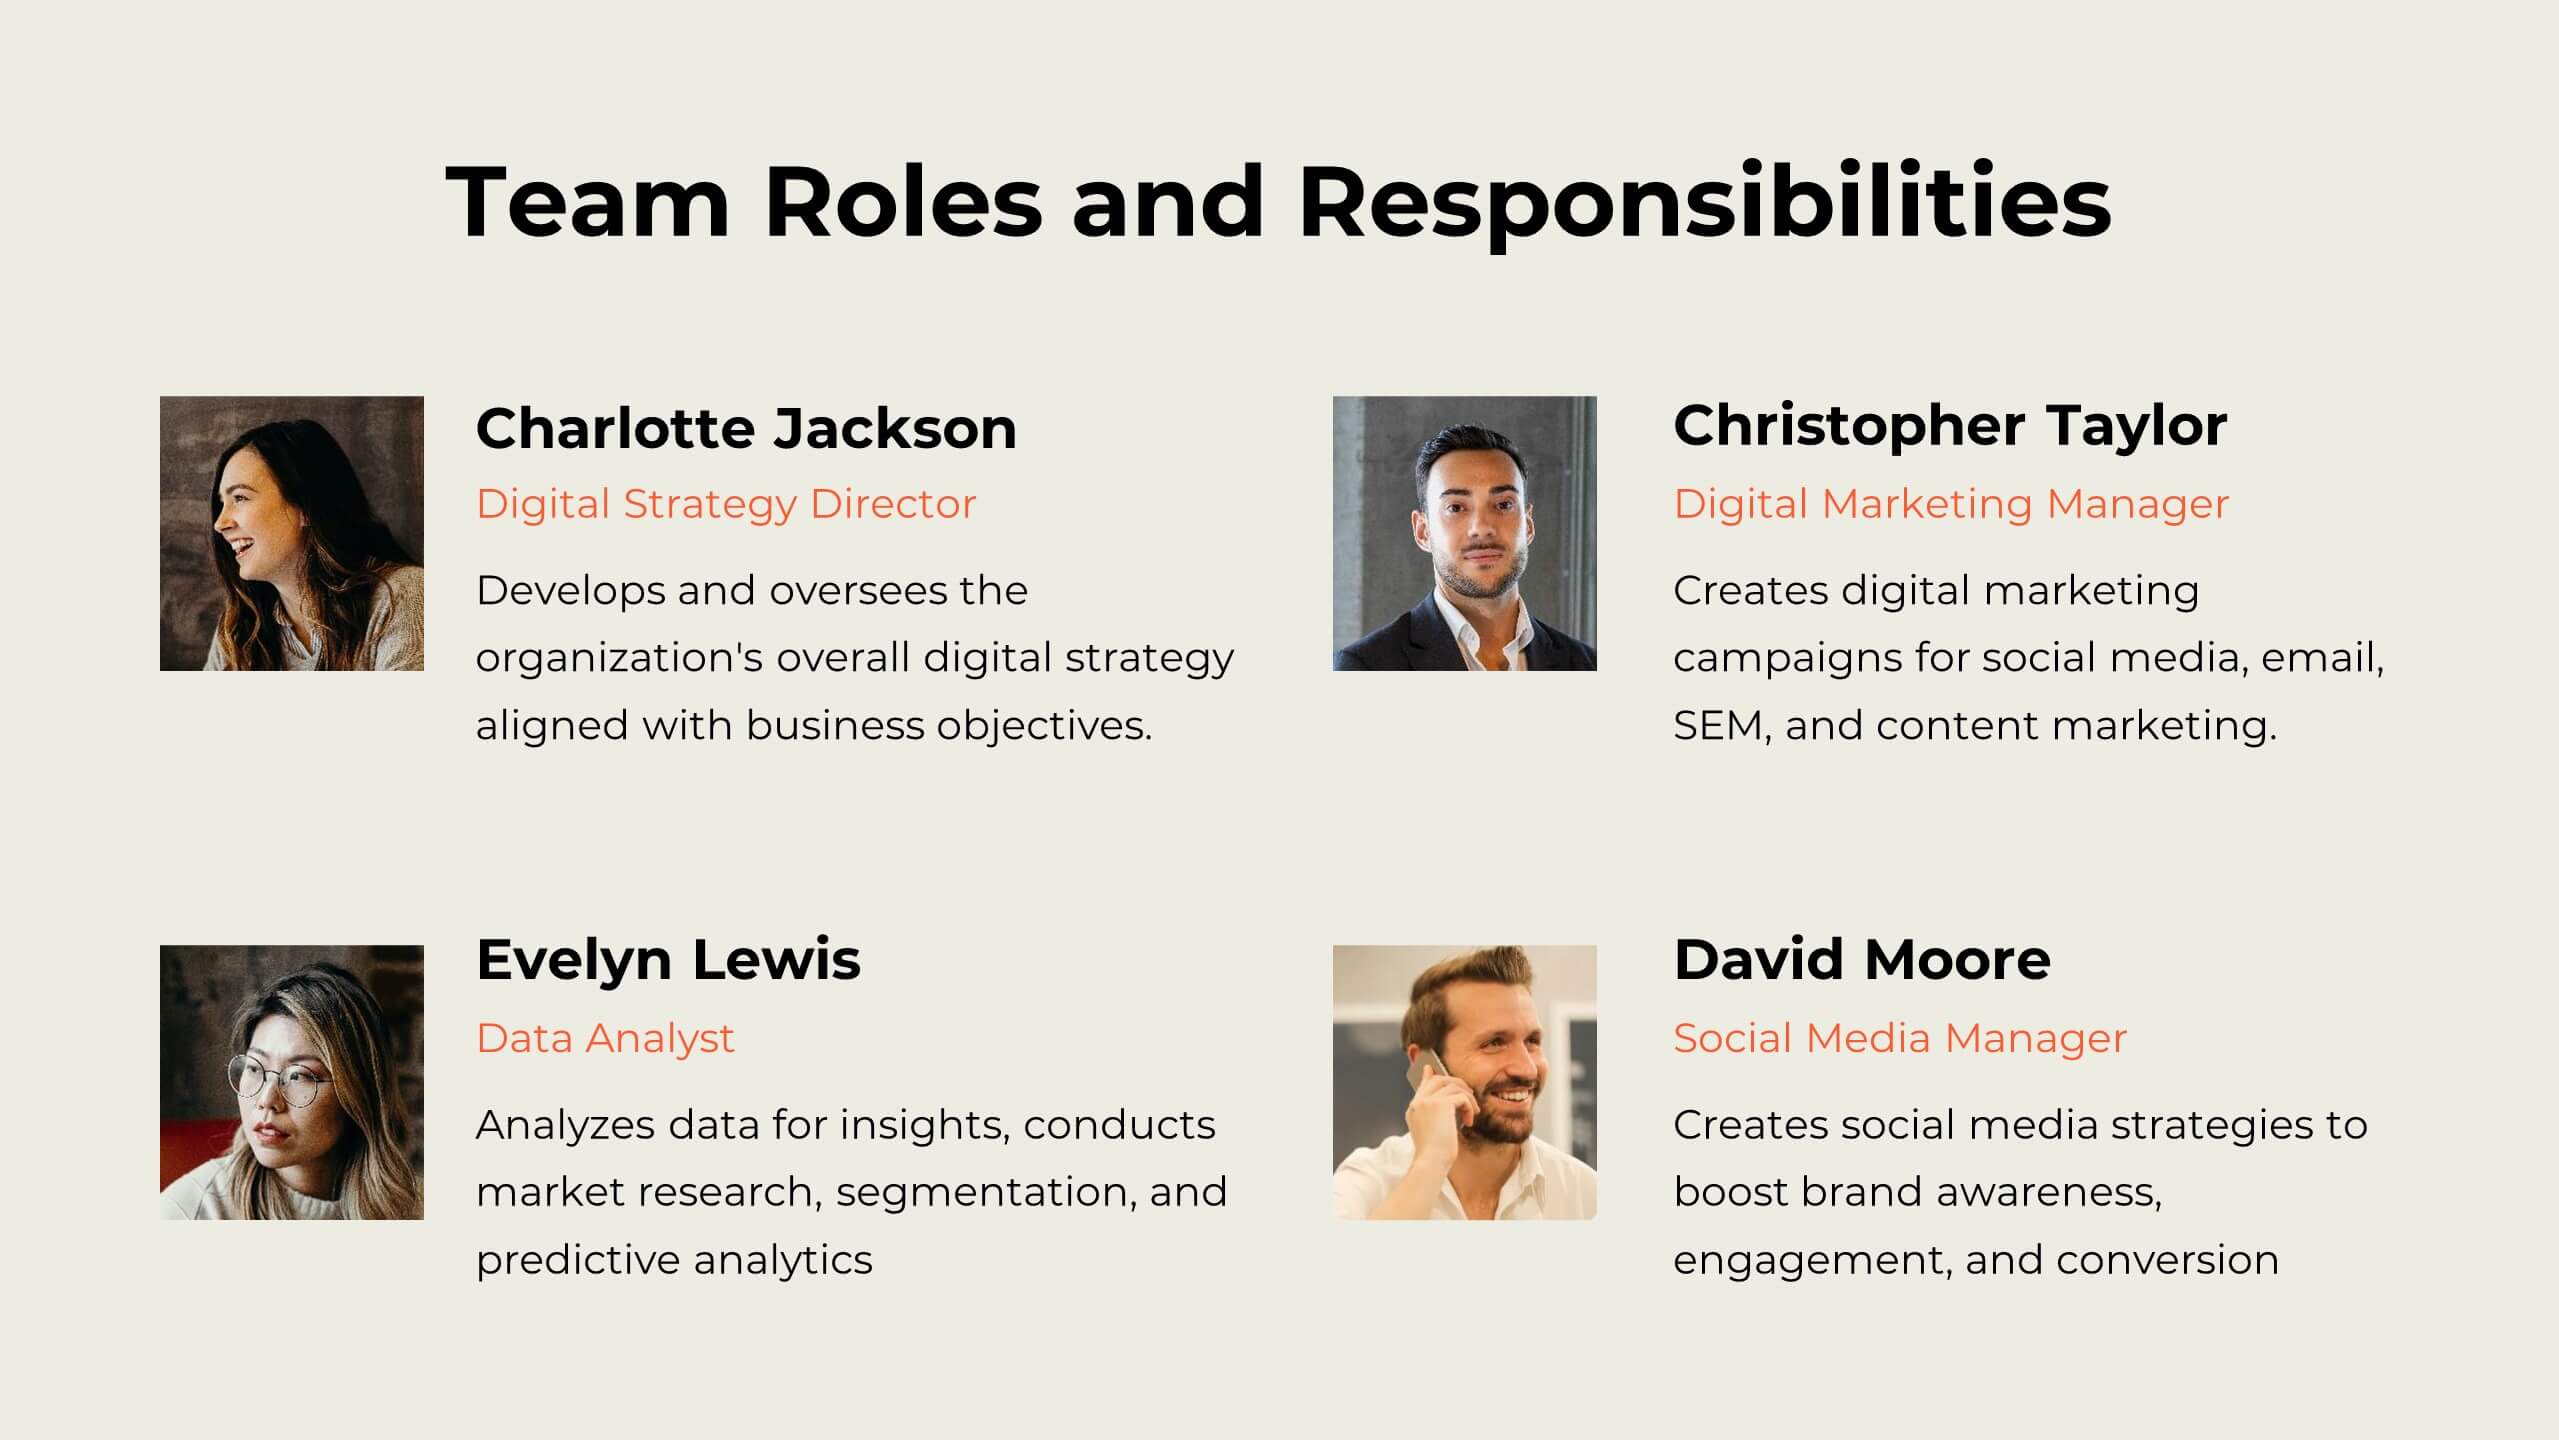
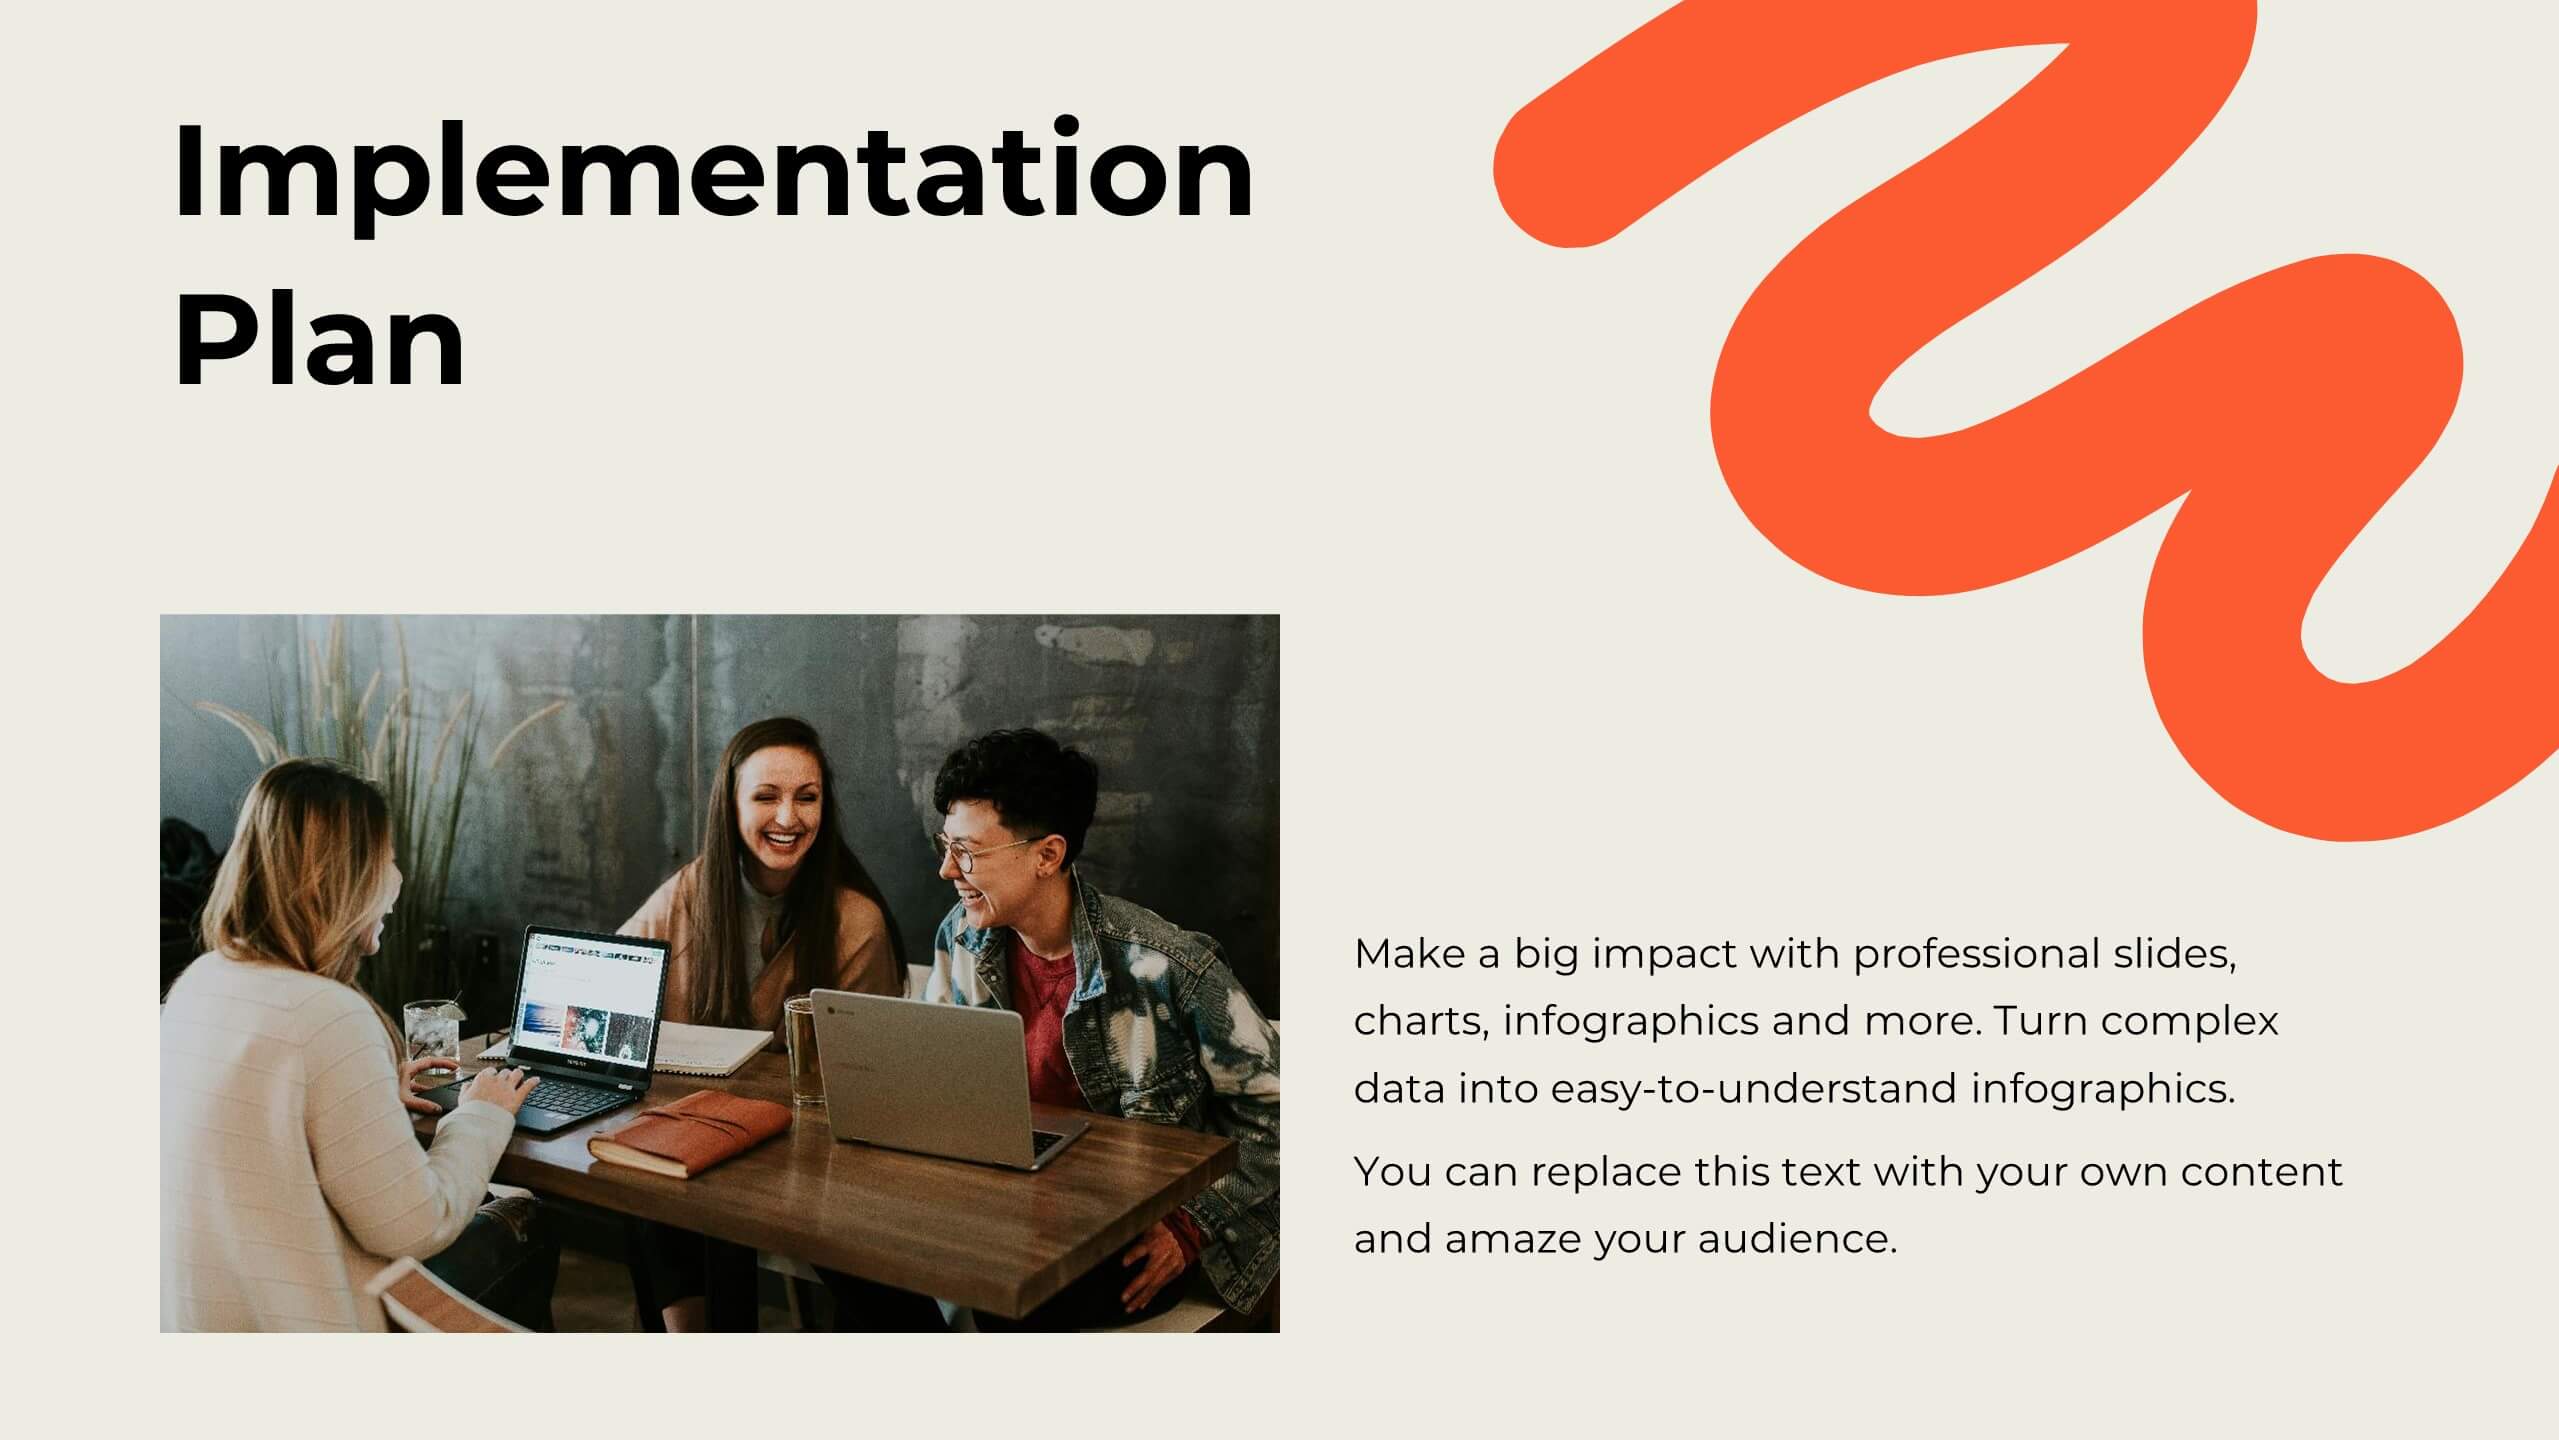
Mirage Digital Strategy Presentation
Revitalize your marketing efforts with this dynamic strategy plan template! Perfect for outlining objectives, competitive analysis, and target audience identification, it includes slides for SWOT analysis, resource allocation, and implementation plans. Engage stakeholders with vibrant visuals and comprehensive content. Compatible with PowerPoint, Keynote, and Google Slides for seamless presentations on any platform.


26 diapositivas
Melo Presentation Template
Are you looking for a presentation to make your product stand out? Melo is a beautifully elegant presentation with modern elements and light neutral color palette. Perfect for furniture brands, or any one looking for a modern presentation. These slides include world maps, company slides, mockups and charts perfect for businesses, this template has everything you'll need. It's simple yet chic design makes it stand out and at the same time keep your audience engaged. This is the perfect choice for businesses, brands or anyone who needs to make a great looking template on their next presentation


4 diapositivas
Company Long-Term Vision Presentation
Craft your company's roadmap with our "Company Long-Term Vision" presentation template. This design lets you vividly showcase your strategic direction and future goals through a modern, image-centric layout. Ideal for board meetings and stakeholder briefings, it supports PowerPoint, Keynote, and Google Slides, ensuring you can reach your audience on any platform. Utilize this template to clearly communicate your vision and drive your organization forward.


6 diapositivas
Project Milestone and Status Update Presentation
Clearly communicate progress at every project phase with the Project Milestone and Status Update presentation slide. This table-style layout visually breaks down percentage completion across five key stages—Initiation, Planning, Execution, Monitoring, and Closing—making it ideal for status meetings, project reviews, or executive reports. Color-coded for easy reference and fully customizable in PowerPoint, Keynote, and Google Slides.


7 diapositivas
Technology Consulting Infographic
Technology consulting, also known as IT consulting or tech consulting, involves providing expert advice and guidance to organizations regarding their technology strategy, utilization, and optimization. This infographic template provides a compelling way to illustrate complex concepts, strategies, and data related to technology consulting. Fully customizable and compatible with Powerpoint, Keynote, and Google Slides. The sleek, modern design reflects the cutting-edge nature of technology and consulting services. This infographic is your go-to tool for creating presentations that showcase your technology consulting expertise.


4 diapositivas
Psychological Drivers in Consumer Behavior Presentation
Unlock deeper insights into buyer motivations with the Psychological Drivers in Consumer Behavior Presentation. This visually compelling template highlights four key drivers influencing decision-making, from logic to emotion. Perfect for marketing strategies, brand positioning, and behavioral research. Fully editable in Canva, PowerPoint, Google Slides, and Keynote.


19 diapositivas
Kinetic Sales Forecast Presentation
Forecast your sales with style using this vibrant template! Perfect for detailing company overview, sales process, team, and strategy. Includes sections for case studies, pricing, and future opportunities. Ideal for sales teams to impress stakeholders. Compatible with PowerPoint, Keynote, and Google Slides.


21 diapositivas
Slumbera Product Roadmap Presentation
Plan and showcase your product strategy with this clean and professional template. Cover key aspects such as product overview, target market, competitive analysis, and marketing strategy to align stakeholders and drive success. Fully customizable and compatible with PowerPoint, Keynote, and Google Slides.


5 diapositivas
Science Branches Infographics
Science is a vast and diverse field that encompasses several branches or disciplines, each focusing on different aspects of the natural world, physical phenomena, and the study of living organisms. These infographic templates are perfect for presenting the diverse fields of science and their significant contributions to our understanding of the world. Use these infographics to deliver a presentation on science education, scientific research, or the interdisciplinary nature of science. This template will help you visually communicate the information, engage your audience, and create an impactful presentation experience.


20 diapositivas
Milky Way Design Portfolio Presentation
The Milky Way Design Portfolio template is your ultimate tool for showcasing your creative work with elegance and professionalism. This template combines soft pastel colors with modern design elements, making your projects stand out. Perfect for designers, artists, and creative professionals, it includes sections like portfolio overview, creative process, collaborations, client testimonials, and more. Each slide is carefully designed to highlight your work, achievements, and services in a visually appealing manner. The layout is clean and minimalistic, ensuring that the focus remains on your content. Whether you're presenting a single project or a diverse range of work, this template adapts effortlessly to your needs. It's fully compatible with PowerPoint, Keynote, and Google Slides, offering flexibility and ease of use across platforms. Impress your audience and potential clients with a portfolio presentation that's as polished and creative as your work itself.


7 diapositivas
Bubble Map Diagram Presentation
A Bubble Map Infographic is a visual representation that uses bubbles to convey information. It is used to display geographic data, such as population density, sales figures, or distribution of resources. In this template the size of the bubbles represents the value of the data being presented, with larger bubbles indicating a higher value. The color of the bubbles may also be used to indicate different categories or levels of the data. This infographic can be customized with different colors, fonts, graphics, text boxes, charts, and other visual aids to suit all your needs.


5 diapositivas
Predictive Analytics with Big Data
Break down complex predictive data processes with this layered diagram designed for big data professionals, analysts, and AI teams. Clearly illustrate multi-level data pipelines and machine learning systems in an engaging, structured format. Fully customizable in PowerPoint, Keynote, and Google Slides.


5 diapositivas
Chemistry Lessons Infographics
Dive into the fascinating world of chemistry with our chemistry lessons infographics. Set against a backdrop of bold orange, black, and blue, this template captures the vibrant essence of chemical reactions and laboratory experiments. Tailored for educators, students, and science enthusiasts, this collection is perfect for enhancing lesson plans, study materials, or research presentations. Compatible with Powerpoint, Keynote, and Google Slides. With its creative, lab-themed design, each infographic is enriched with striking graphics and icons, providing a visual feast that simplifies complex concepts and promotes the joy of learning chemistry.


8 diapositivas
Sales Funnel AIDA Strategy Presentation
Streamline your marketing approach with the Sales Funnel AIDA Strategy Presentation template. Designed to visualize the Attention, Interest, Desire, and Action (AIDA) Model, this engaging funnel graphic effectively illustrates how to guide potential customers through the sales journey. Ideal for marketers, sales teams, and business strategists, this fully customizable template is compatible with PowerPoint, Keynote, and Google Slides.
20 diapositivas
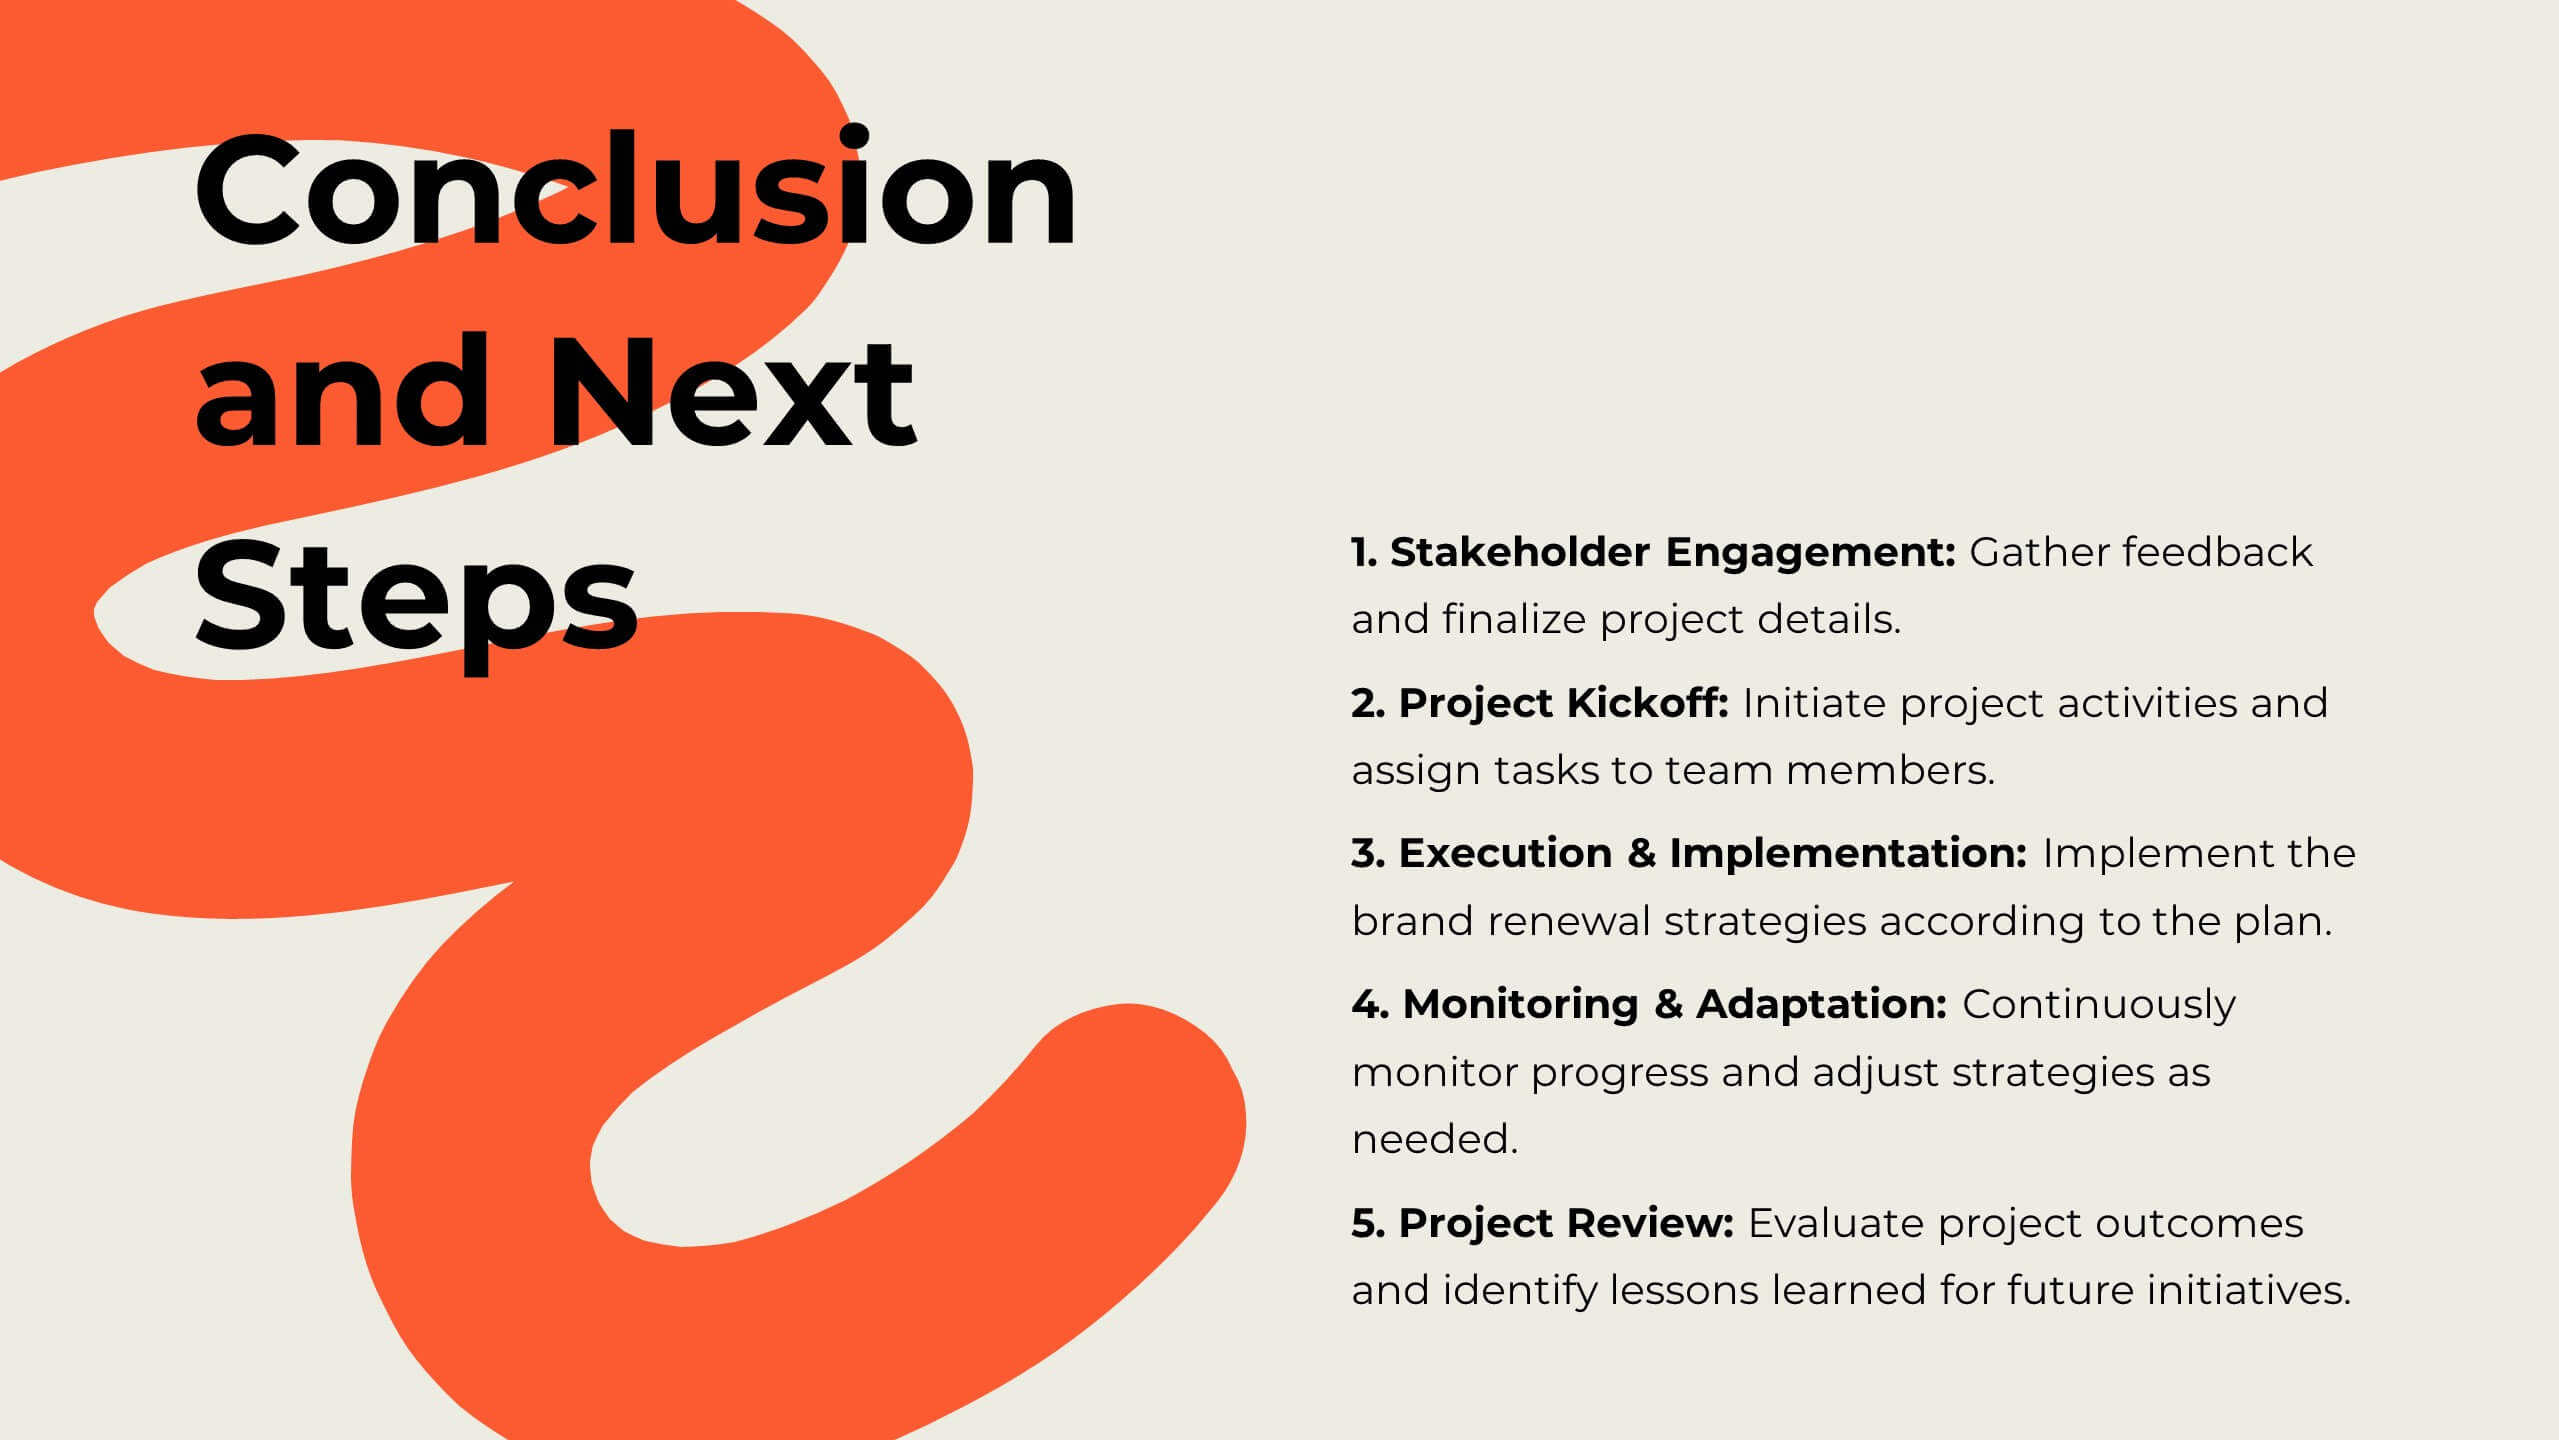
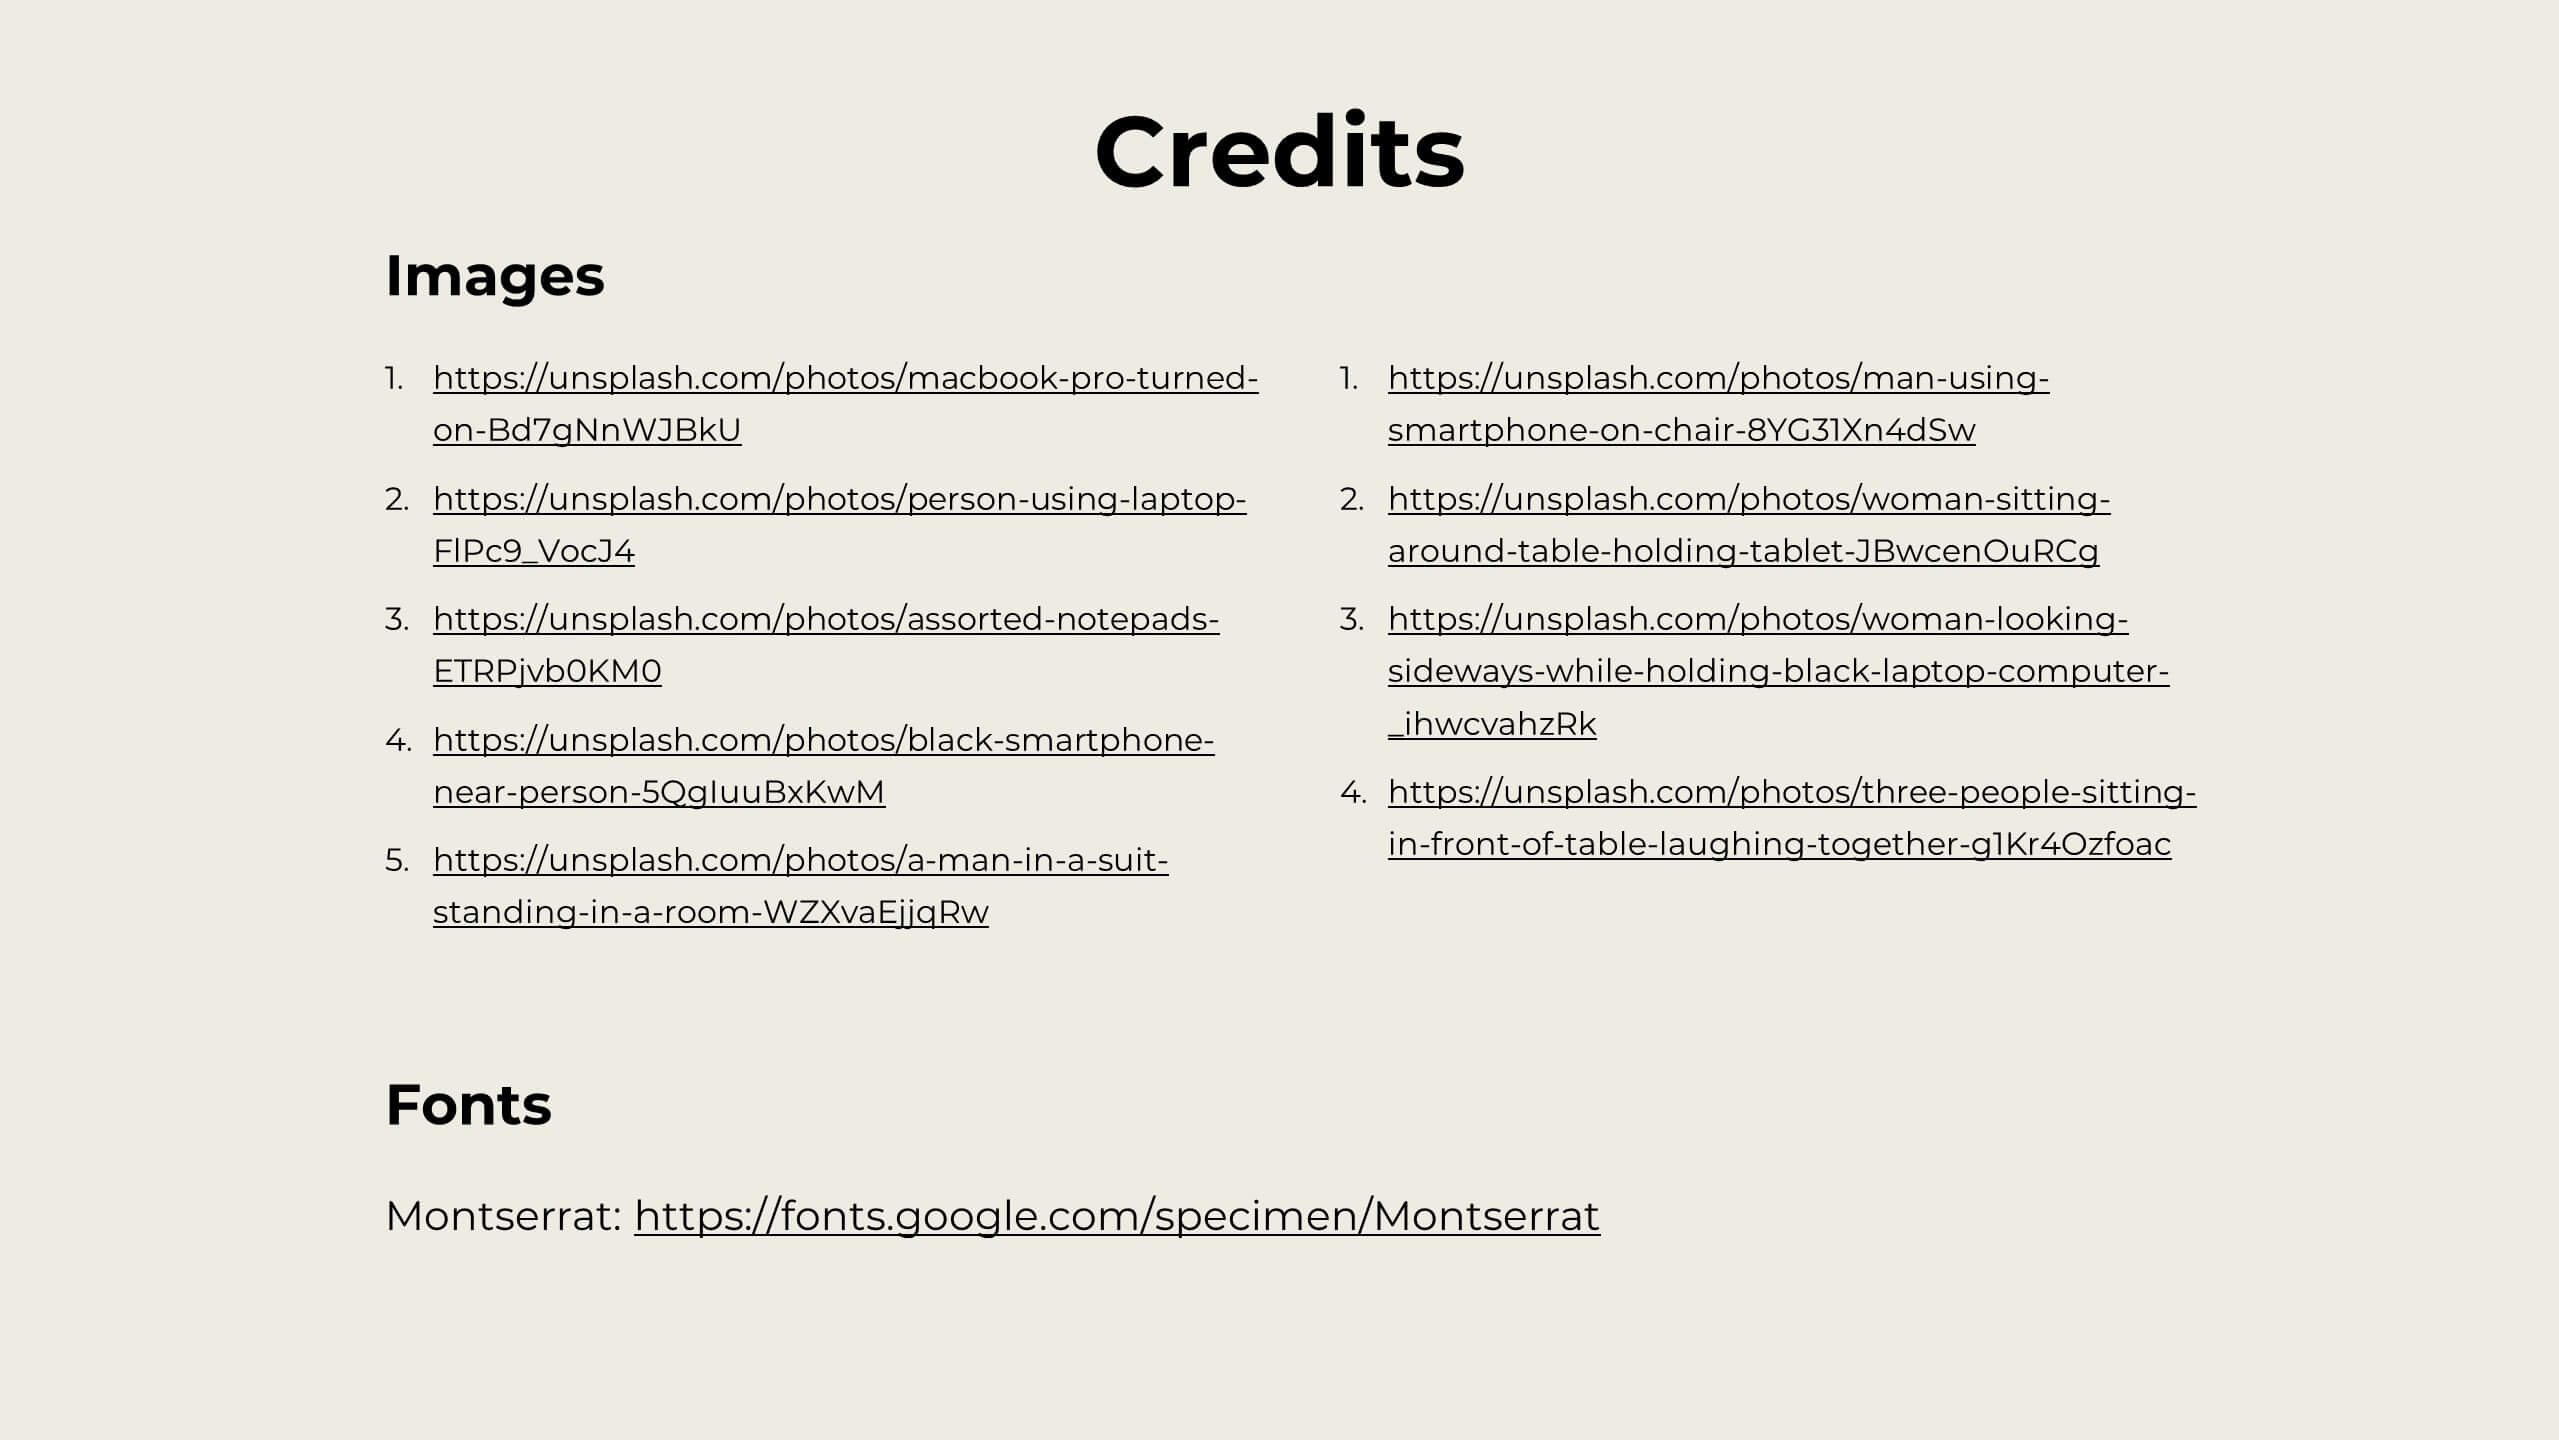
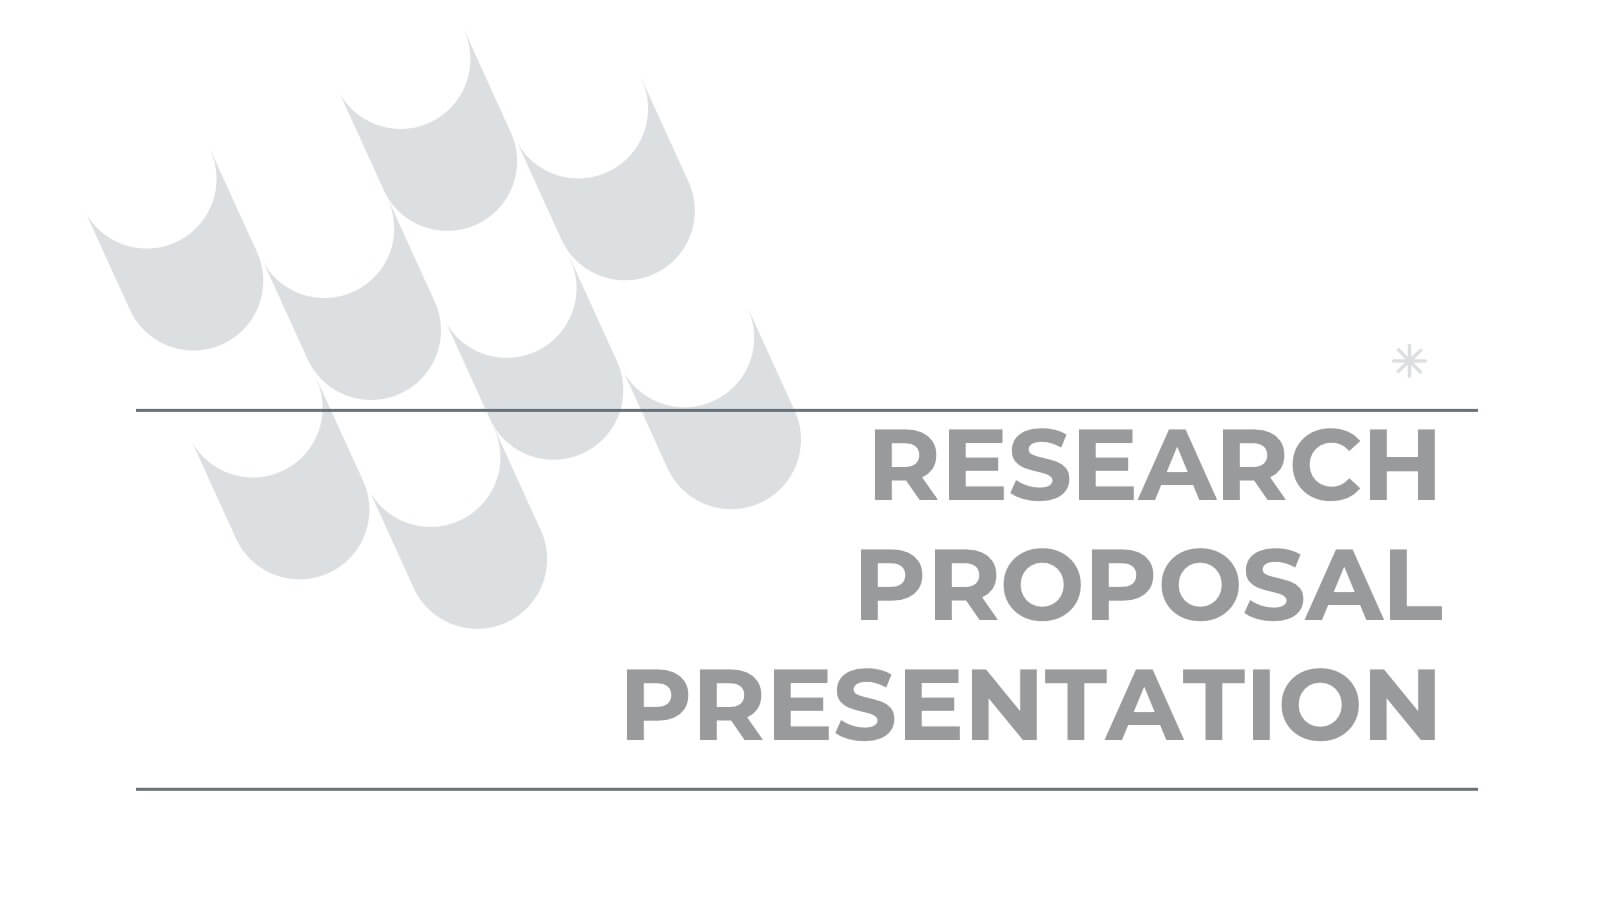
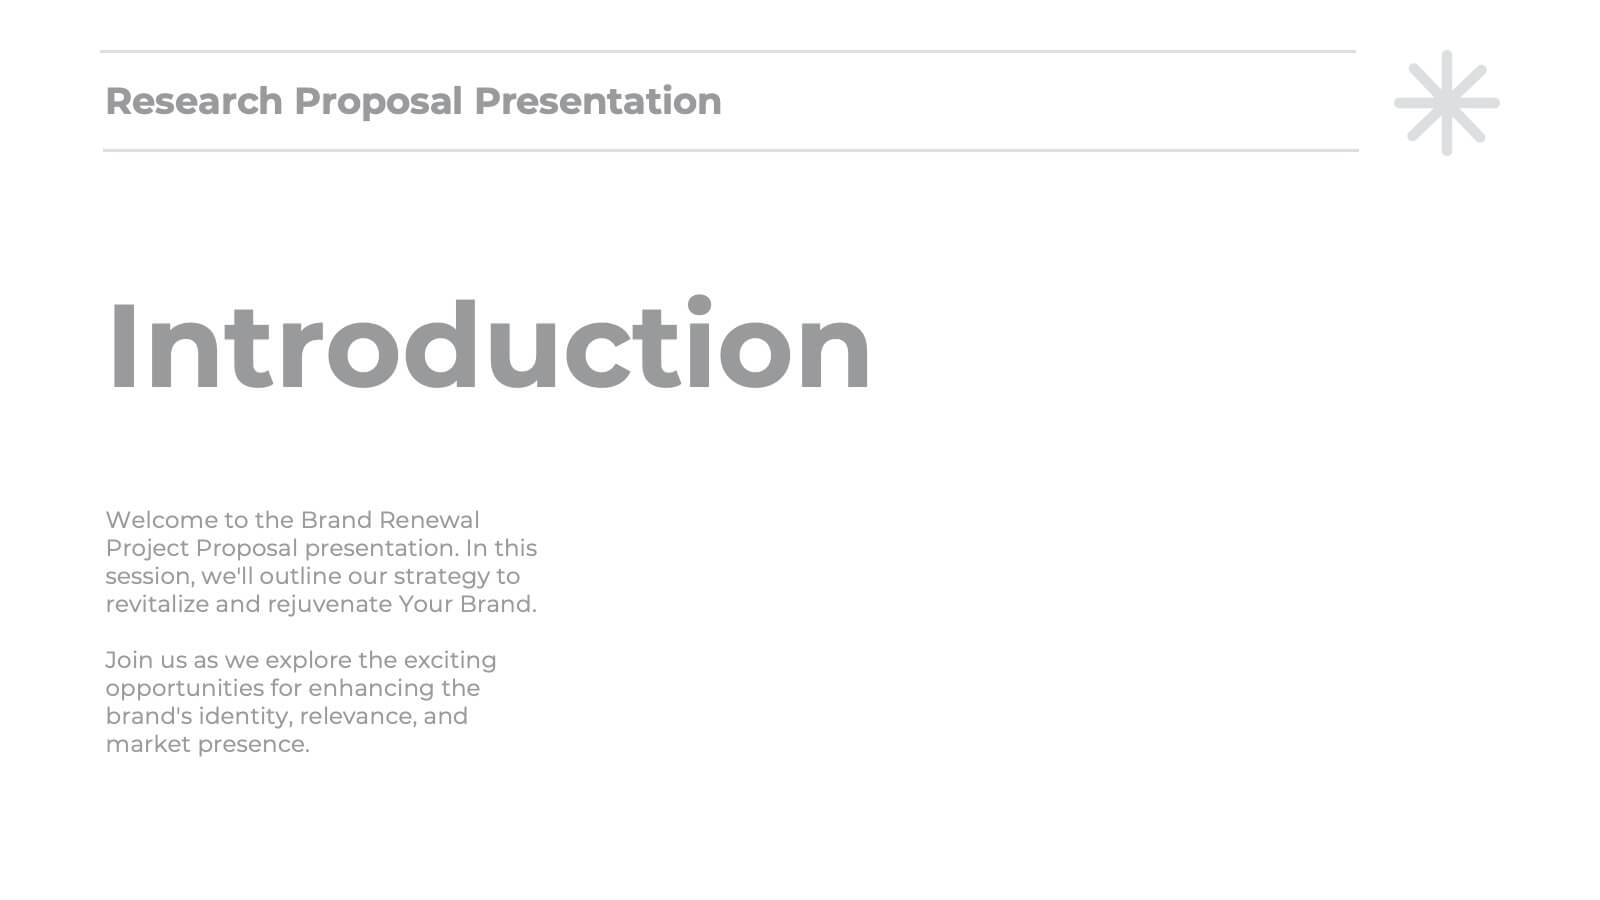
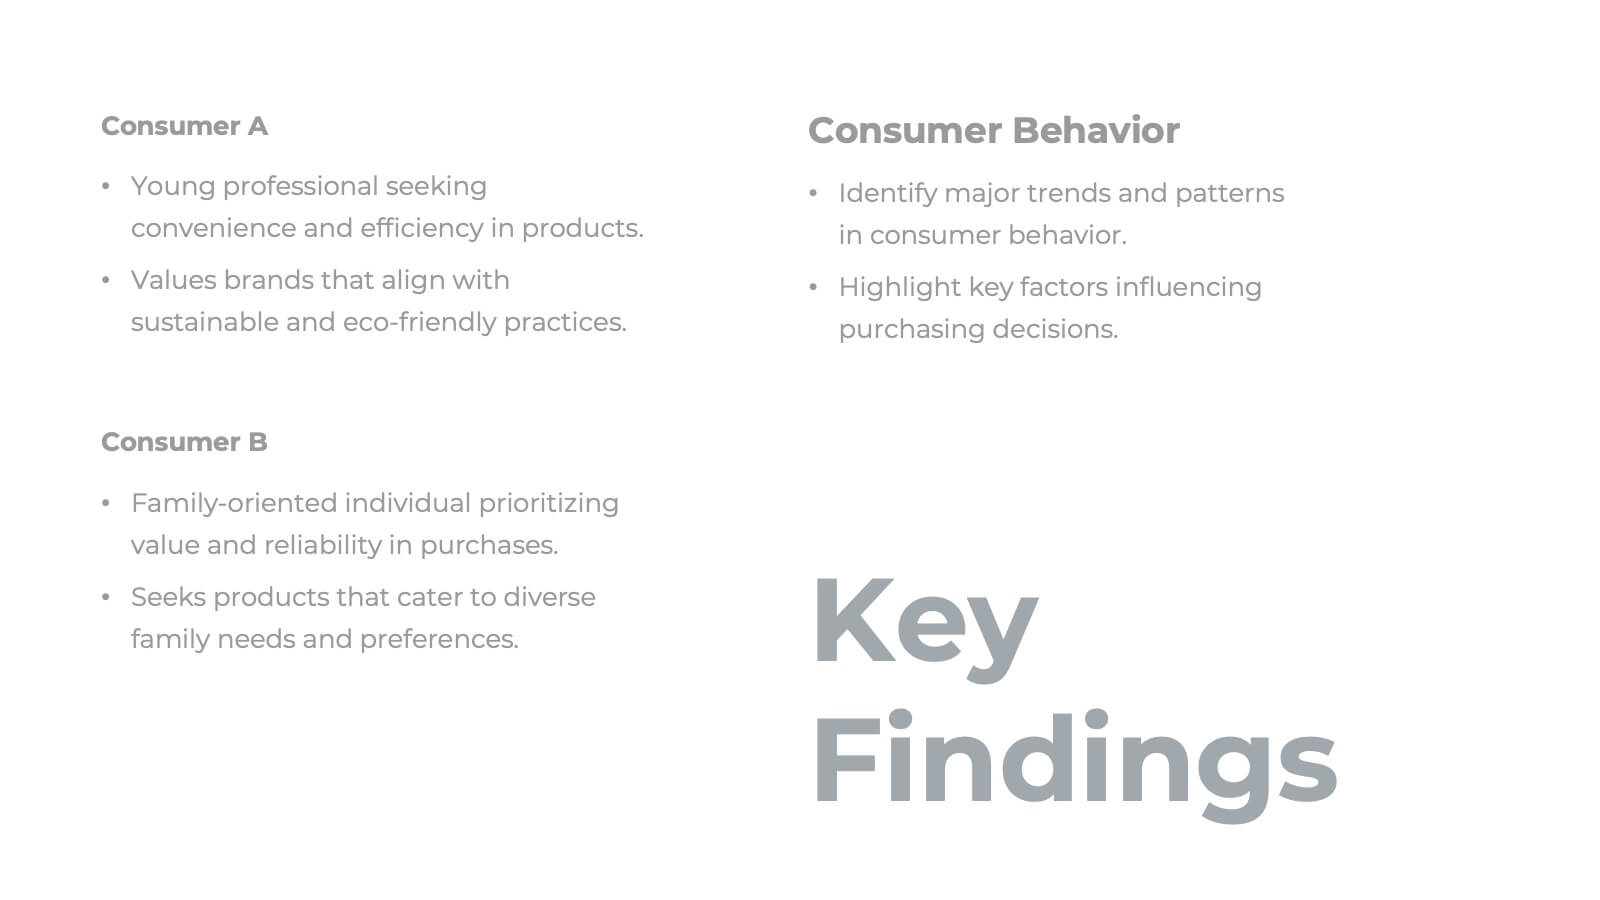
Malachite Research Proposal Presentation
Present your research findings with clarity and professionalism using this structured research presentation template! Covering all essential elements, from research objectives and methodology to key findings and implications, this template ensures your work is communicated effectively. It's perfect for academic, corporate, or scientific presentations. Compatible with PowerPoint, Keynote, and Google Slides, it's versatile and ready for your next project.


10 diapositivas
Financial Dashboard Report Presentation
Stay on top of your financial metrics with the Financial Dashboard Report Presentation. Featuring clean visuals like line charts and icon-labeled KPIs, this layout makes complex data easy to understand. Perfect for monthly reviews, investor updates, or business reports. Fully editable in PowerPoint, Keynote, and Google Slides.


6 diapositivas
Machine Learning Systems Overview
Get ready to light up your next tech talk with a bold, clean layout that simplifies even the most complex systems. This infographic presentation template is designed to break down how intelligent algorithms function, analyze data, and learn patterns—perfect for explaining how machine learning fits into real-world applications. Each slide uses smart visuals and icons to guide viewers through each system stage with clarity. Ideal for educators, developers, or startups pitching AI-powered solutions, it’s a creative and professional way to keep your audience engaged. Fully compatible with PowerPoint, Keynote, and Google Slides.