


Características


¿Tienes alguna pregunta?
Recomendar


6 diapositivas
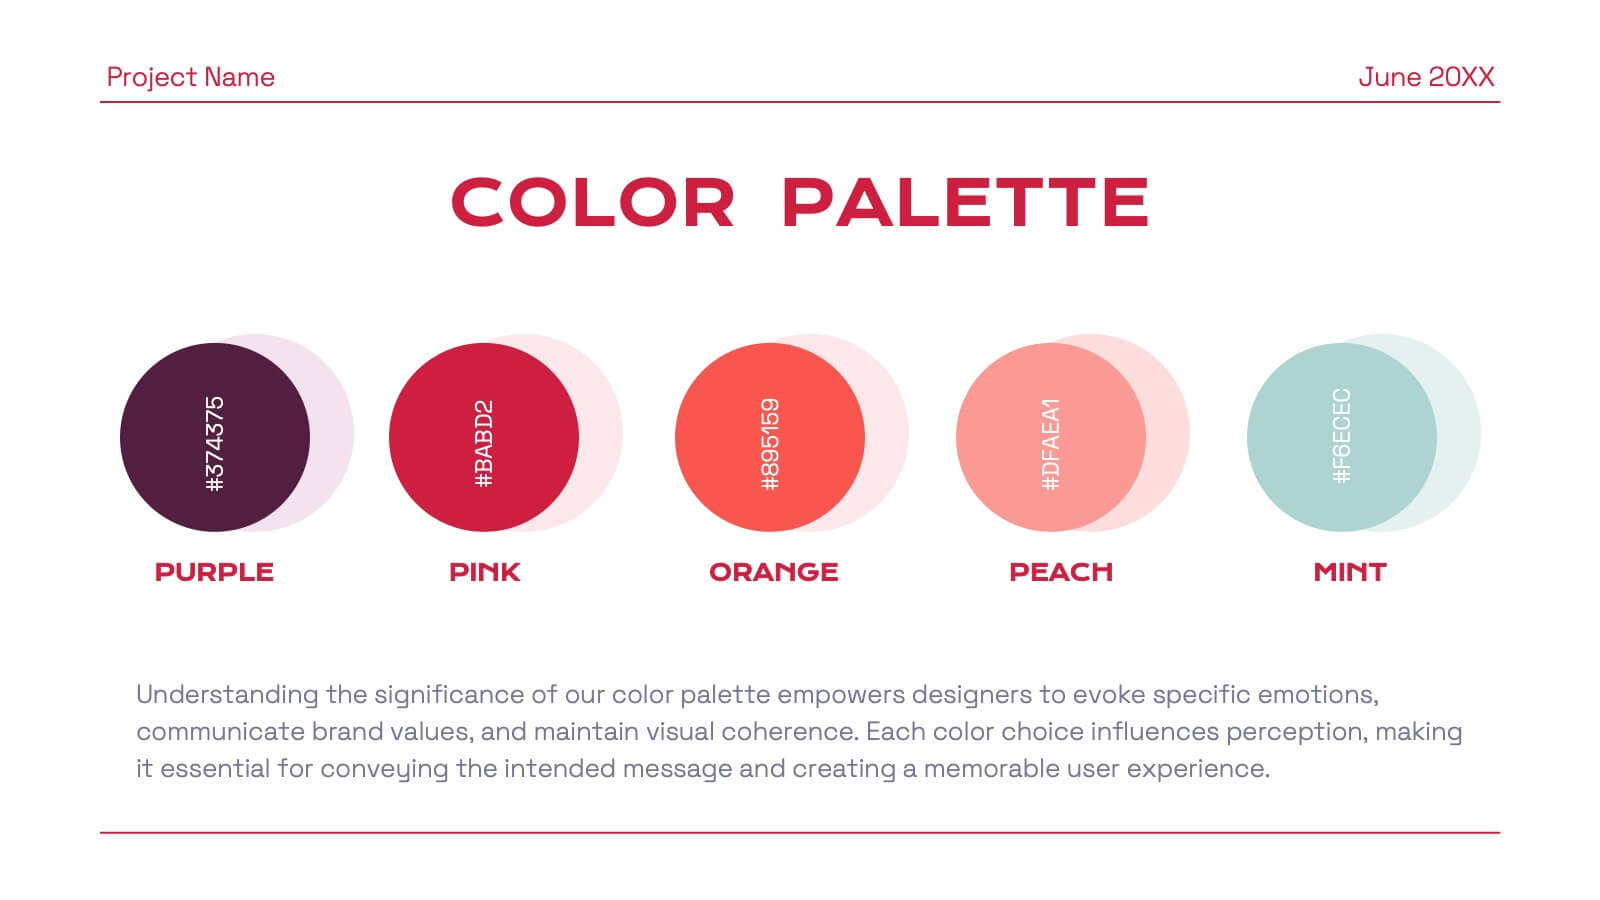
Data Trends and Statistical Overview Presentation
Present your insights clearly with the Data Trends and Statistical Overview presentation. This template features a clean combination of bar charts and half-pie graphs to showcase metrics, comparisons, and progress at a glance. Ideal for monthly analytics, business reviews, or performance tracking. Fully editable in PowerPoint, Keynote, and Google Slides.


3 diapositivas
Customer Relationship Mapping Presentation
Visualize connections across your supply chain with the Customer Relationship Mapping Presentation. This slide helps illustrate how your group interacts with suppliers and customers, making it ideal for operational overviews, relationship management, or partner presentations. Fully editable in PowerPoint, Keynote, and Google Slides.


22 diapositivas
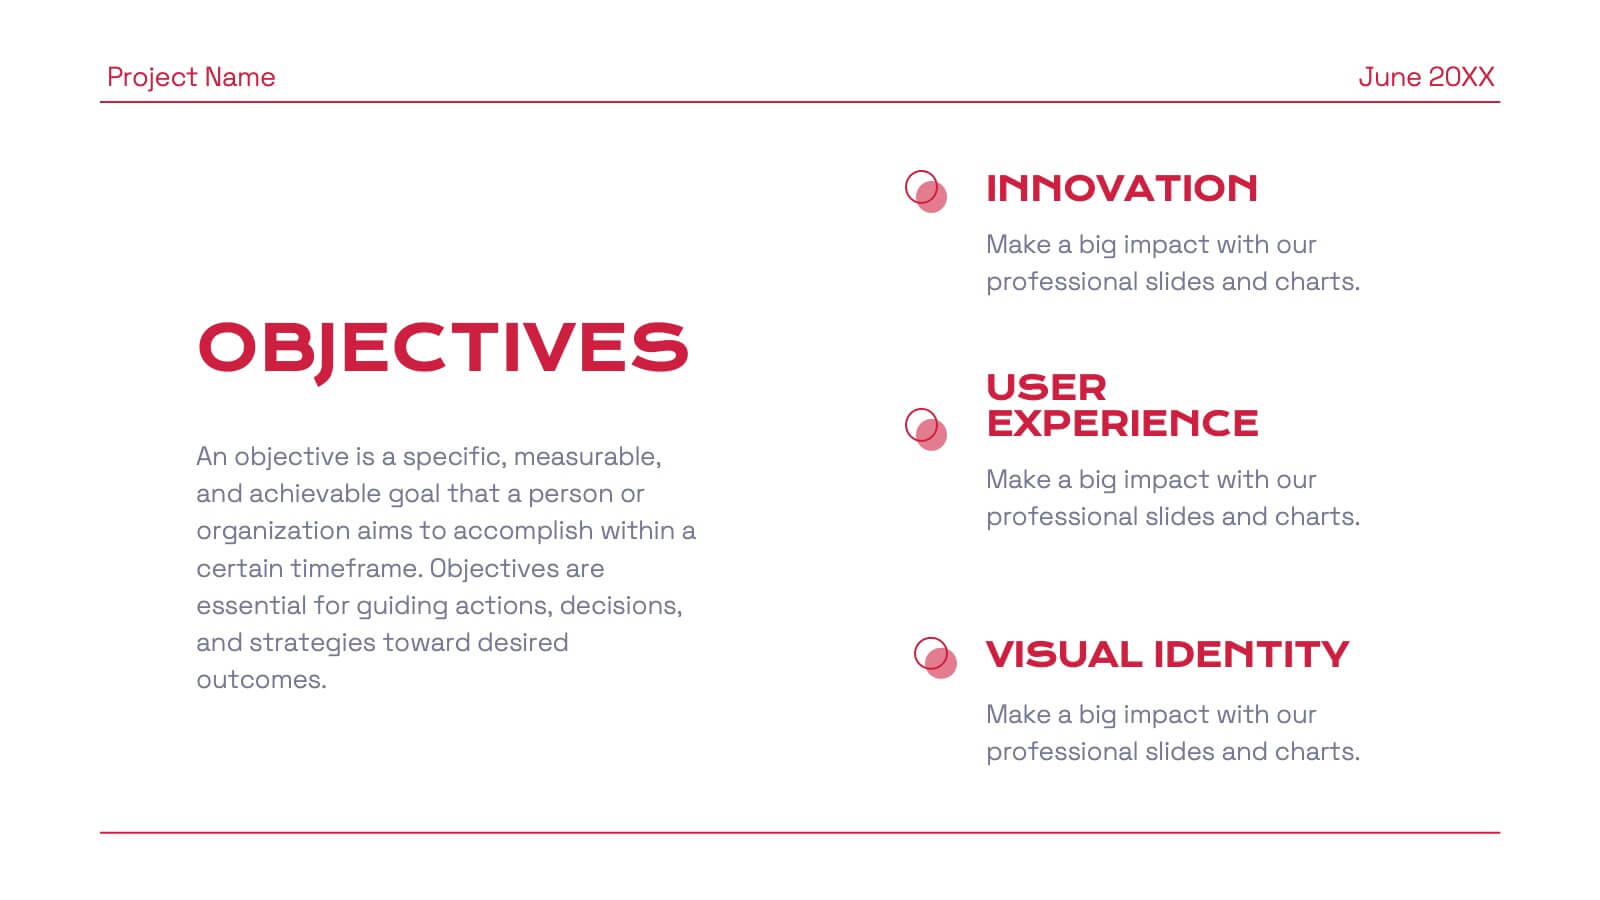
Eclipse Graphic Design Project Plan Presentation
Develop a winning marketing strategy with this dynamic template. Dive into current trends, consumer behavior, and innovative techniques. Perfect for social media, influencer marketing, and data-driven campaigns. Fully compatible with PowerPoint, Keynote, and Google Slides.


6 diapositivas
Cause-and-Effect Chain Using Fishbone Diagram Presentation
Break down complex issues step by step with the Cause-and-Effect Chain Using Fishbone Diagram Presentation. Ideal for project managers, analysts, or educators, this template helps you visually map out relationships between causes and outcomes. Fully editable in Canva, PowerPoint, and Google Slides for seamless integration into your workflow.


7 diapositivas
Future Vision Infographic
Chart a course towards a visionary future with our Future Vision Infographic Template. This dynamic template is designed to help organizations articulate and visualize their long-term goals and strategies in a clear and compelling way. Each slide offers a unique blend of geometric designs and bold color palettes, ideal for engaging stakeholders and inspiring action. Perfect for corporate presentations, strategic meetings, or digital showcases, this template allows you to lay out your vision with precision. It guides viewers through your roadmap to success, highlighting key milestones and the innovative steps you plan to take. Customize each element to echo your organizational identity and values, ensuring that your future aspirations resonate deeply with your audience. Whether you're aiming to motivate your team, attract investors, or inform your partners, our Future Vision template provides a robust foundation for powerful storytelling and strategic clarity.


4 diapositivas
School Curriculum Overview Presentation
Present your academic plan with this creative curriculum overview layout. Featuring intersecting pencil graphics, it visually organizes four key subjects or areas of focus. Perfect for teachers, school administrators, or education consultants. Fully customizable in PowerPoint, Keynote, and Google Slides to match any educational level or institutional branding.


4 diapositivas
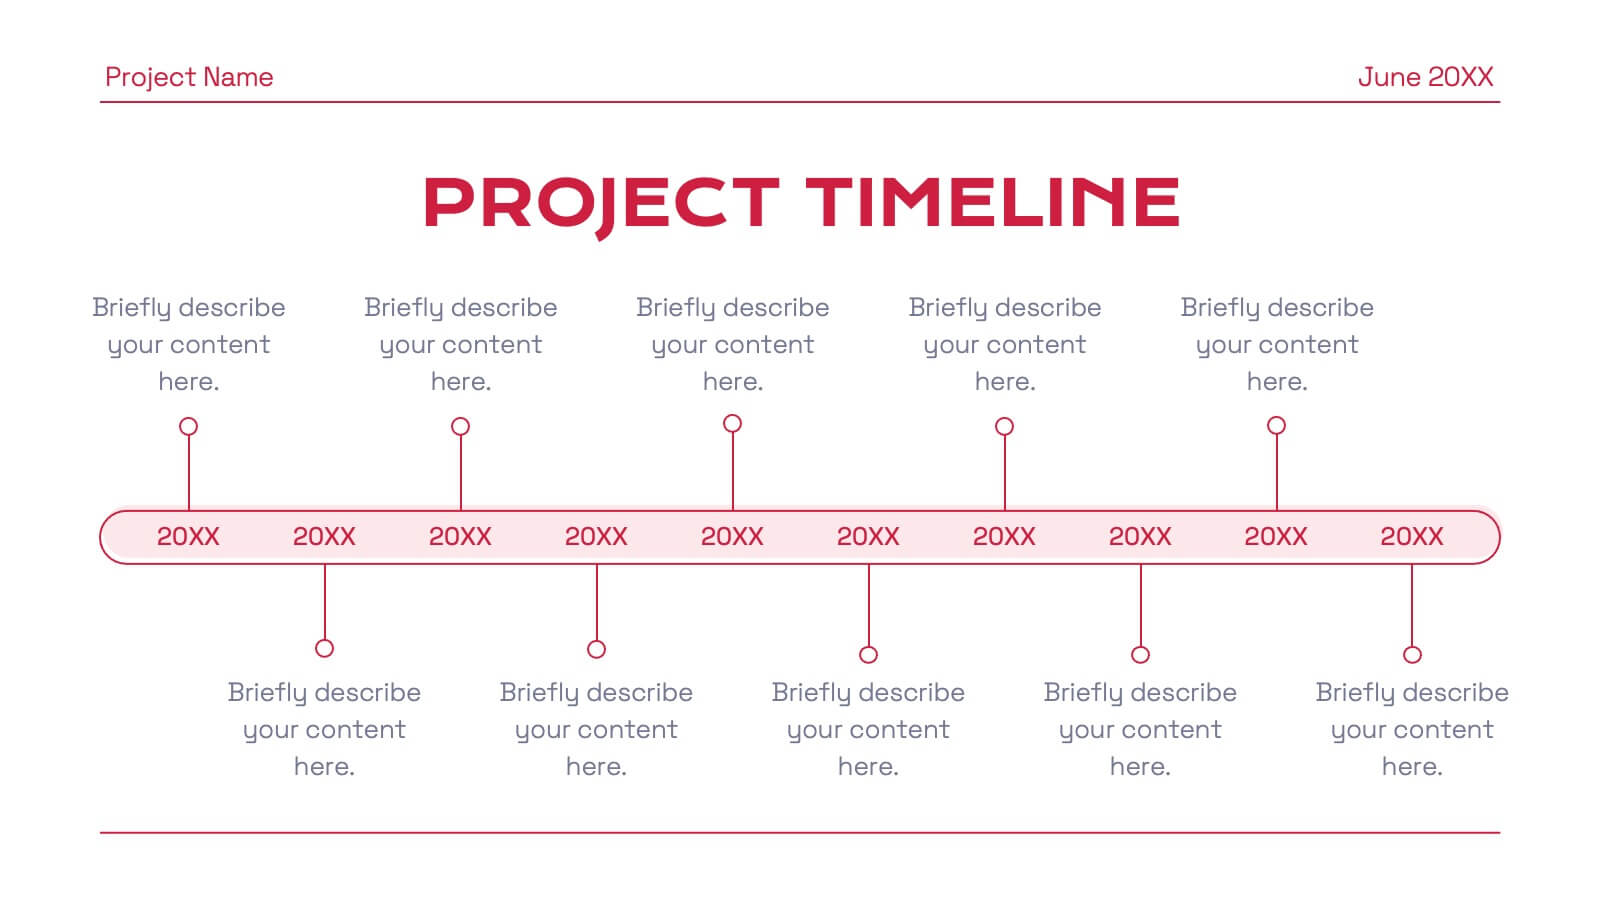
Event Planning and Calendar Timeline Presentation
Plan smarter, not harder! This sleek timeline infographic is perfect for keeping your event plans organized and on track. Whether you're managing a multi-day conference or a team schedule, this visual template makes deadlines and tasks crystal clear. Fully compatible with PowerPoint, Keynote, and Google Slides for seamless editing and presentation.


12 diapositivas
Investment Strategy Presentation
The "Investment Strategy Presentation" template is designed for effectively mapping out and displaying various investment strategies. It uses a multi-colored light bulb graphic, which symbolizes ideas and innovation in investment planning, making it visually appealing and easy to understand. Each segment of the light bulb is labeled with letters A through F, representing different aspects or phases of an investment strategy that can be tailored to specific objectives or points of discussion. This format helps in presenting complex financial data or strategies in a straightforward manner that can be easily grasped by audiences, making it an ideal choice for financial analysts, investors, or corporate strategy meetings.


6 diapositivas
Project Gantt Chart Presentation
This Project Gantt Chart Presentation helps visualize your project timeline with clarity. Featuring six tasks, weekly progress bars, and colorful icons, it’s ideal for tracking milestones. Fully customizable and easy to edit, this slide works seamlessly in PowerPoint, Keynote, and Google Slides for organized, professional project management presentations.


4 diapositivas
Fixed and Variable Cost Balance Presentation
Visualize cost distribution using a balanced scale metaphor. This presentation helps compare fixed and variable costs with editable sections for data input. Ideal for financial planning, budgeting, or cost control analysis. Fully customizable in PowerPoint, Keynote, and Google Slides to match any brand or business presentation style.


5 diapositivas
Strategic HR Planning with Skills Gap Analysis
Lead with insight. The Strategic HR Planning with Skills Gap Analysis slide is your go-to tool for aligning talent strategy with organizational needs. Ideal for showcasing workforce priorities, skill readiness, and actionable development plans—fully editable in PowerPoint, Keynote, and Google Slides.
7 diapositivas
Project Milestone Tracking Presentation
Efficiently monitor key project milestones with our "Project Milestone Tracking" presentation templates. These visually clear and user-friendly tools are perfect for project managers to showcase task completions, priority levels, due dates, and overall project progress, ensuring that every team member is aligned and informed. Compatible with PowerPoint, Keynote, and Google Slides, these templates streamline project updates and enhance team coordination.


8 diapositivas
Educational Learning and School Management Presentation
Enhance academic planning with the Educational Learning and School Management Diagram. This structured template visualizes key processes in education, ensuring a streamlined approach to school administration and curriculum development. Ideal for educators, administrators, and policymakers, it offers a clear, customizable layout to communicate strategies effectively. Fully compatible with PowerPoint, Keynote, and Google Slides.


12 diapositivas
Business Growth and Expansion Presentation
Showcase your Business Growth and Expansion strategy with this dynamic presentation template. Featuring bold arrow visuals, it effectively illustrates progression, milestones, and key business insights. Ideal for startups, corporate planning, and market analysis. Compatible with PowerPoint, Keynote, and Google Slides.


6 diapositivas
Demographic Information Infographic
Demographic information refers to data that describes the characteristics of a population or specific groups within a population. This infographic template is essential for understanding the composition and dynamics of a population, as well as for making informed decisions in various fields, such as market research, healthcare, and education. This infographic is designed to provide an overview of key demographic indicators and trends, offering insights into the characteristics of the target audience. This infographic includes key insights about the demographic data presented, providing context and interpretation for the audience.
8 diapositivas
Business Growth and Progress Tracking Presentation
Visualize success with this upward-arrow roadmap template designed to highlight four key stages of business development. Ideal for managers, analysts, and entrepreneurs, this slide uses milestone icons and clean, directional layout to emphasize progress. Fully editable in PowerPoint, Keynote, and Google Slides for seamless customization.


6 diapositivas
Corporate Training Program Presentation
Build excitement from day one with a sleek and modern visual! This presentation template is ideal for outlining your professional development plans, onboarding paths, or internal training milestones in a structured, step-by-step format. Fully editable and designed to impress, it works seamlessly with PowerPoint, Keynote, and Google Slides.