


Características


¿Tienes alguna pregunta?
Recomendar


7 diapositivas
Professional Goals Infographic
Unfold the pathway to success with our professional goals infographic. Designed to help individuals and organizations visualize and track their aspirations, this infographic offers a comprehensive look at professional milestones and strategies to achieve them. The primary palette revolves around a pristine white backdrop, enhanced by accents of vibrant orange and a mix of complementary colors to distinguish different areas. Its design ensures seamless integration into PowerPoint, Keynote, or Google Slides presentations, transforming your professional goals discourse into a visually engaging experience.


6 diapositivas
Strategic Planning with Hexagon Diagram
Visualize complex plans with clarity using the Strategic Planning with Hexagon Diagram Presentation. This slide layout features six connected hexagons forming a cohesive structure around a central idea—perfect for mapping out strategic pillars, initiatives, or departmental functions. Each segment is color-coded and labeled A–F, making it easy to present interconnected elements such as goals, KPIs, resources, risks, and action plans. Fully editable in PowerPoint, Keynote, and Google Slides, you can customize the layout to fit your organizational strategy or project flow.


26 diapositivas
Remote Work Best Practices Creative Presentation
Navigate the world of telecommuting with our Remote Work Best Practices presentation template, available for Powerpoint, Google Slides, and Keynote. This template is specially designed for the modern remote work environment, incorporating a blend of professional and engaging visuals that reflect the flexibility and innovation of working from home. The template features customizable slides for outlining communication tools, scheduling, and mental health tips. Whether you're onboarding new staff or refining your company's remote policies, this template will help you present a comprehensive guide to succeeding in the remote work landscape.


6 diapositivas
Work Flow Chart Infographic
Enhance process understanding with our Workflow Chart Infographic, suitable for Powerpoint, Google Slides, and Keynote. Ideal for project managers, team leads, and operational managers, this infographic simplifies the visualization of workflow processes. With customizable shapes representing different stages, tasks, or decisions, this template helps clearly demonstrate the flow of tasks from start to completion. It's an effective tool for illustrating sequences, responsibilities, and handoffs in business processes. Use this infographic to streamline your operations and communicate processes with clarity to your team and stakeholders.


6 diapositivas
Multiple Choice Options Slide Presentation
Make your ideas stand out with a bold, interactive design that organizes multiple options clearly and visually. Ideal for showcasing comparisons, scenarios, or decision pathways, this presentation keeps audiences engaged and informed. Fully compatible with PowerPoint, Keynote, and Google Slides for seamless customization and professional results.


6 diapositivas
Formal Numbers Infographics
Enter the world of formal numbers, a vital concept in mathematics and science! This infographic acts as your gateway to comprehending the structure and significance of formal numbers. From the fundamental properties of natural numbers to the intricate details of real and complex numbers, we unveil the secrets that underpin these mathematical entities. Discover the mathematical significance of formal numbers across various fields, from algebra to calculus and beyond. Explore how these numbers are used in practical applications, including engineering, physics, and computer science. Gain an appreciation for the elegance and versatility of formal numbers in solving real-world problems. With this informative infographic, compatible with PowerPoint, Keynote, and Google Slides, sharing your understanding of formal numbers becomes seamless. Empower yourself with the knowledge to navigate the intricate world of mathematics. Dive into the realm of formal numbers and embark on a journey of mathematical exploration and enlightenment.


5 diapositivas
Construction Equipment Infographics
Dive into the industrial world with our construction equipment infographics template. This collection, rich with vivid reds, greens, and purples, breaks down intricate machinery details into digestible visual content, perfect for professionals in the construction industry, equipment manufacturers, and trade school educators. Compatible with Powerpoint, Keynote, and Google Slides. The creative, vertical style packed with high-quality graphics and icons, facilitates the easy assembly of data and processes, enhancing presentations, or educational content. Equip yourself to convey the dynamism of construction equipment through this visually compelling tool.


7 diapositivas
Growth Mindset Infographic Presentation
A Growth Infographic is a visual representation of data that displays the growth of a particular business, industry, or market over time. It can be used to illustrate growth in areas such as revenue, profits, customer base, or market share. This growth template includes a timeline and graphs that shows the change in data over time, presented in a visually appealing way using icons, symbols, and color-coding. Use this infographic to include additional information such as industry trends, key drivers of growth, and future projections. Easily edit in Powerpoint, Keynote, and Google Slides.


5 diapositivas
Data Analytics Heat Map
Visualize data intensity and trends effortlessly using this heat map-style layout. Ideal for performance tracking, comparative analysis, and decision-making frameworks, this slide organizes information by low, medium, and high value ranges. Fully customizable in PowerPoint, Keynote, and Google Slides.
5 diapositivas
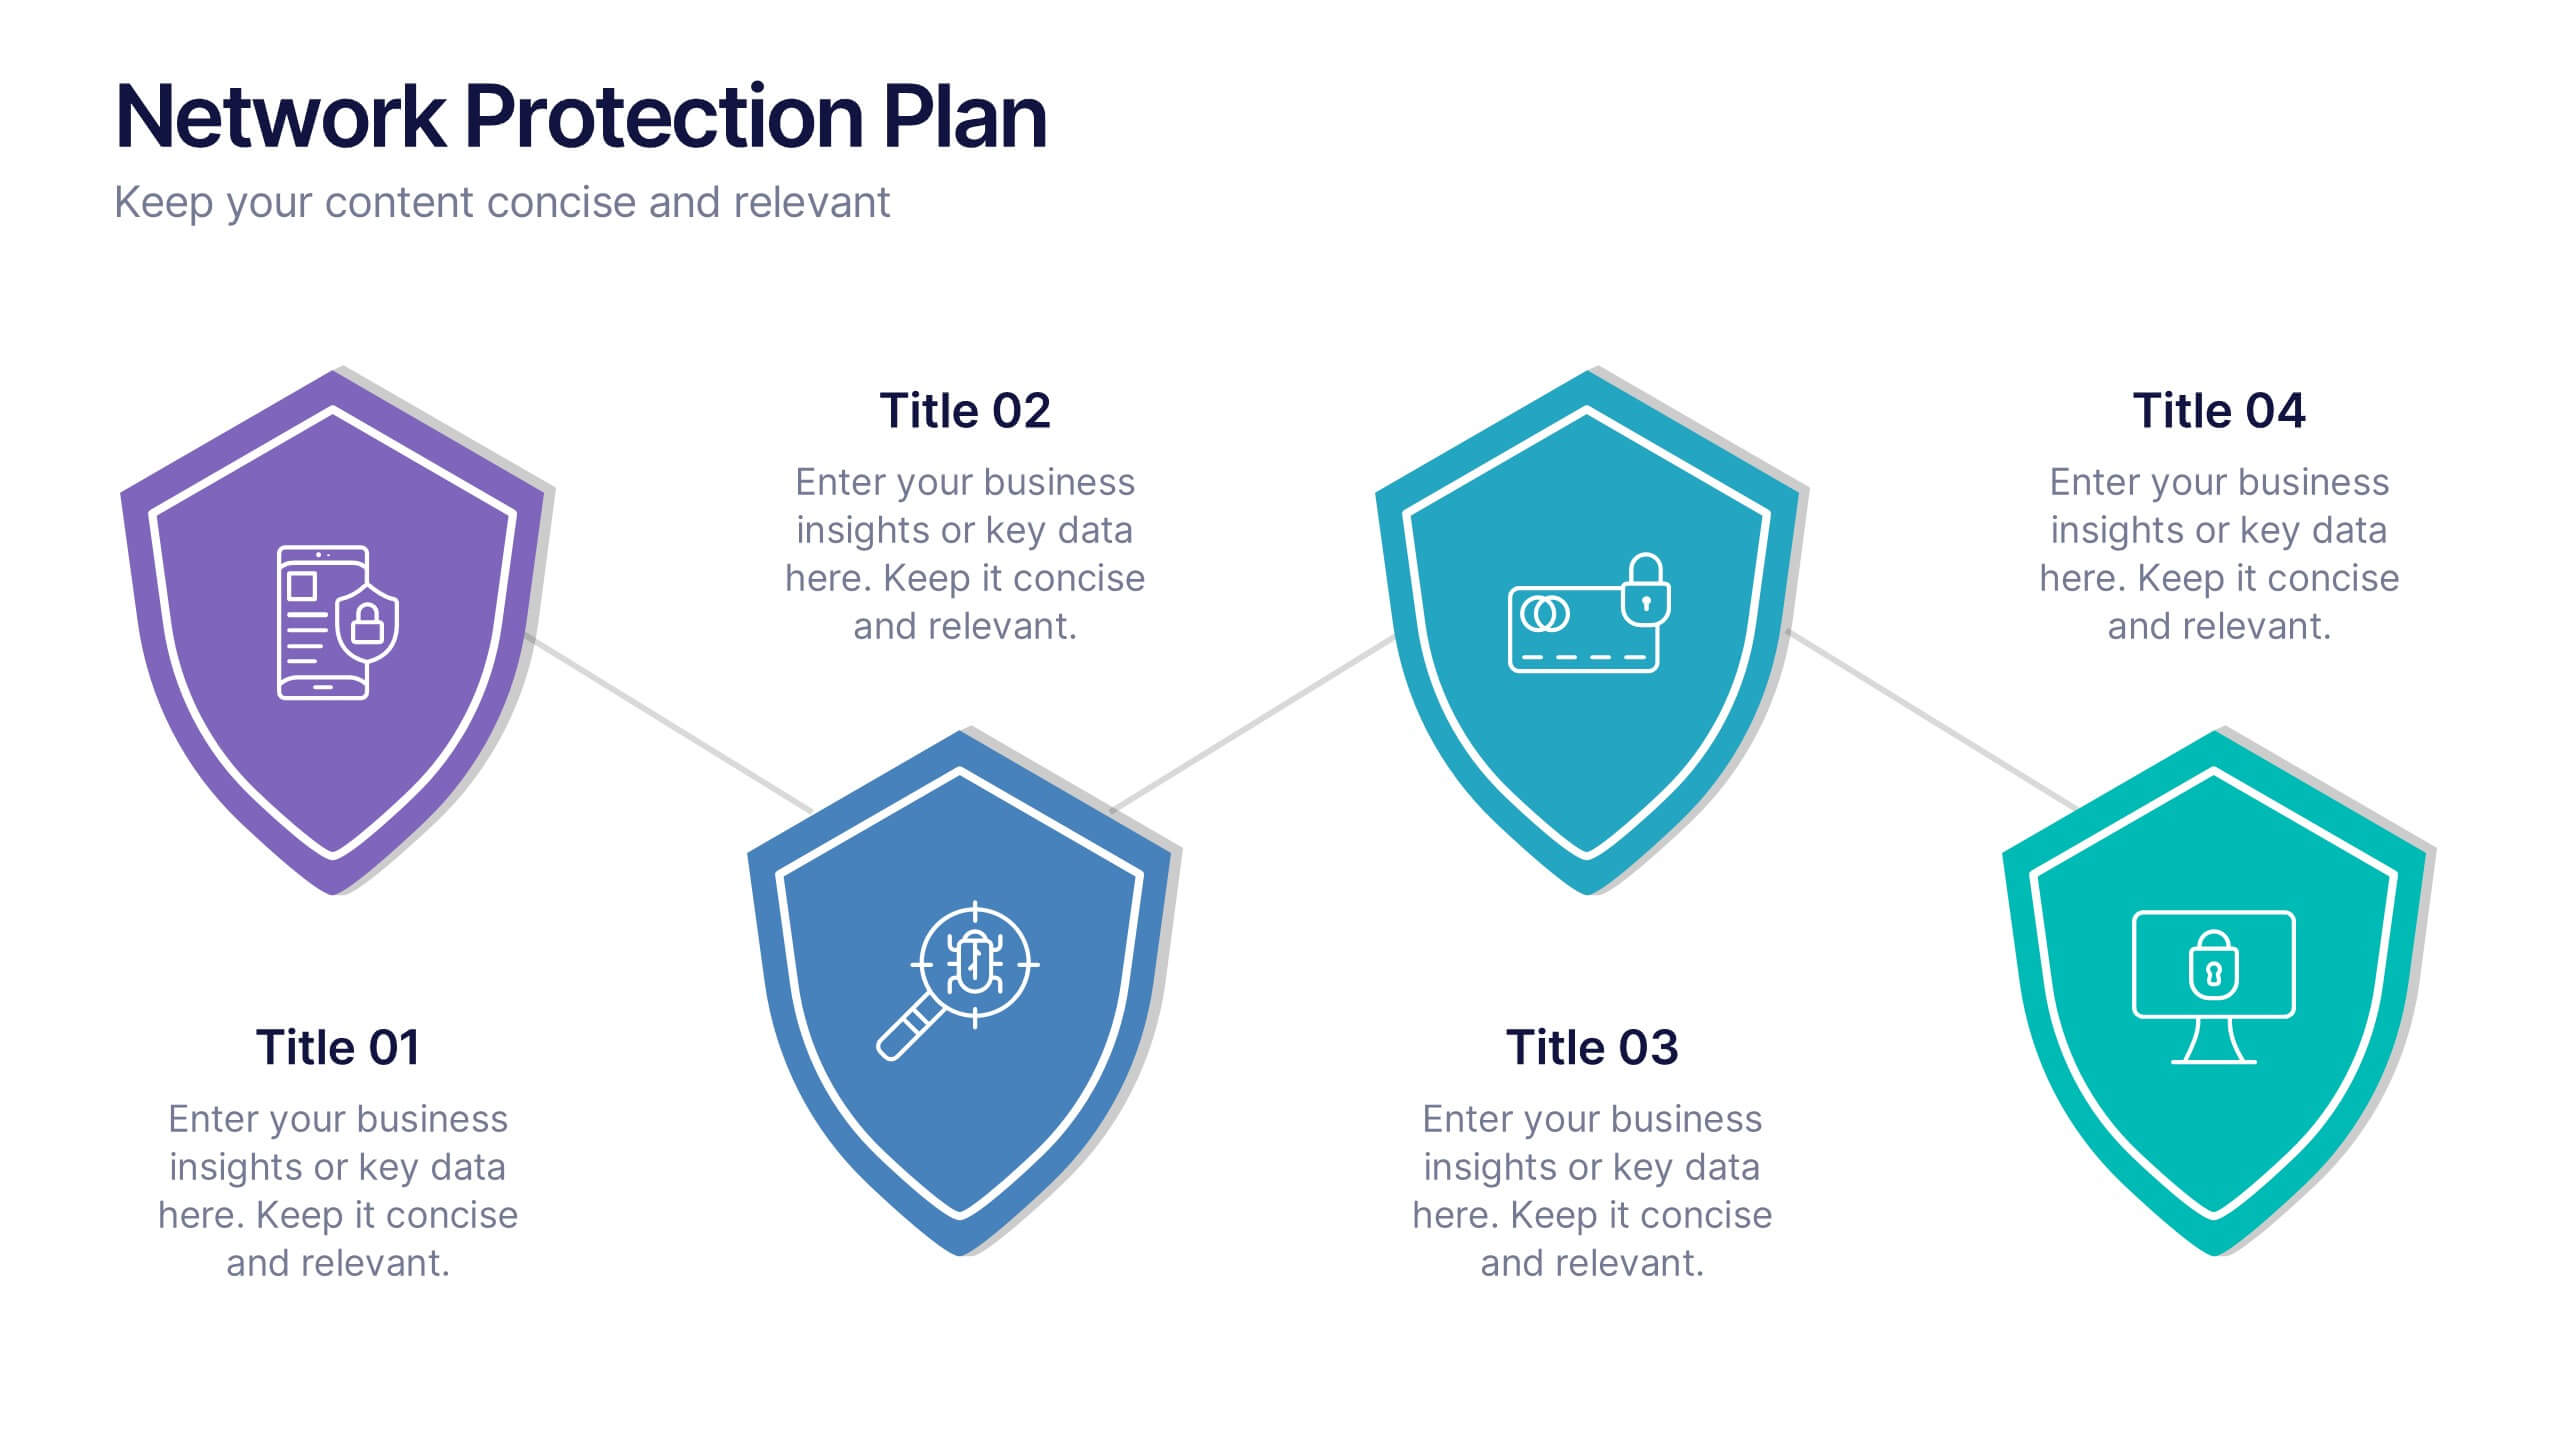
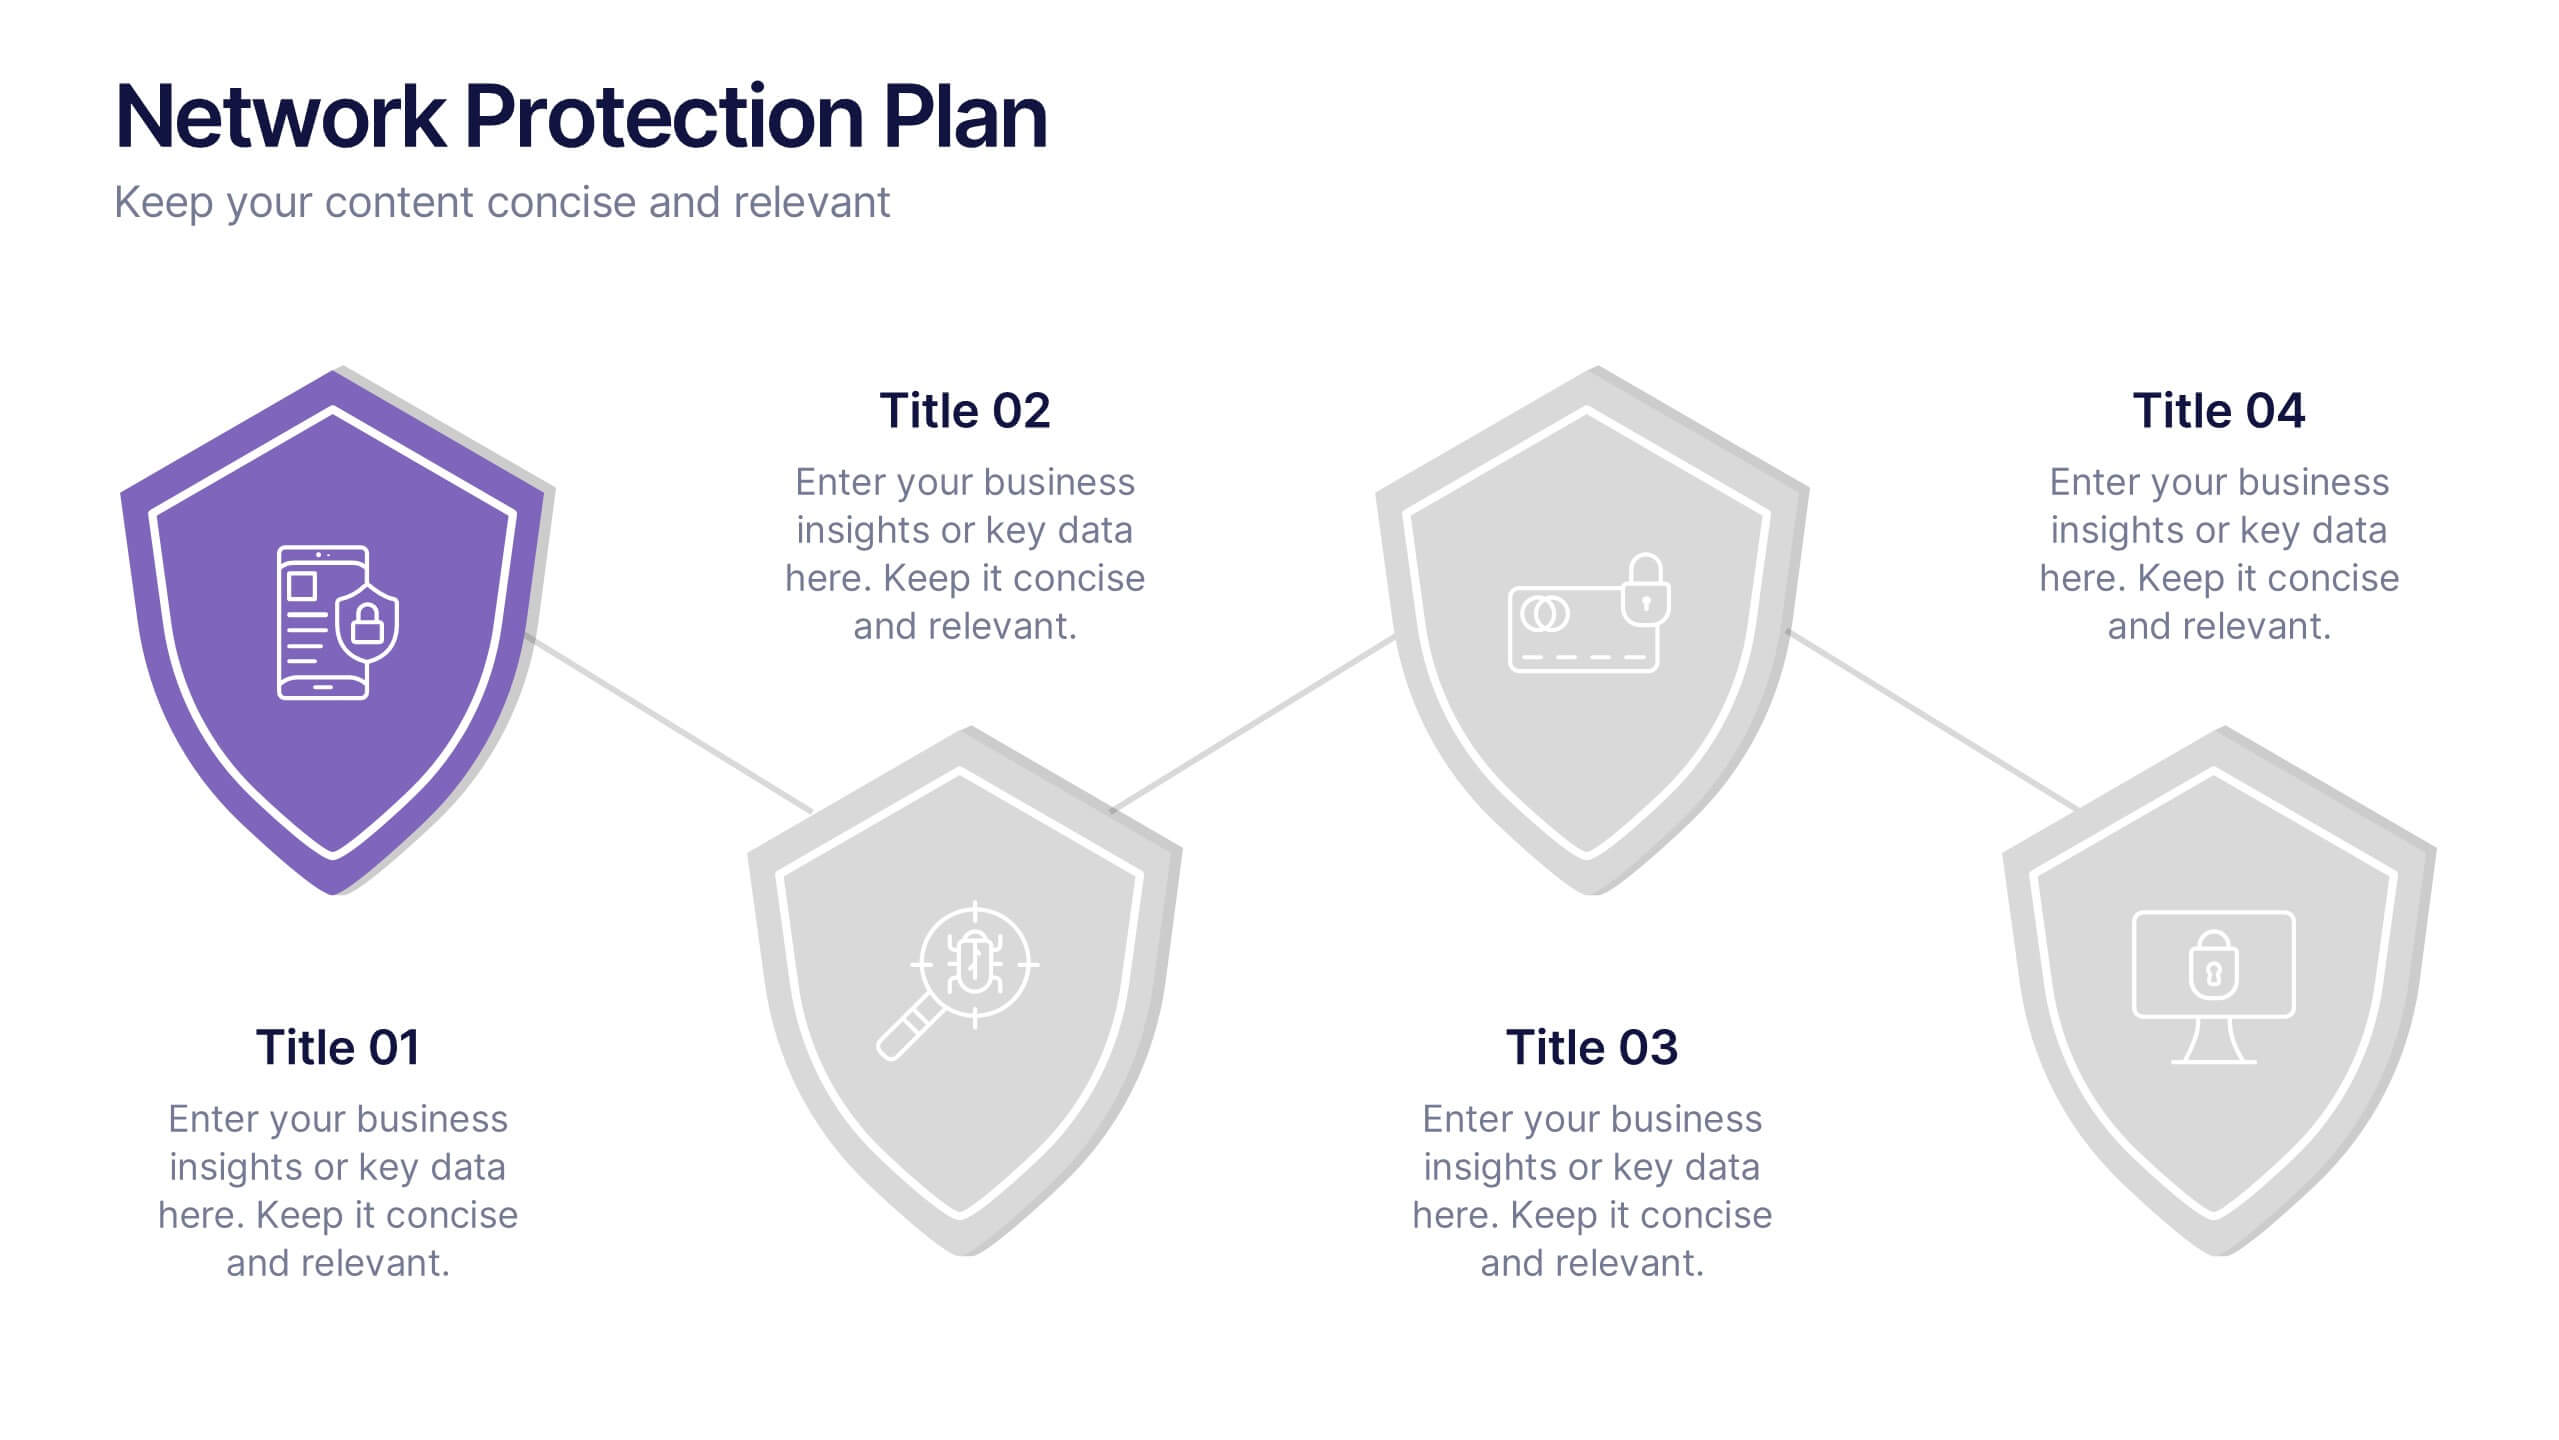
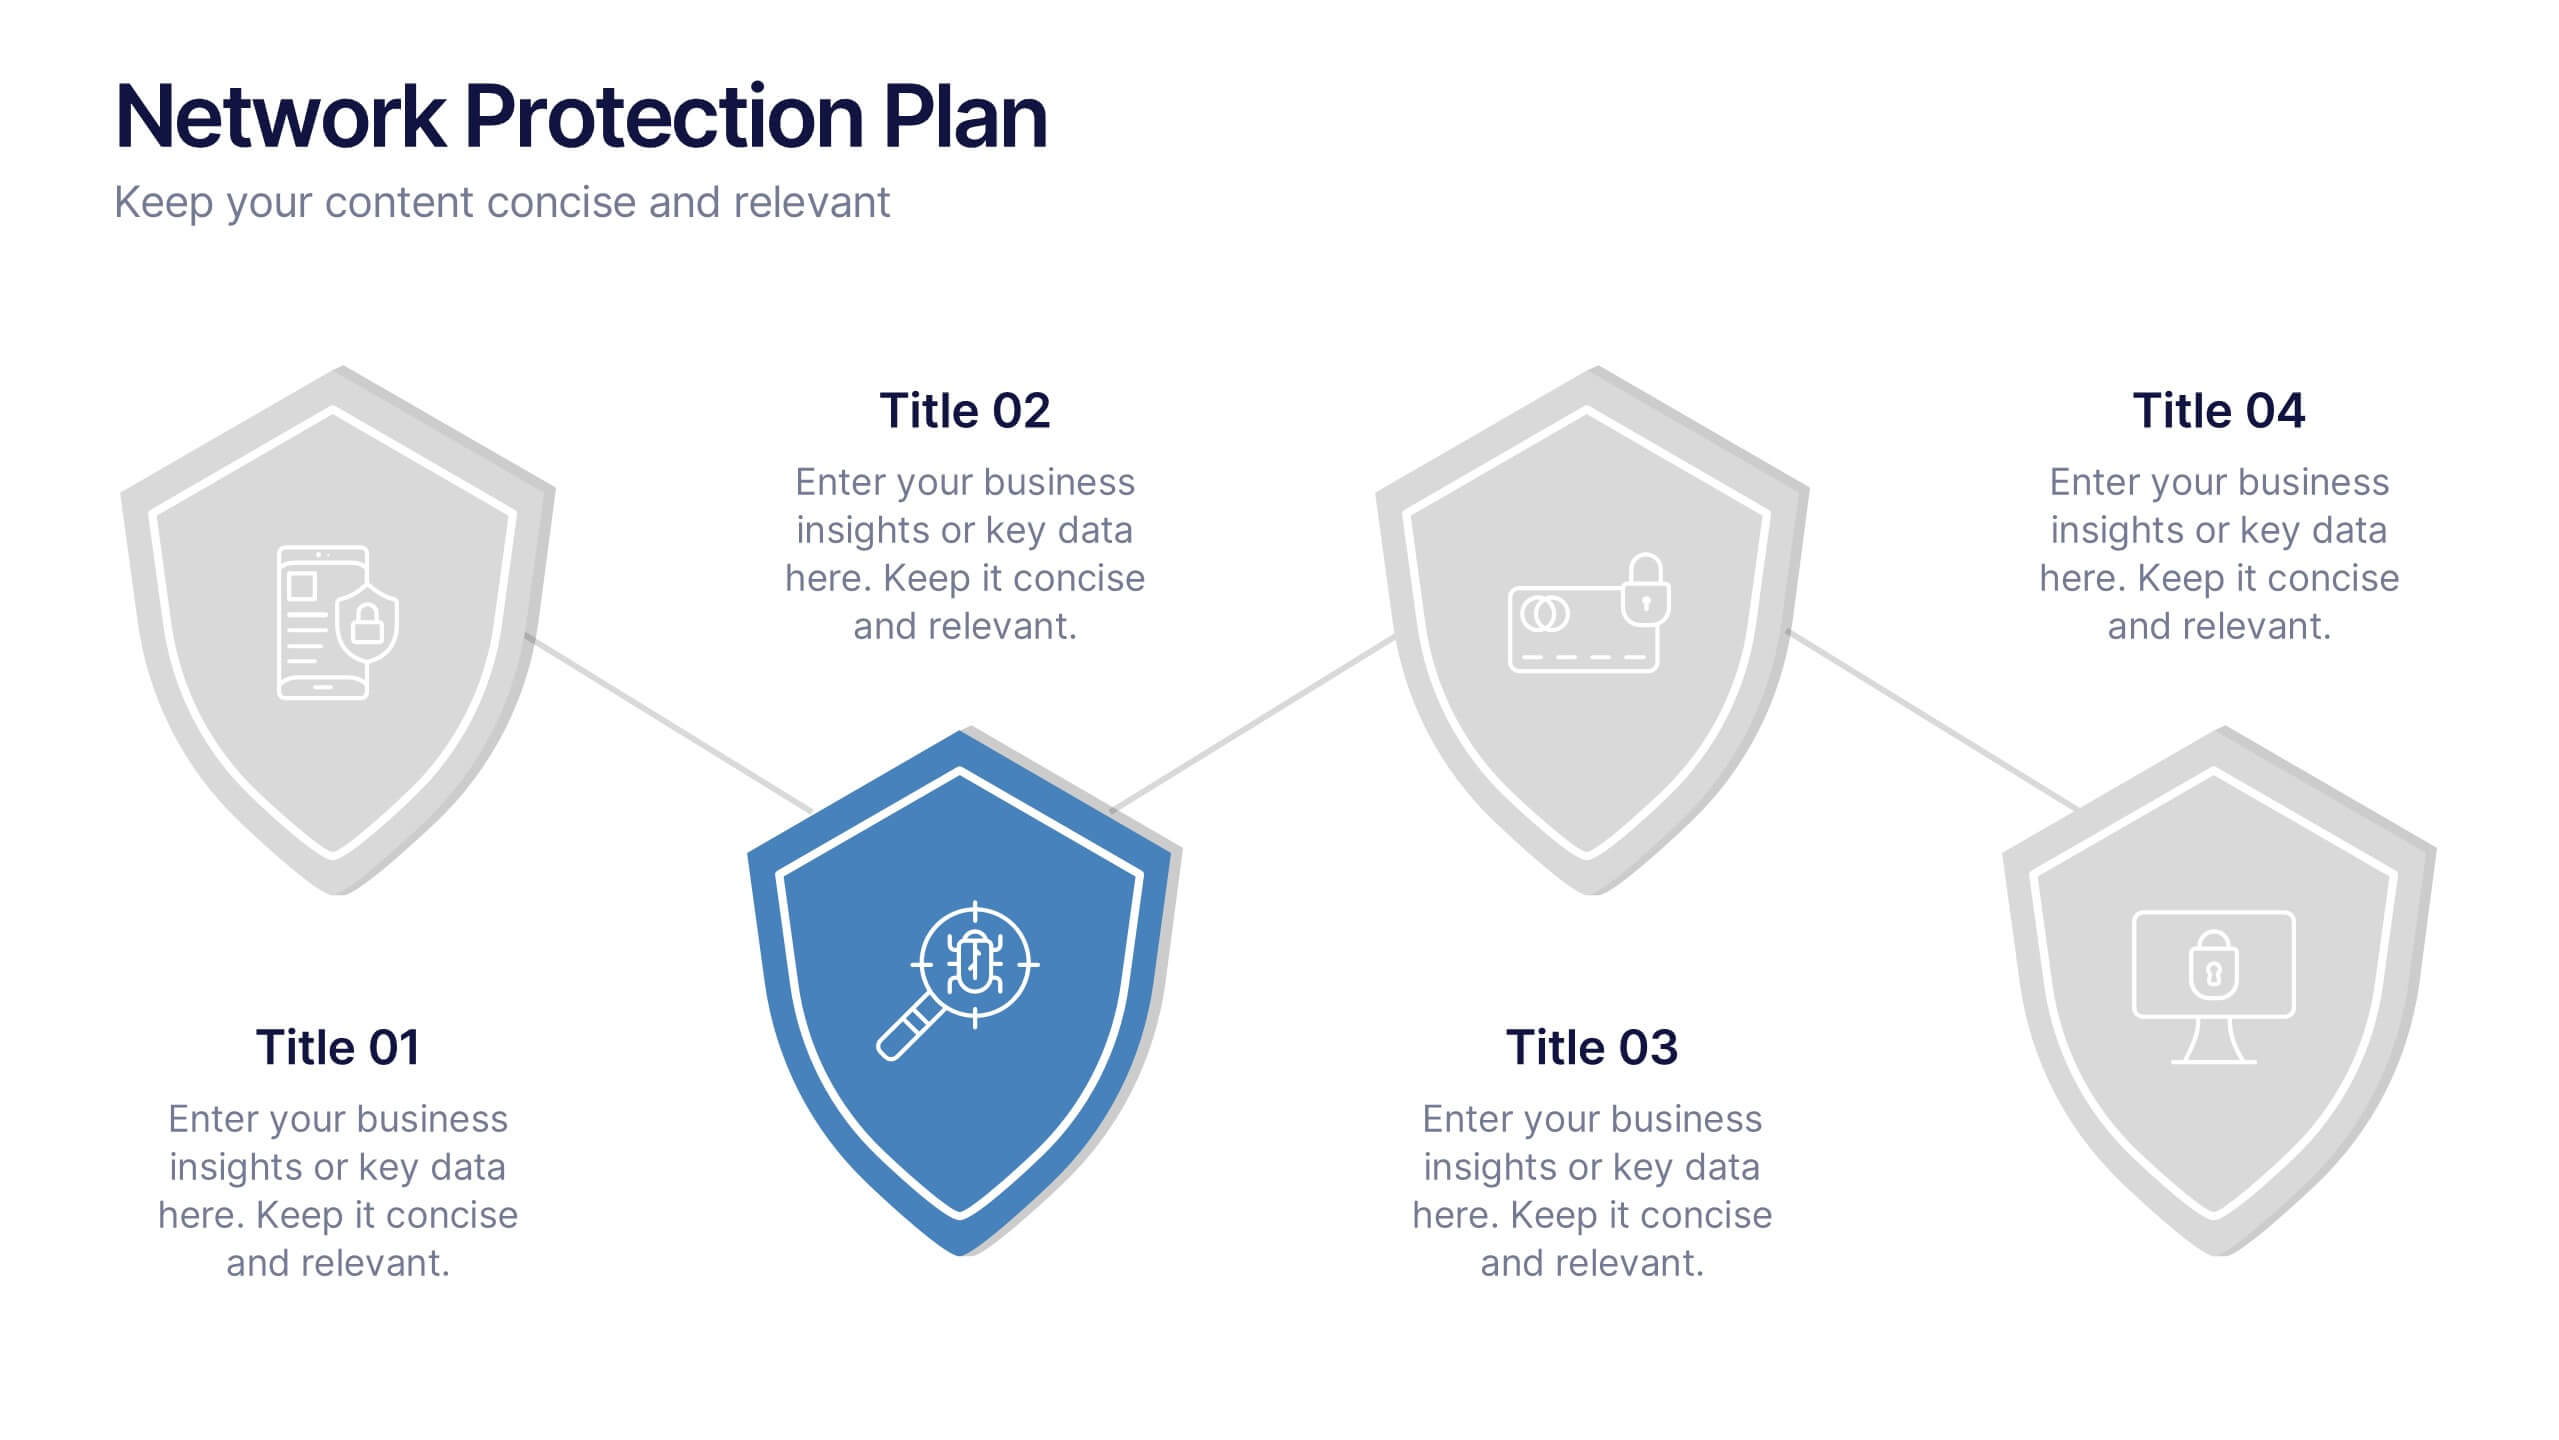
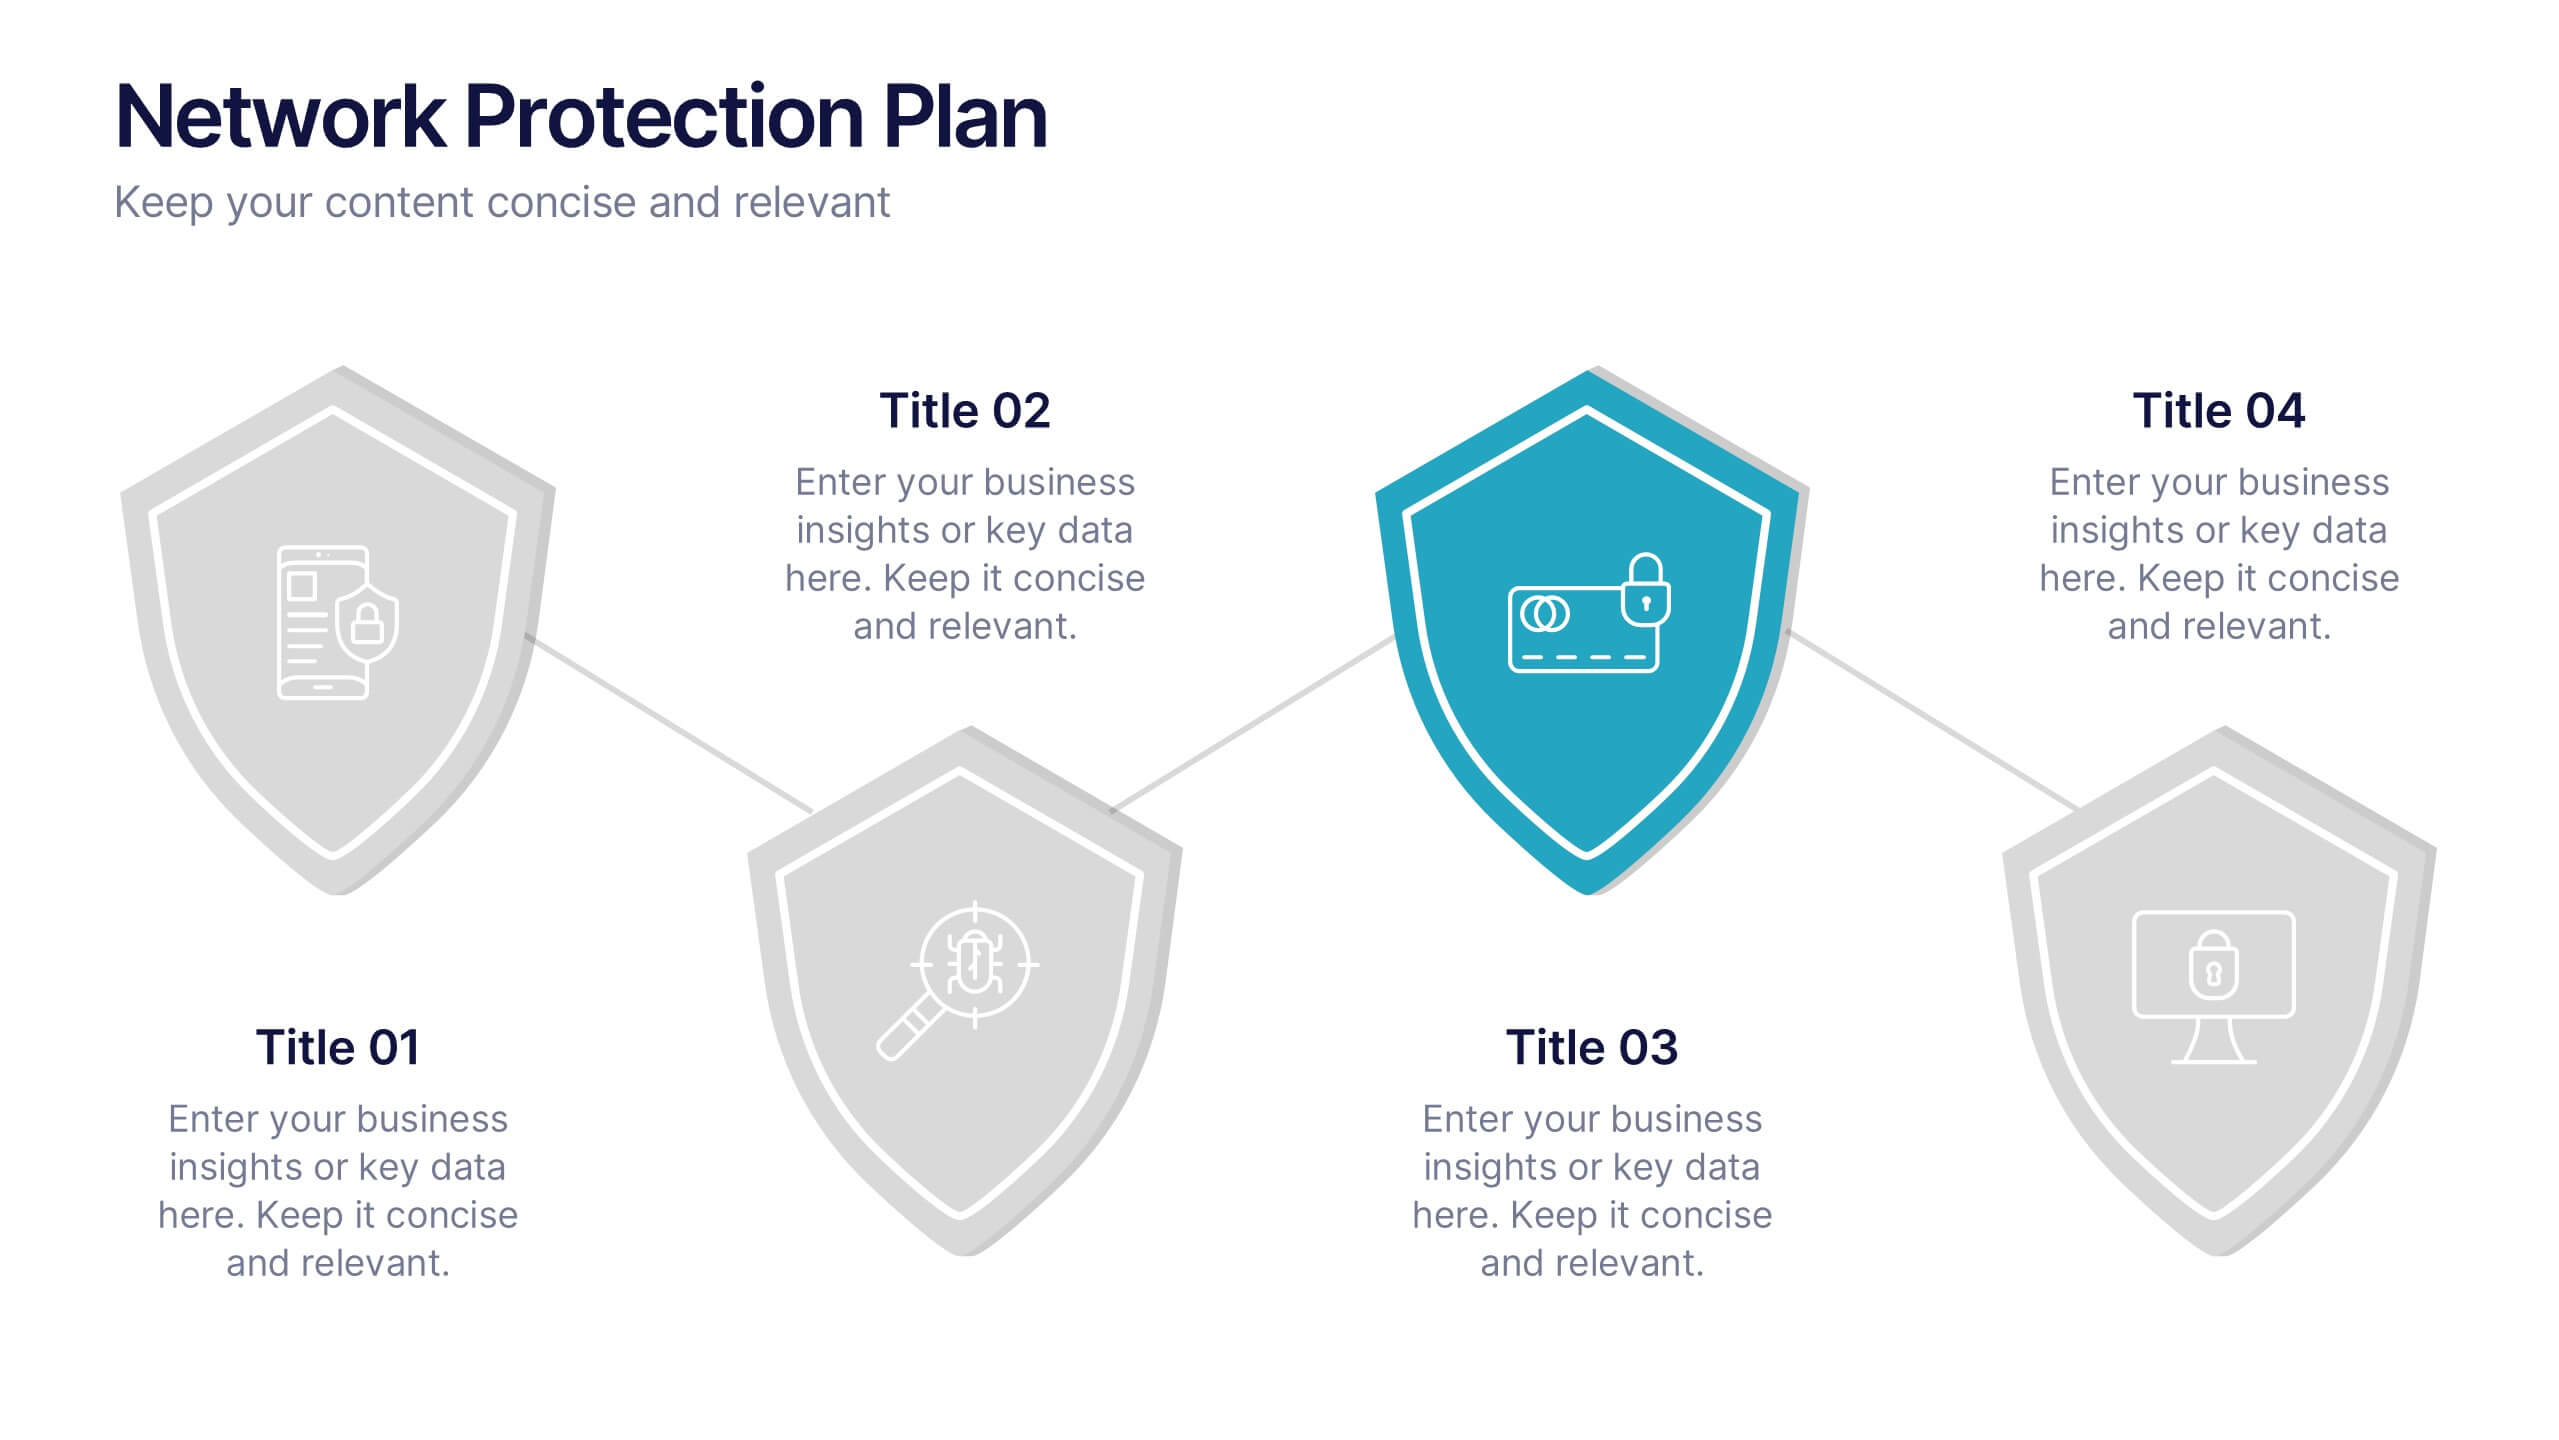
Network Protection Plan Presentation
Bold visuals and clean structure make this presentation a powerful way to communicate your protection strategy with clarity and confidence. It helps you break down key security stages, outline responsibilities, and show how each layer strengthens overall network resilience. Fully compatible with PowerPoint, Keynote, and Google Slides.


7 diapositivas
Blue Ocean Diagram Presentation
The Blue Ocean Strategy goal is to create a market space that is untapped, and in doing so, break away from the competition, create new demand, and increase profits. This template is designed for use in Powerpoint, Keynote, and Google Slides, and is perfect for anyone looking to create an informative and engaging presentation on this topic. This template is a useful tool for professionals and students. It provides informative illustration and information about the Blue Ocean Strategy to help you visually present your research, build a strategy or deliver a presentation on blue ocean strategies.


6 diapositivas
3D Infographic Design
Visualize data like never before with this bold 3D block diagram layout. Designed to break down complex figures into three key segments, it’s perfect for presenting percentages, growth areas, or metric comparisons. Easily editable in PowerPoint, Keynote, and Google Slides.


4 diapositivas
Modern 3D Business Diagram
Bring a fresh, dimensional twist to your business strategy with this modern 3D layout. Featuring interlocking puzzle elements on a tilted grid, this slide is perfect for showcasing interrelated departments, processes, or multi-stage plans. Compatible with PowerPoint, Keynote, and Google Slides.


6 diapositivas
Personal Skills Gap Infographics
Bridge the Personal Skills Gap effectively with our customizable infographic template. This template is fully compatible with popular presentation software such as PowerPoint, Keynote, and Google Slides, enabling you to easily tailor it to address specific skills gaps and development strategies. The Personal Skills Gap infographic template provides a visually appealing platform for identifying and closing gaps in your skillset, whether personal or professional. Whether you're a career-minded individual, a manager, or an educator, this template offers a user-friendly canvas to create informative presentations and self-improvement plans. Boost your personal and professional growth with this SEO-optimized Personal Skills Gap infographic template, thoughtfully designed for clarity and ease of use. Customize it to pinpoint skills in demand, set goals, and outline actionable steps to bridge the gap, ensuring your continuous development and success. Start crafting your personalized infographic today to thrive in a rapidly evolving world.


7 diapositivas
Rotational Process Flow in Wheel Layout Presentation
Showcase continuous workflows, lifecycle stages, or strategic loops with the Rotational Process Flow in Wheel Layout Presentation. This visually engaging circular diagram breaks down processes into six distinct segments, each with editable icons, colors, and titles—ideal for marketing funnels, product development stages, or team cycles. Fully compatible with PowerPoint, Keynote, and Google Slides.


4 diapositivas
South America Growth Market Strategy Presentation
Showcase expansion potential with the South America Growth Market Strategy Presentation. This slide template visually maps out your business strategy across the continent using location markers, ranking indicators (A–D), and concise text sections for each market. Perfect for growth analysis, investment briefings, or sales planning. Fully editable in PowerPoint, Keynote, Google Slides, and Canva.


7 diapositivas
Office Scenes Infographic Presentation Template
An Office Scene Infographic is a visualization of the most common types of office spaces, along with their pros and cons. This infographic template is great for a school presentation, office projects, employee onboarding programs, or planning a workplace makeover. Within this infographic, you will be able to display absolutely everything that needs to be shown within a corporate setting. This office scene template is a fully layered and customizable infographic that allows you to create your own design. Use it as an infographic, as a presentation, or even a website/app background.