


Características


¿Tienes alguna pregunta?
Recomendar


4 diapositivas
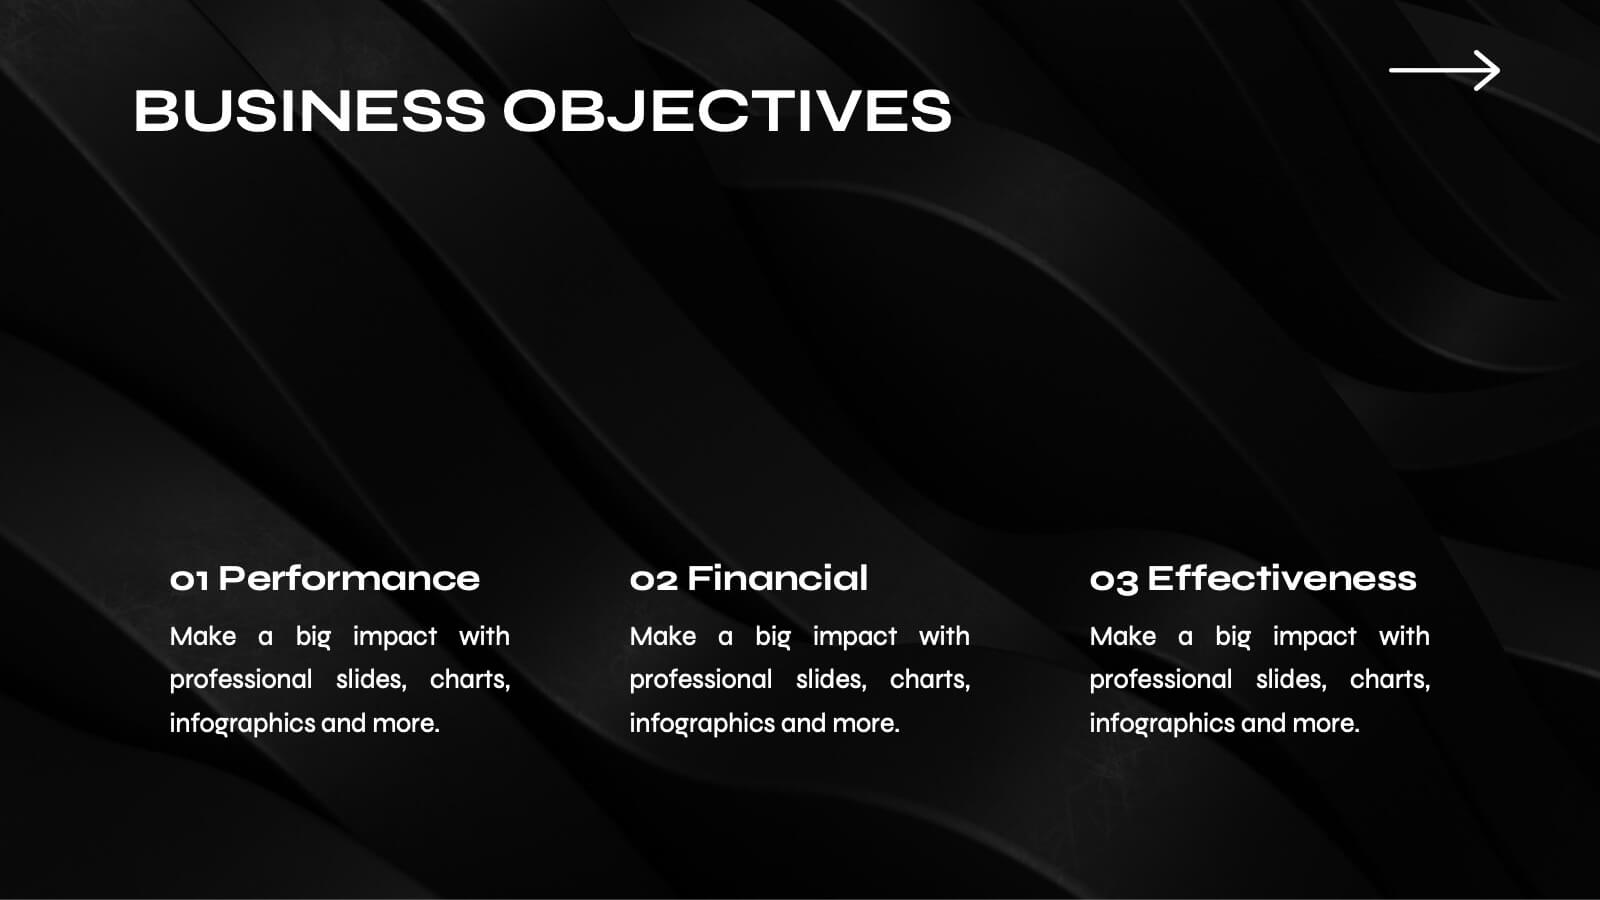
Business Goals and Objectives Presentation
Build a strong foundation for success with this business goals and objectives template! Designed to help organizations define clear targets and align strategies, this visual layout simplifies goal-setting and planning. Perfect for corporate teams, startups, and strategists. Fully customizable and compatible with PowerPoint, Keynote, and Google Slides for effortless editing.


7 diapositivas
SEO Specialist Infographic
A Search Engine Optimization (SEO) Specialist is a professional responsible for improving the visibility and ranking of a website in search engine results pages. The goal of this infographic template is to drive organic, unpaid traffic to a website by optimizing its content, structure, and technical aspects to align with search engine algorithms. Embark on a visually stimulating exploration of the dynamic world of SEO. This captivating infographic is carefully crafted to offer a comprehensive understanding of Search Engine Optimization, empowering both beginners and experts to enhance their online presence and rankings.


5 diapositivas
Team Collaboration Goals Presentation
Bring your teamwork vision to life with a clean, engaging layout that makes every goal feel clear and achievable. This presentation helps you outline priorities, align roles, and highlight shared milestones in a visually balanced format. Perfect for project kickoffs or planning sessions. Fully compatible with PowerPoint, Keynote, and Google Slides.


12 diapositivas
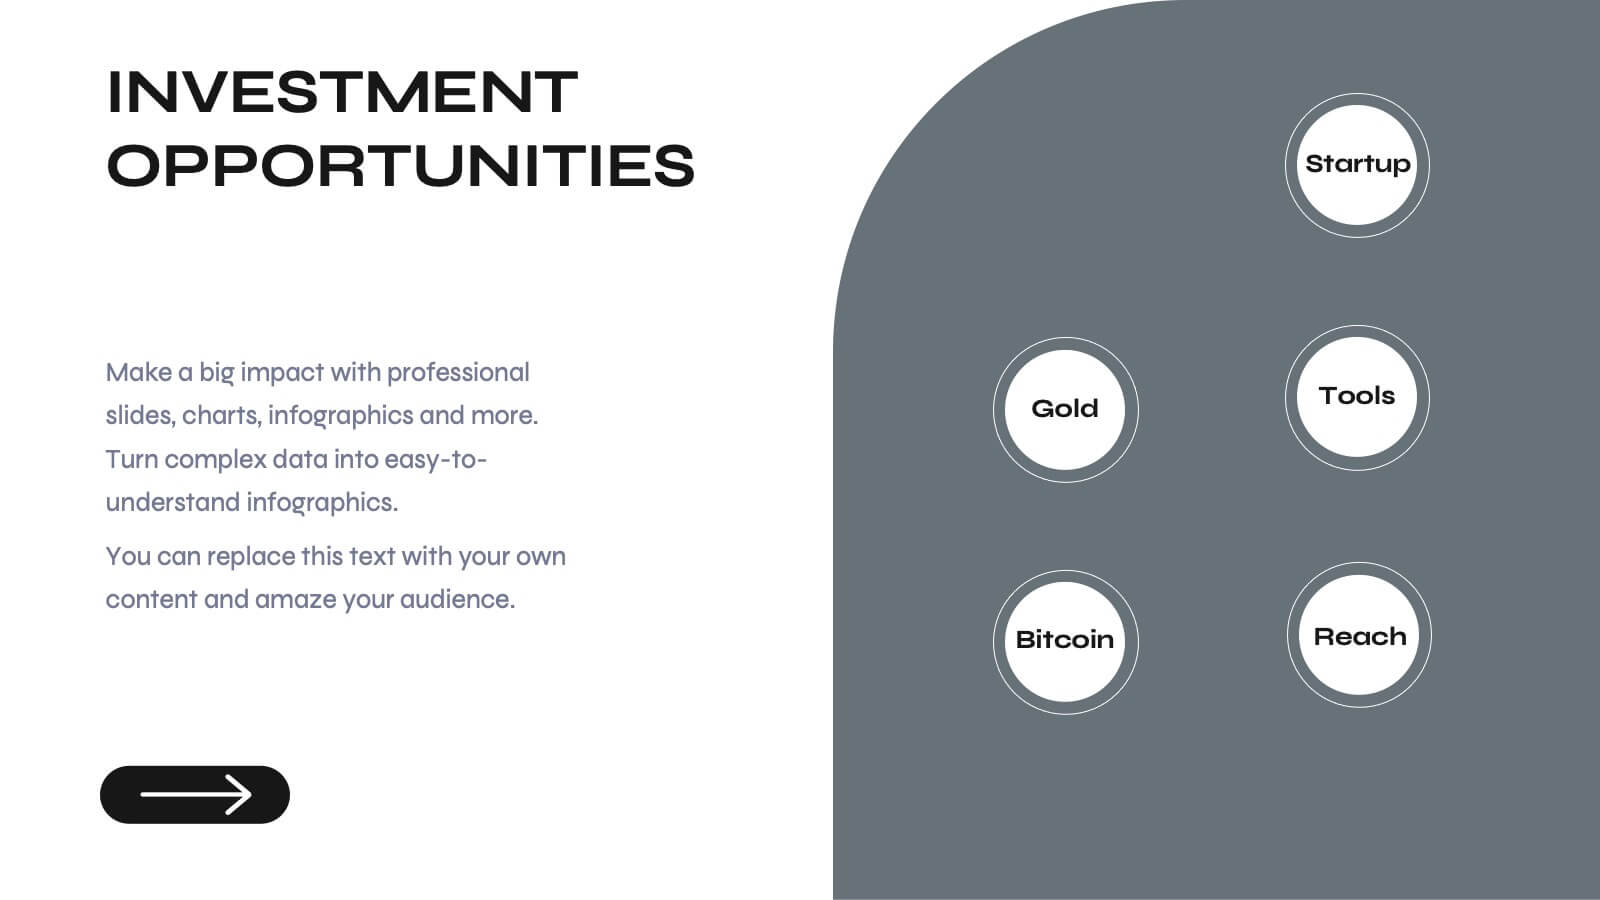
Investment and Financial Portfolio Analysis Presentation
Visualize your data with confidence using this Investment and Financial Portfolio Analysis Presentation. Designed to help finance professionals showcase quarterly performance, allocated budgets, total selling ratios, and project earnings in one powerful slide. With customizable charts including bar graphs, pyramids, and pie charts, you can present complex numbers in a clean and compelling way. Fully editable in PowerPoint, Keynote, and Google Slides.


6 diapositivas
TAM SAM SOM for Target Reach Forecasting Presentation
Break down your market reach with clarity using the TAM SAM SOM for Target Reach Forecasting Presentation. This sleek, layered circle diagram is ideal for illustrating your total addressable market, serviceable market, and obtainable market. Customize easily in PowerPoint, Keynote, or Google Slides to align with your brand and business strategy.


8 diapositivas
Market Research Survey Analysis Presentation
Present your Market Research Survey Analysis with this visually engaging template, designed for clear data visualization and insights presentation. Featuring an intuitive infographic layout, this template allows you to highlight key survey findings, customer insights, and strategic takeaways. Fully customizable in PowerPoint, Keynote, and Google Slides, you can adjust colors, edit text, and modify icons to align with your business needs.


2 diapositivas
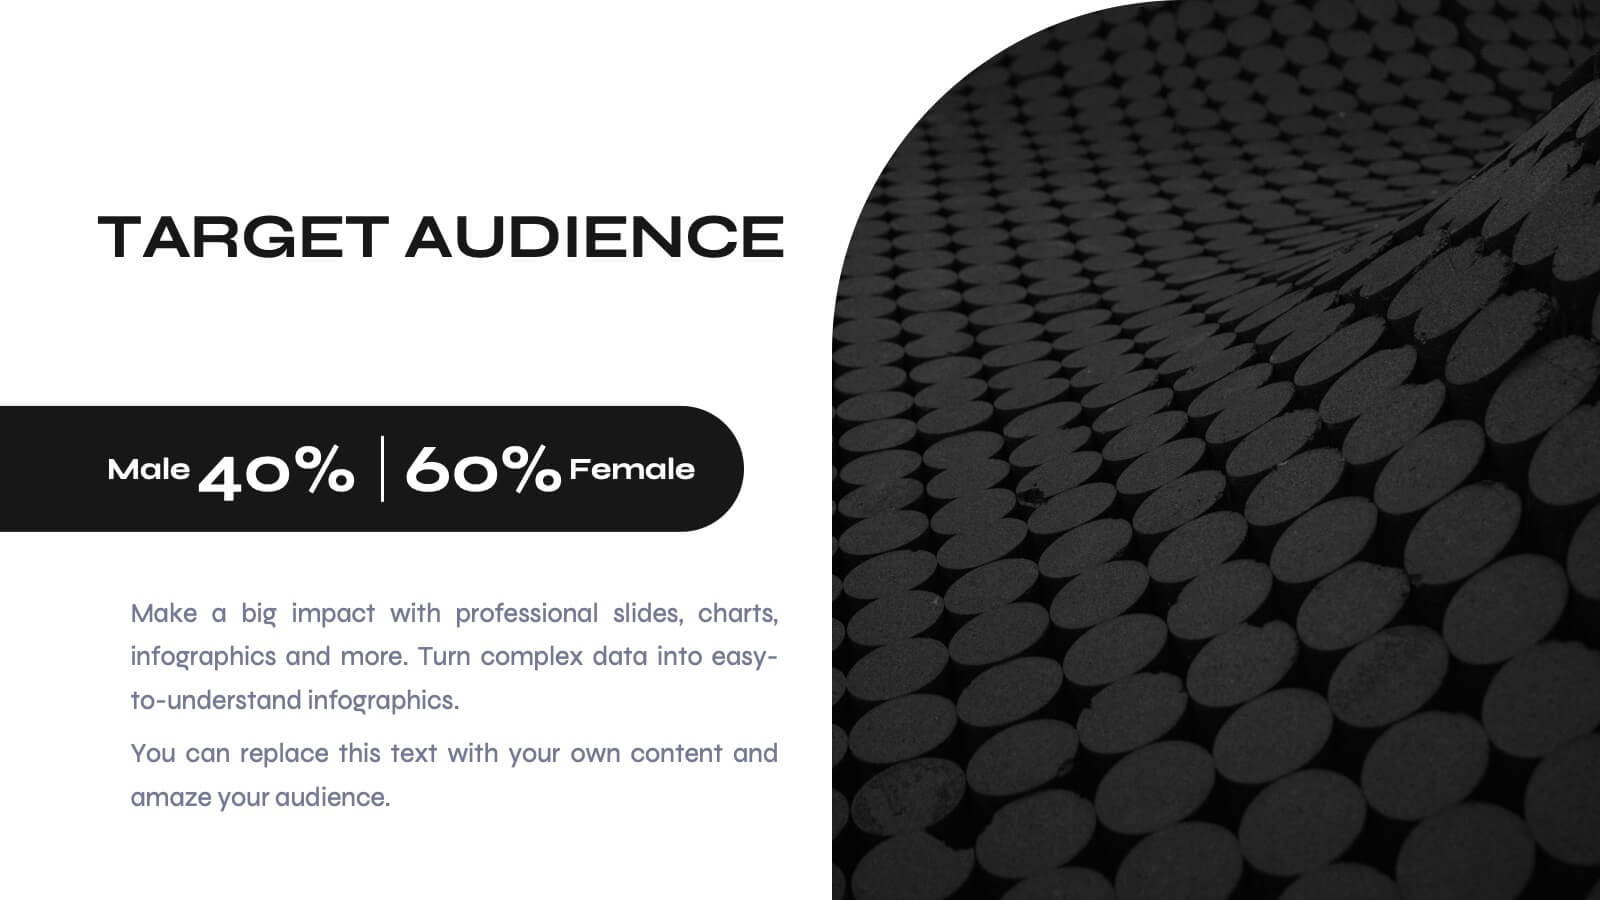
Detailed Buyer Profile Analysis Layout Presentation
Showcase a clear snapshot of your customer insights with this Detailed Buyer Profile Analysis Layout. This modern slide helps you outline bios, goals, and key traits using labeled icons, progress bars, and a visual profile section. Ideal for marketing teams, persona development, and product targeting. Fully editable in PowerPoint, Keynote, and Google Slides.


7 diapositivas
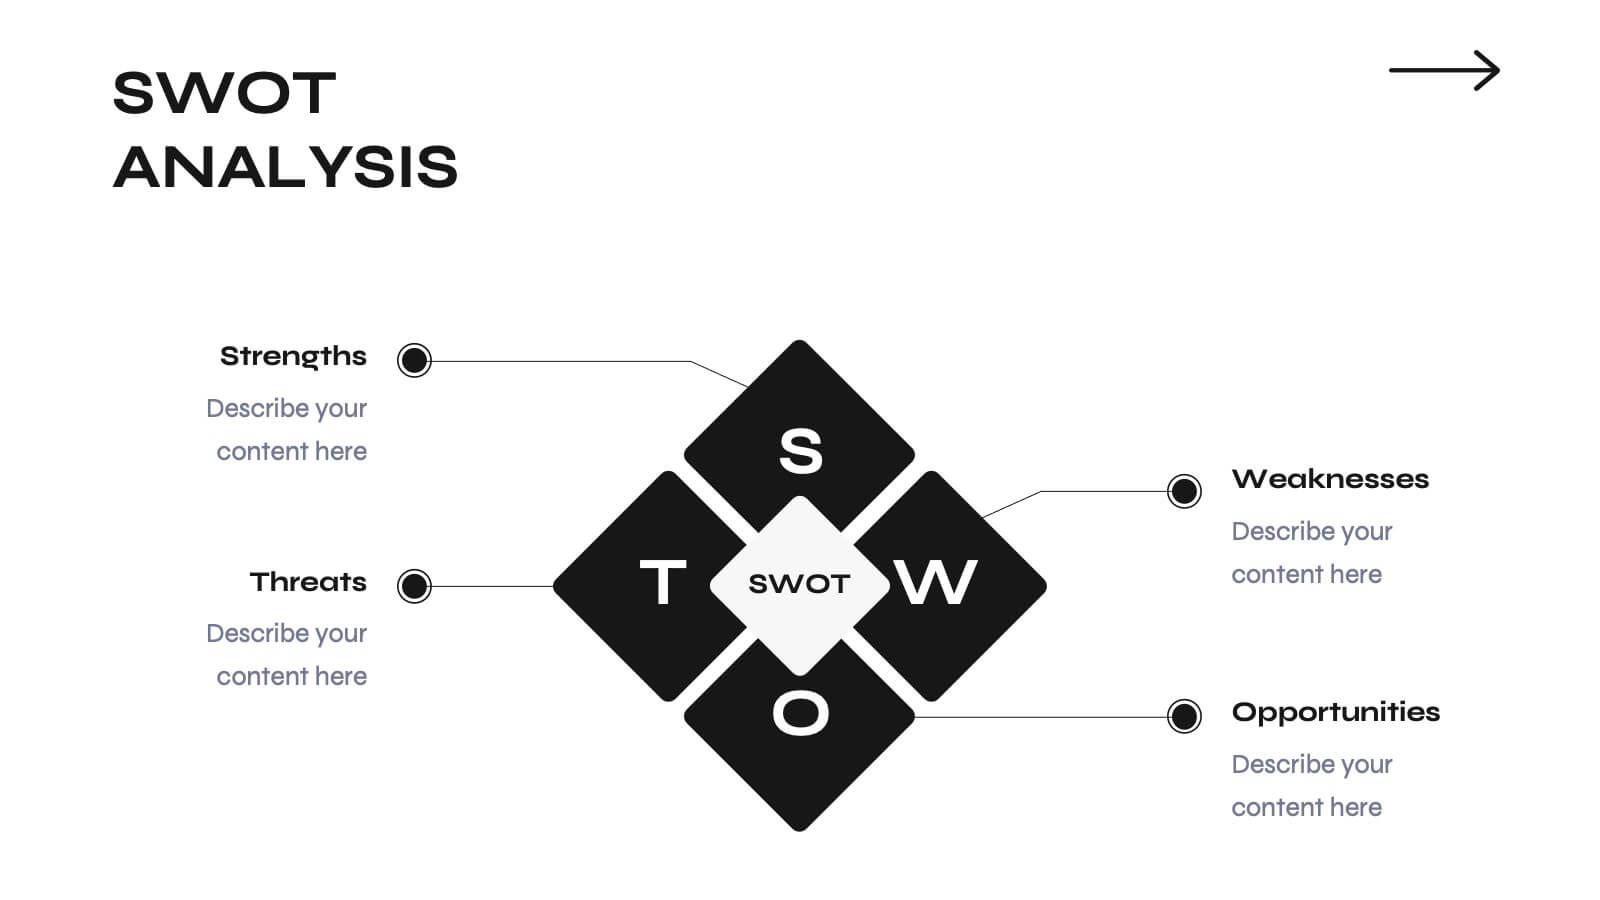
Strategic Matrix Comparison Framework Presentation
Easily compare business risks, priorities, or strategic choices with this matrix comparison framework. Featuring editable grids for mapping likelihood and impact, it’s perfect for decision-making and performance analysis. Highlight key categories using color-coded segments. Fully customizable and compatible with PowerPoint, Google Slides, and Keynote for professional presentations.


12 diapositivas
Timeline Path to Market Strategy Presentation
Outline your market strategy with this step-by-step timeline slide. Ideal for product launches, go-to-market plans, or business rollouts. Includes 6 editable phases with directional arrows, year markers, and text boxes for customization. Fully compatible with PowerPoint, Keynote, and Google Slides—perfect for marketers, strategists, and business development teams.


23 diapositivas
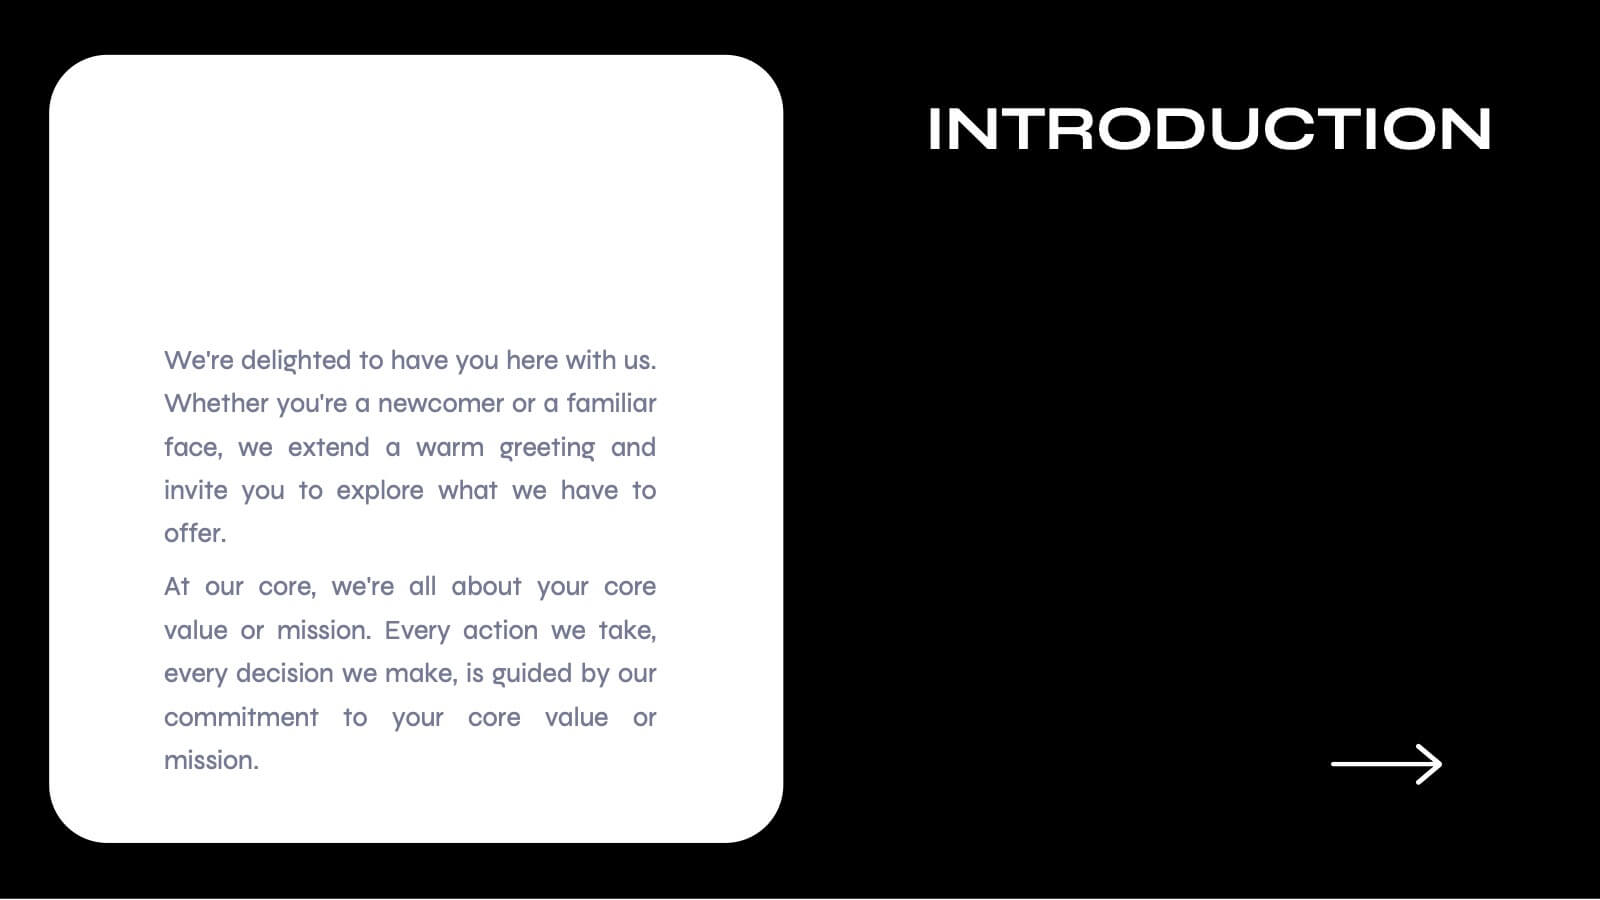
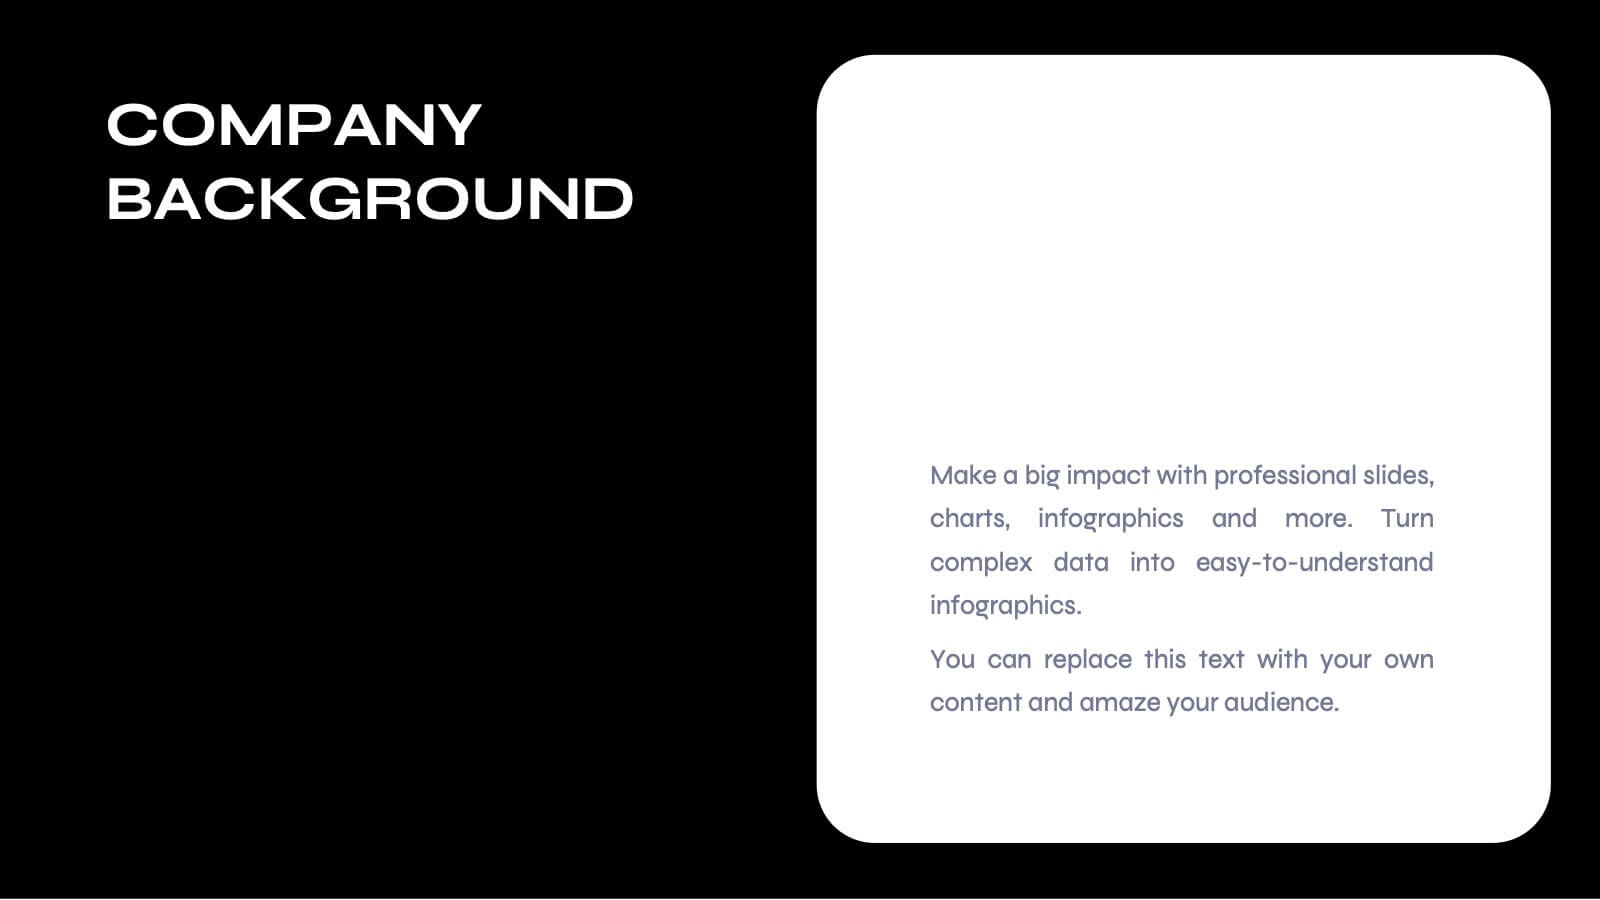
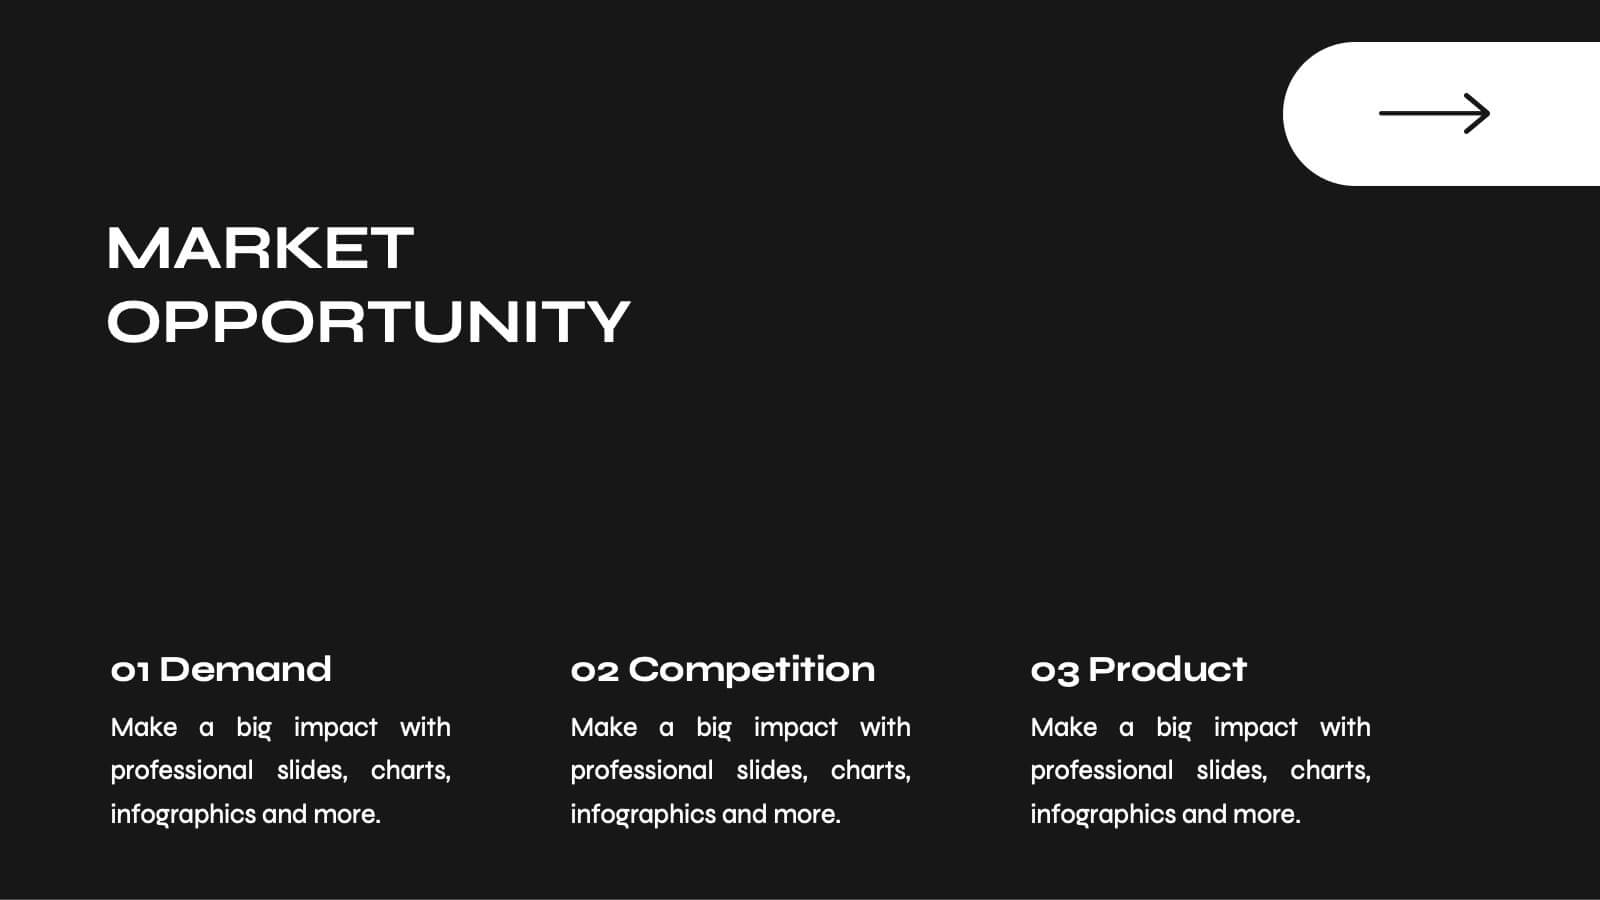
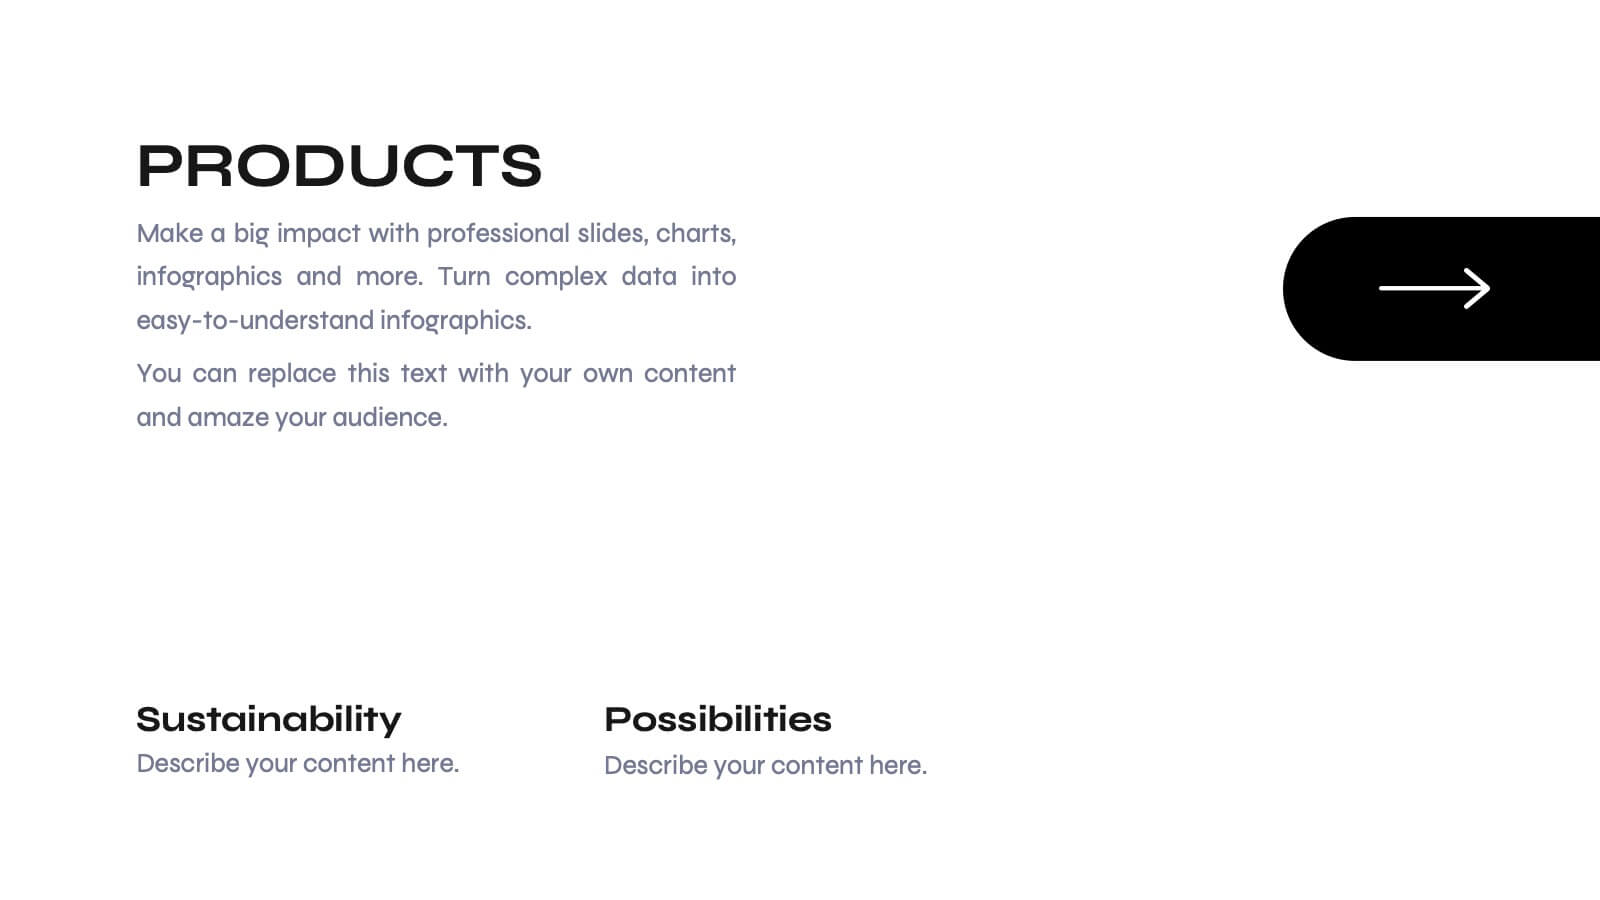
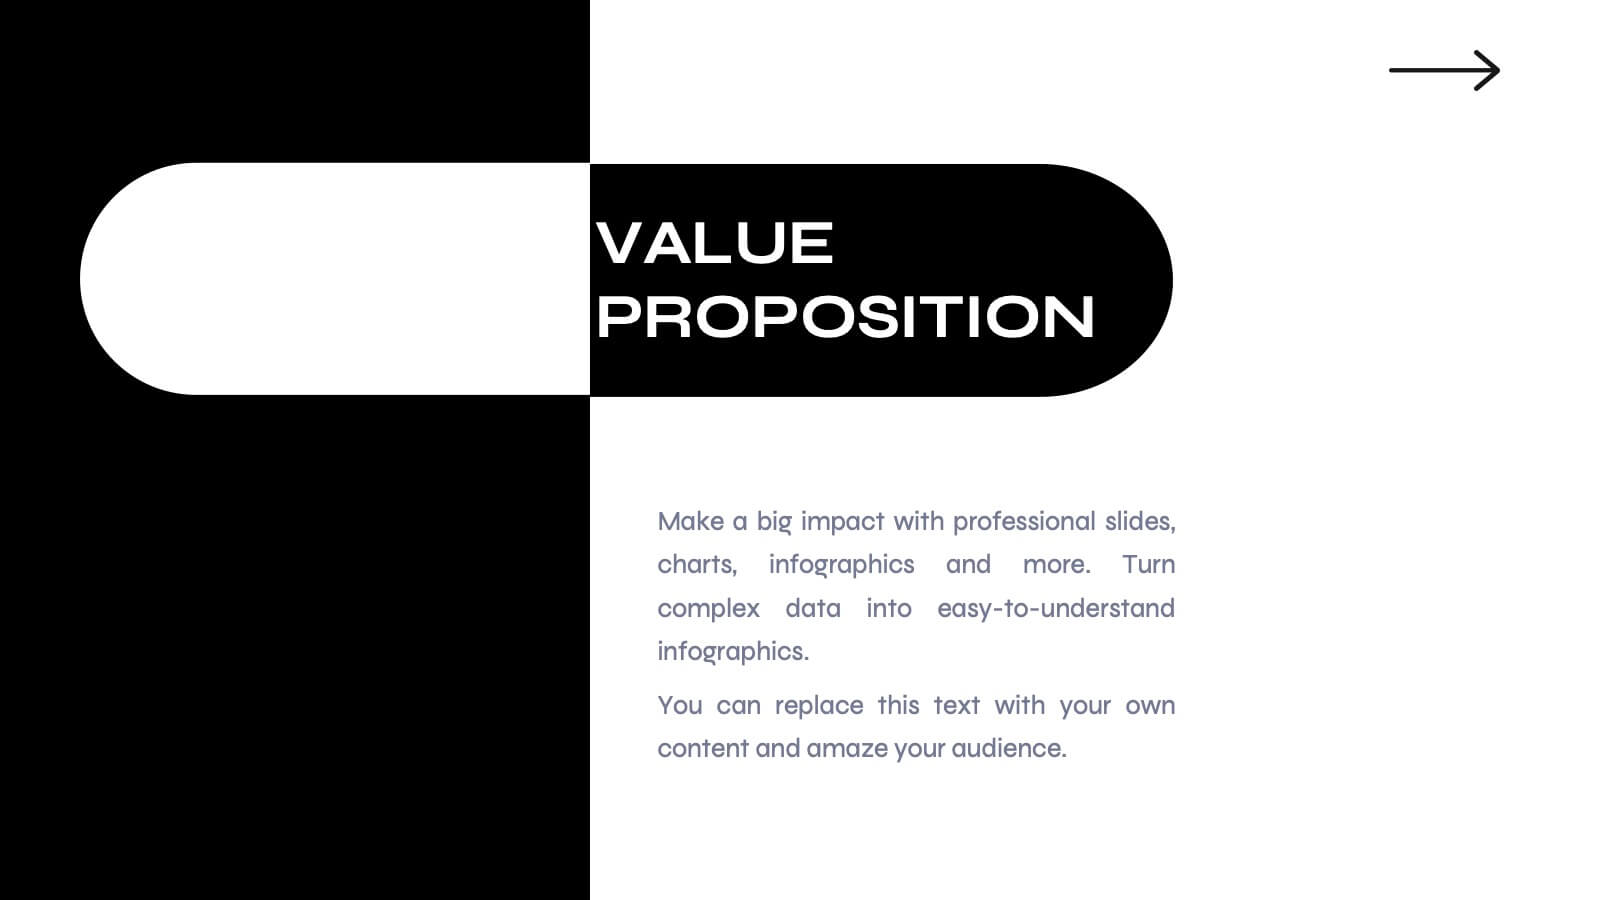
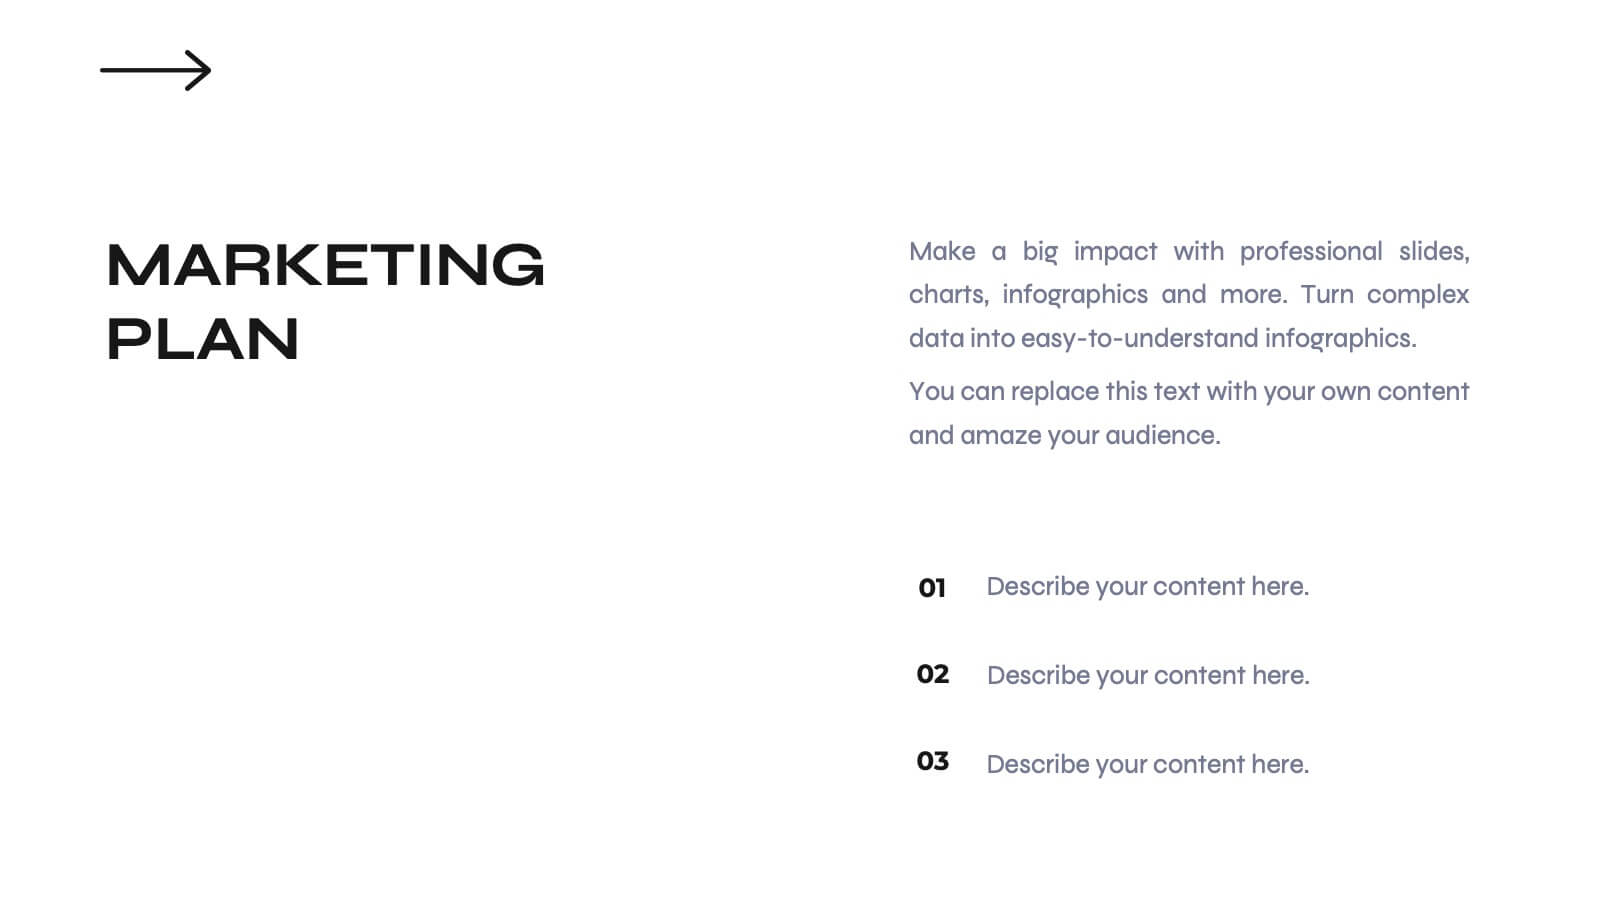
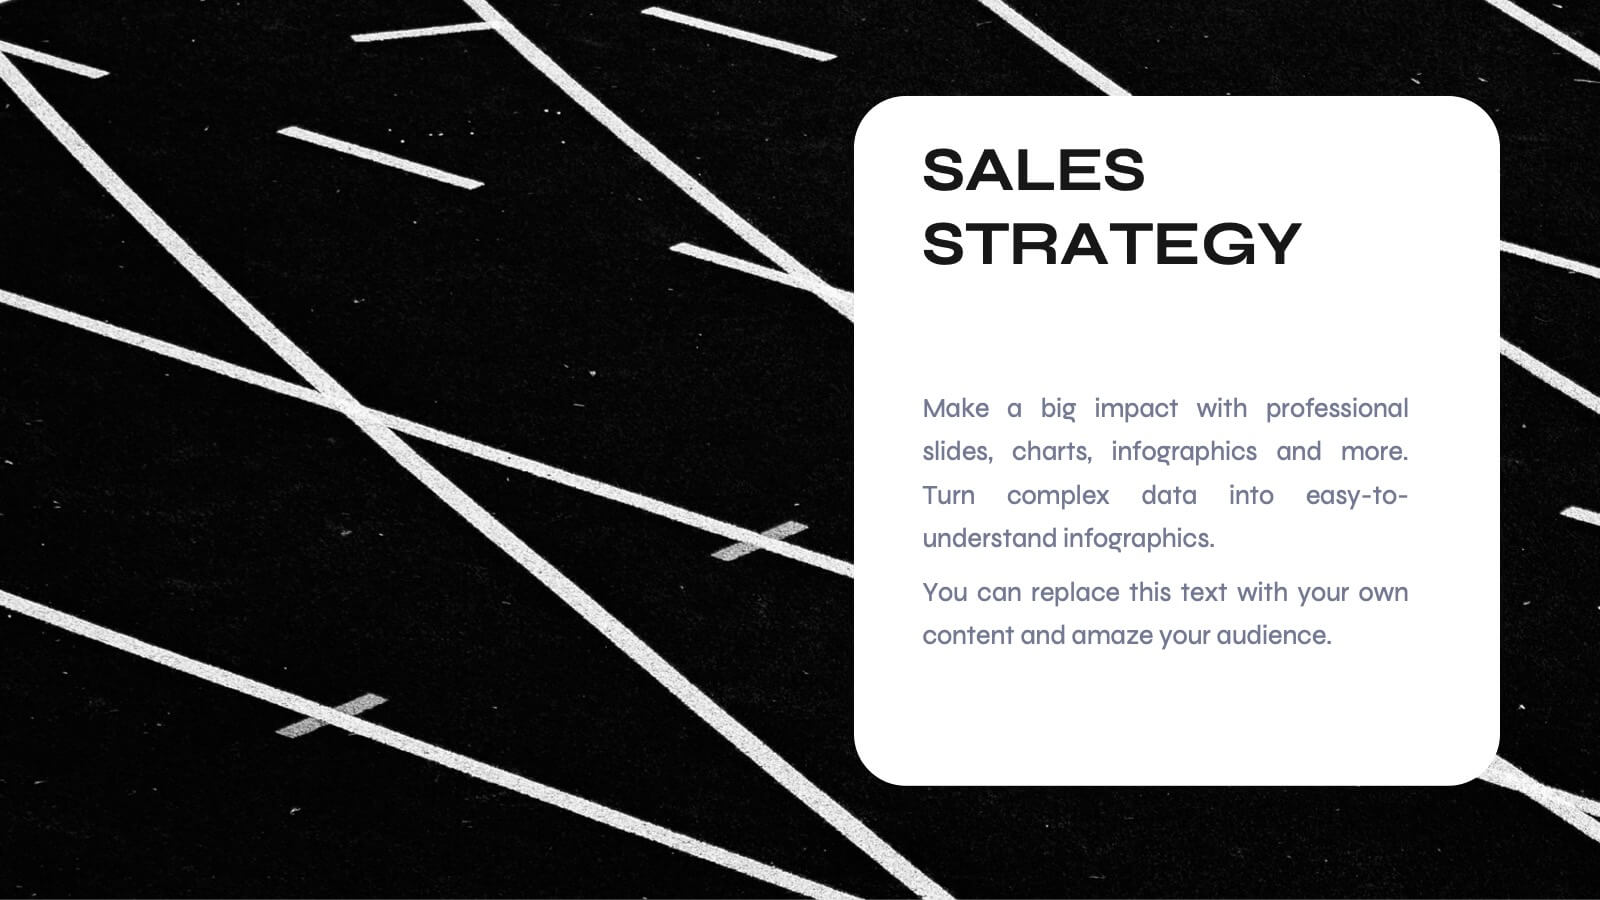
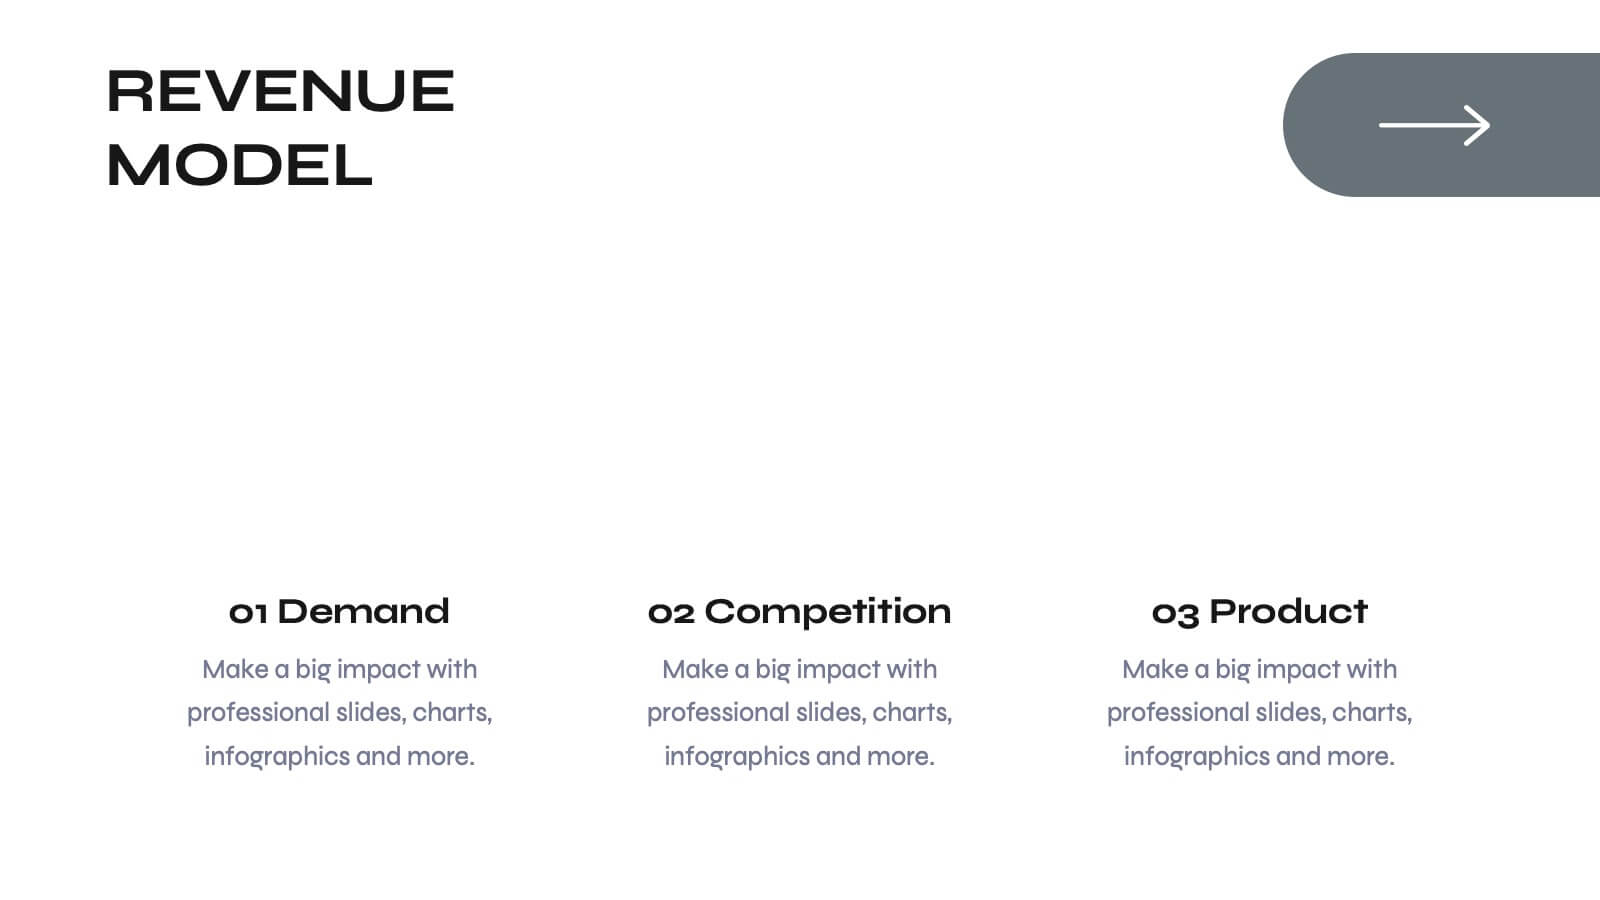
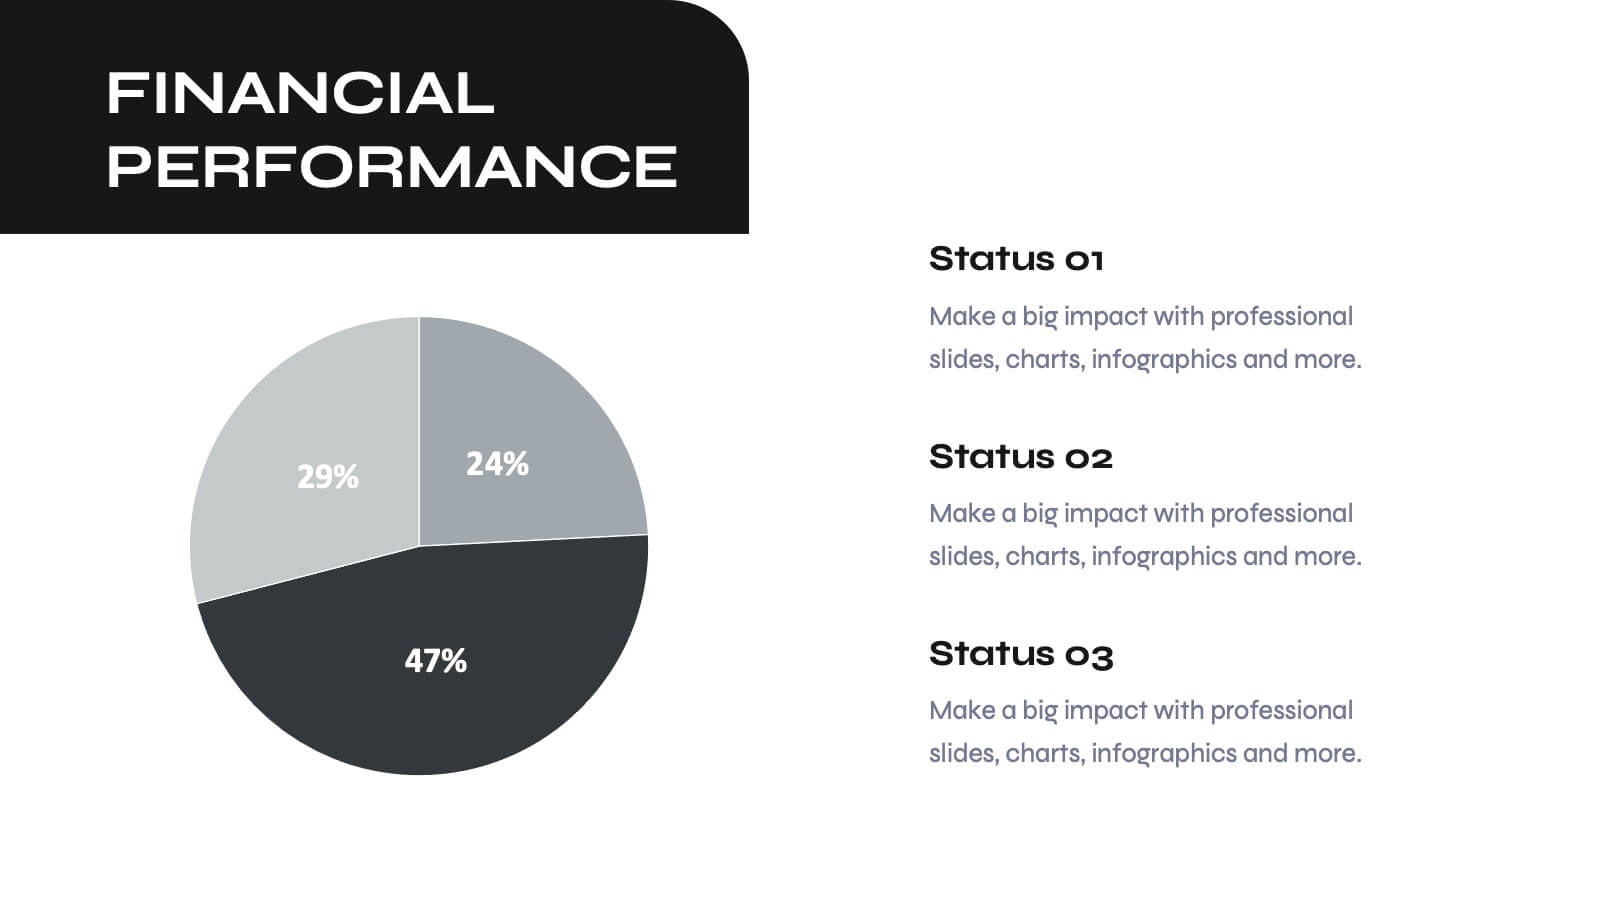
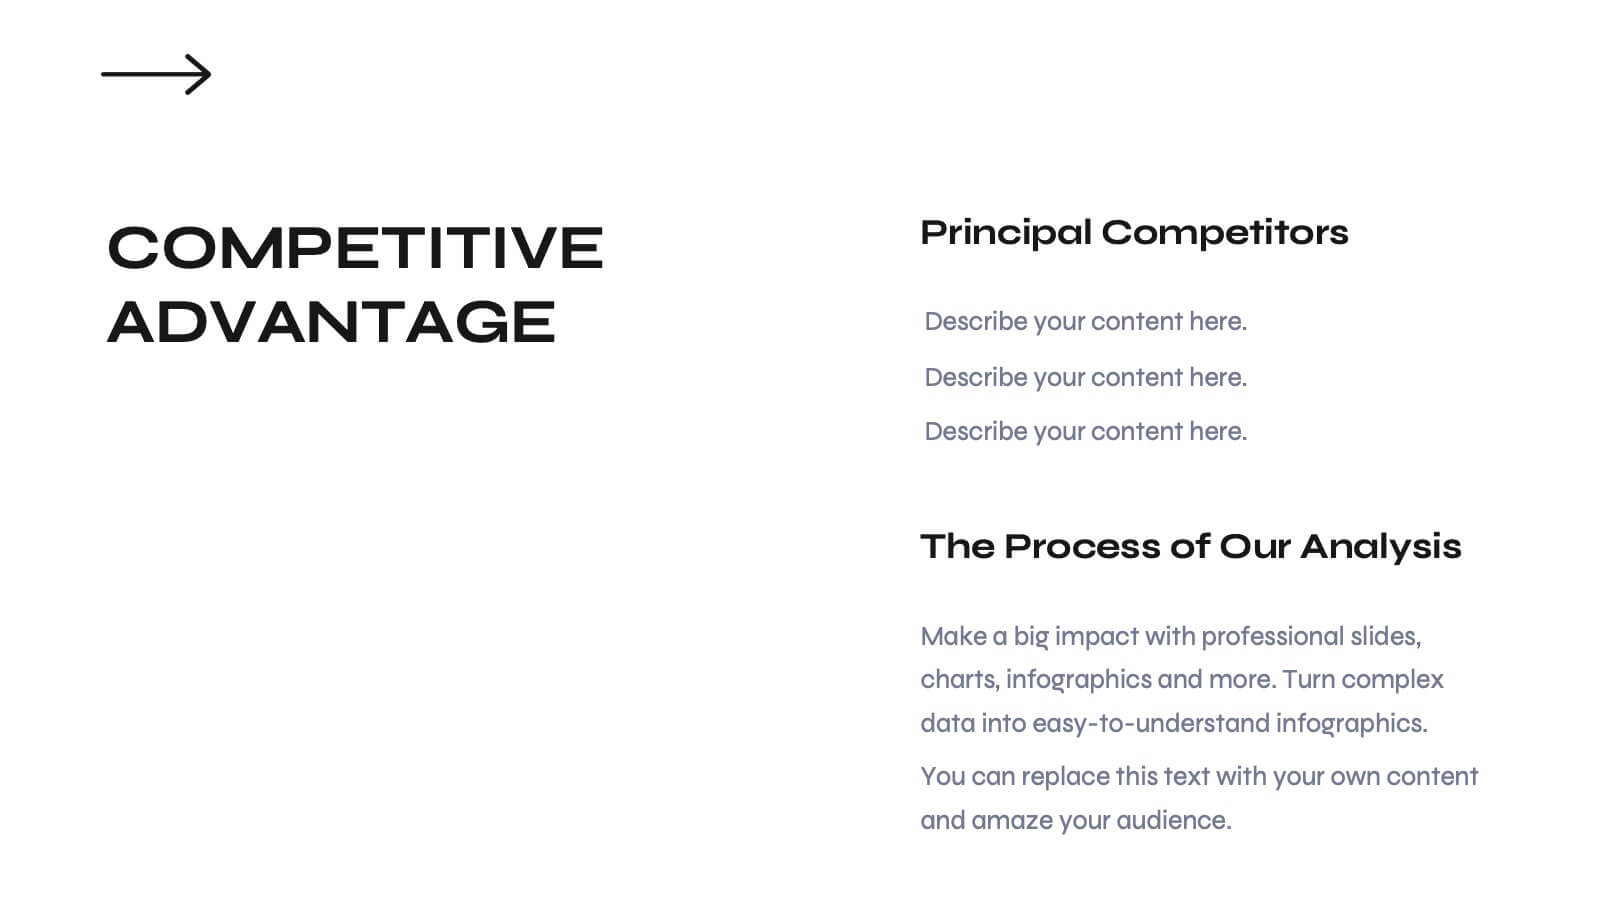
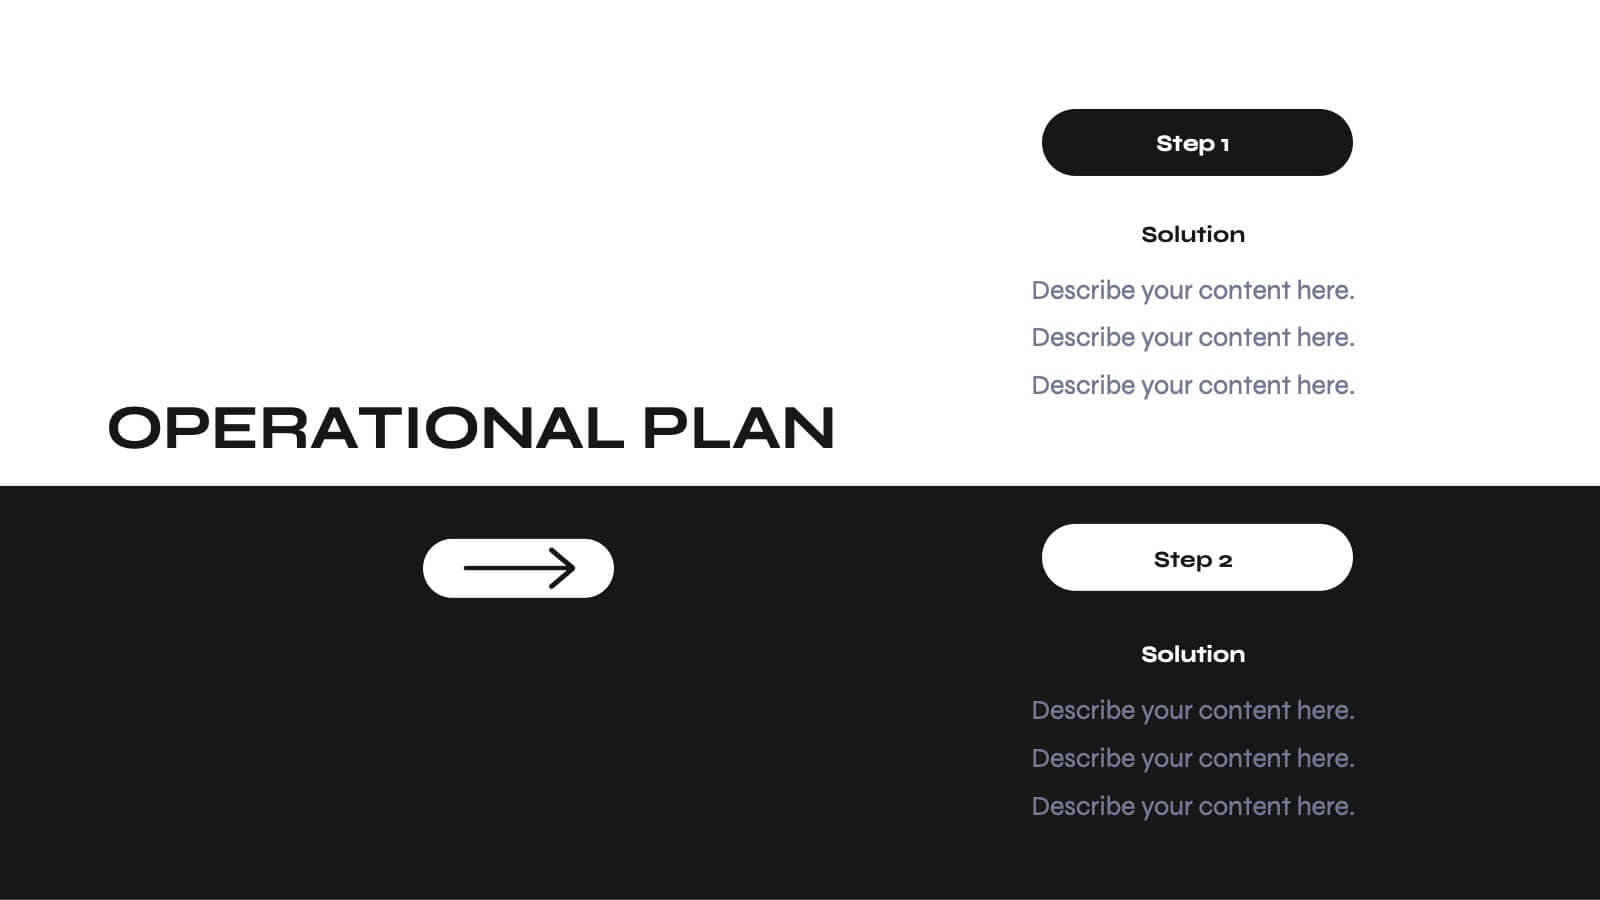
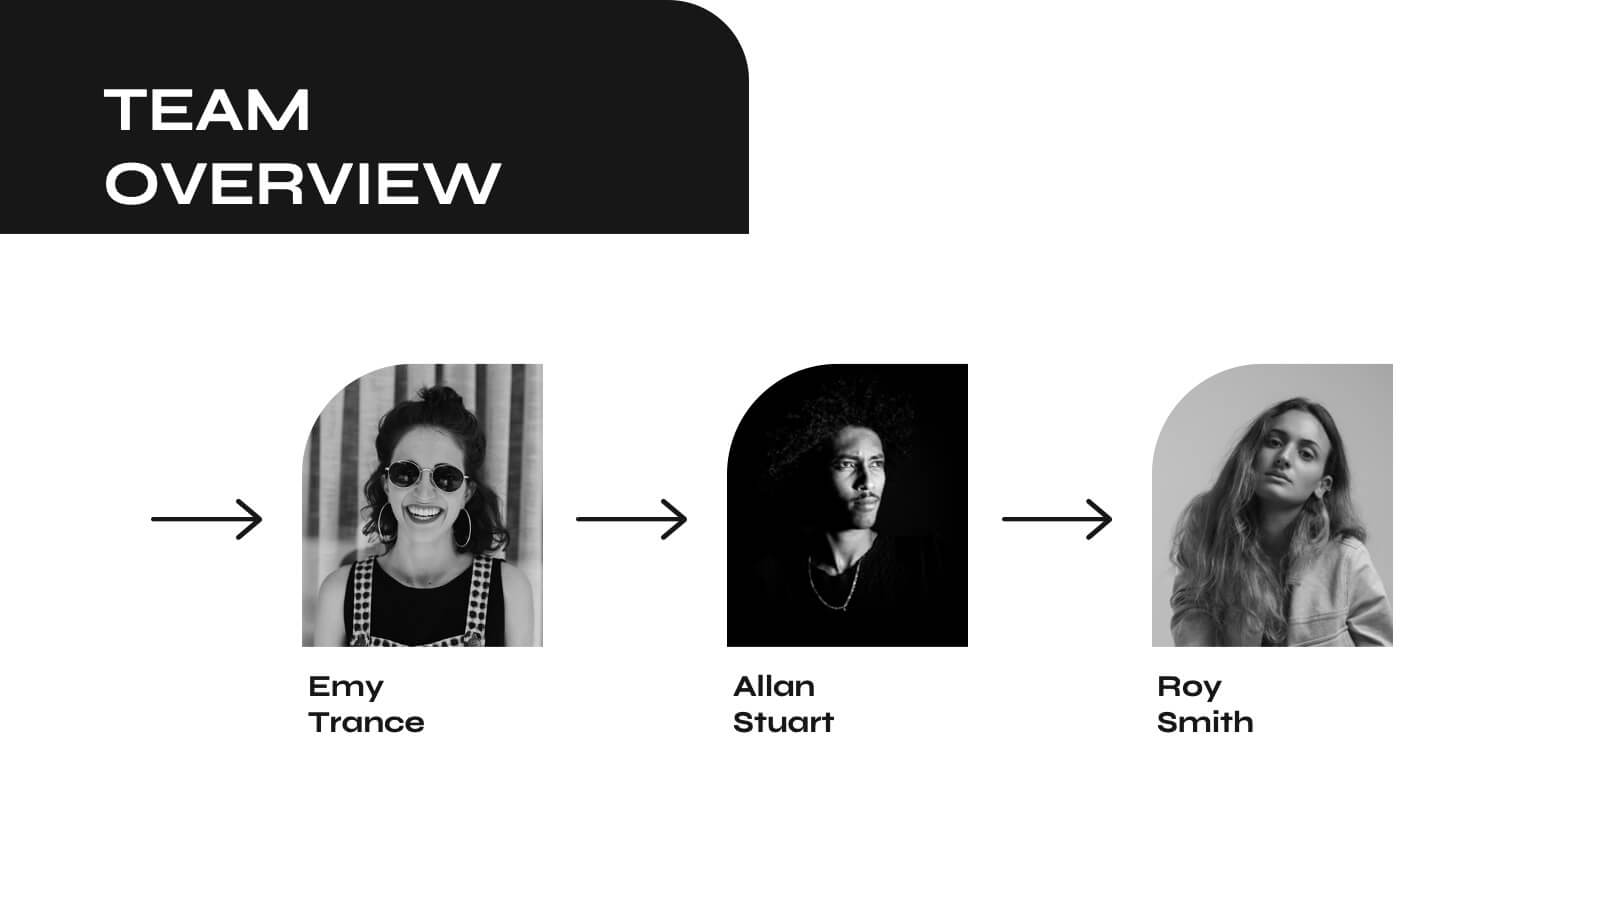
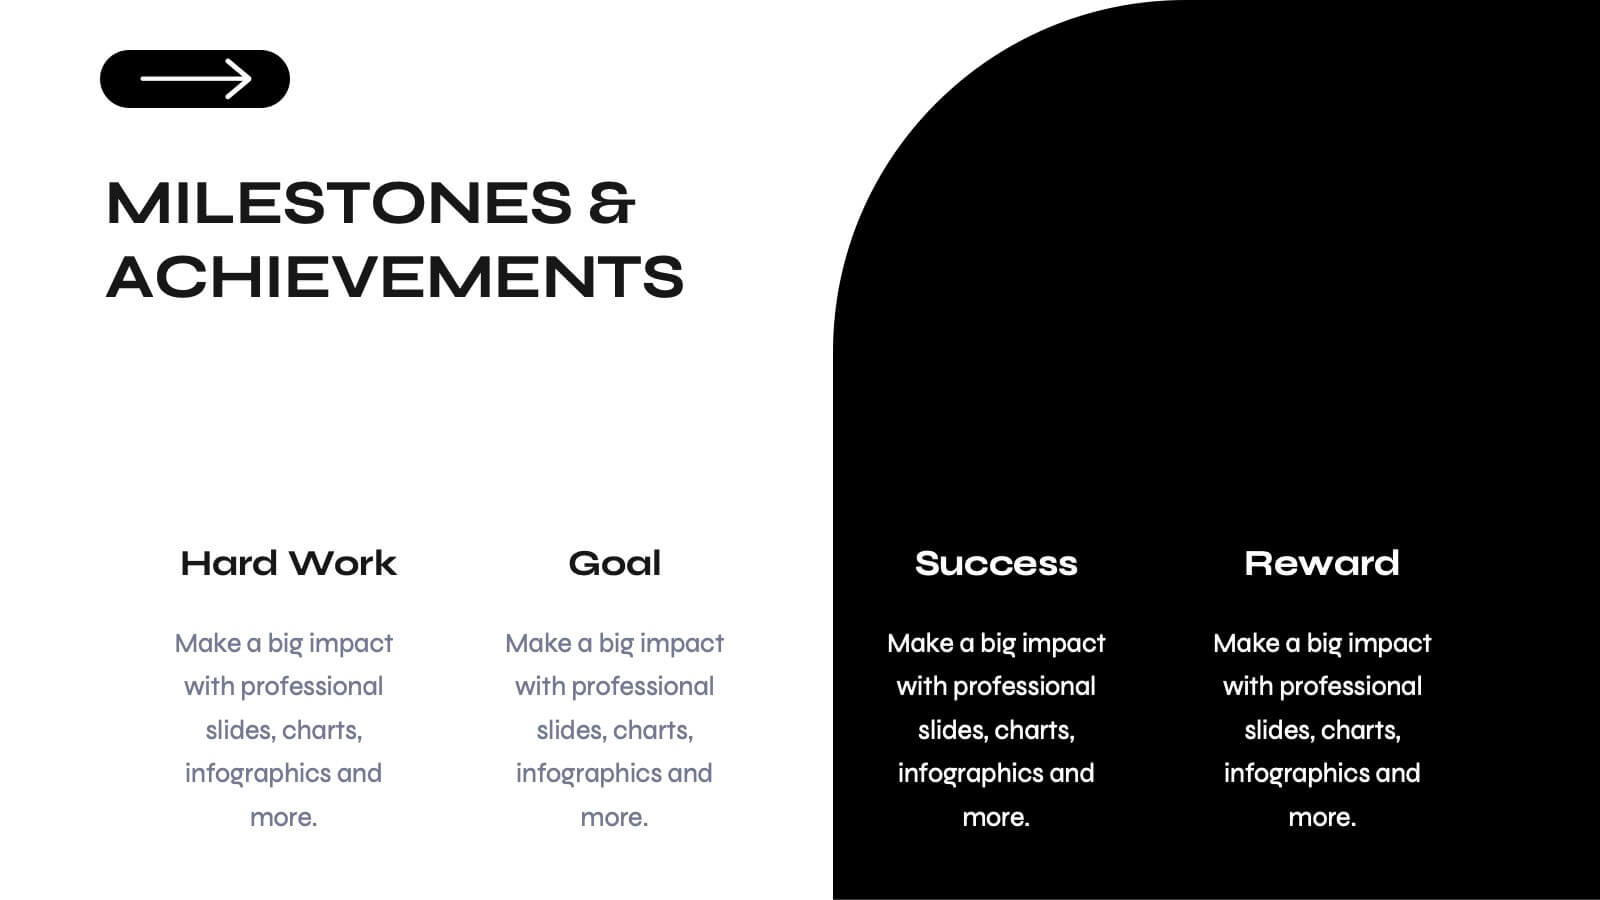
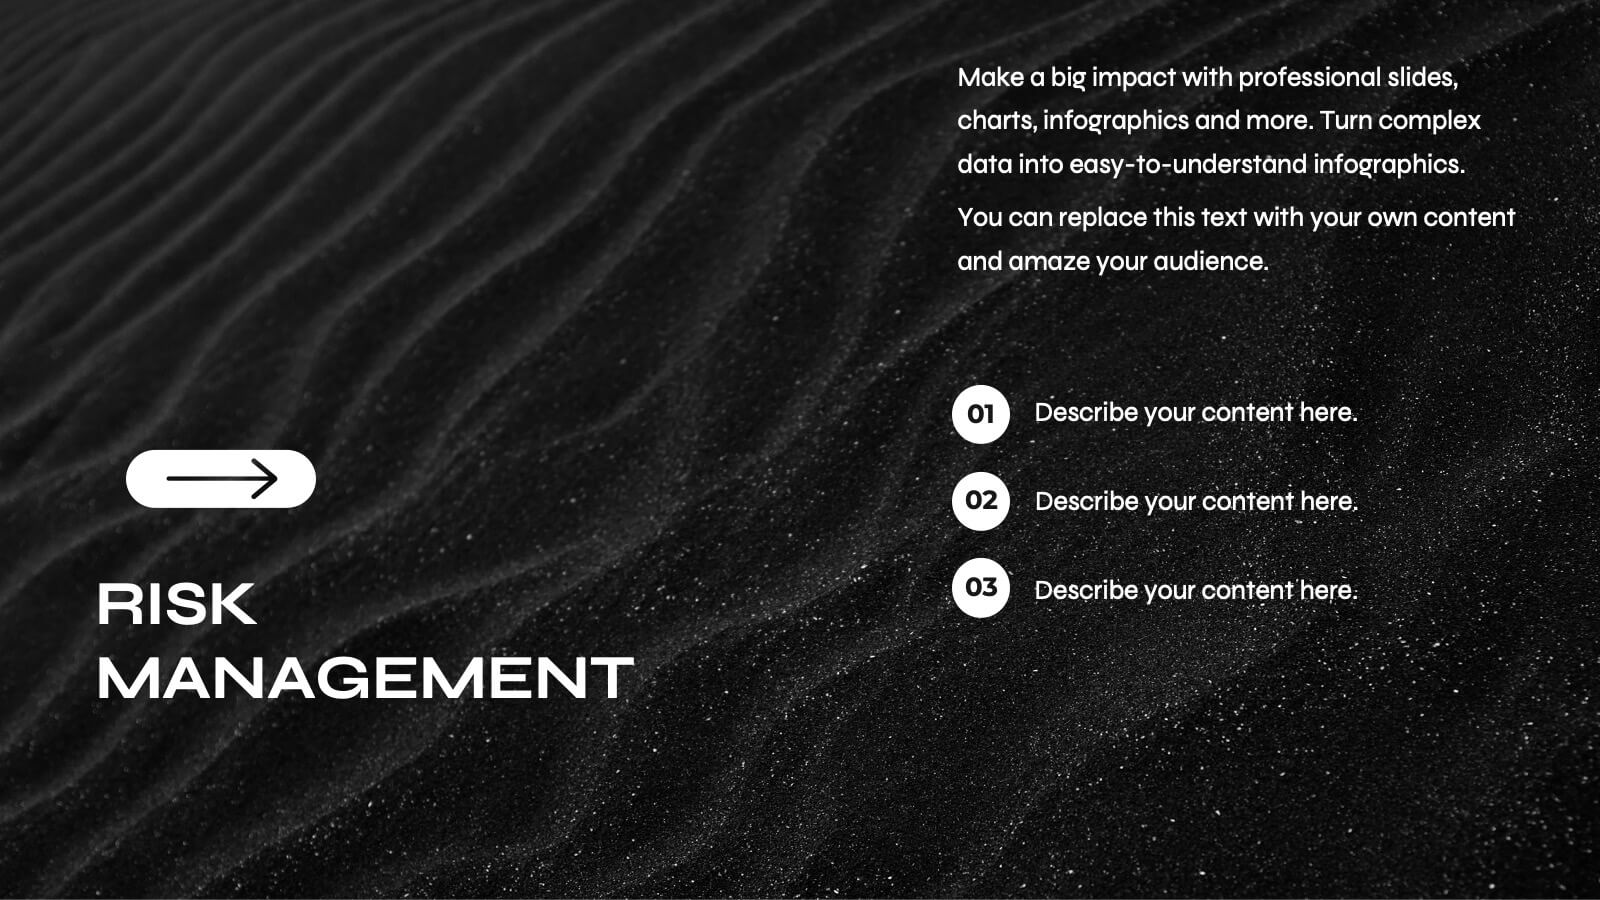
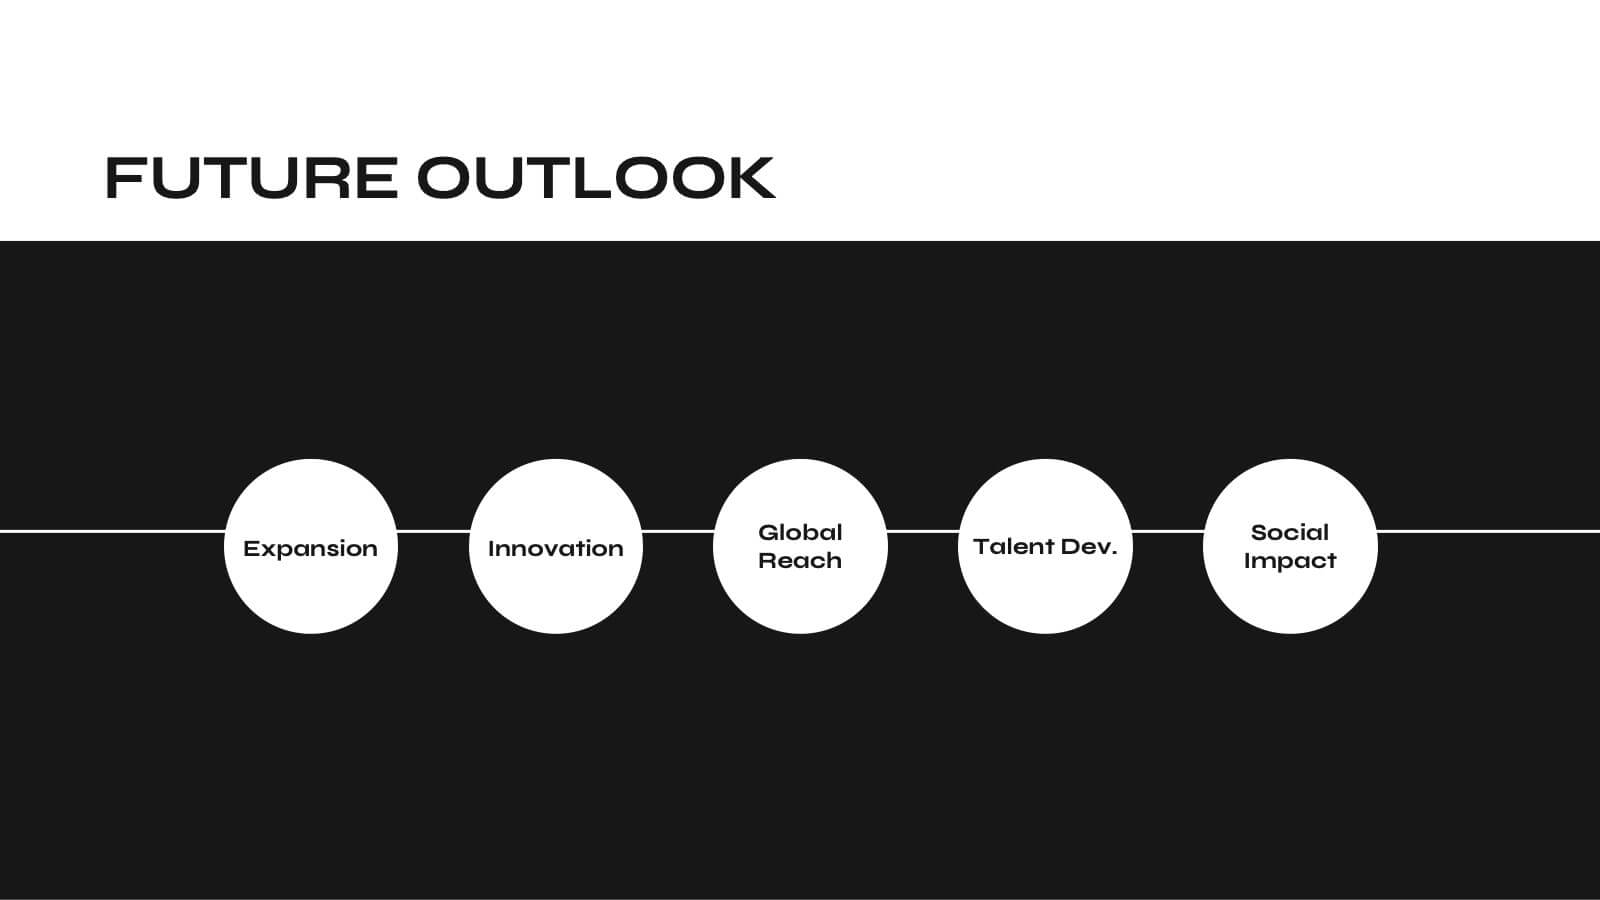
Odyssey Small Business Pitch Deck Presentation
Elevate your business pitch with this sleek, monochrome presentation template. Perfect for presenting company backgrounds, market opportunities, and financial performance, it features a minimalist design that enhances clarity and impact. Highlight your value proposition and strategic plans to captivate investors. Compatible with PowerPoint, Keynote, and Google Slides, it ensures seamless presentations on any platform.


4 diapositivas
HR Onboarding and Hiring Plan Deck Presentation
Streamline recruitment and training workflows with the HR Onboarding and Hiring Plan Deck. This presentation template helps visualize hiring stages, orientation paths, and employee milestones using structured flowcharts. Ideal for HR professionals and team leads. Fully editable in PowerPoint, Keynote, and Google Slides for easy customization and organizational branding.


5 diapositivas
Creative Watercolor Style Presentation
Splash your ideas onto the page with a layout that blends artistic watercolor accents and clean, modern structure. This presentation helps you showcase insights, steps, or concepts in a visually soothing format that feels both creative and professional. Ideal for storytelling or branding discussions. Fully compatible with PowerPoint, Keynote, and Google Slides.


4 diapositivas
Culinary Business Branding Deck Presentation
Visualize your culinary identity with the Culinary Business Branding Deck Presentation. Designed with a segmented chef hat illustration, this slide helps you showcase four brand pillars—perfect for restaurants, food startups, and culinary consultants. Use it to highlight your cuisine focus, customer experience, service style, and ambiance. Fully editable in PowerPoint, Keynote, Google Slides, and Canva.


6 diapositivas
Veterinary School Infographics
Explore the world of Veterinary School with our customizable infographic template. This template is fully compatible with popular presentation software like PowerPoint, Keynote, and Google Slides, allowing you to easily customize it to illustrate and communicate various aspects of veterinary education and training. The Veterinary School infographic template offers a visually engaging platform to outline the curriculum, admissions process, career prospects, and importance of veterinary education. Whether you're a veterinary student, educator, prospective applicant, or simply interested in animal healthcare, this template provides a user-friendly canvas to create informative presentations and educational materials. Enhance your understanding of Veterinary School with this SEO-optimized infographic template, thoughtfully designed for clarity and ease of use. Customize it to showcase admission requirements, core subjects, clinical training, and the impact of veterinary professionals on animal health and welfare. Ensure that your audience gains valuable insights into the world of veterinary education. Start crafting your personalized infographic today to explore the realm of Veterinary School.
5 diapositivas
Workflow Arrow Infographic Presentation
Highlight each step of your process with clarity using the Workflow Arrow Infographic Presentation. This slide set features bold horizontal arrows that guide the viewer from one stage to the next, making it perfect for visualizing timelines, processes, or sequences. Each arrow is numbered and color-coded for easy reference, with accompanying text areas to elaborate on each step. Fully editable in PowerPoint, Keynote, and Google Slide.


23 diapositivas
Kale Market Research Presentation
Elevate your market research presentation with this sleek template! Includes sections for introduction, objectives, data collection, analysis, key findings, and recommendations. Perfect for presenting insights, implications, and future research directions. Compatible with PowerPoint, Keynote, and Google Slides, ensuring a visually appealing and professional look. Make your data shine!


26 diapositivas
Philp Presentation Template
Our Philp template is perfect for presenting your furniture shop business. It has a modern design, allowing you to make your product/service stands out from the crowd, and it’s easily customizable so that it can be tweaked to your exact needs. This template contains slides with beautiful graphics and captions describing the most important aspects of your business. Our presentation template can be used to promote your products, services, benefits and much more! This template can also be used to present your company's vision and mission, business strategy, portfolio and more.