


Características


¿Tienes alguna pregunta?
Recomendar


5 diapositivas
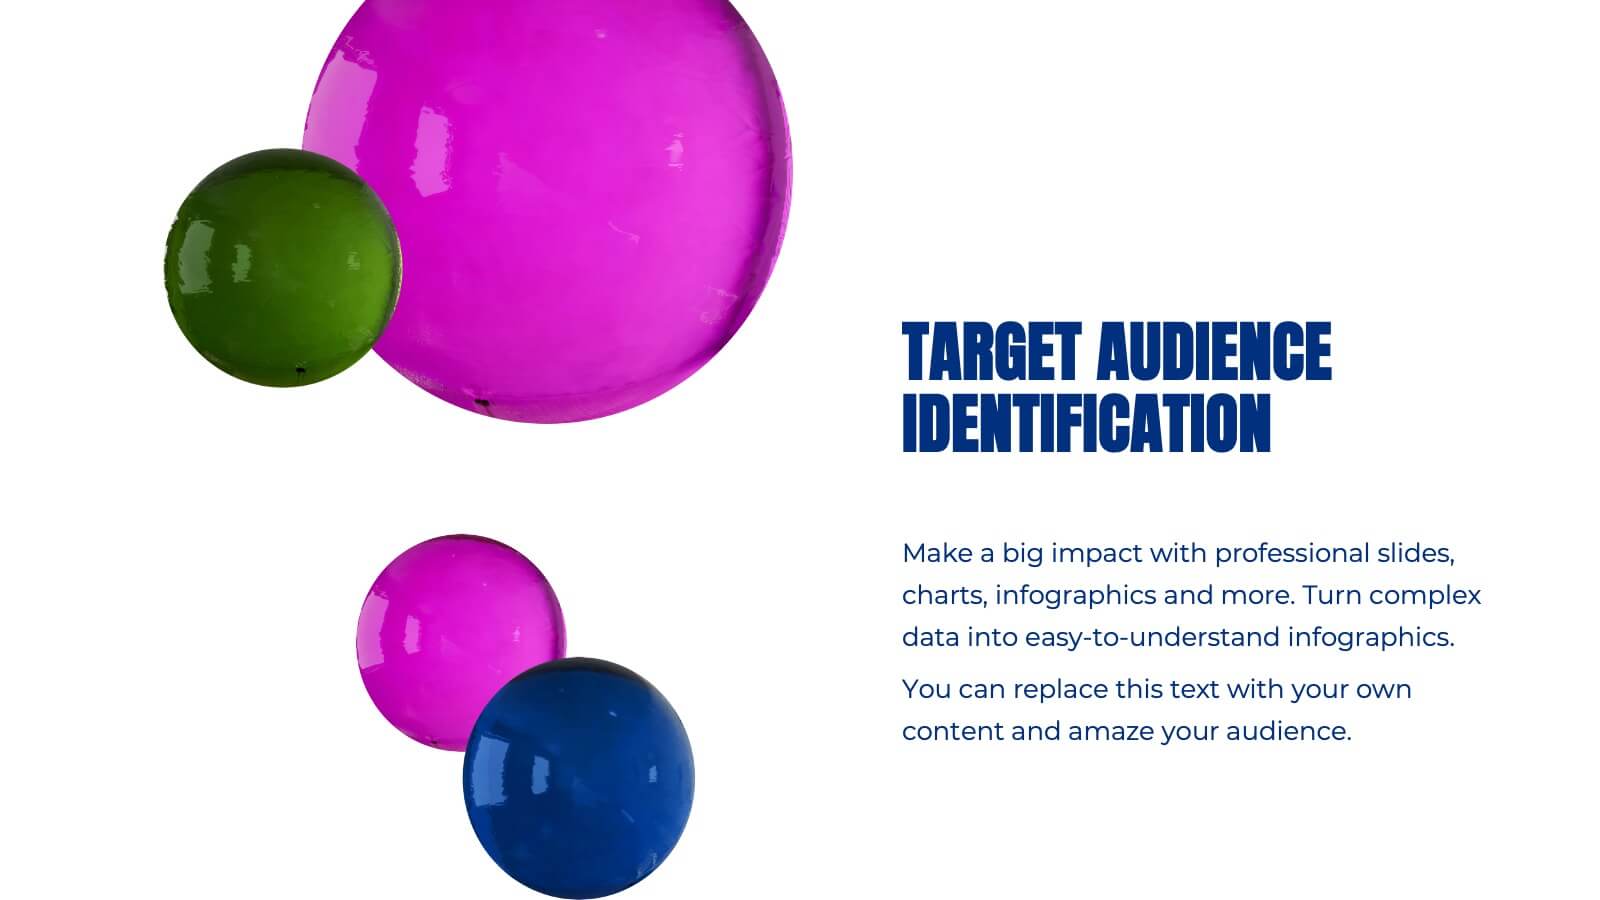
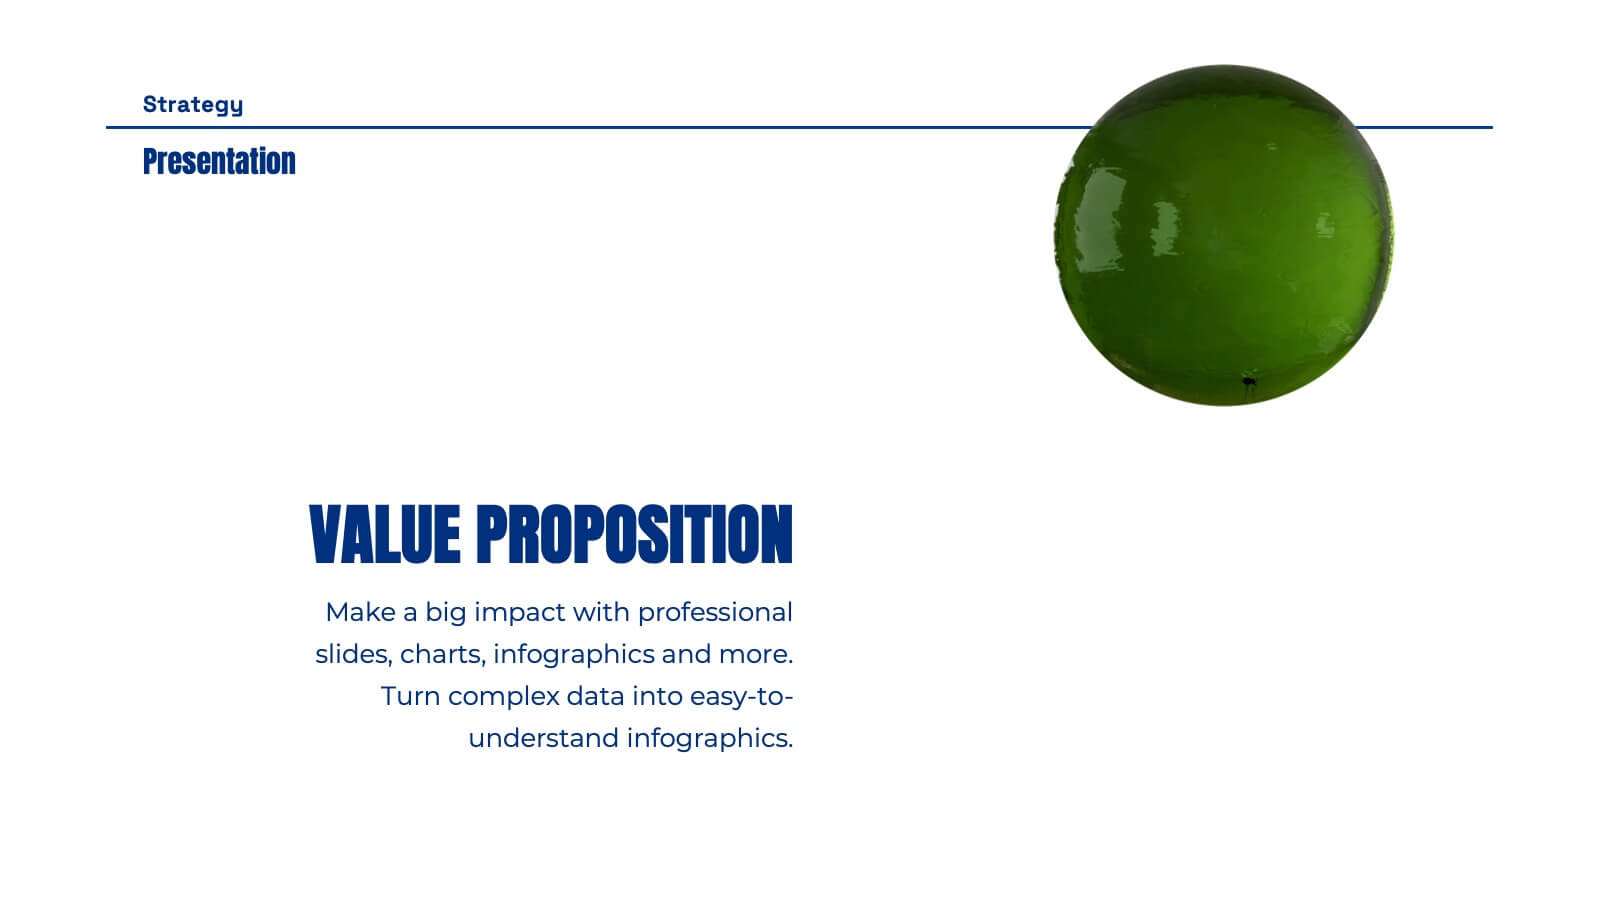
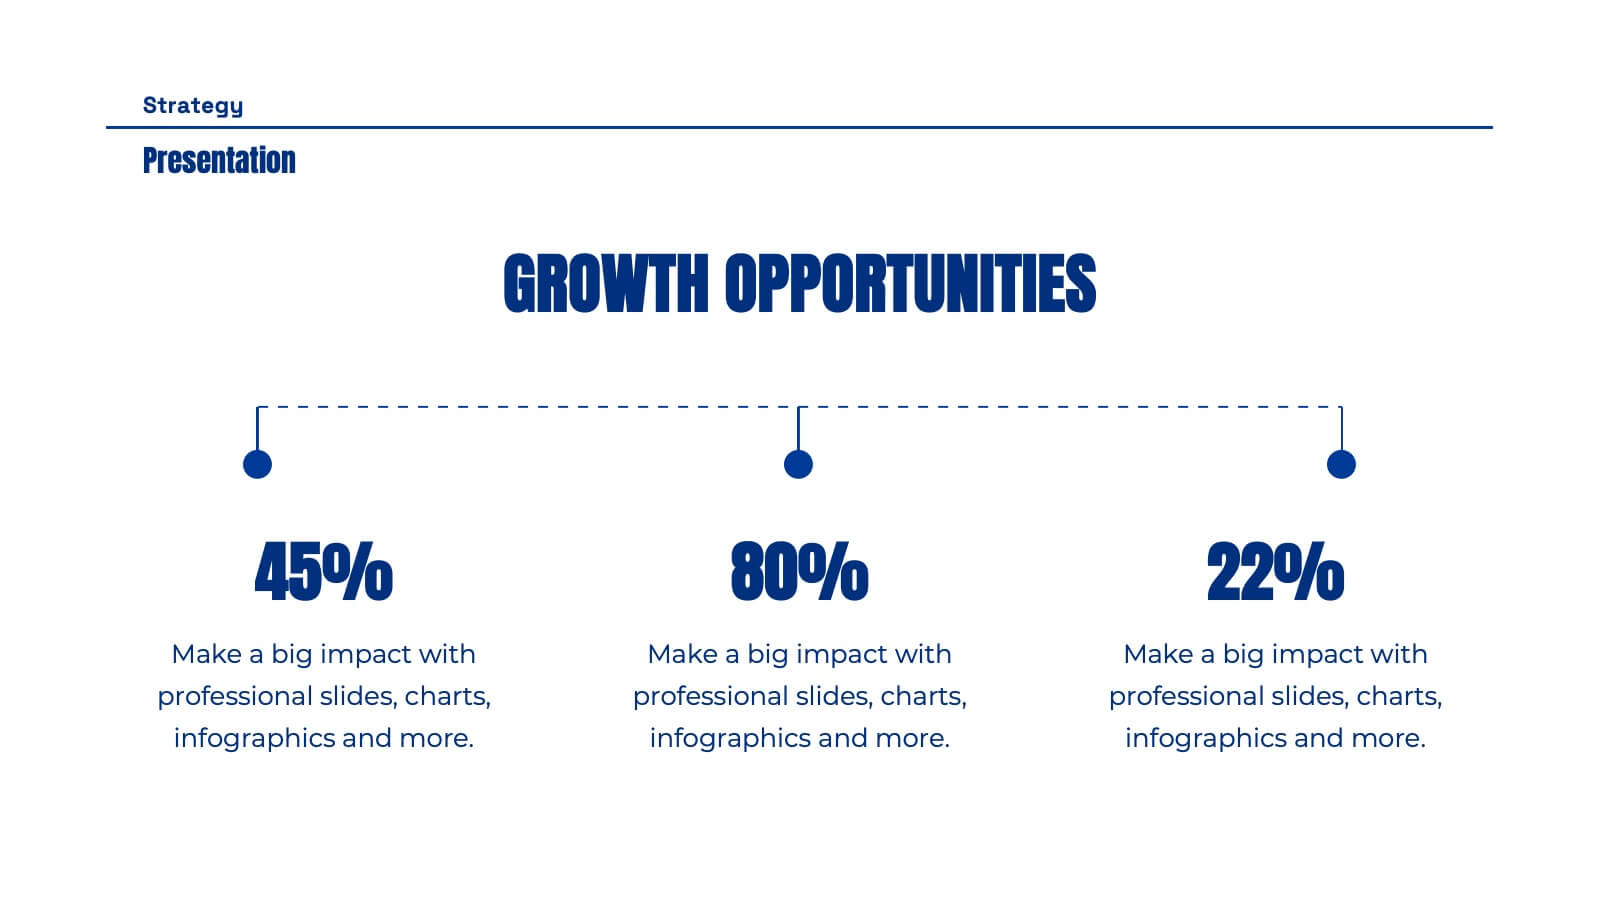
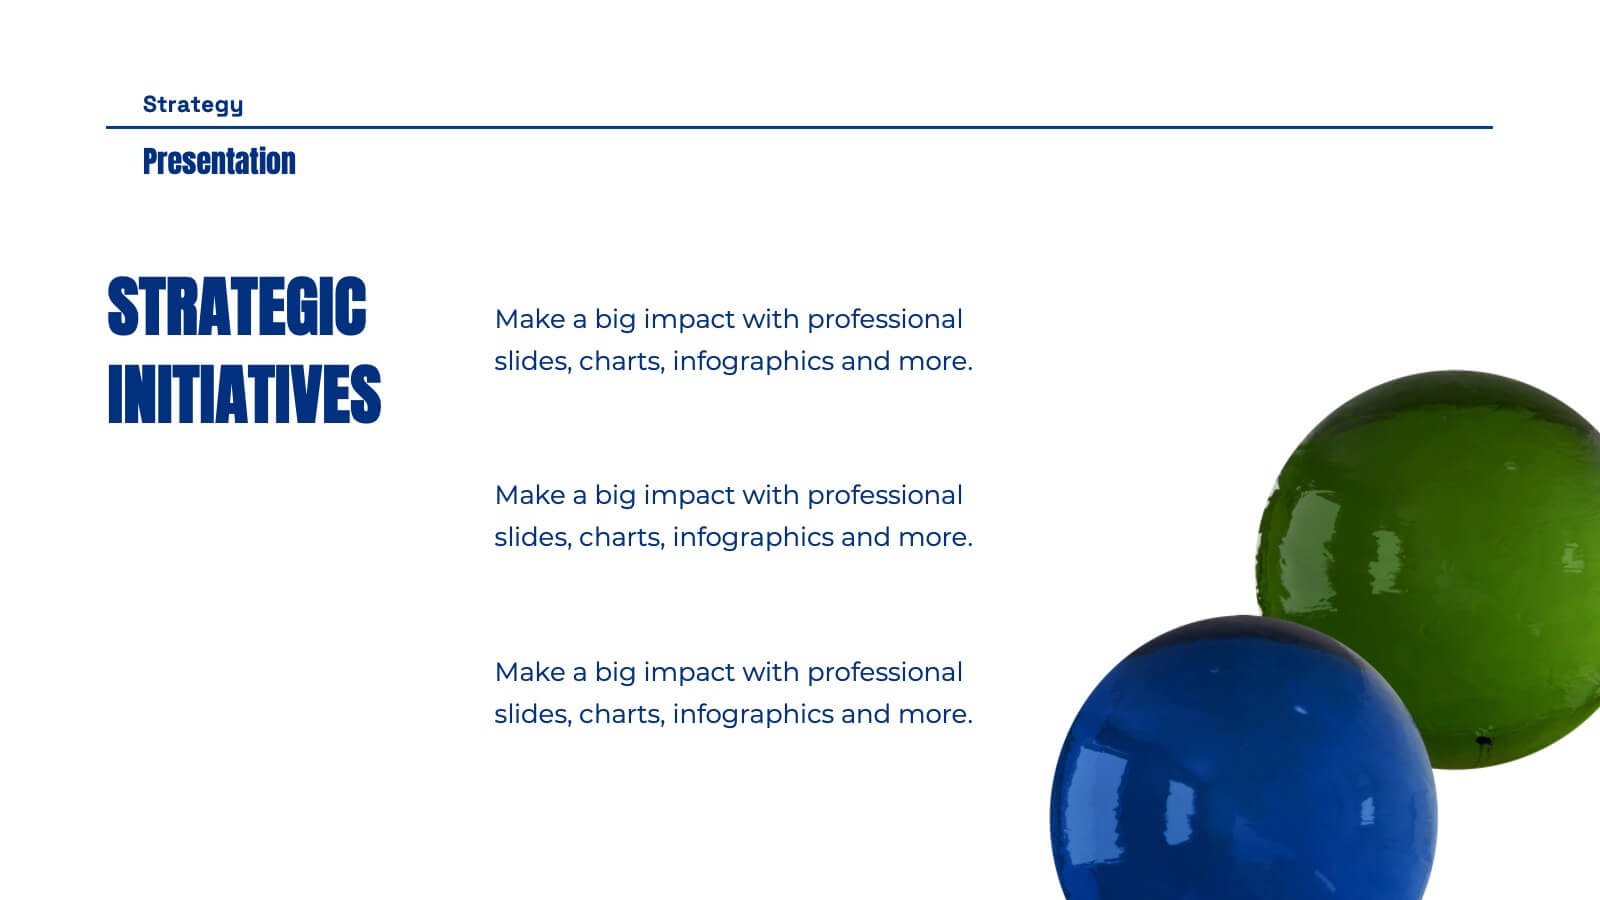
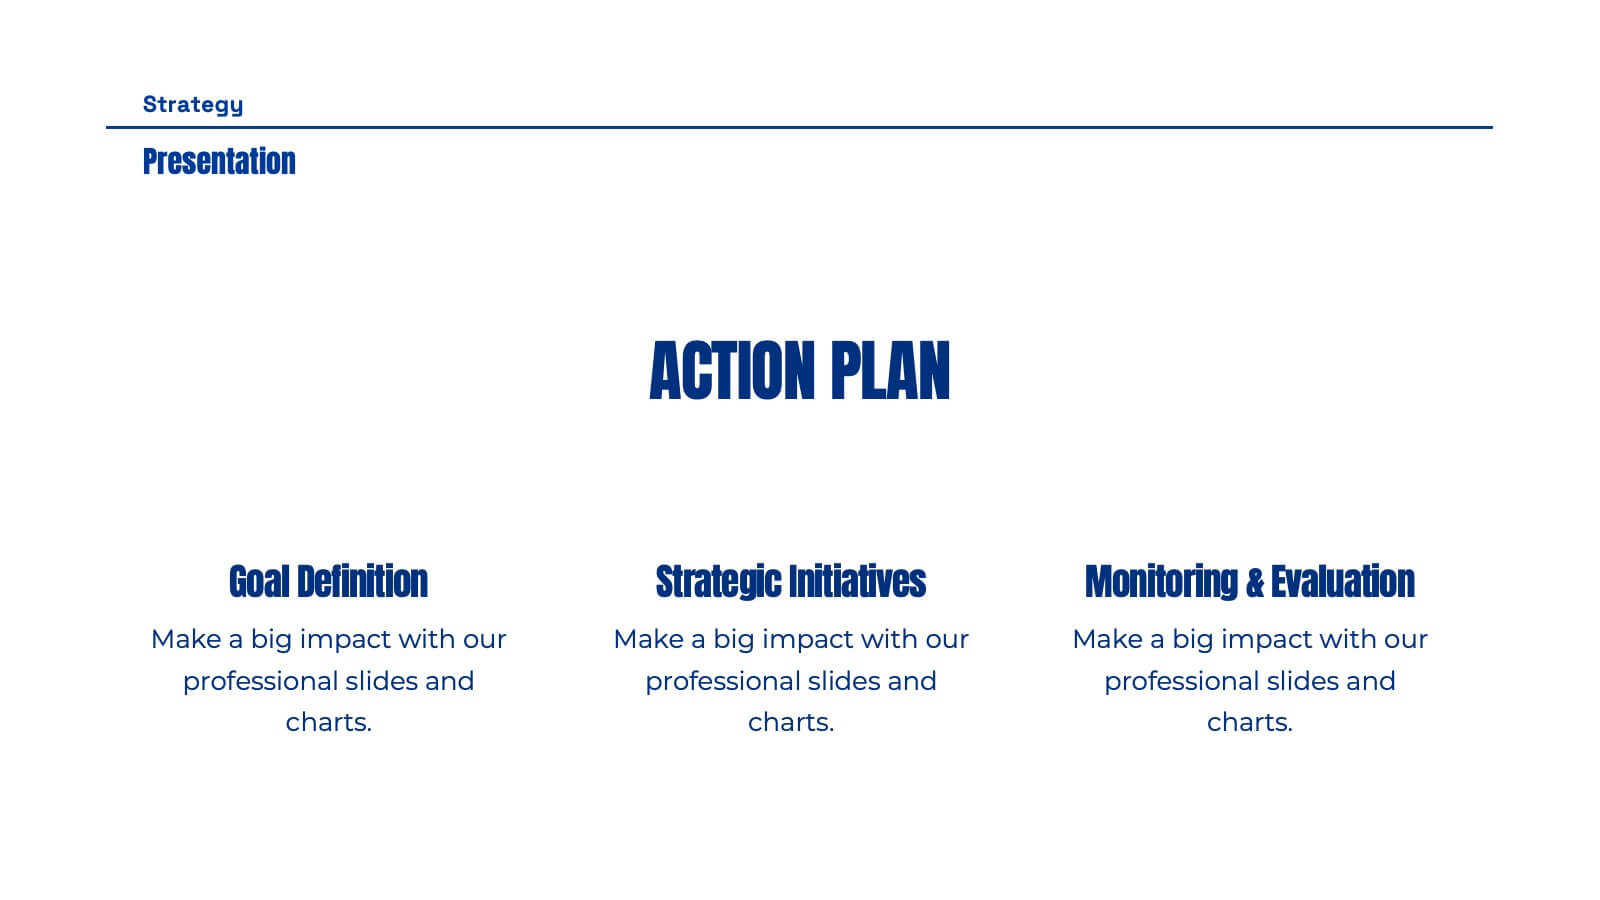
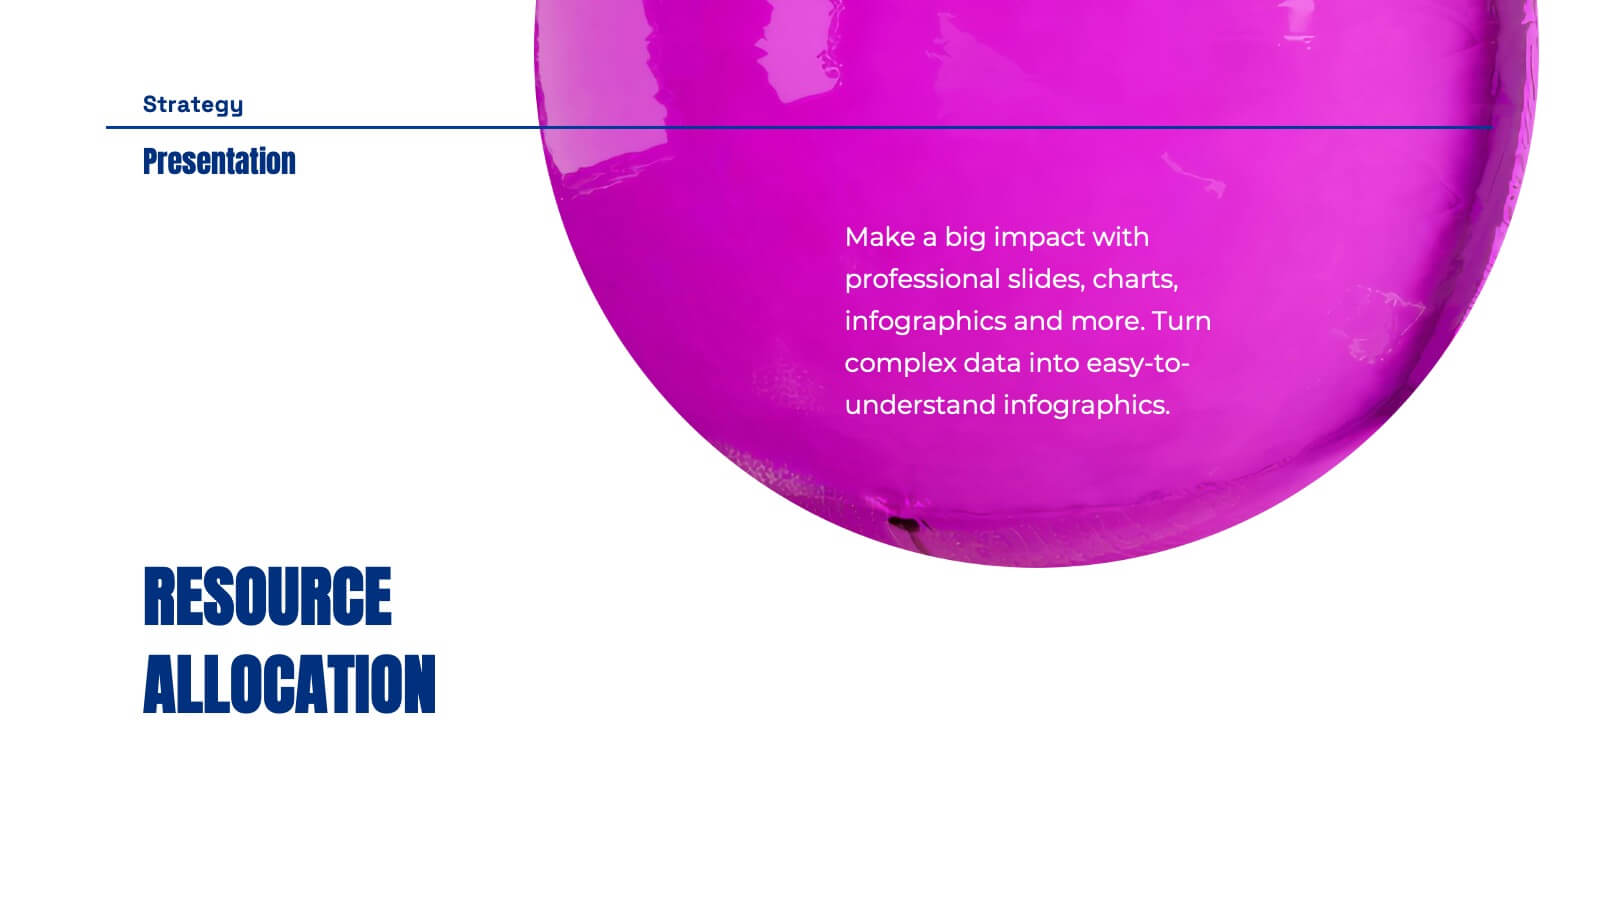
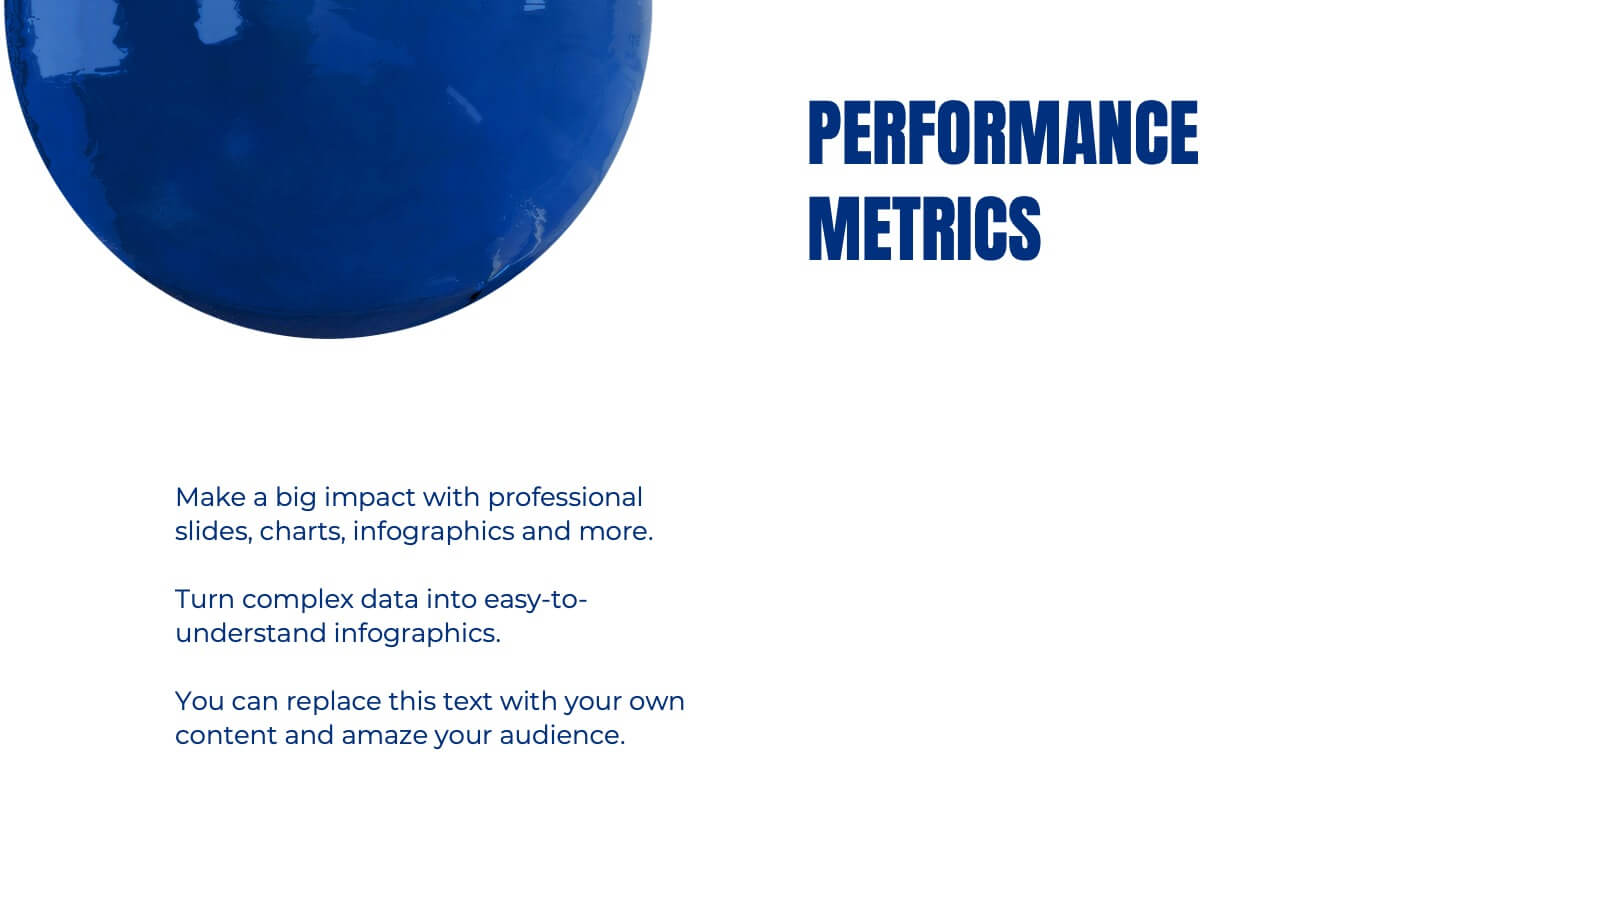
Workforce Alignment Strategy Presentation
Energize your strategy conversations with a clean, modern layout that makes team alignment feel clear, structured, and actionable. This presentation helps you break down goals, track priorities, and visualize key initiatives in a simple, intuitive flow. Ideal for planning sessions and leadership updates. Fully compatible with PowerPoint, Keynote, and Google Slides.


5 diapositivas
Puzzle-Based Team Alignment Strategy Presentation
Bring collaboration to the forefront with the Puzzle-Based Team Alignment Strategy Presentation. This creative layout uses interlocking puzzle pieces to represent interconnected team roles, milestones, or initiatives—perfect for showcasing synergy and strategic cohesion. Each section is color-coded and icon-enhanced for quick visual recognition, making it ideal for team briefings, onboarding, or workflow planning. Fully editable in PowerPoint, Keynote, and Google Slides.


5 diapositivas
Oil Industry Trends Infographics
The oil industry, also known as the petroleum industry, is a crucial sector of the global economy that involves exploration, production, refining, and distribution of petroleum products. These infographic templates are designed to showcase key trends and insights in the oil industry. They aims to present complex information in a clear and visually appealing manner, making it easy for your viewers to grasp important concepts and trends in the industry. This is perfect for anyone interested in understanding the trends and dynamics shaping the oil industry. Compatible with Powerpoint, Keynote, and Google Slides.


7 diapositivas
Healthcare Strategy Plan Presentation
Bring your strategy to life with a clean, modern slide that turns complex healthcare planning into a clear, visual roadmap. This presentation outlines key initiatives, supports data-driven decision-making, and keeps stakeholders aligned with an easy-to-follow layout. Fully compatible with PowerPoint, Keynote, and Google Slides for seamless professional use across any workflow.


5 diapositivas
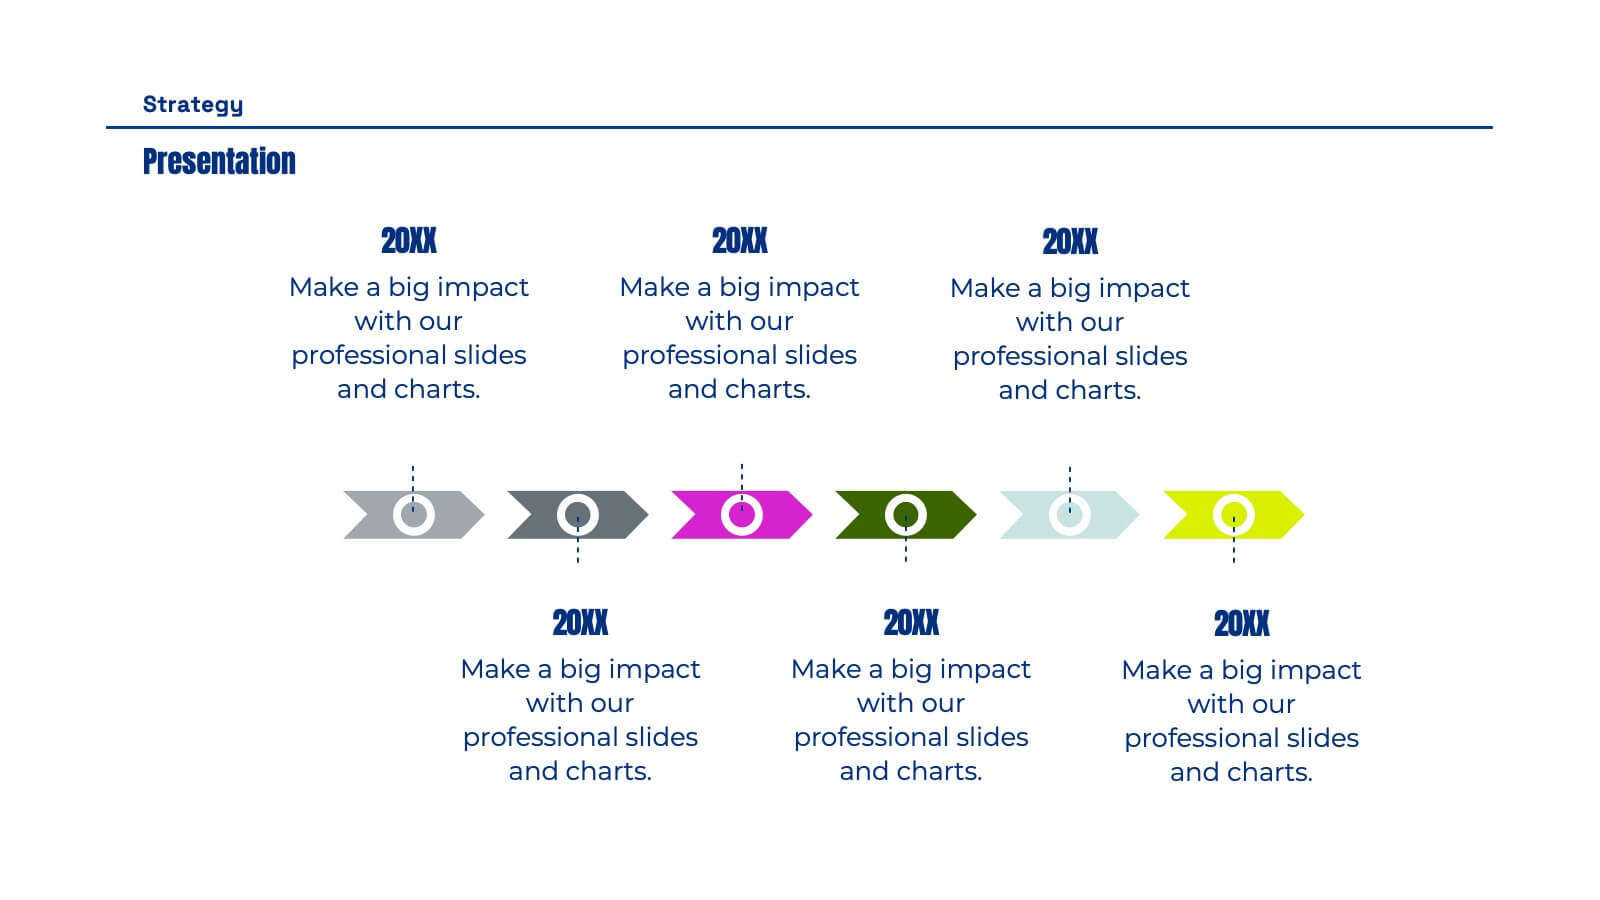
Process Flow Infographics
Streamline your pathway to success with our process flow infographics template. Utilizing a professional gray palette accented with colorful highlights, this creative vertical design is tailored for clarity and impact. Ideal for business strategists and process engineers, this template assists in illustrating step-by-step progressions or workflows in an engaging manner. It's perfect for those who need to communicate processes effectively, ensuring every phase is visually represented and easy to understand. This template comes equipped with innovative graphics, diverse icons, and dedicated spaces for images, making your data presentation a smooth, navigable experience.


5 diapositivas
Artificial Intelligence Insights Infographics
Embark on an explorative journey into the future with artificial intelligence insights infographics. Set against a visually stimulating backdrop of purple, blue, and white. It's designed for innovators, educators, and students who strive to understand and communicate the multifaceted impacts of AI in various sectors. By encapsulating trends, innovations, and challenges, these infographics are perfect for presentations, educational materials, or online content. The creative use of graphics and icons, ensures each segment of information is not only informative but also engaging, bringing clarity to the future shaped by artificial intelligence.


6 diapositivas
Office Scenes Season Infographic
"Office Scenes" typically refer to the environments and activities that take place within an office setting. This Infographic template is a visual representation that showcases different scenarios and activities that commonly take place in an office environment. This type of infographic can be used to illustrate various aspects of office life, work culture, and interactions. This template provide insights into the day-to-day activities and culture of your workplace. Fully customizable and compatible with Powerpoint, Keynote, and Google Slides. Include your company logo or branding elements in the infographic.


6 diapositivas
Real-Life Business Case Study Review Presentation
Break down complex scenarios into clear, visual insights with the Real-Life Business Case Study Review Presentation. This template uses a 5-step horizontal hexagon layout to guide your audience through each stage of a business case—ideal for timelines, project phases, or outcome reviews. Fully editable in PowerPoint, Keynote, and Google Slides.


6 diapositivas
Credit Card Comparison and Benefits Presentation
Clearly compare features, perks, and advantages of different credit card options using this visually dynamic infographic slide. With side-by-side sections, icons, and clean labeling, this layout makes it easy to present pros and cons, reward tiers, or service details. Ideal for financial services, banking presentations, or consumer education. Compatible with PowerPoint, Keynote, and Google Slides for seamless customization.


4 diapositivas
Market Expansion Planning with Blue Ocean Presentation
Visualize your growth journey with this two-step strategic layout. Ideal for presenting current positioning and future market opportunities using Blue Ocean thinking. Each step is illustrated with bold icons and color-coded nodes. Fully editable in PowerPoint, Keynote, and Google Slides—perfect for business development, strategy sessions, and executive presentations.
21 diapositivas
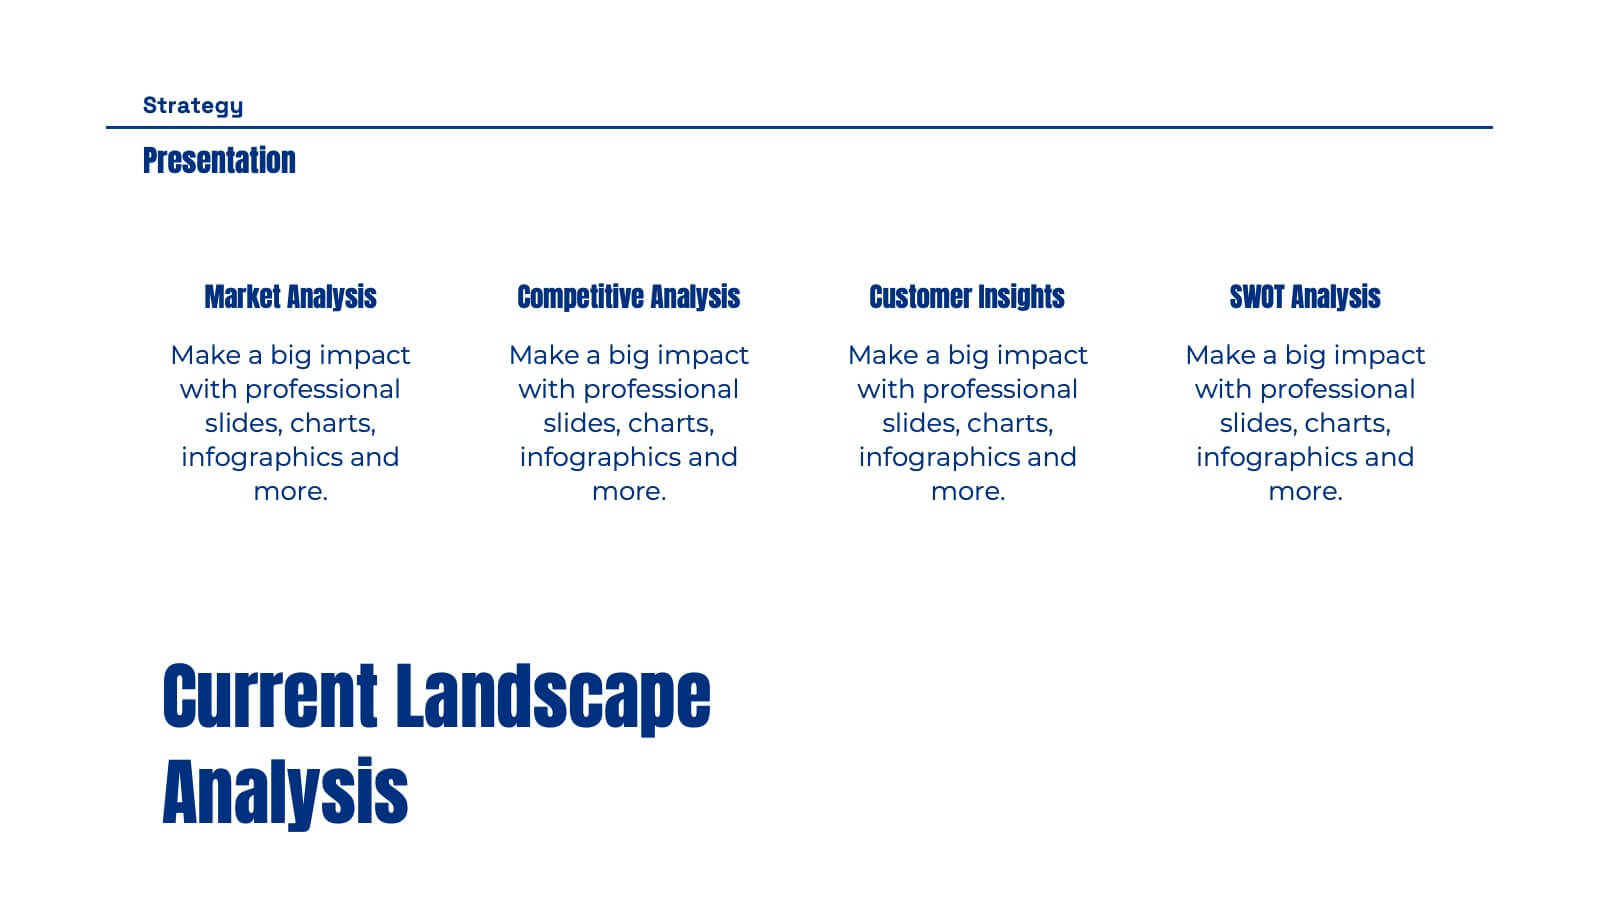
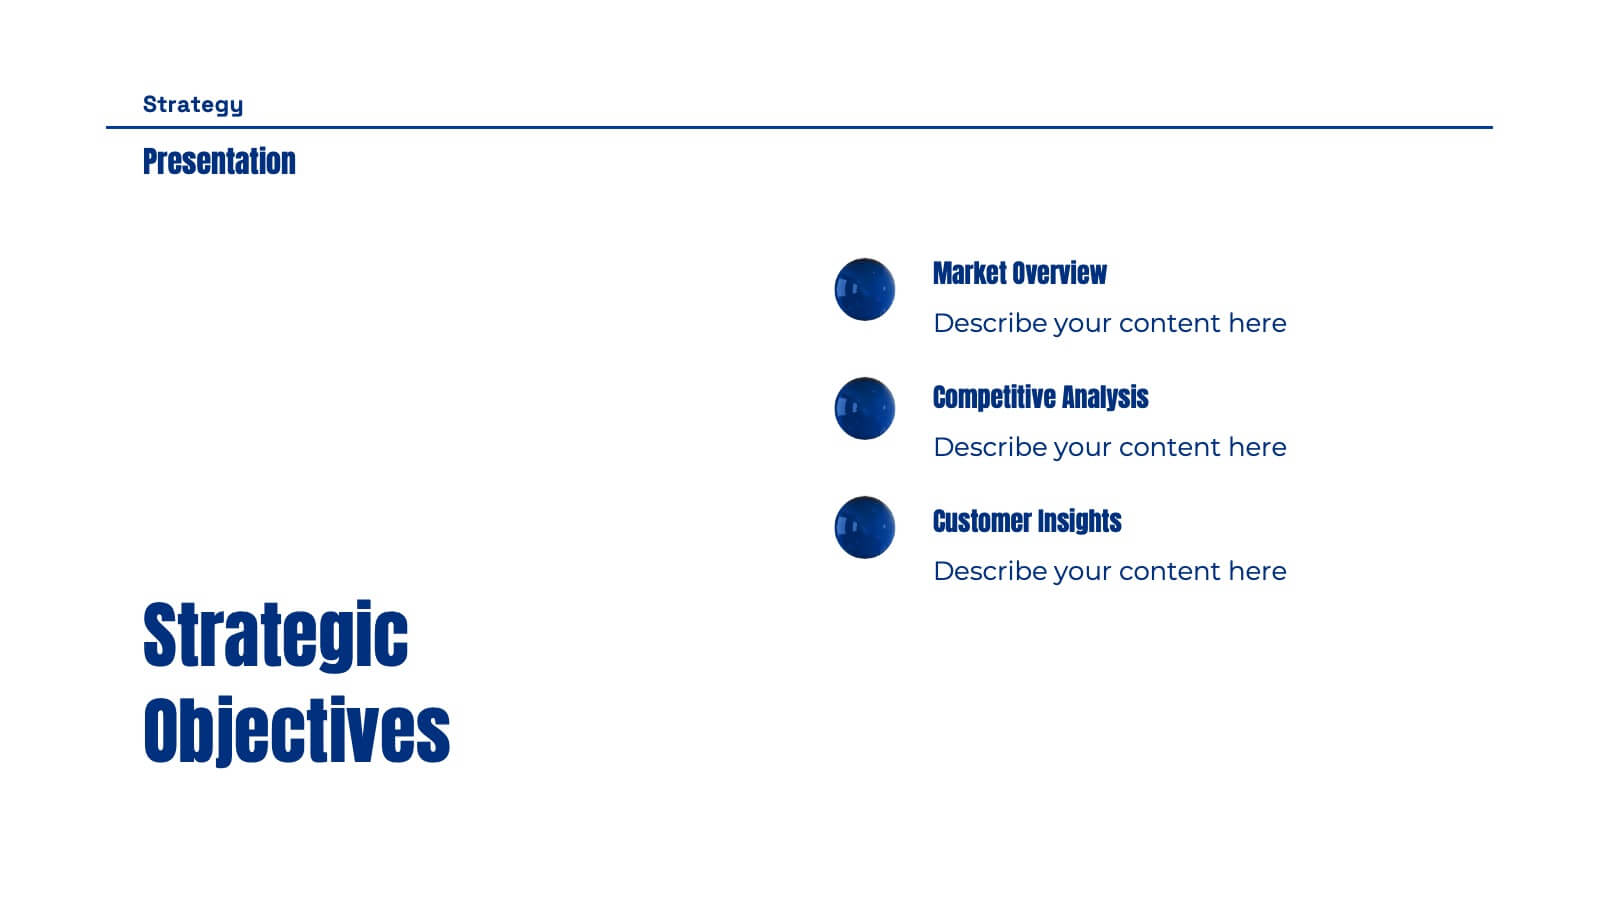
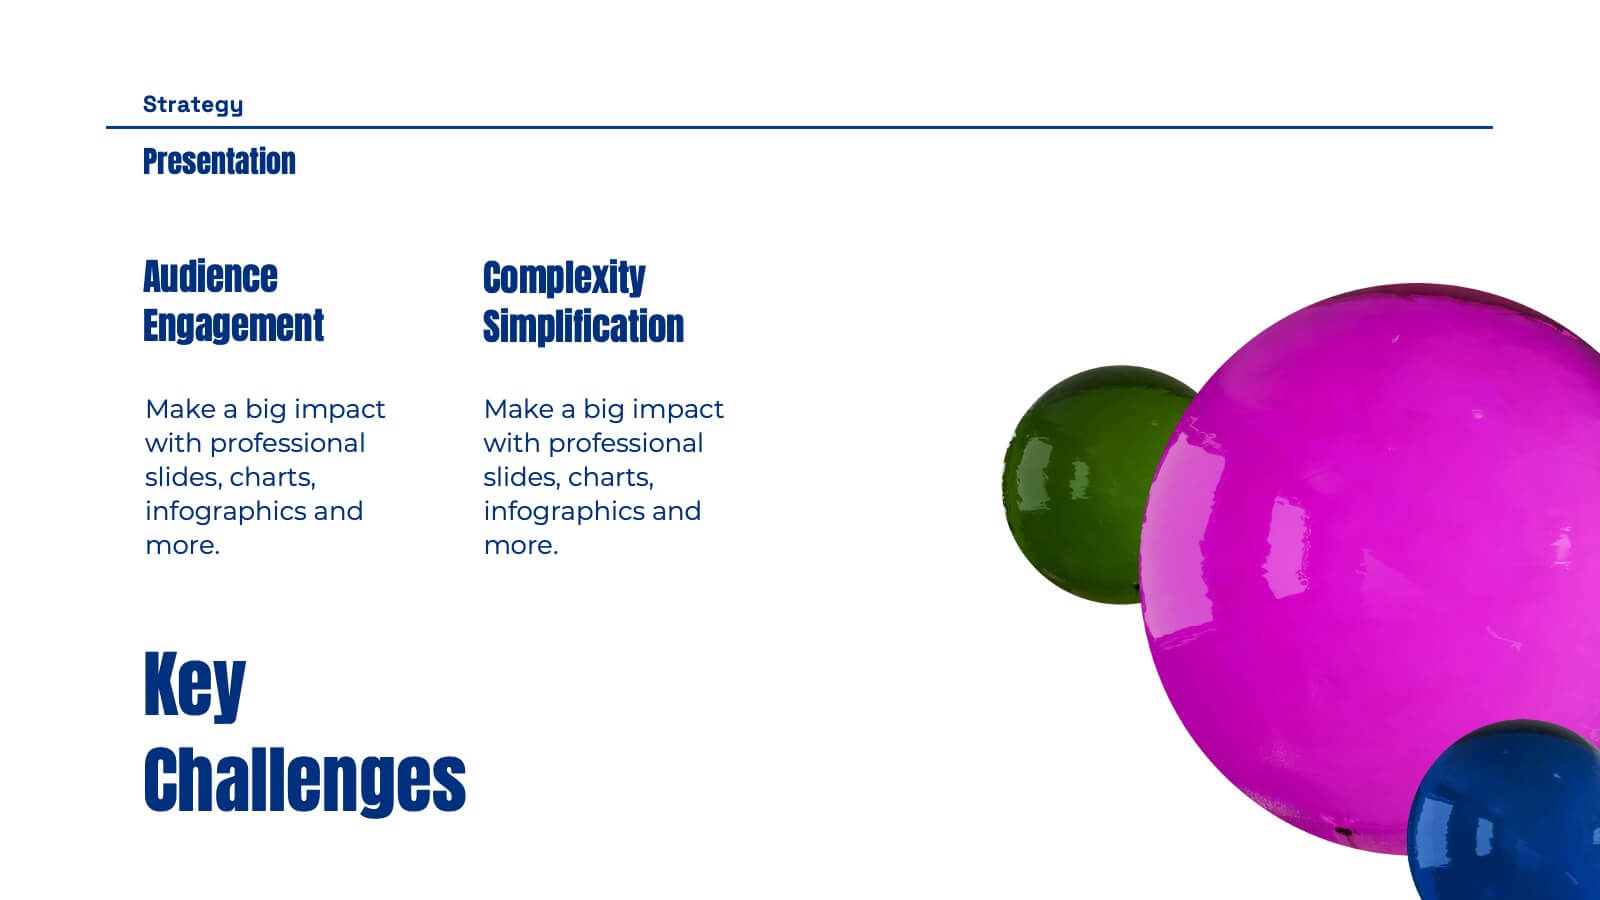
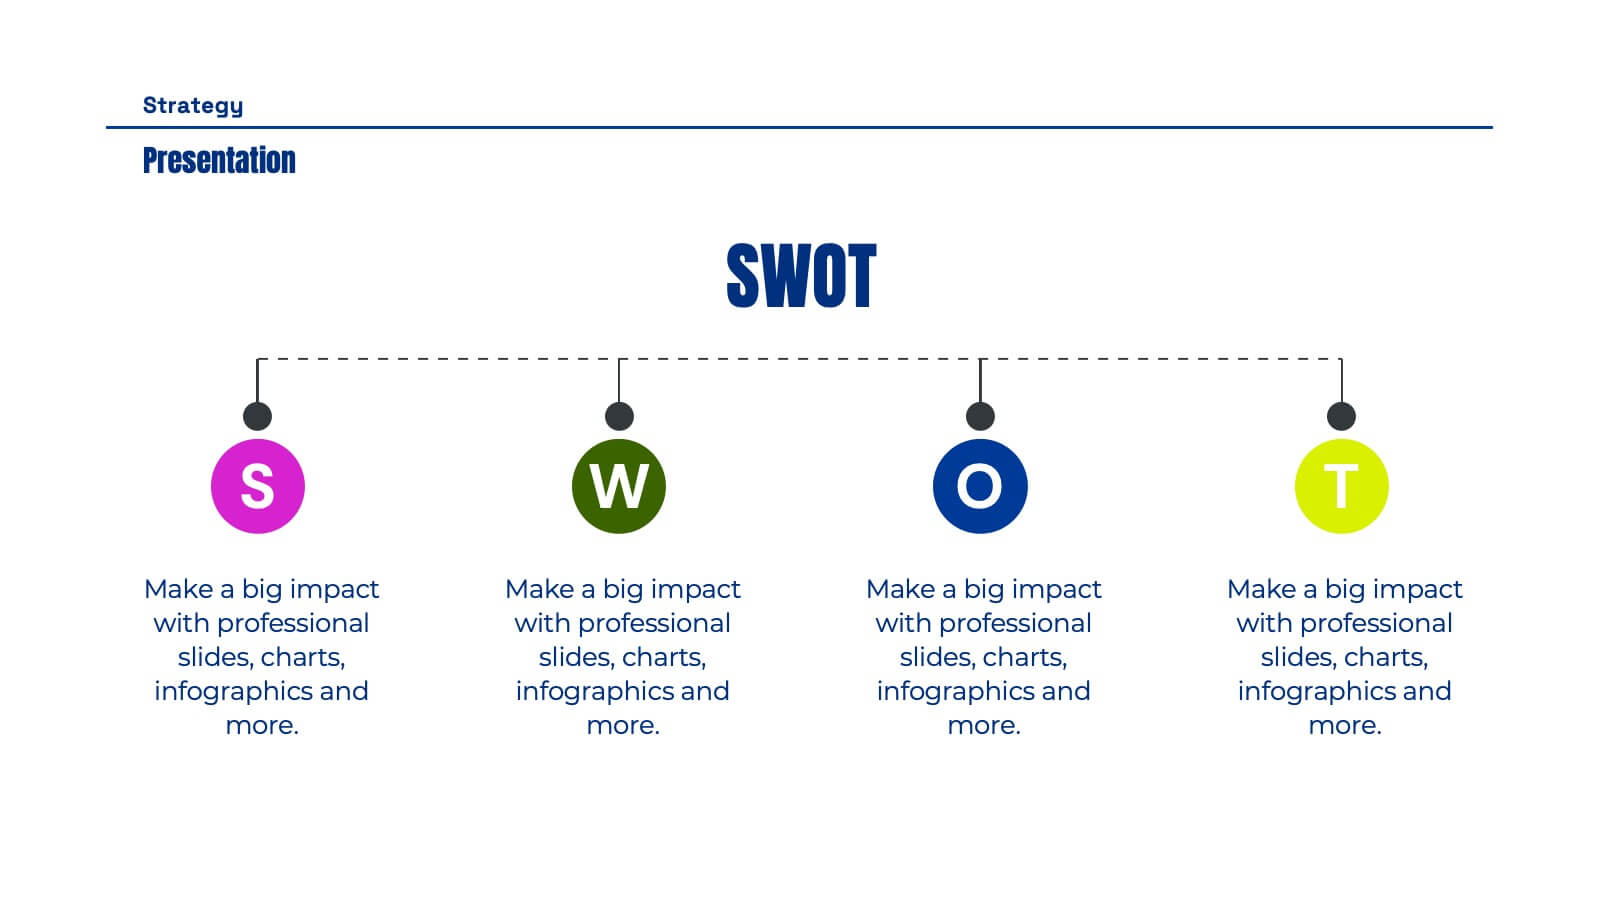
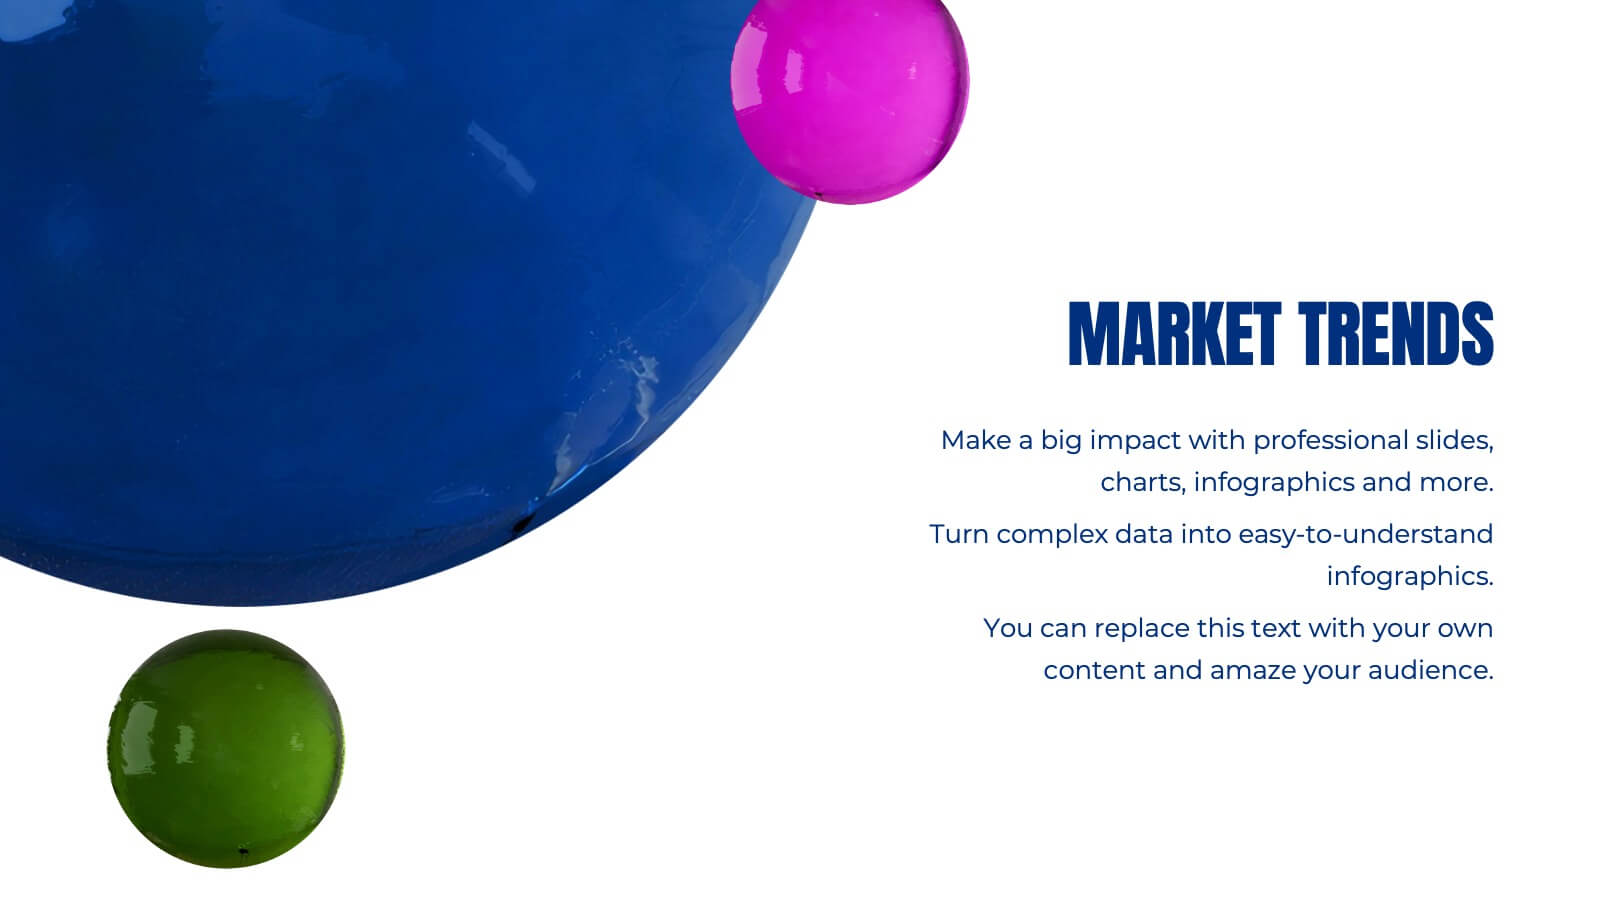
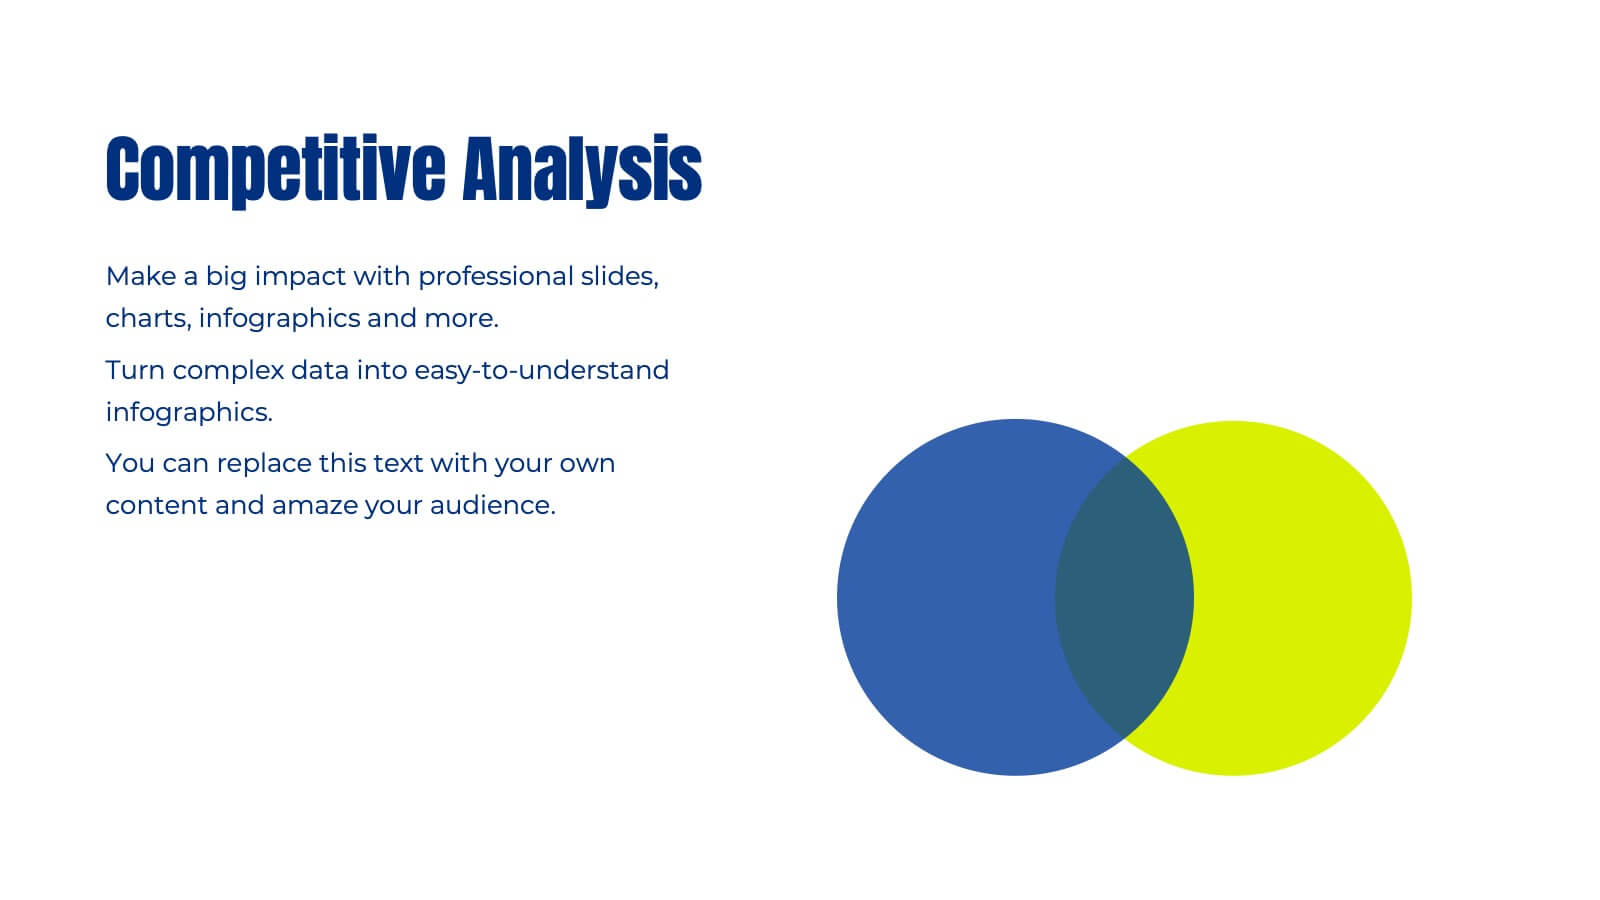
Ops Business Strategy Presentation
Set your strategy in motion with this dynamic, visually striking presentation template! Perfect for conveying key business insights like competitive analysis, market trends, and strategic objectives, it helps organize your plan for success. Each slide focuses on clarity and effectiveness, making it ideal for impactful presentations. Compatible with PowerPoint, Keynote, and Google Slides for effortless use across platforms.


7 diapositivas
Problem Infographic
These slides focus on presenting problem statements and their contexts in a professional and accessible format. The use of a soft, consistent color palette helps to keep the presentation visually appealing while ensuring that the content remains the focal point. Each slide is designed with ample space for text and icons, which aids in breaking down complex issues into understandable segments. The variety of layouts ensures that you can tailor the presentation to the nature of the problem being addressed, whether it requires more textual explanations or benefits from the use of infographics and icons. These templates are well-suited for business meetings, academic presentations, or any scenario where clear communication of challenges is necessary. They can be effectively used to initiate discussions, brainstorm solutions, or simply to highlight issues that need attention in a structured and organized manner.


4 diapositivas
Simple RACI Matrix Overview Presentation
Bring instant clarity to every role with a clean, puzzle-style layout designed to map responsibilities without confusion. This presentation helps teams outline who leads, supports, approves, and stays informed in any project, turning tasks into a simple visual grid. Fully editable and compatible with PowerPoint, Keynote, and Google Slides.


5 diapositivas
Workforce Performance Evaluation Slide Presentation
Evaluate performance with clarity using the Workforce Performance Evaluation Slide presentation. This star-rating format helps you visually assess employee contributions, competencies, and overall effectiveness. Ideal for HR reviews, team feedback sessions, and progress tracking. Easily editable in PowerPoint, Keynote, or Google Slides.


8 diapositivas
Value Chain Optimization and Analysis Presentation
Streamline Your Business for Maximum Efficiency with this Value Chain Optimization and Analysis presentation template. This visually engaging template is designed to map, analyze, and enhance the key activities in your value chain, helping businesses identify opportunities for cost reduction, performance improvements, and strategic advantages. Featuring a clean flowchart layout, intuitive color-coded sections, and editable placeholders, this template is ideal for business analysts, consultants, and executives. Fully compatible with PowerPoint, Keynote, and Google Slides, ensuring seamless customization and professional delivery.


5 diapositivas
3-Level Concentric Diagram Presentation
Bring clarity and structure to your ideas with a clean, layered diagram design that simplifies complex concepts. Perfect for showcasing stages, hierarchies, or interconnected systems, it keeps your audience engaged with visual balance and flow. Fully compatible with PowerPoint, Keynote, and Google Slides for effortless customization and presentation flexibility.


4 diapositivas
Freelancer Portfolio Showcase Presentation
Showcase your talents with this clean and modern portfolio slide. Featuring a photo placeholder, bold typography, and a vertical skill layout, it's perfect for freelancers and creatives. Easily customizable in PowerPoint, Keynote, or Google Slides—ideal for highlighting services, experience, and personal branding with a sleek, professional flair.