


Características


¿Tienes alguna pregunta?
Recomendar


21 diapositivas
Phantomwood Product Roadmap Presentation
A comprehensive presentation template designed to outline product strategies and roadmaps. Covers key aspects like target market, competitive analysis, pricing, and technical specifications. Highlight marketing approaches, production processes, and support information effectively. Fully editable, this template is compatible with PowerPoint, Keynote, and Google Slides for seamless collaboration and professional delivery.


6 diapositivas
Historical Events Timeline Presentation
Chronicle significant moments with the Historical Events Timeline Diagram. This visually engaging template allows you to map key milestones, highlight crucial dates, and present historical progressions with clarity. Ideal for educators, researchers, and business professionals, this timeline ensures a structured and impactful storytelling experience. Fully customizable and compatible with PowerPoint, Keynote, and Google Slides.


4 diapositivas
Lab Research Data Analysis Layout Presentation
Present your scientific findings with clarity using this Lab Research Data Analysis Layout Template. Featuring molecular, lab flask, and data icons in a connected node design, it's ideal for researchers and analysts. Fully editable in PowerPoint, Keynote, and Google Slides, this clean layout ensures your data is both visual and professional.


6 diapositivas
Responsive Design Display with Devices Presentation
Highlight your multi-device experience with the Responsive Design Display with Devices Presentation. This clean and modern layout features a central monitor and mobile phone illustration, surrounded by five customizable text points—ideal for showing key features or compatibility. Fully editable in Canva, PowerPoint, Keynote, and Google Slides.

24 diapositivas
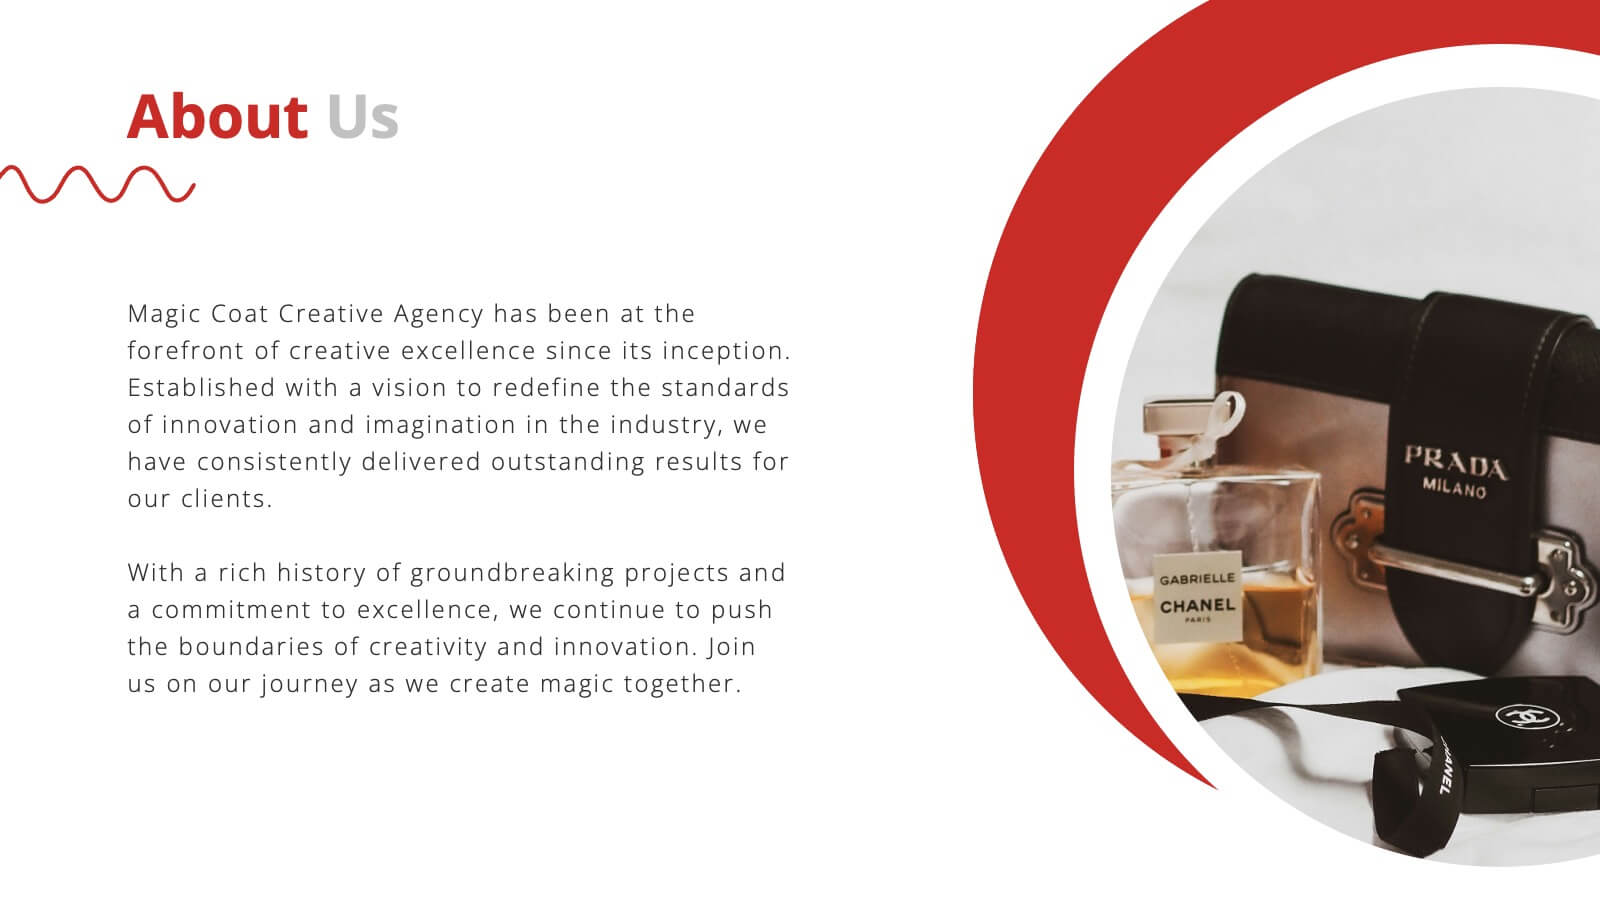
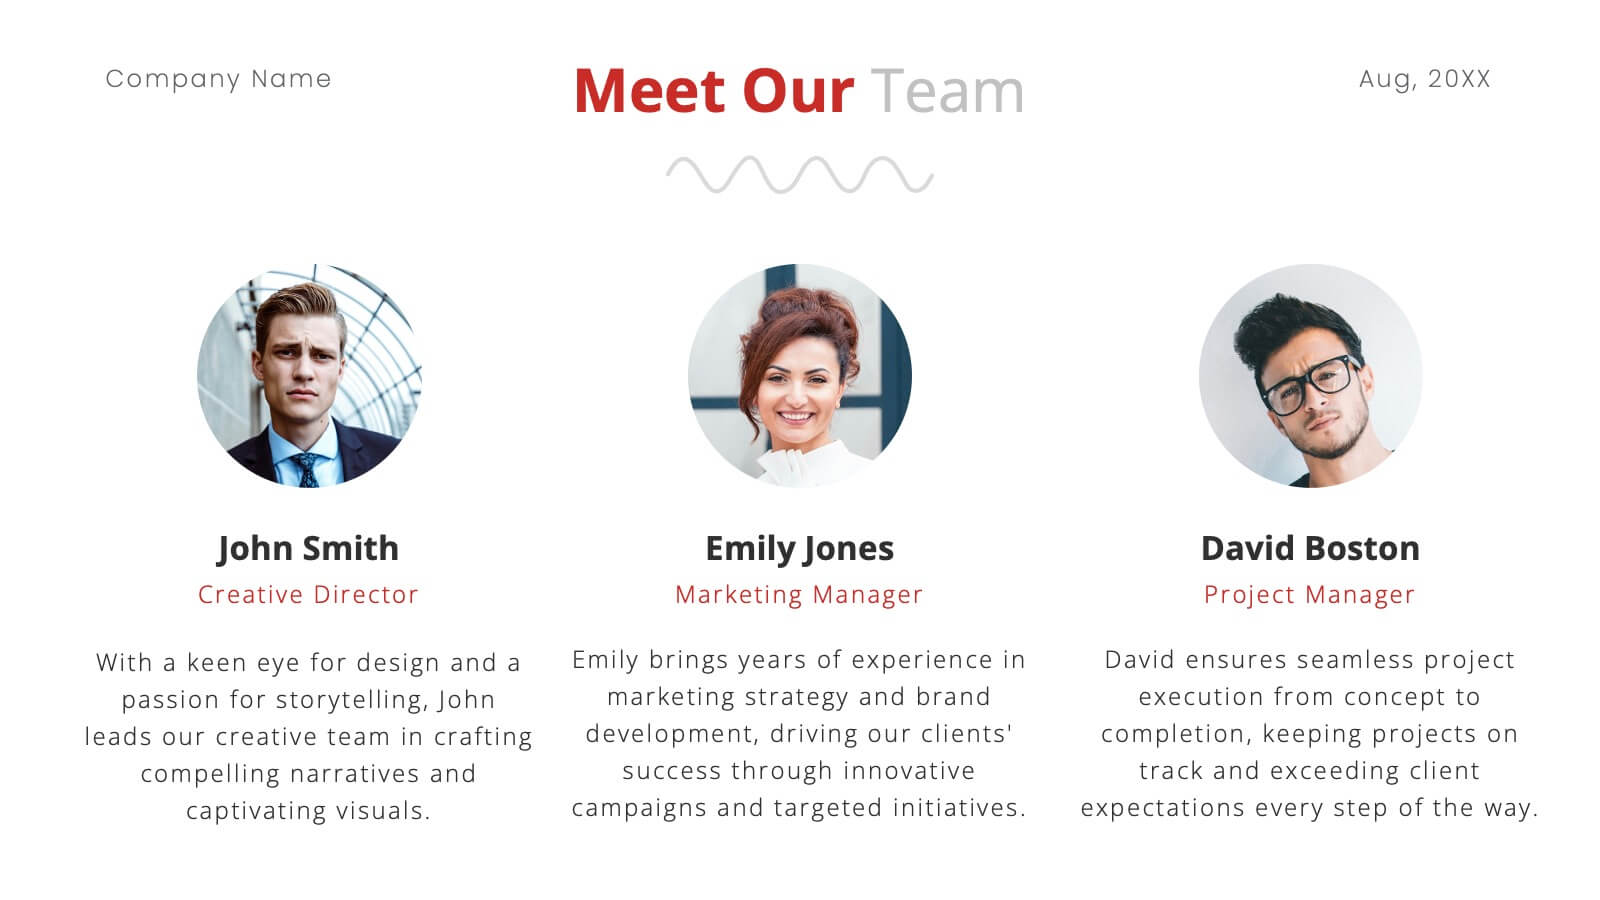
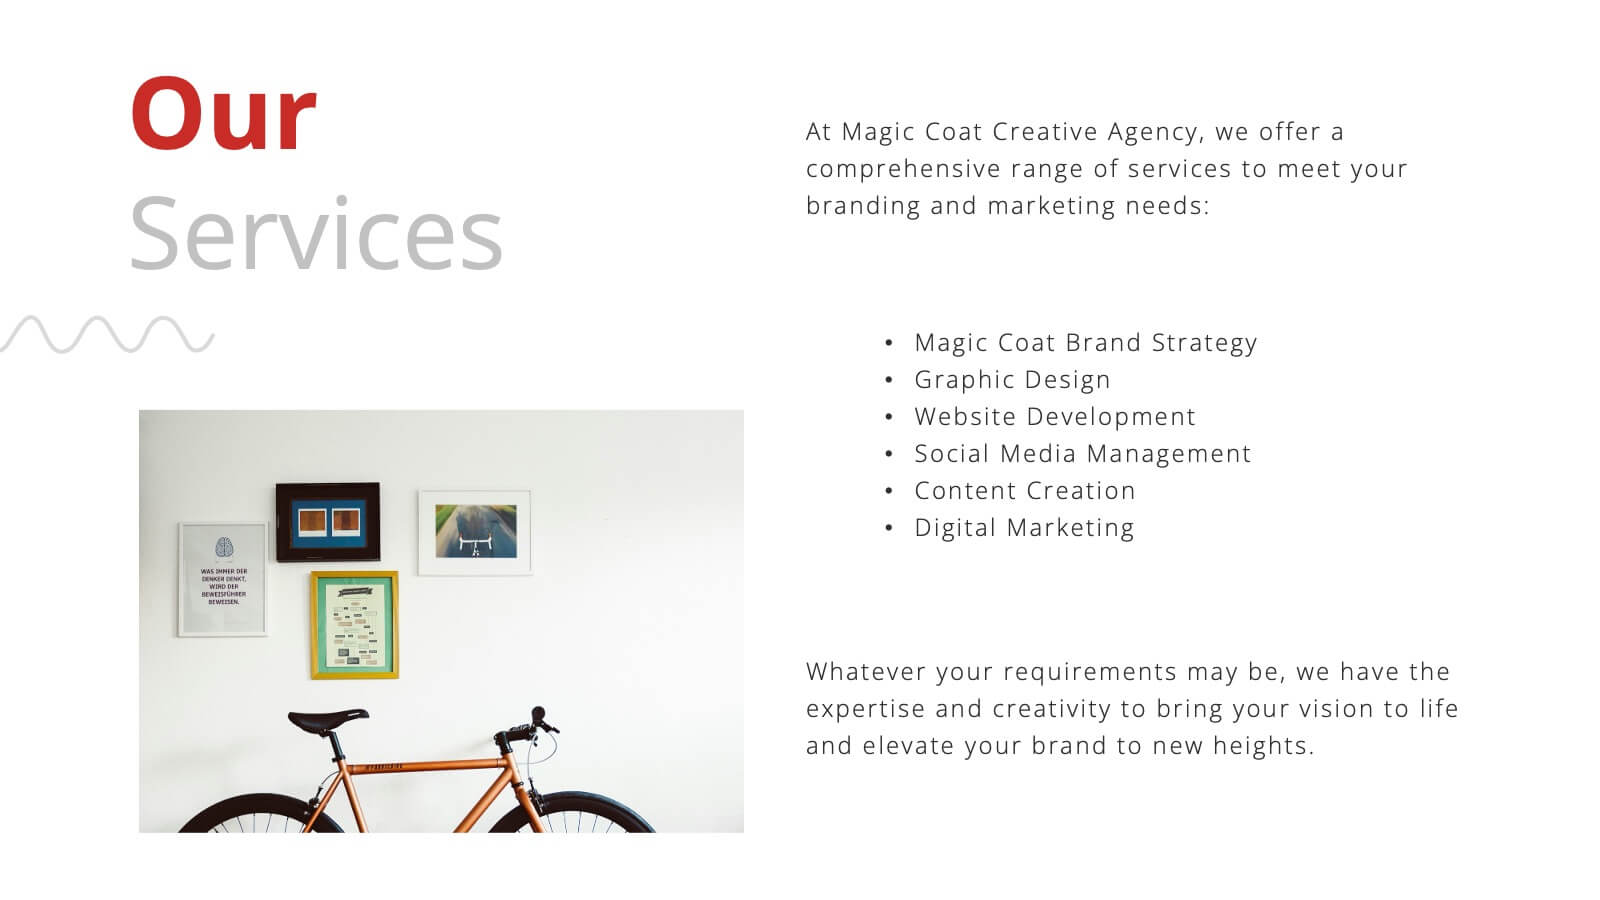
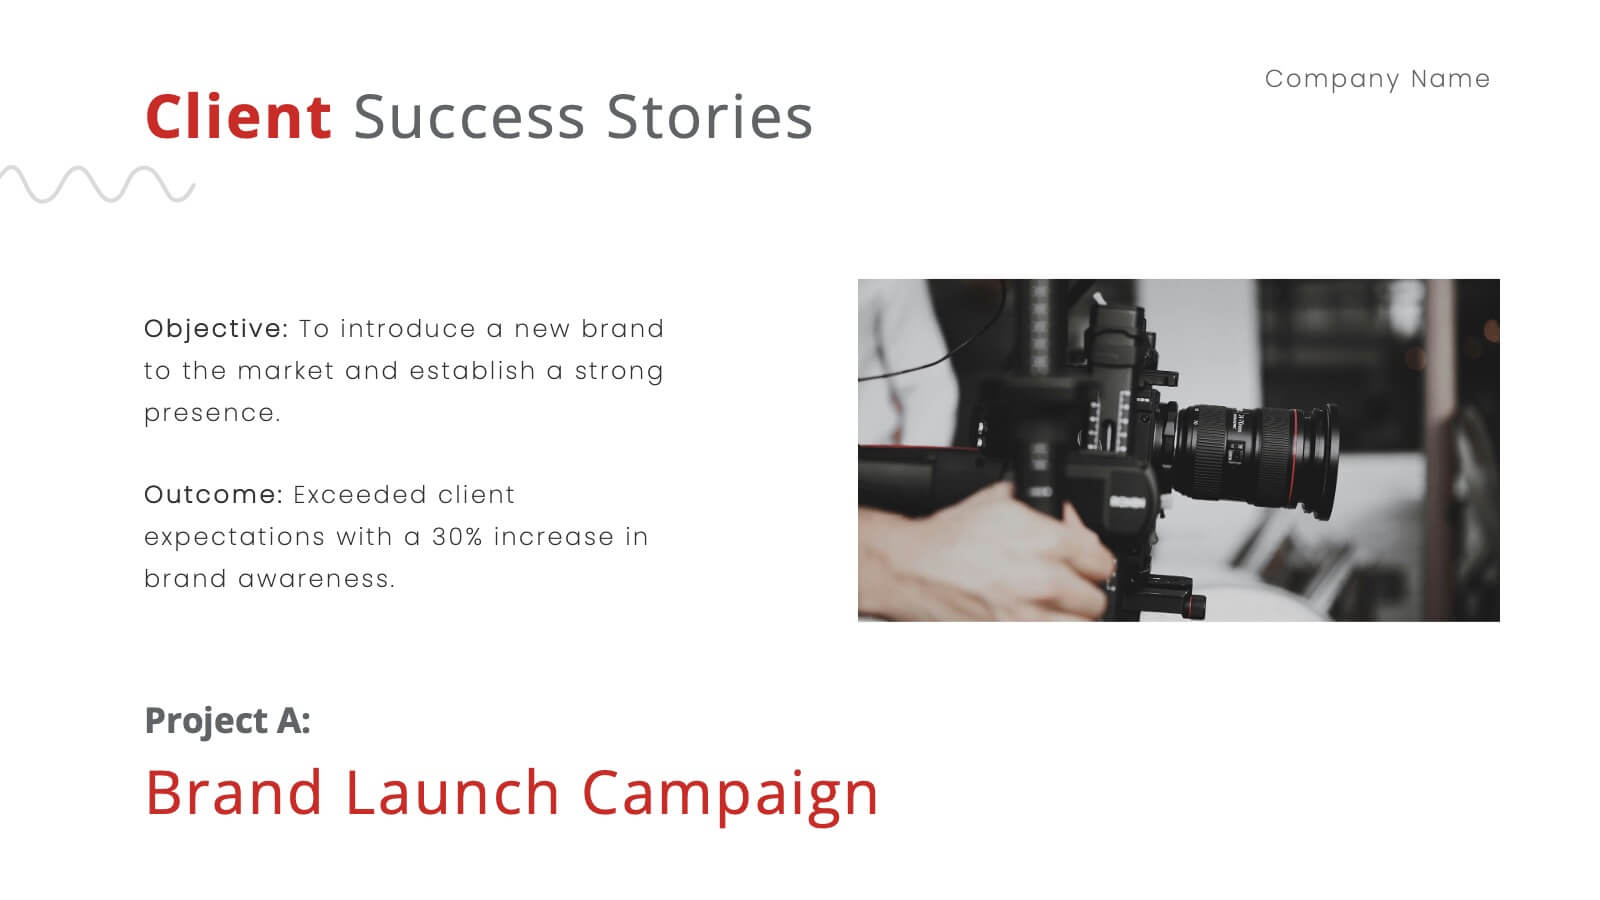
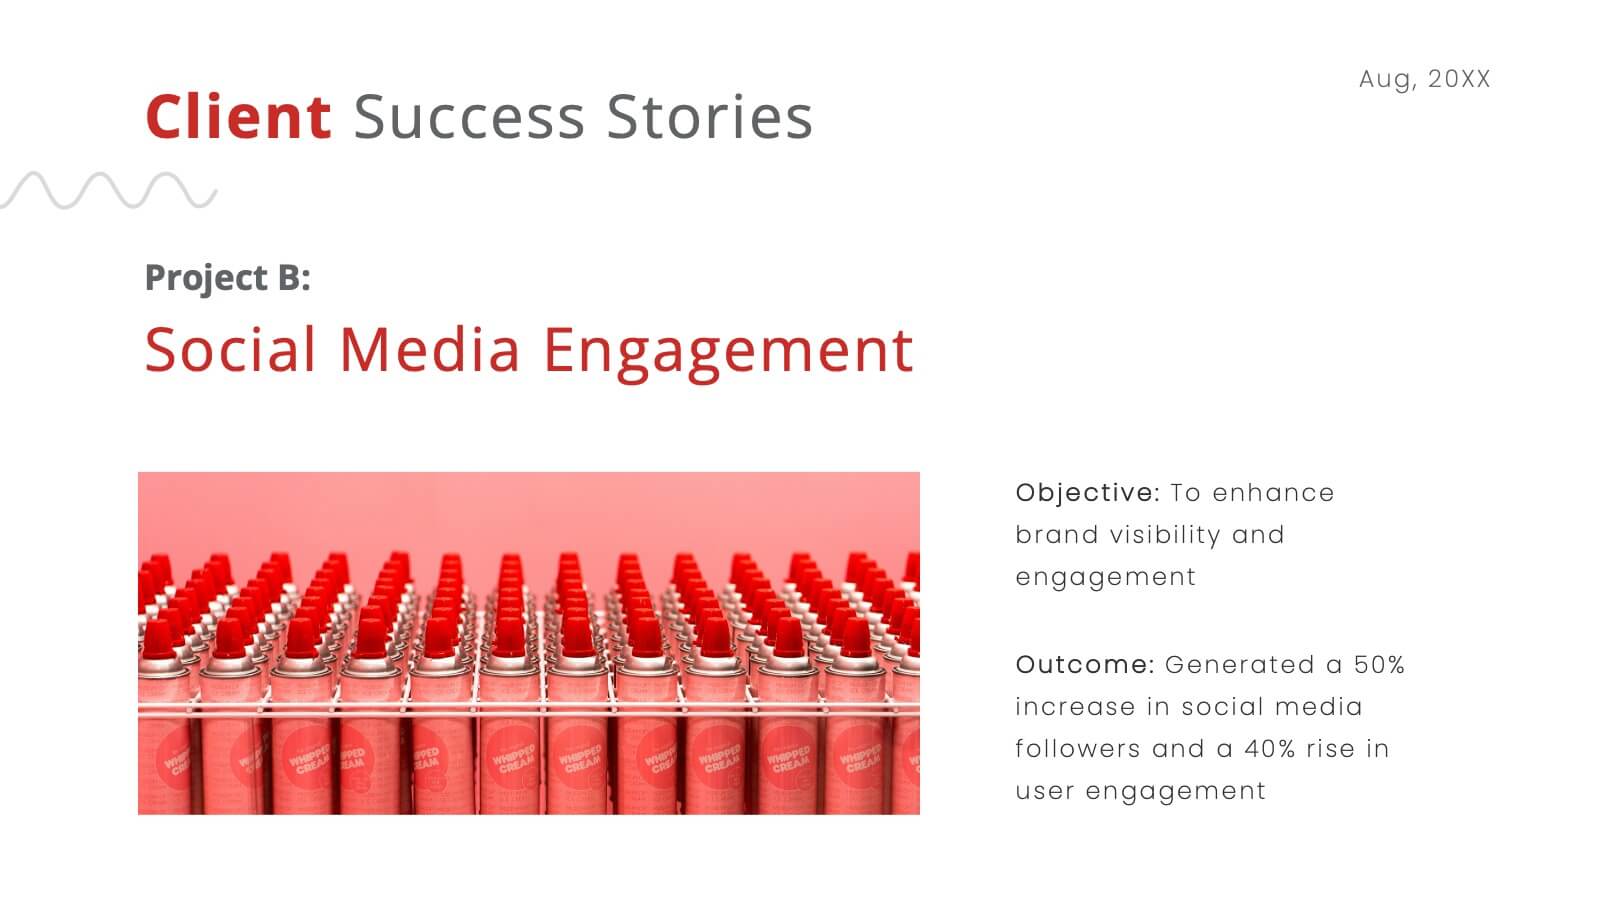
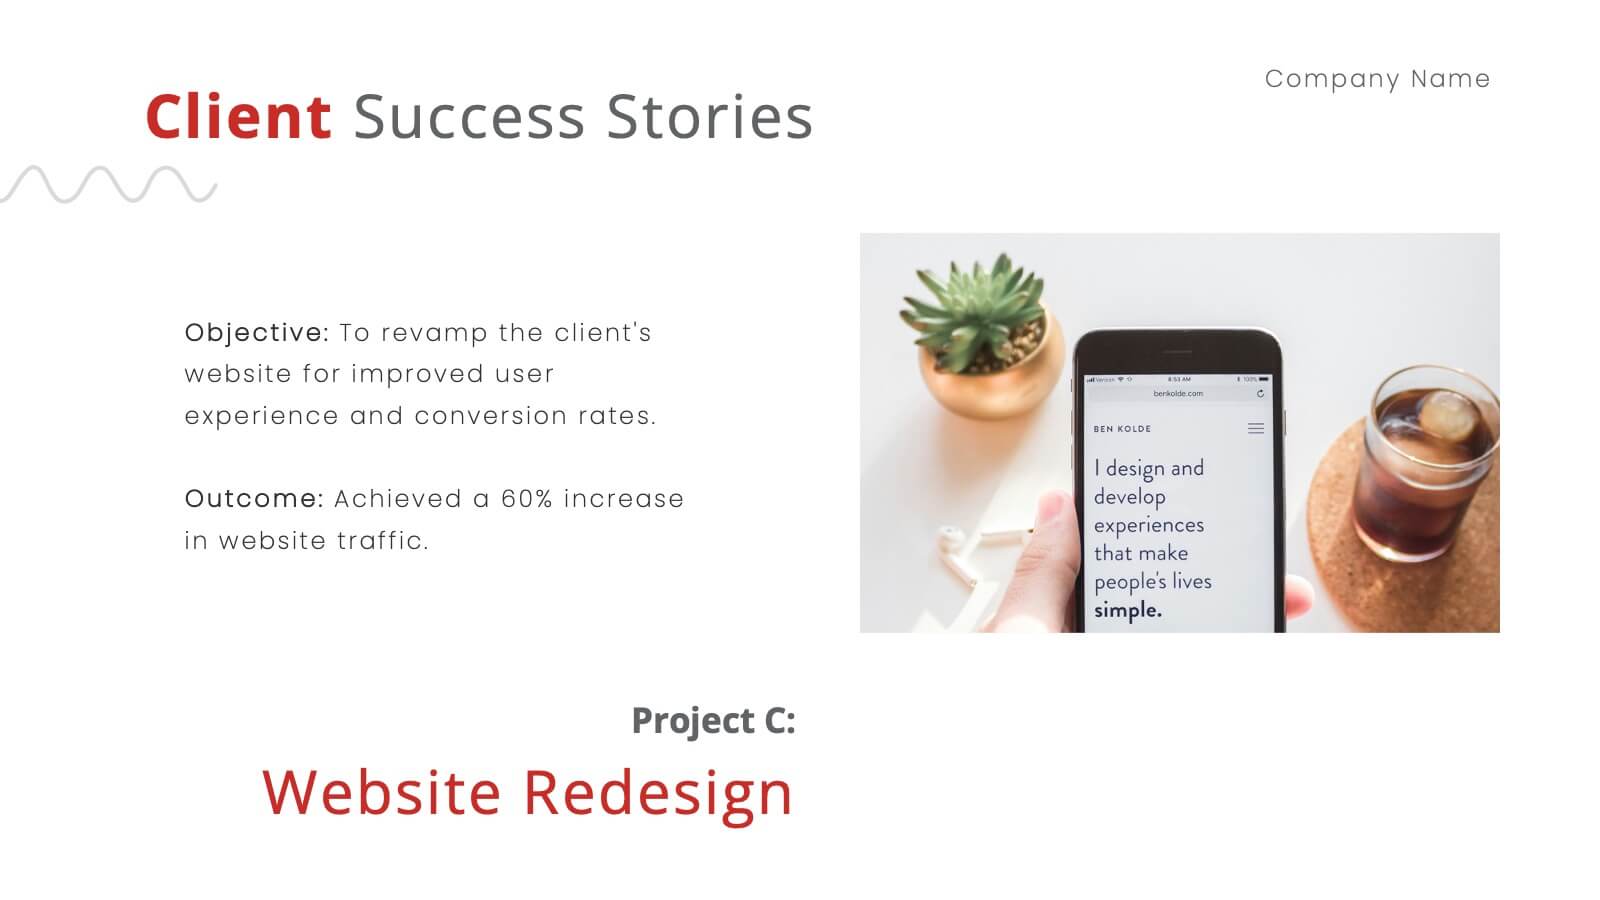
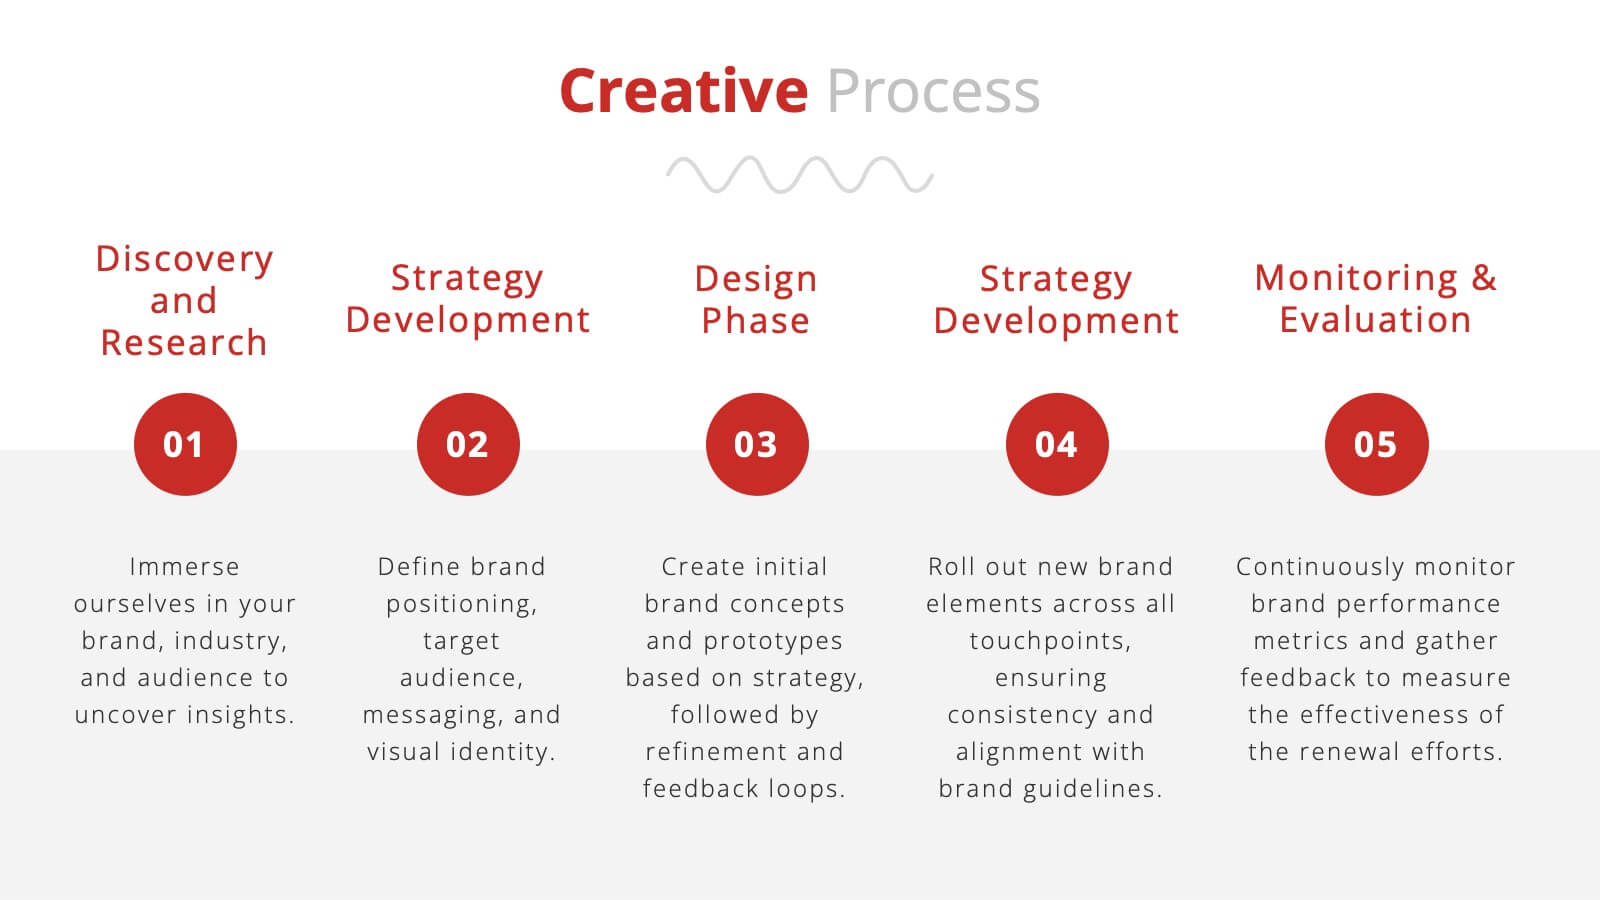
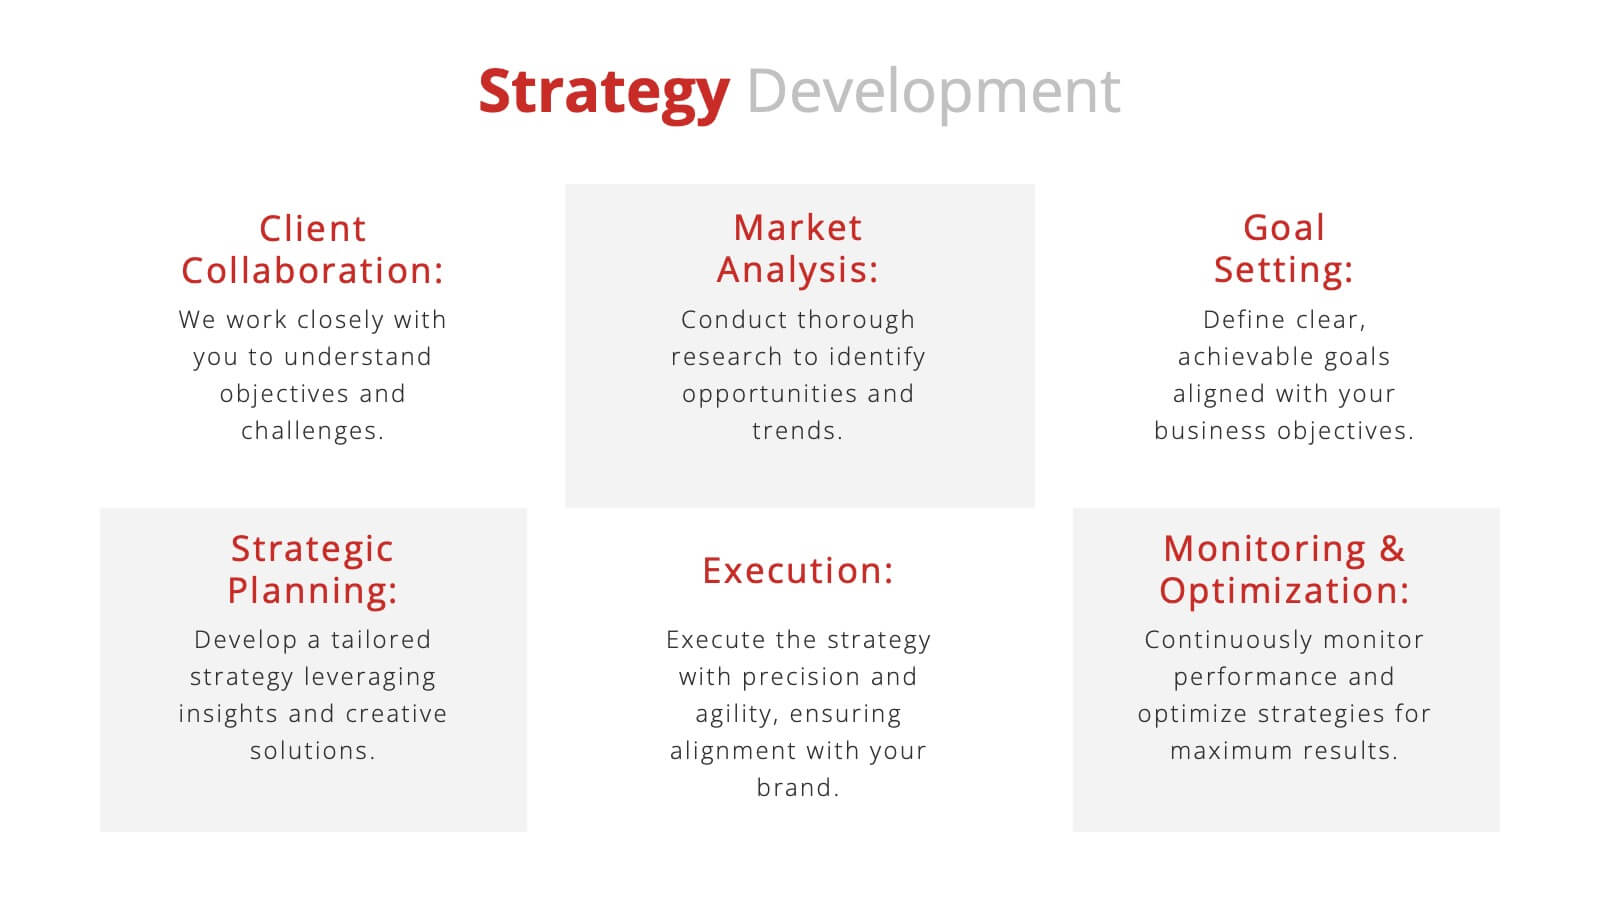
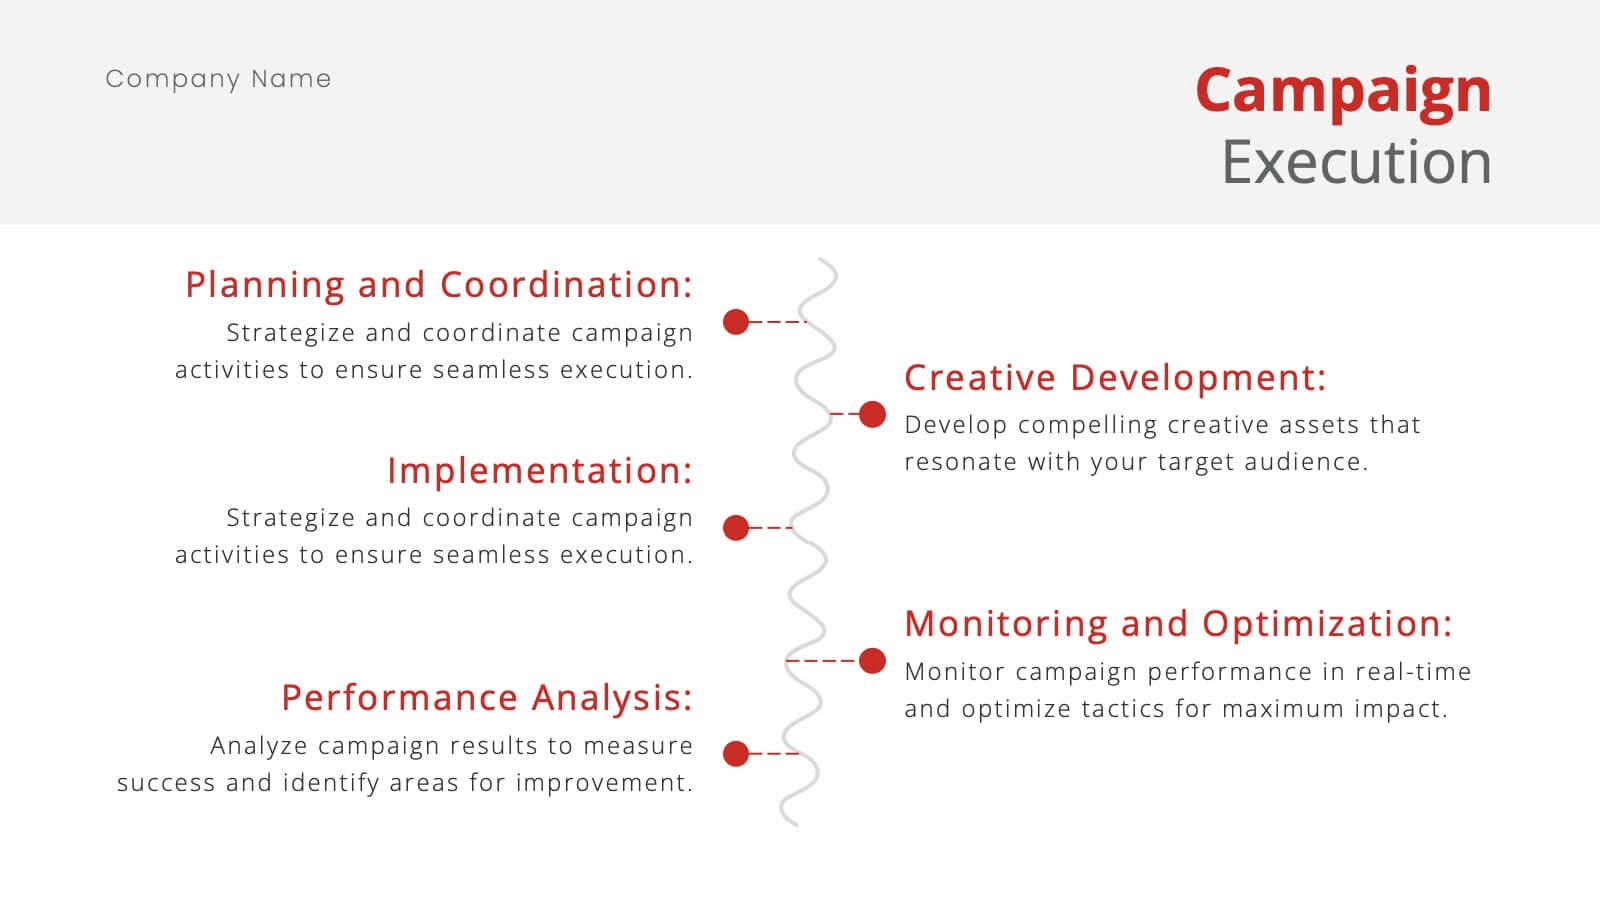
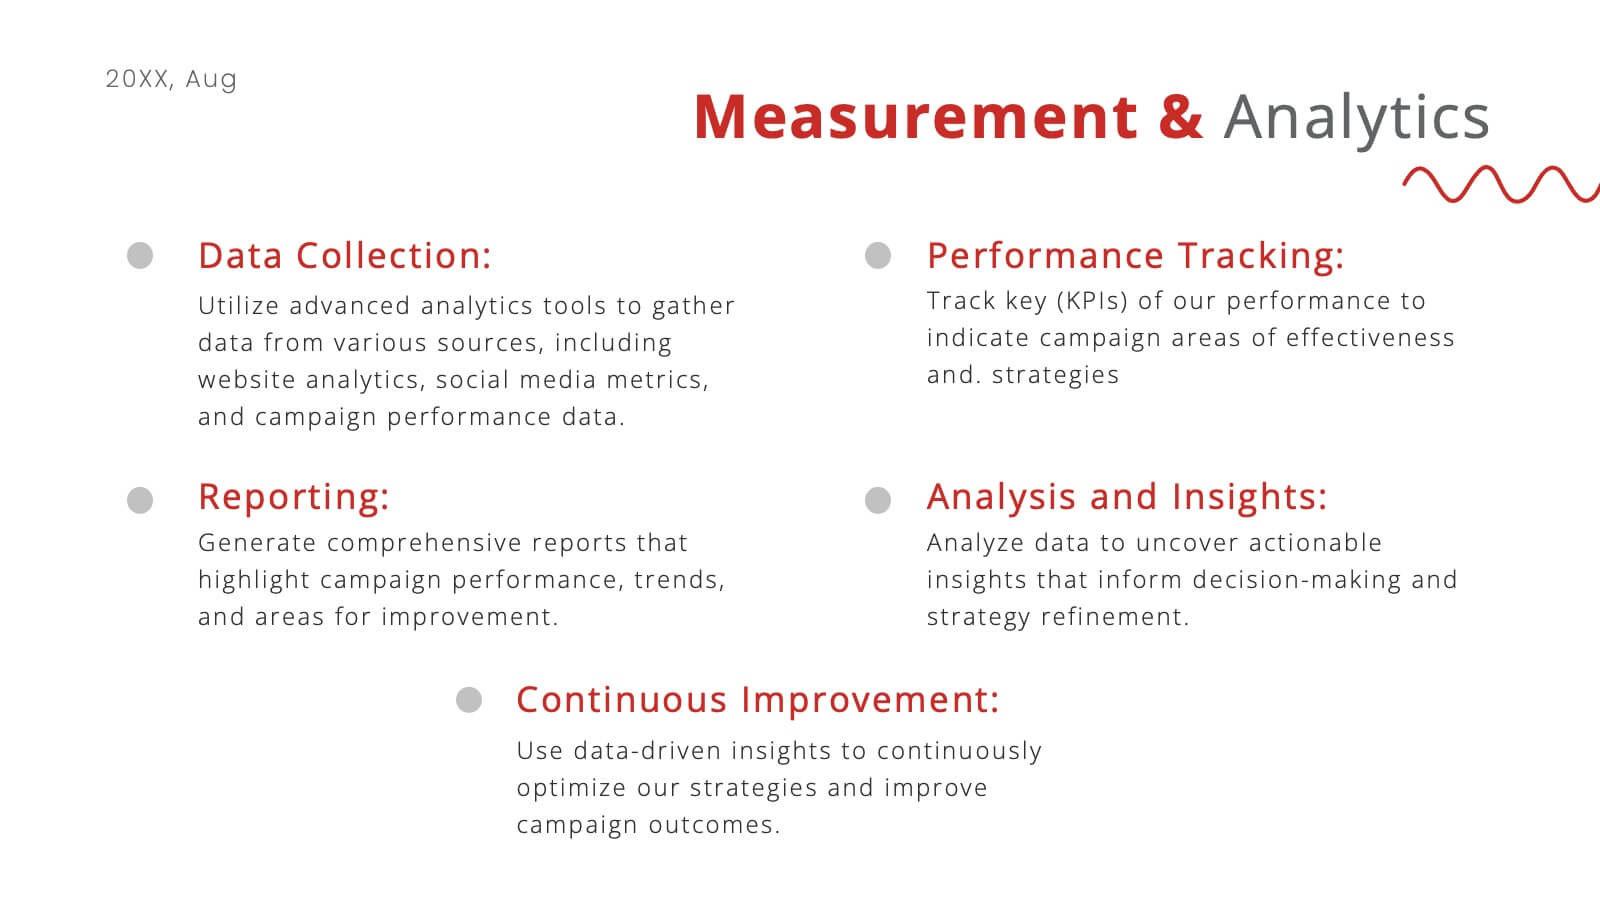
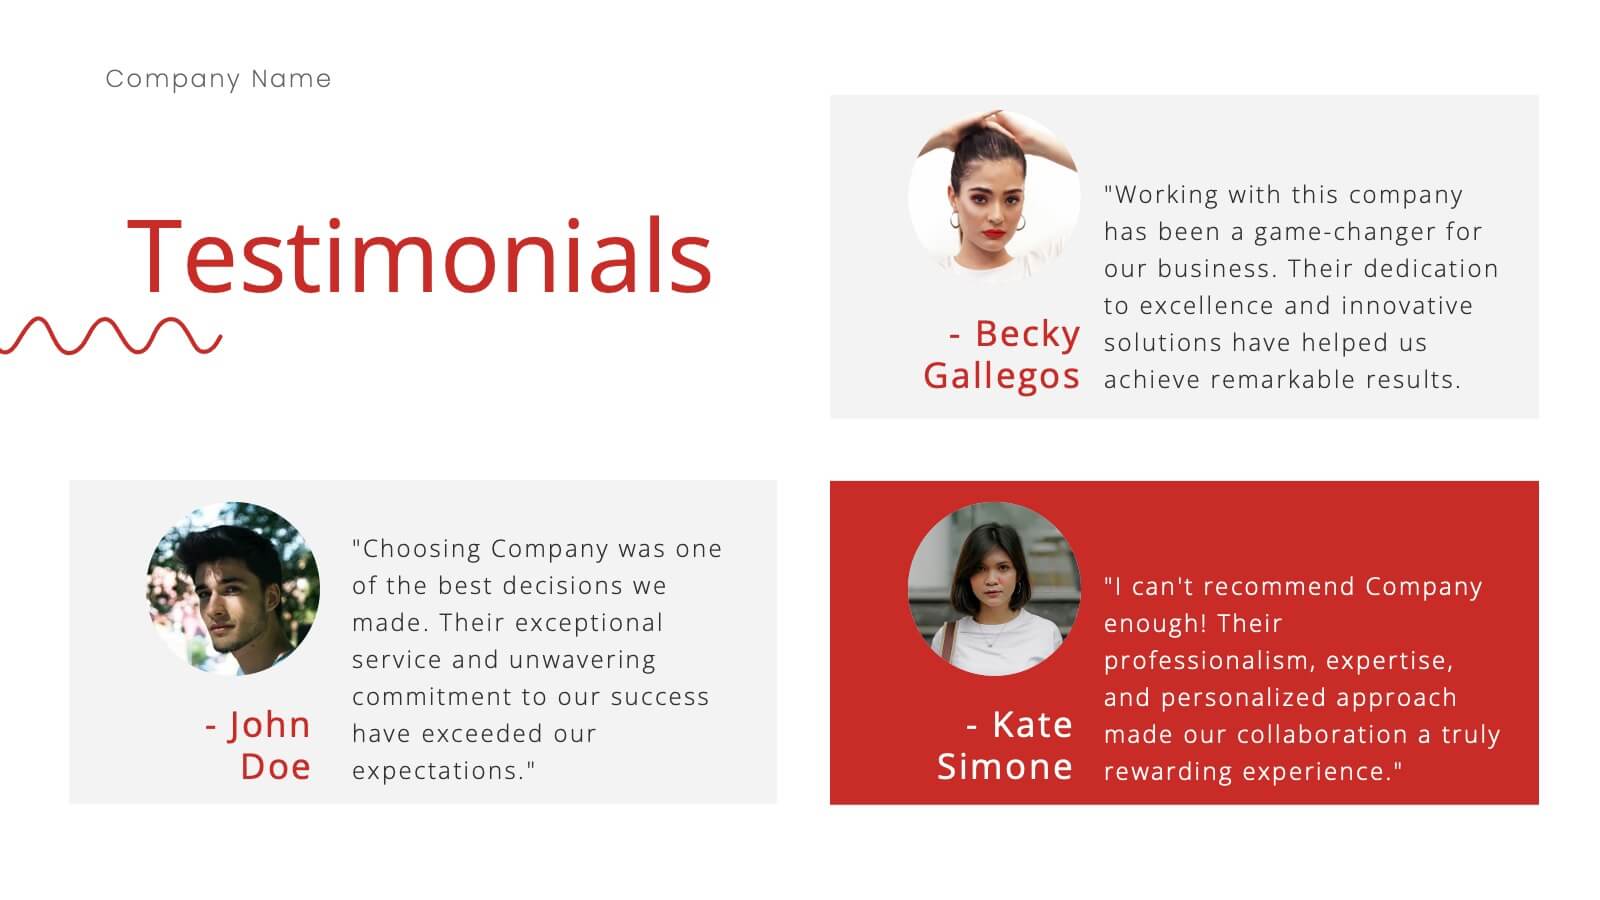
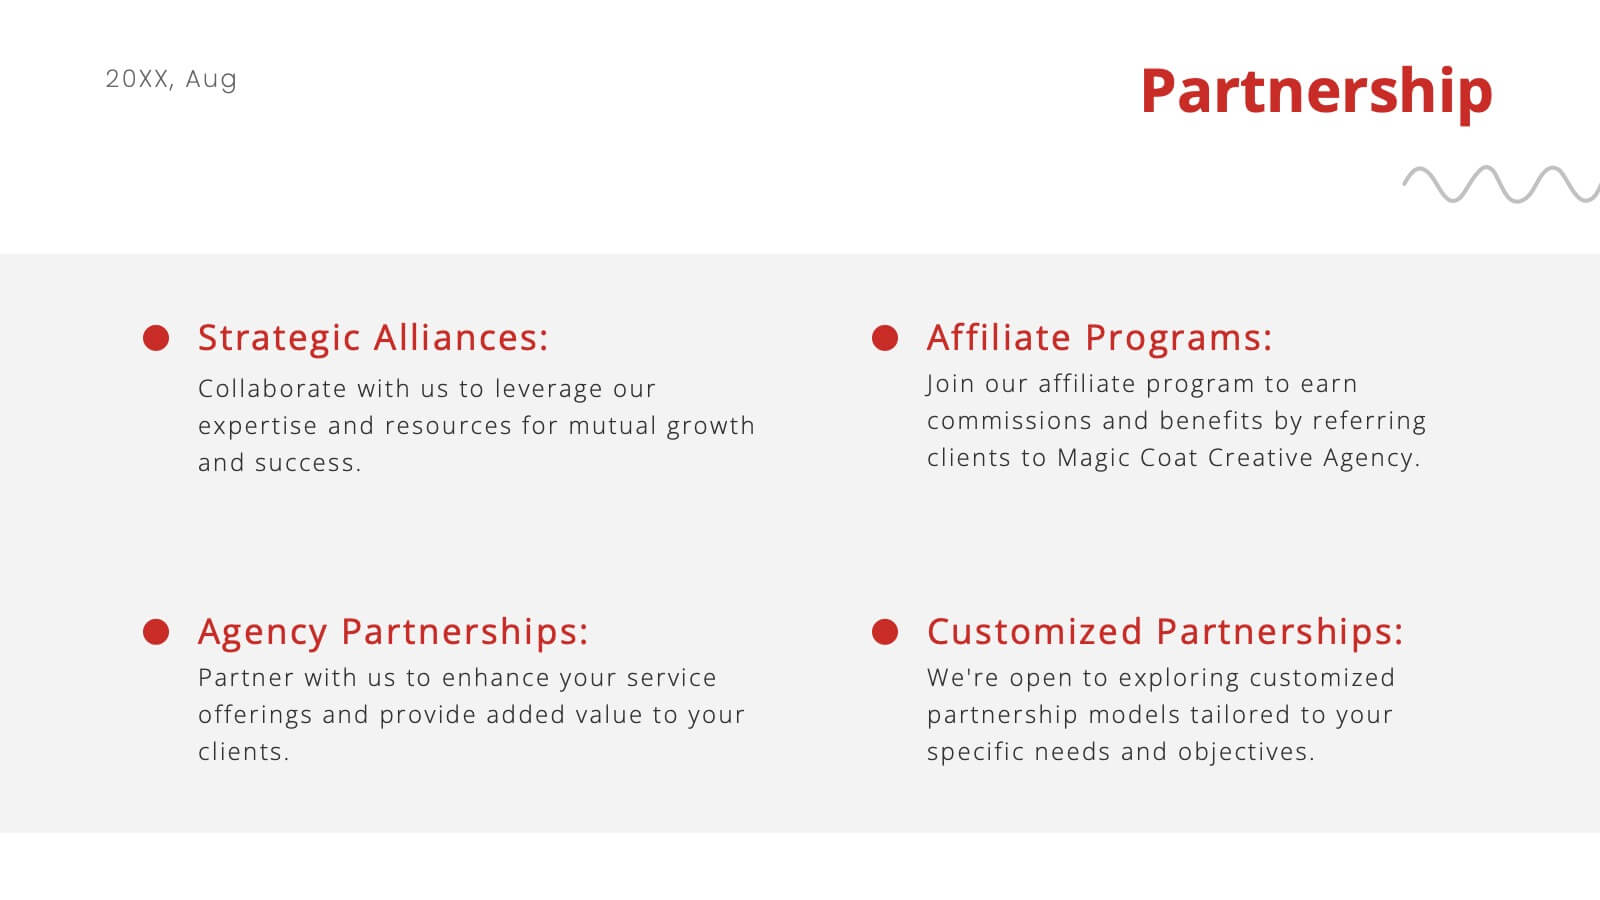
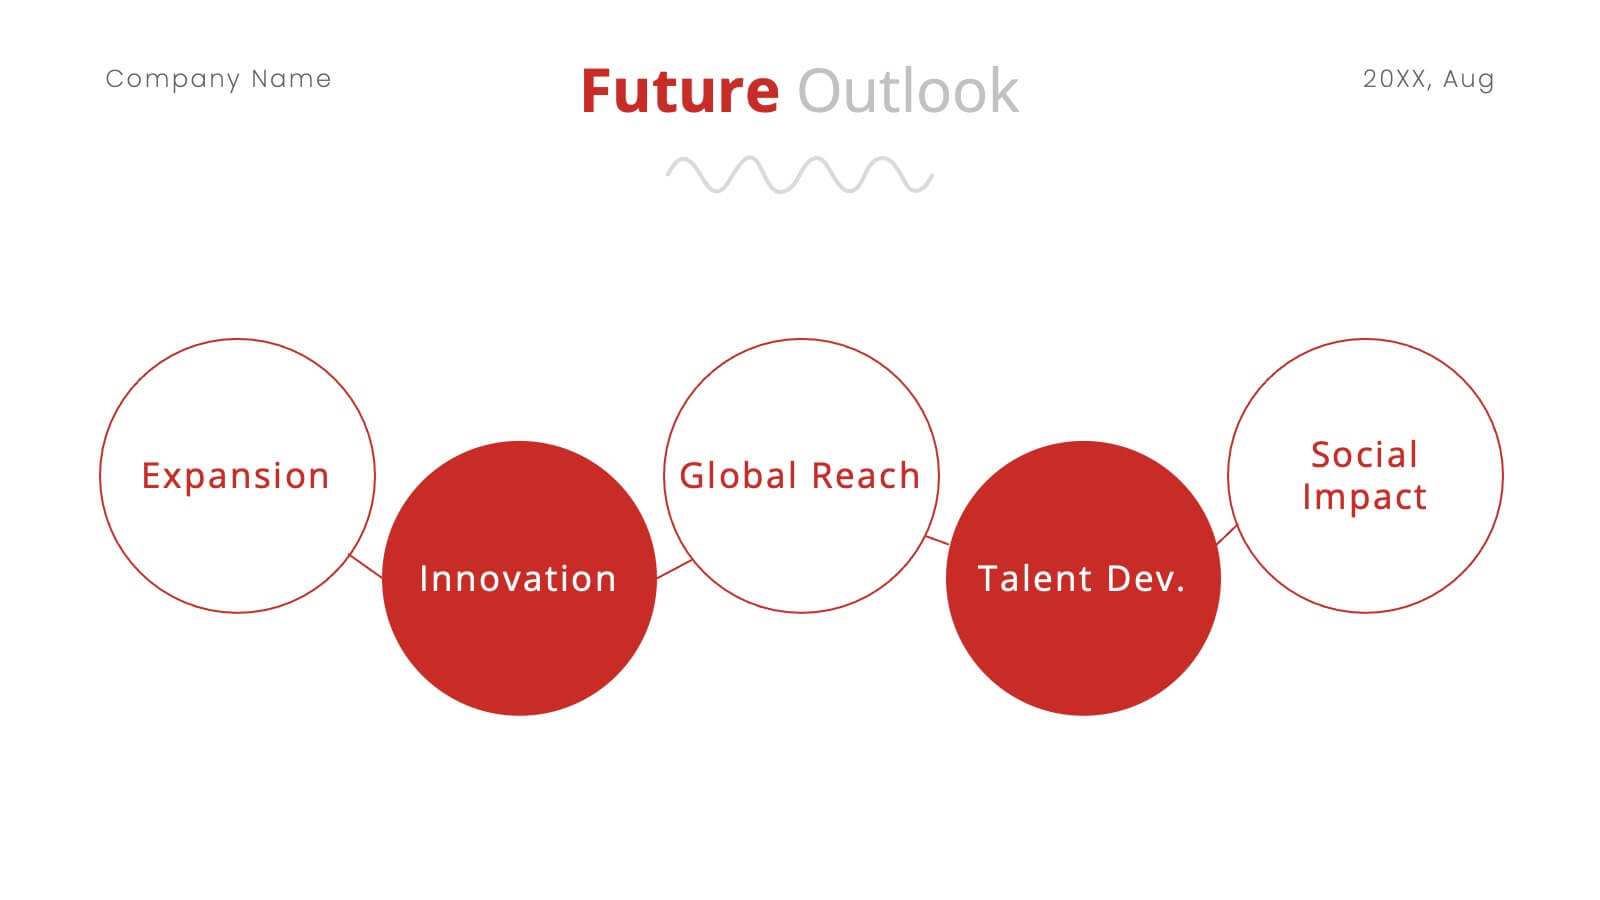
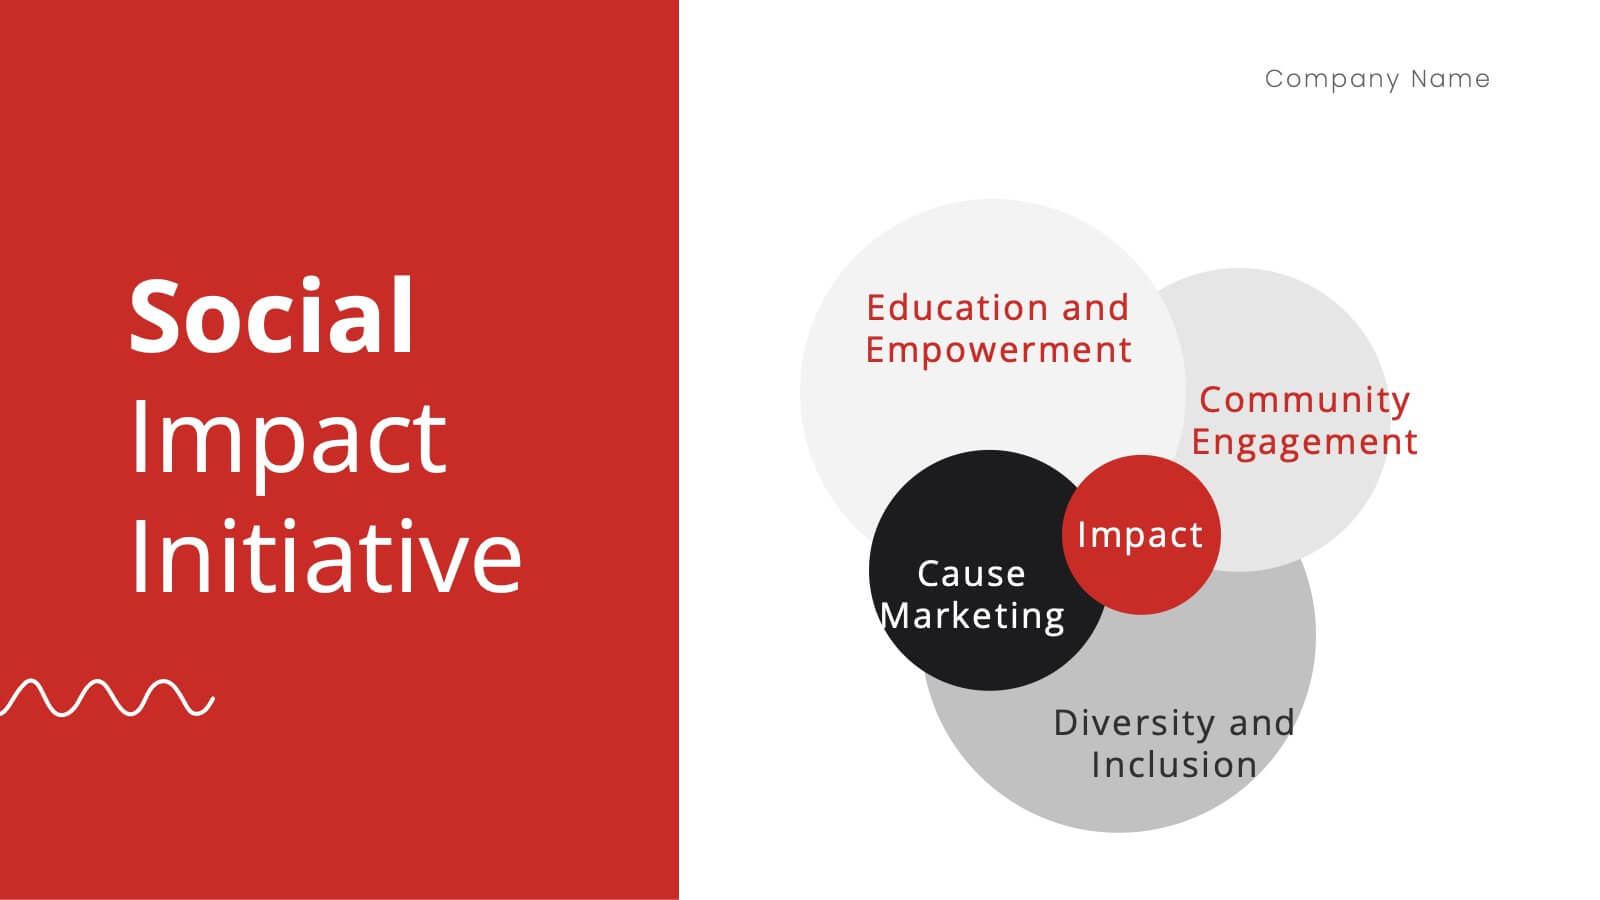
Nickel Advertising Agency Proposal Presentation
Take your advertising agency to the next level with this sleek and modern presentation template! Highlighting your services, team, success stories, and marketing strategies, it’s the perfect tool to showcase your agency’s strengths and capabilities. Fully customizable and compatible with PowerPoint, Keynote, and Google Slides, this template is ideal for impressing potential clients and partners.


7 diapositivas
Drawing Anatomy Infographic
Dive into the captivating world of human anatomy with our drawing anatomy infographic. Crafted with vibrant hues of green, orange, red, and blue, this template brings to life the intricacies and artistry of the human form. Whether you're an aspiring artist, a seasoned illustrator, or an educator, this infographic is tailored to enhance your understanding or teaching of anatomical details. The fun, colorful design ensures engagement, making learning a visually pleasing experience. Seamlessly incorporate it into PowerPoint, Keynote, or Google Slides for versatile and effective presentations.


4 diapositivas
3-Tier Pricing Table Layout Presentation
Make your pricing pitch pop with this bold and modern layout! This presentation template is perfect for showcasing product or service plans with clear comparisons across three tiers. Designed to streamline pricing communication, it’s ideal for SaaS, consulting, or digital services. Fully compatible with PowerPoint, Keynote, and Google Slides.


6 diapositivas
Responsibility Assignment Matrix Level Infographic
A Responsibility Assignment Matrix (RAM), is a useful tool in project management to define and clarify roles and responsibilities for various tasks and activities. This infographic template is a tool used in project management and organizational structure to define and communicate the roles and responsibilities of team members in tasks. This template will ensure that everyone involved in the project or process understands their roles and tasks, reducing confusion and improving accountability. This infographic will summarize the key points of your Responsibility Assignment Matrix. Compatible with Powerpoint, Keynote, and Google Slides.


7 diapositivas
Title Infographic
These presentation slides showcase a variety of title designs, each uniquely styled to suit different thematic contexts, using vibrant colors and dynamic typography to captivate and engage audiences. The designs are exceptionally versatile, making them suitable for a wide range of professional settings, including marketing, design, business strategy, and corporate overviews. Each slide is thoughtfully crafted to introduce sections, highlight key concepts, or set the stage for in-depth discussions, ensuring that every part of the presentation connects with the audience effectively. The strategic use of elements such as color blocks, minimalist layouts, and bold text helps in emphasizing the core message, making these slides an ideal choice for presenters looking to make an impactful introduction or to clearly delineate sections within their presentations.


4 diapositivas
AIDA Marketing Model Presentation
Optimize your marketing strategy with this AIDA Marketing Model Presentation template. Featuring a visually appealing funnel diagram, this template clearly outlines the Attention, Interest, Desire, and Action stages of customer engagement. Ideal for marketers, sales professionals, and business analysts. Fully customizable and compatible with PowerPoint, Keynote, and Google Slides.


6 diapositivas
Biological Structure and Function
Visualize anatomical frameworks with this dynamic skeletal structure infographic. Ideal for biology education, health science overviews, or anatomy lessons, this slide clearly marks major bones and allows for quick content customization. Fully editable in PowerPoint, Google Slides, and Keynote for seamless integration into any curriculum or report.


6 diapositivas
Construction Company Infographics
Construct a clear and compelling presentation for your Construction Company with our customizable infographic template. This template is fully compatible with popular presentation software like PowerPoint, Keynote, and Google Slides, allowing you to easily tailor it to showcase various aspects of your construction business. The Construction Company infographic template offers a visually engaging platform to highlight your company's services, projects, team, and achievements. Whether you're a construction company owner, project manager, or marketing professional, this template provides a user-friendly canvas to create informative presentations and promotional materials. Elevate your construction company's profile with this SEO-optimized Construction Company infographic template, thoughtfully designed for clarity and ease of use. Customize it to showcase your company's portfolio, expertise, safety measures, and client testimonials, ensuring you make a lasting impression on your audience. Start crafting your personalized infographic today to showcase your construction company effectively.


20 diapositivas
Emerald Sales Forecast Presentation
Shine bright with this emerald-inspired presentation, perfect for sharing your sales forecast! Designed to showcase revenue projections, market trends, and sales strategies, this template keeps your data organized and visually impactful. Its vibrant, clean design ensures your forecast captures attention. Compatible with PowerPoint, Keynote, and Google Slides.


5 diapositivas
Monthly Financial Report Infographics
Dive into financial analytics with our monthly financial report infographics template. This indispensable tool, designed for finance professionals, managers, and business owners, comes in a stimulating mix of orange, pink, and green, reflecting the dynamic nature of finance. The template stands out with creative graphics, detailed icons, and designated areas for images that encapsulate various financial parameters. Ideal for depicting key statistics, trends, and financial insights in a clear, engaging manner, this vertical-style infographic template is perfect for simplifying complex data, ensuring your monthly reports are both comprehensive and captivating.


4 diapositivas
Food Business Concept Pitch Presentation
Bring your culinary vision to life with the Food Business Concept Pitch Presentation. This unique avocado-shaped layout helps you outline up to four key ideas—from menu innovation to service strategy. Perfect for chefs, restaurateurs, or food startups. Fully editable in PowerPoint, Canva, and Google Slides for easy customization.


4 diapositivas
Incident Prevention and Safety Culture Presentation
Promote a proactive approach to workplace wellbeing with the Incident Prevention and Safety Culture presentation. This visually structured slide uses bold safety icons—such as warning signs, first aid, and hazard symbols—to represent core pillars of a safety-first environment. Ideal for outlining safety protocols, risk mitigation strategies, training initiatives, and cultural values, each section includes editable placeholders for concise messaging. The clean layout supports quick communication in HR briefings, onboarding, or compliance meetings. Fully customizable and compatible with PowerPoint, Keynote, and Google Slides.


2 diapositivas
Engaging Opening Introduction Presentation
Make a lasting first impression with this Engaging Opening Introduction Slide. Designed for professional presentations, networking events, and business pitches, this slide offers a modern, structured layout with a dynamic image section and clear text area. Fully customizable in PowerPoint, Keynote, and Google Slides, you can easily adjust colors, fonts, and content to match your brand.