
Características


¿Tienes alguna pregunta?
Recomendar


4 diapositivas
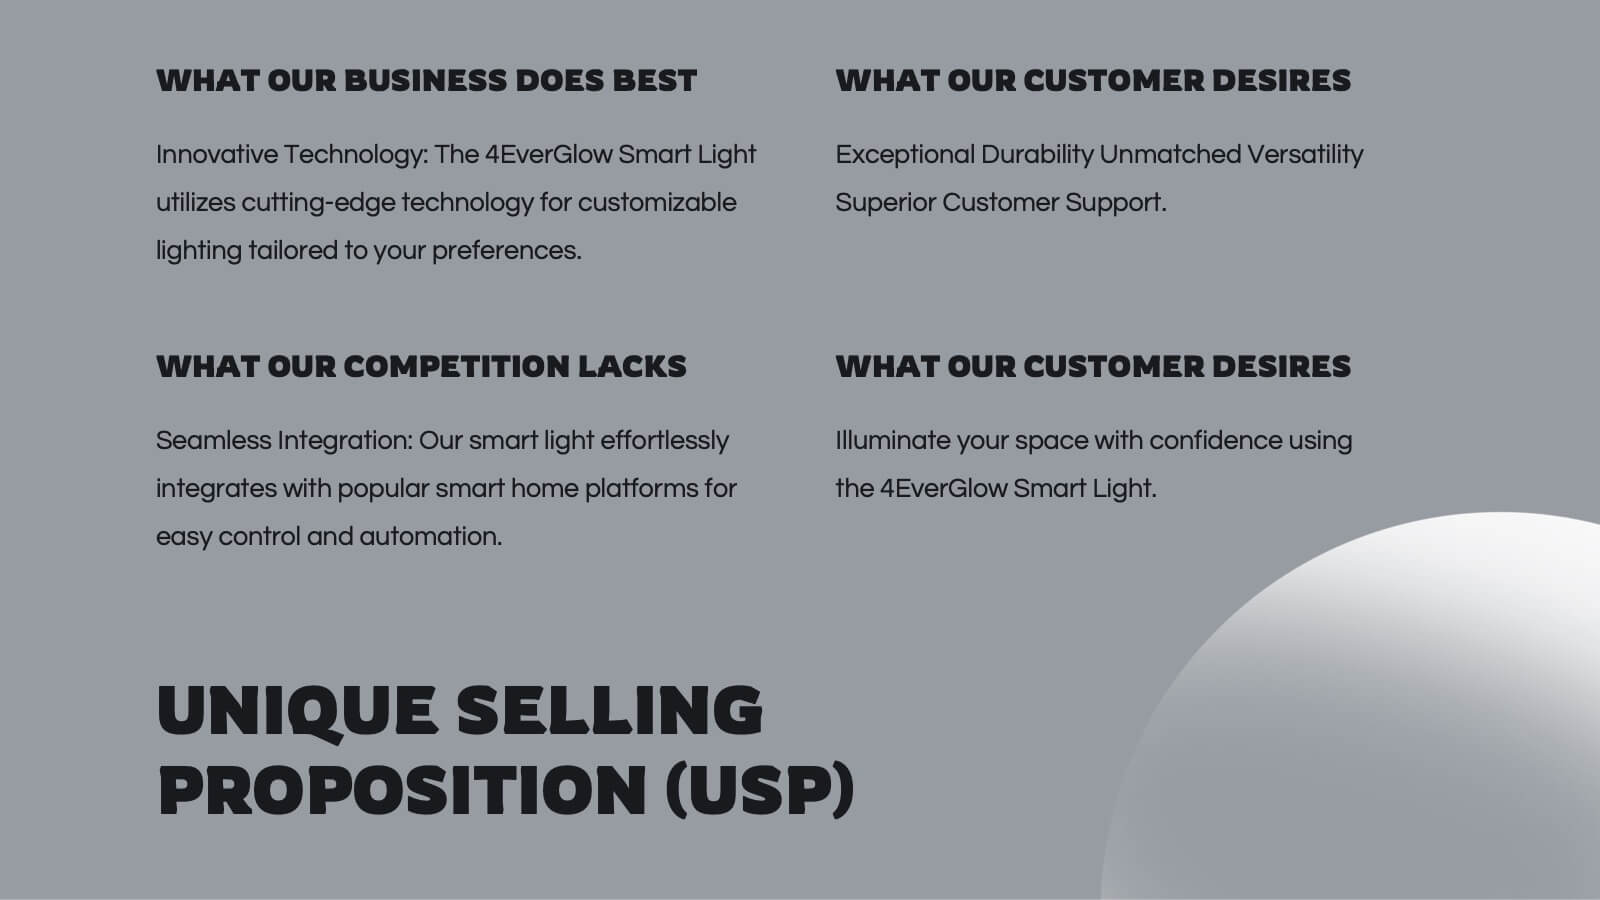
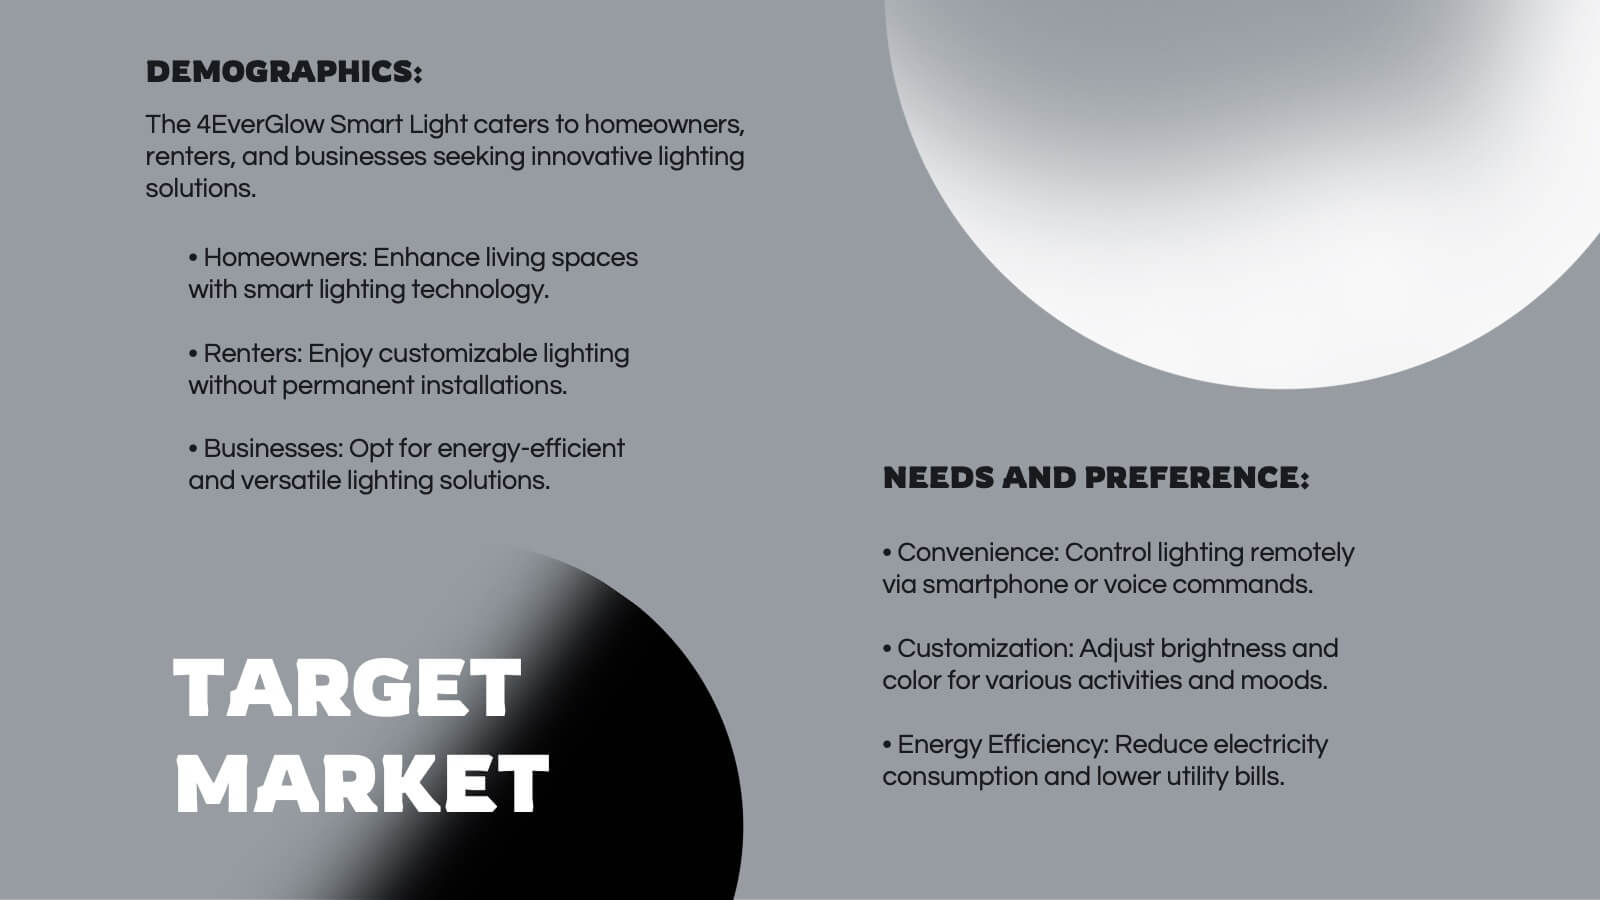
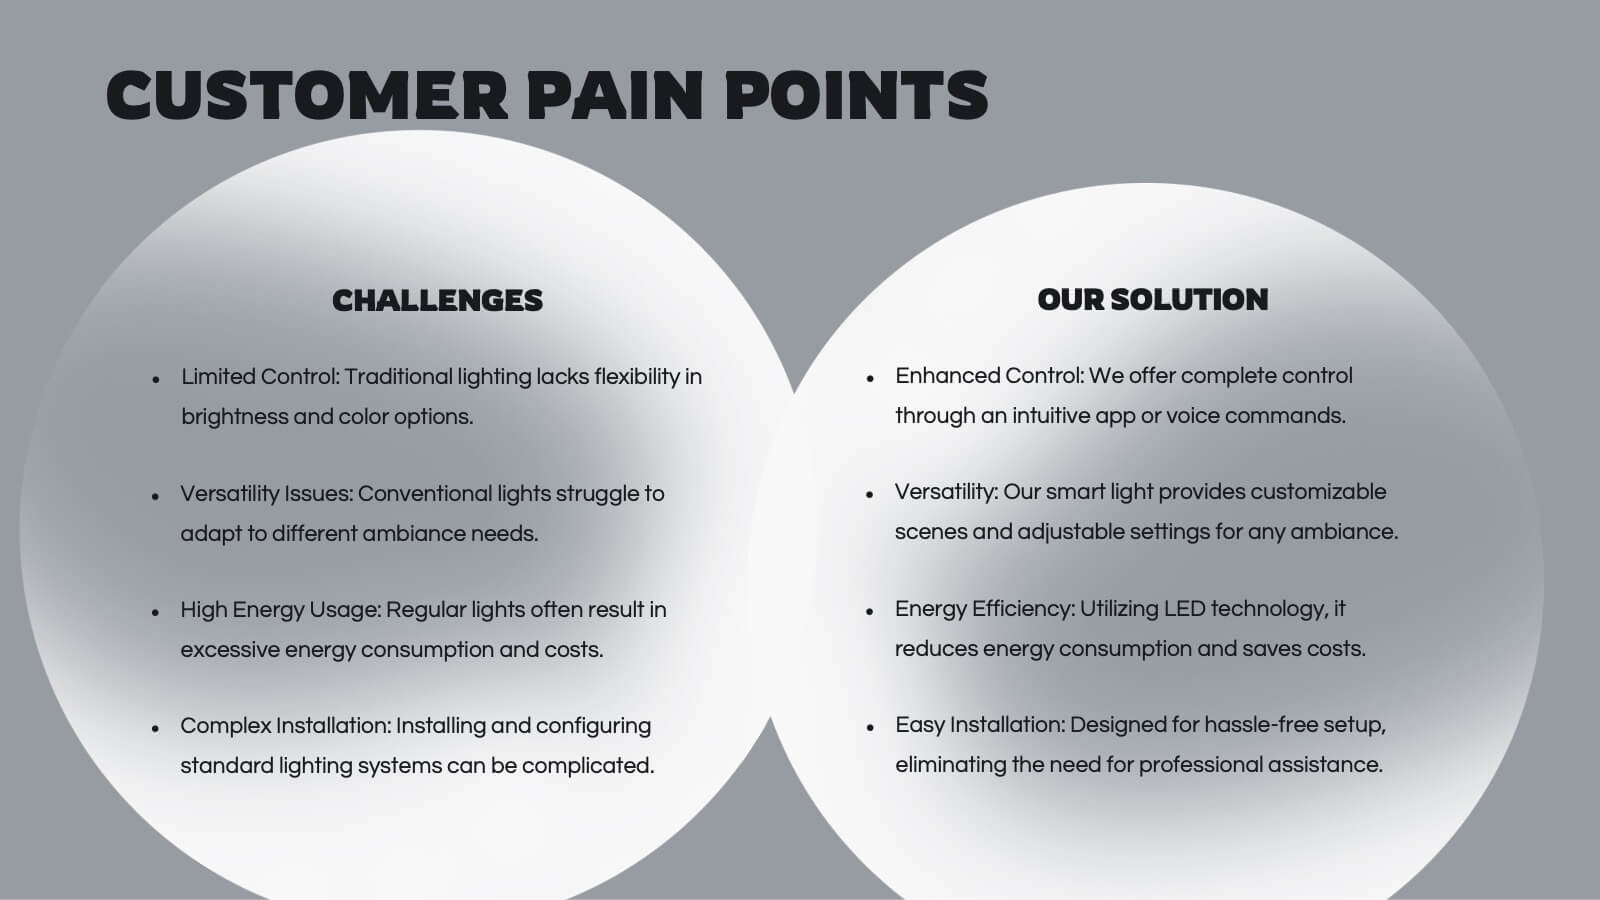
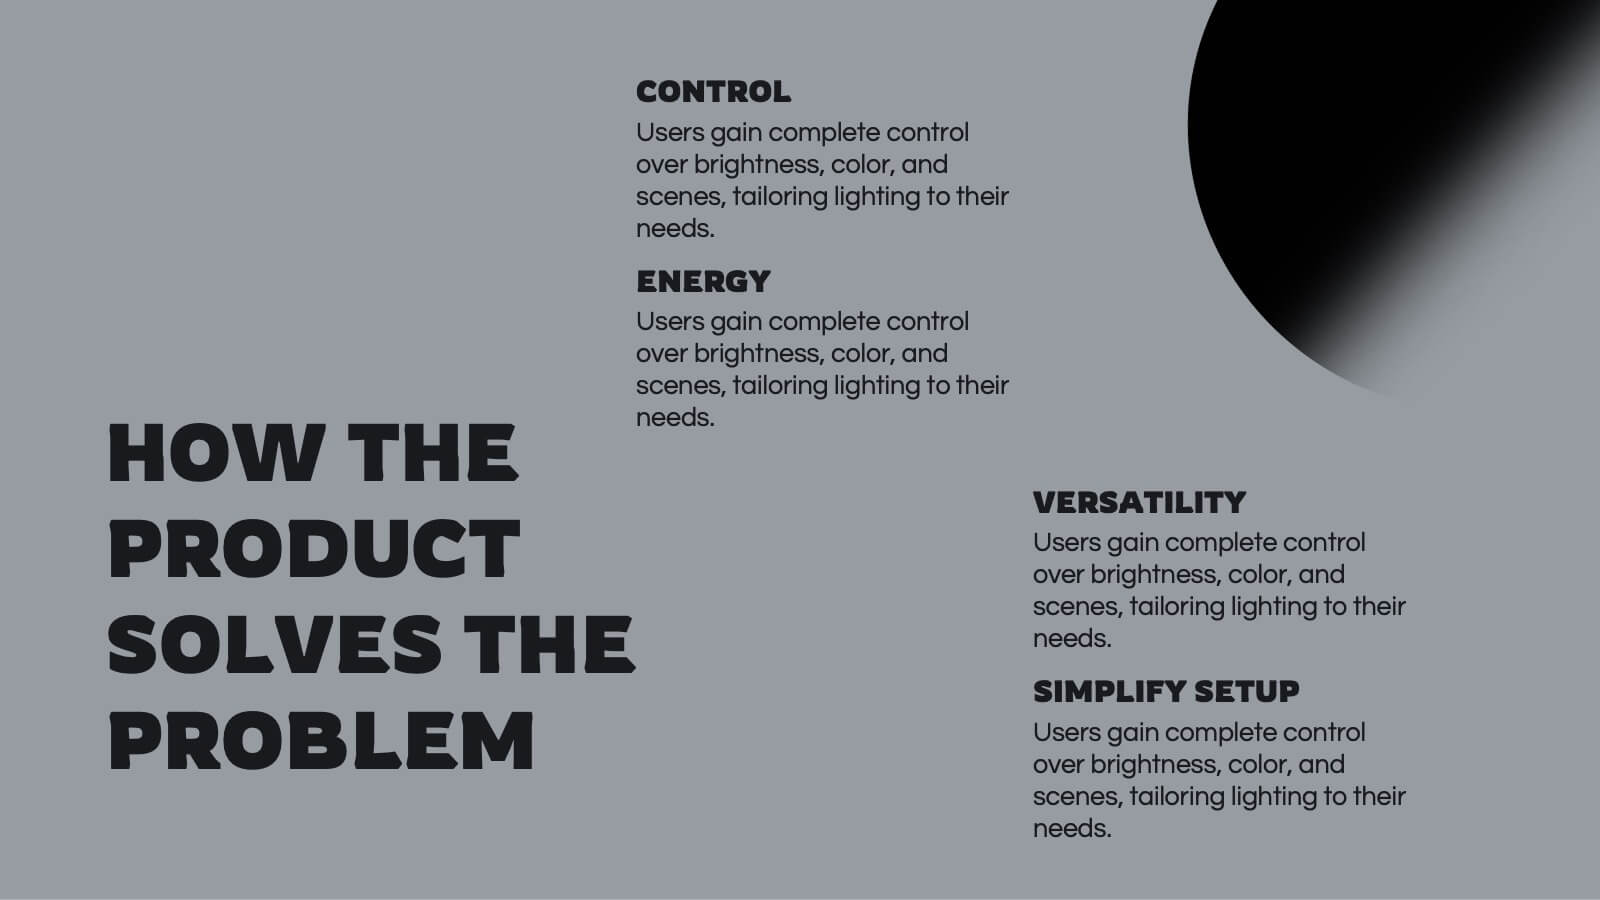
Customer-Focused Benefit Breakdown Presentation
Put your audience at the center with the Customer-Focused Benefit Breakdown Presentation. This slide design features a spotlight-style layout that emphasizes user-centric advantages and clearly communicates your value propositions. Ideal for marketing plans, sales strategies, or user journey analysis. Fully customizable and compatible with PowerPoint, Keynote, and Google Slides.


5 diapositivas
Organizational Change Management Plan Presentation
Lead transformation with confidence using this layered pyramid visual designed for change management plans. Each tier clearly outlines steps, roles, or phases within your organizational shift—perfect for guiding teams through the process. Ideal for strategic presentations, leadership briefings, and operational planning. Fully compatible with PowerPoint, Keynote, and Google Slides.


6 diapositivas
4-Segment Ideal Buyer Persona Presentation
Bring clarity to your audience with a clean, structured slide that breaks down who your ideal customer truly is. This presentation helps you outline background, goals, challenges, learning habits, interests, and preferences in an easy-to-follow format. Fully compatible with PowerPoint, Keynote, and Google Slides.

20 diapositivas
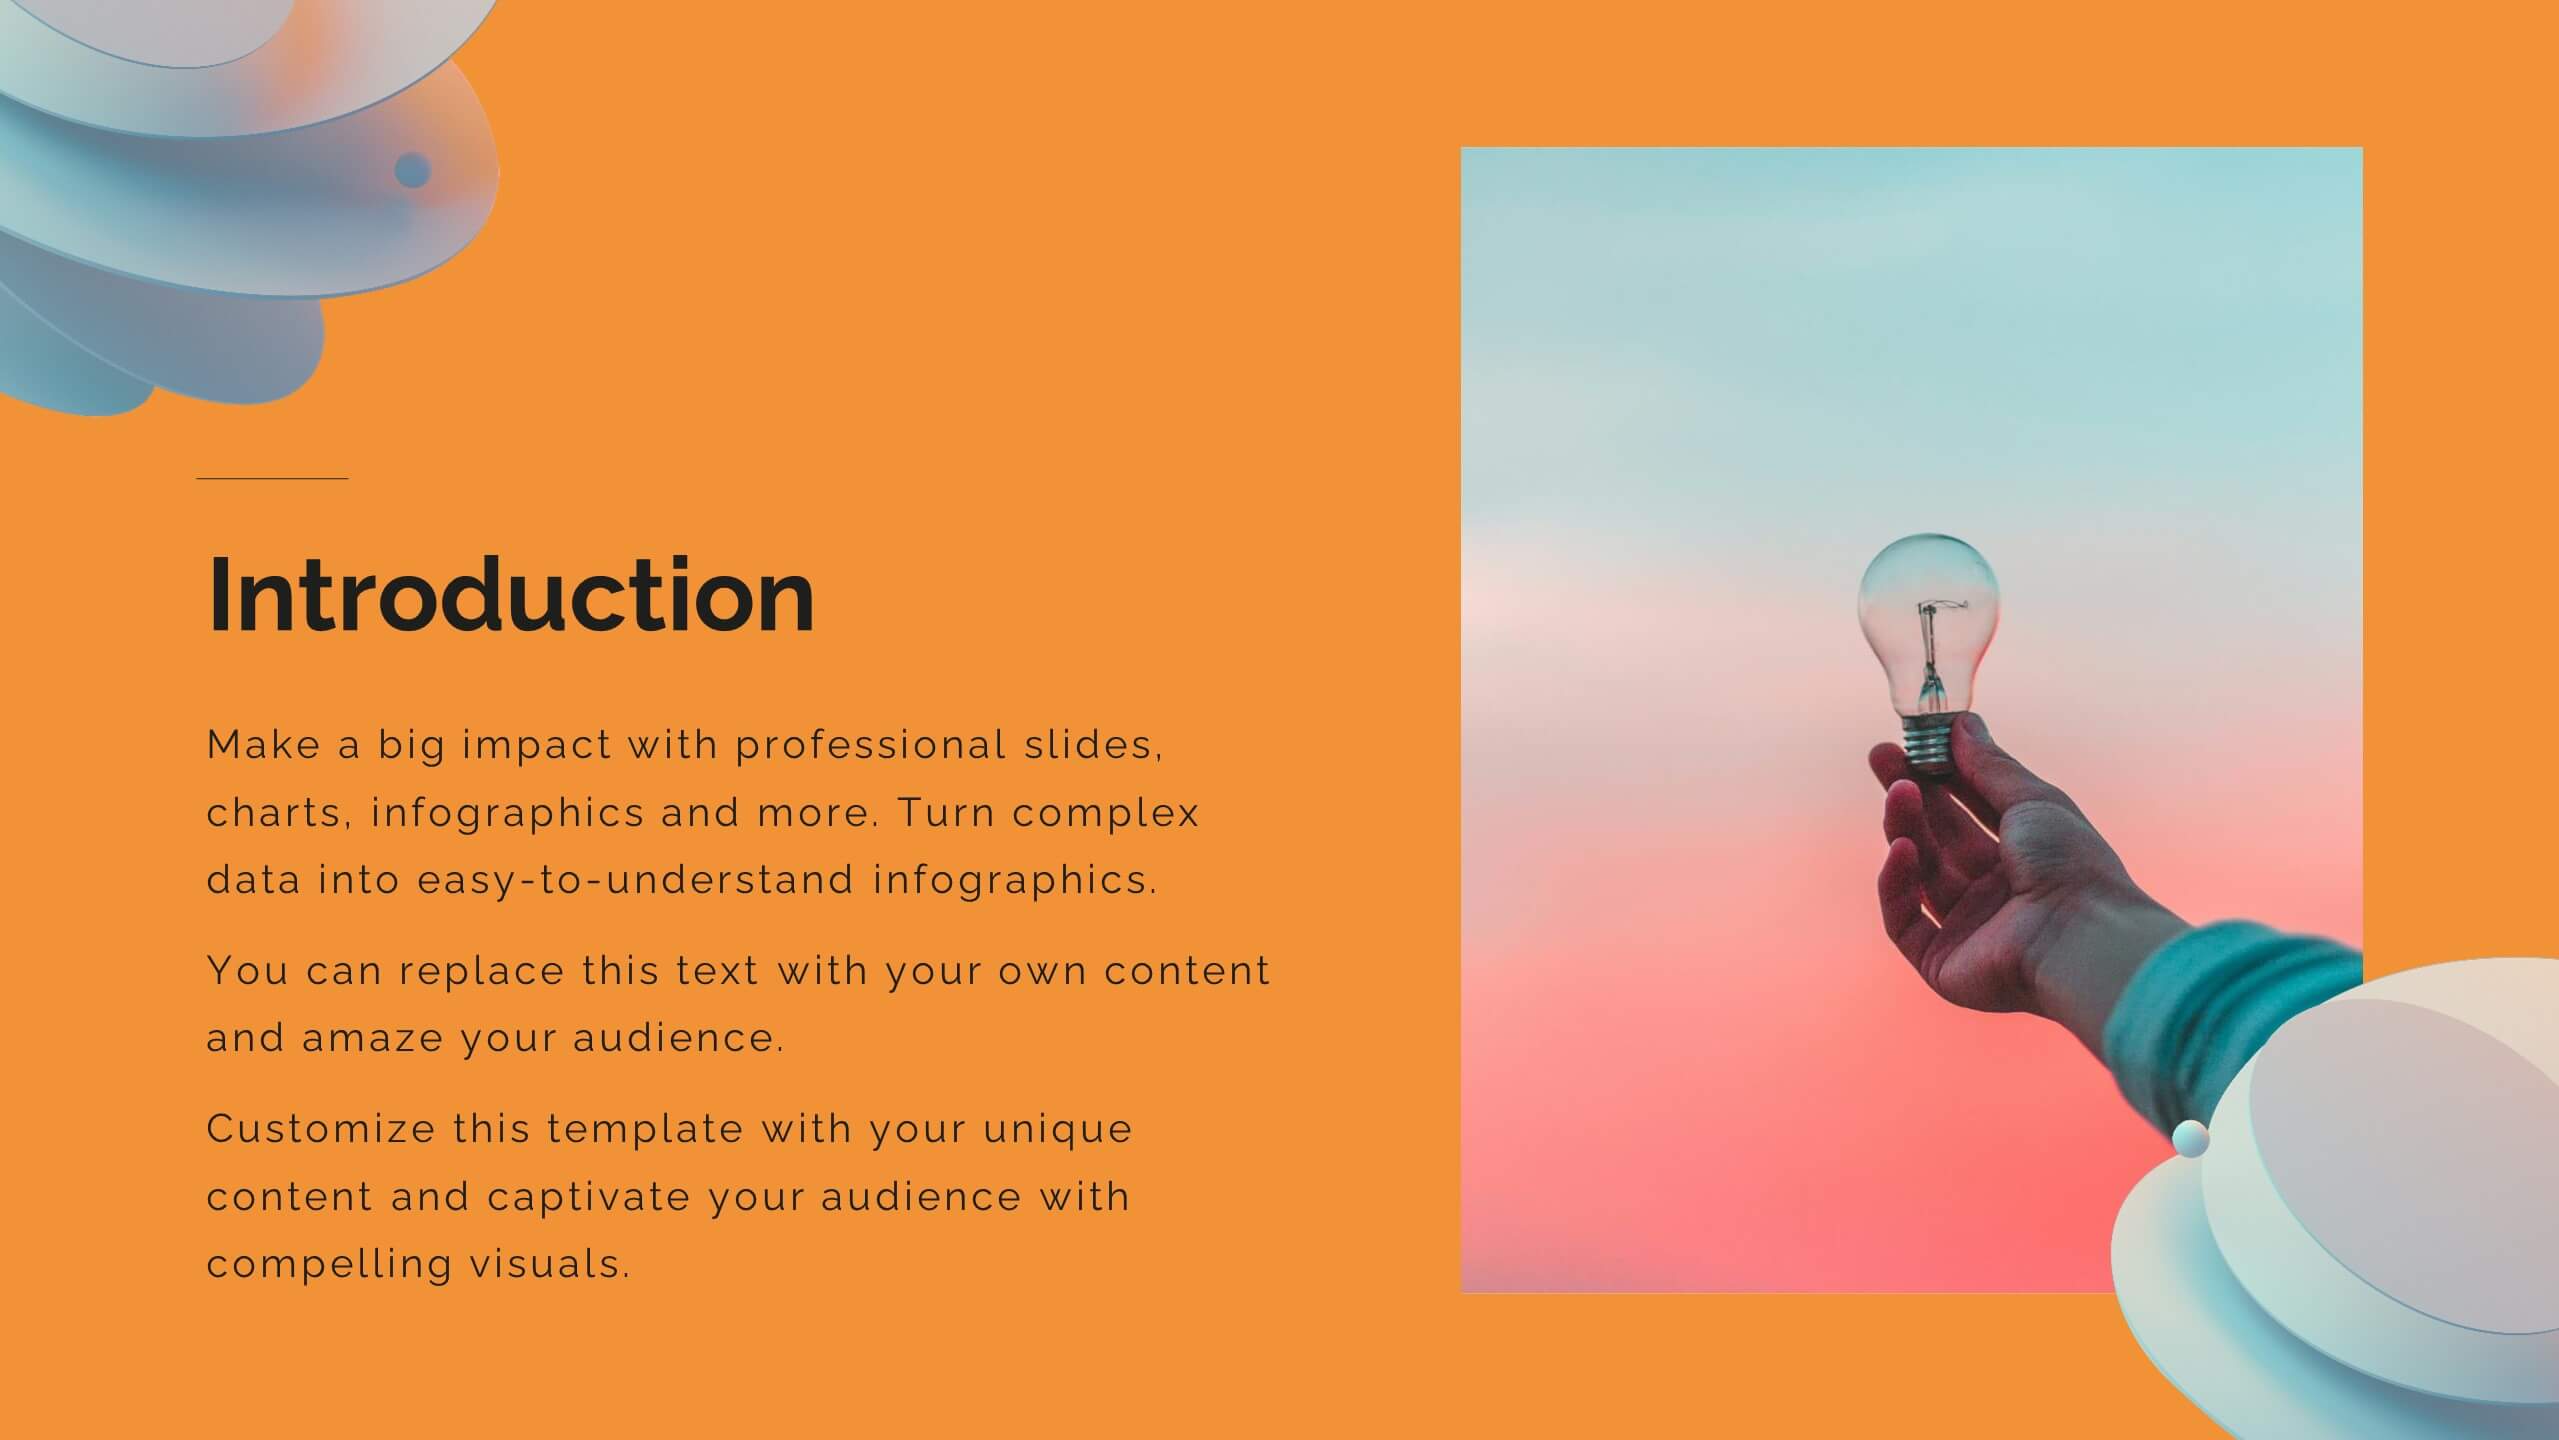
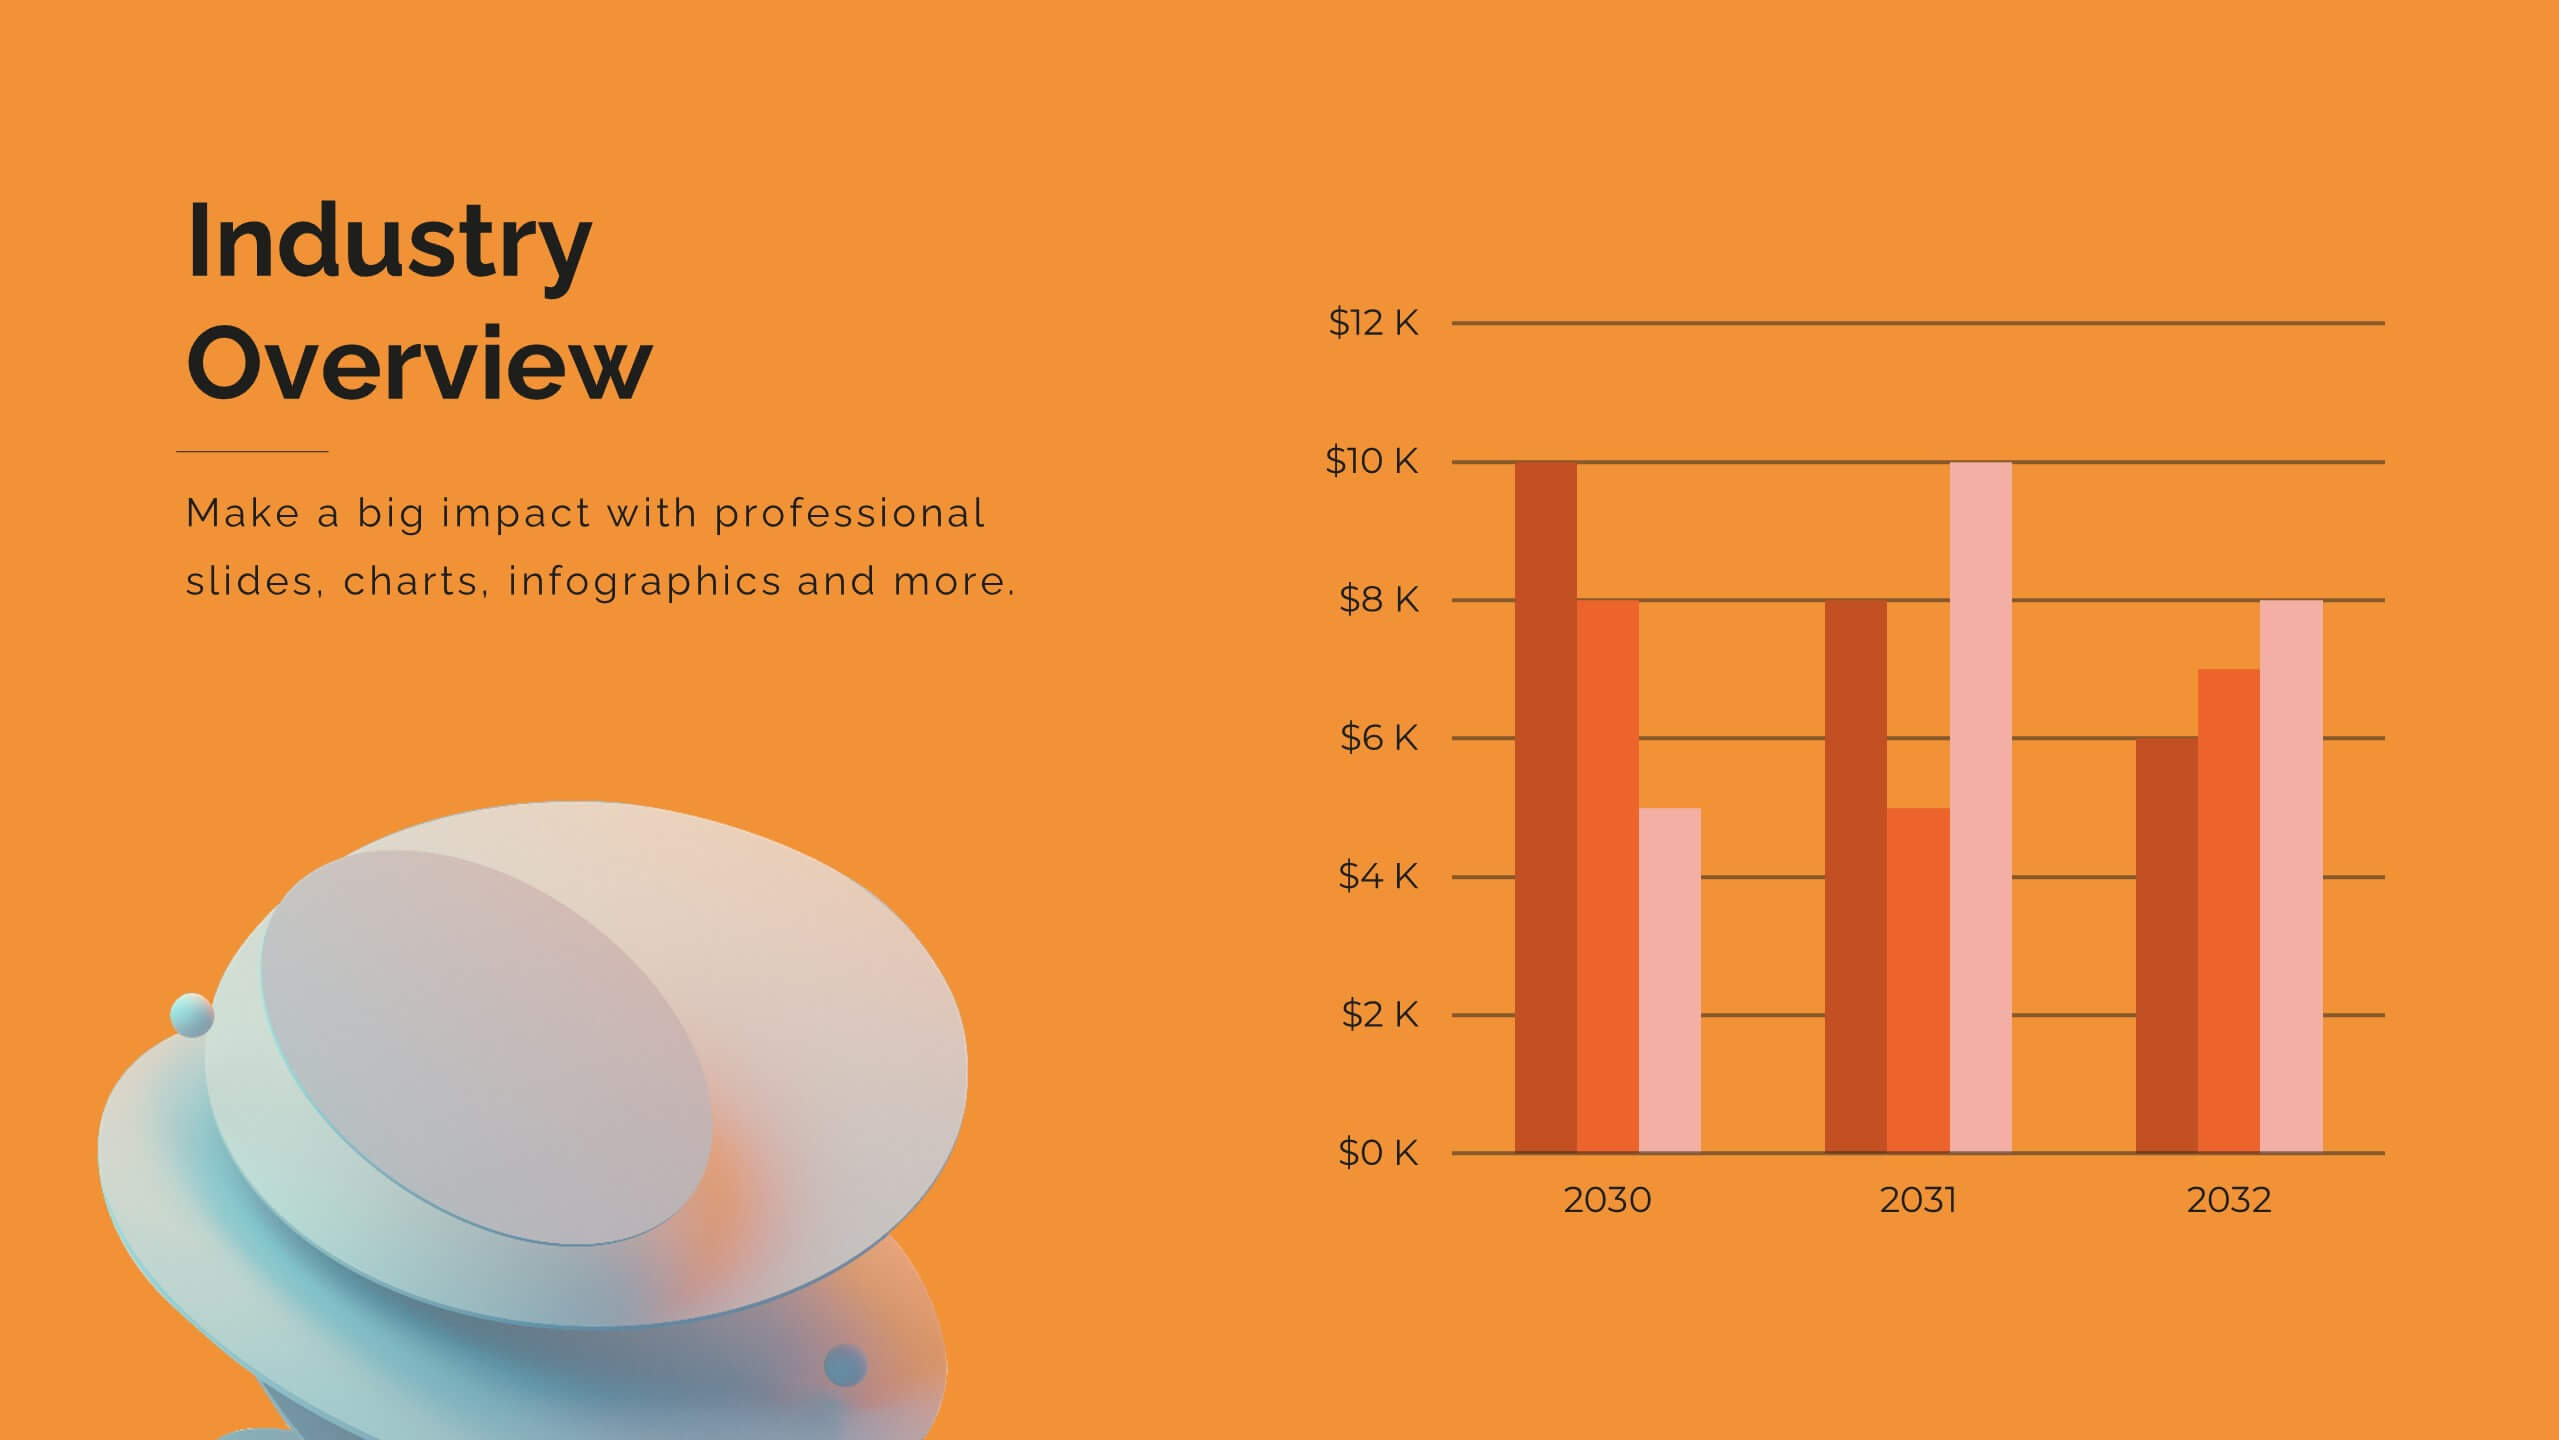
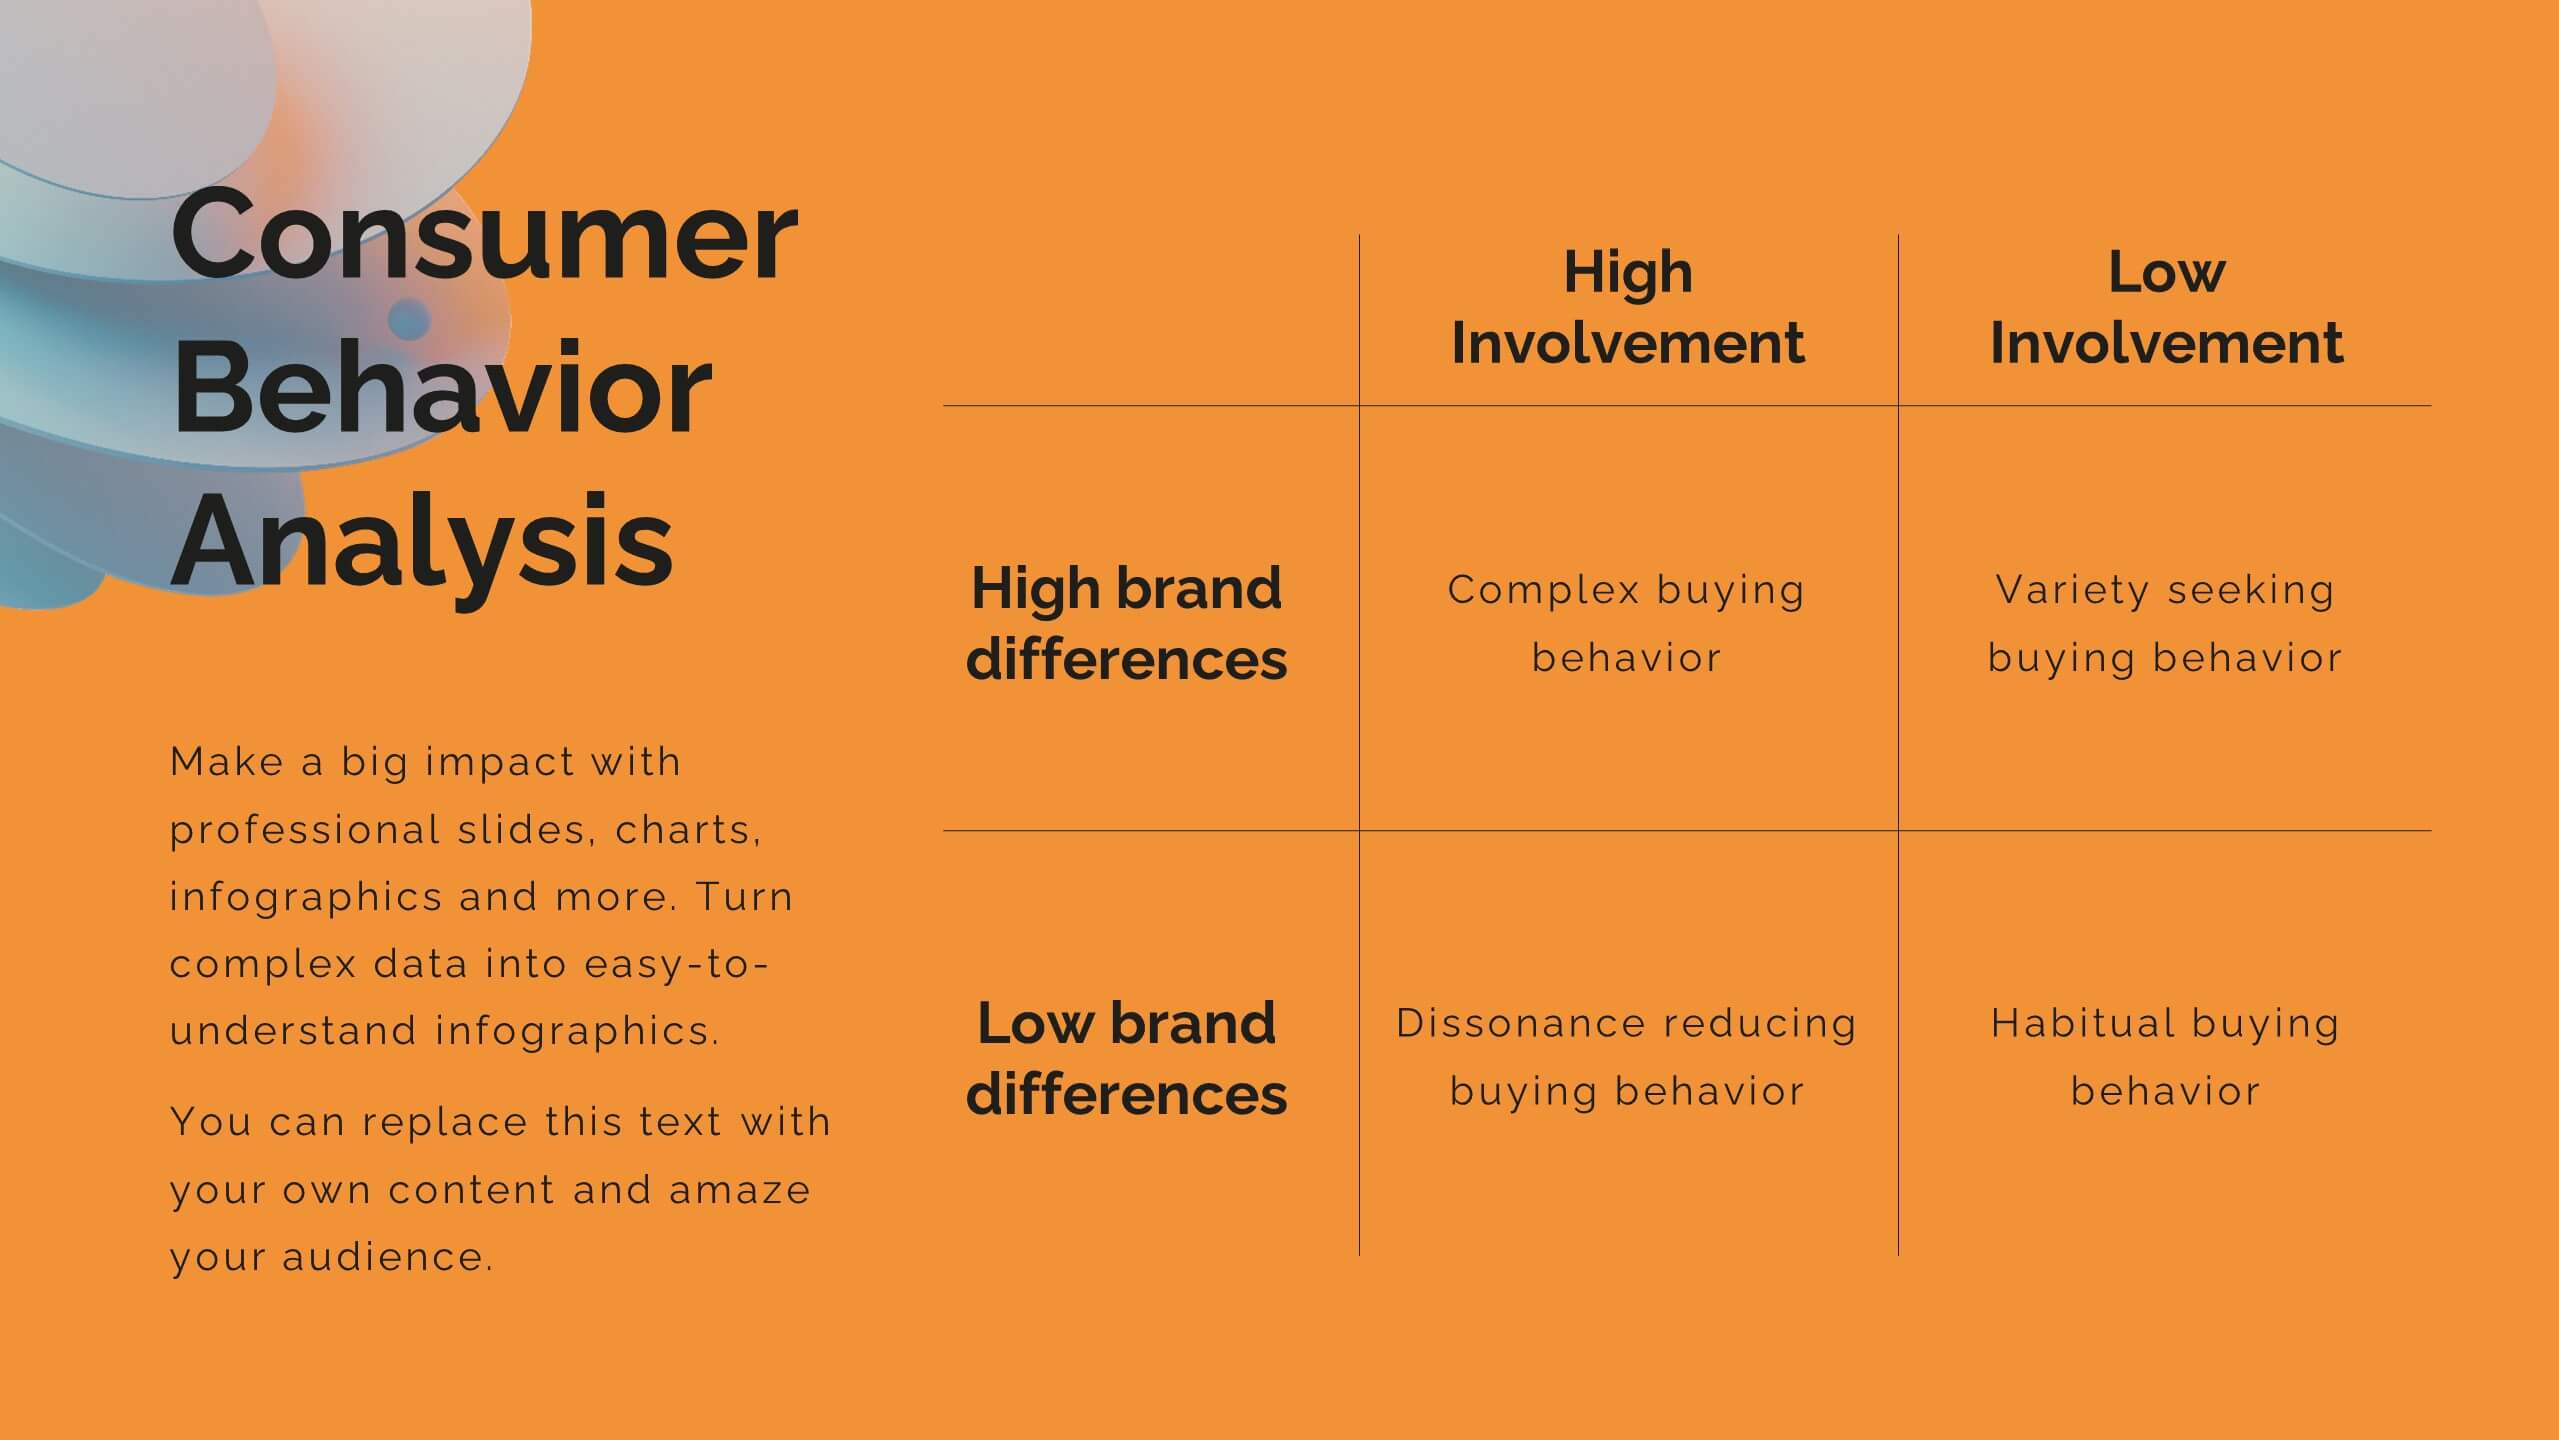
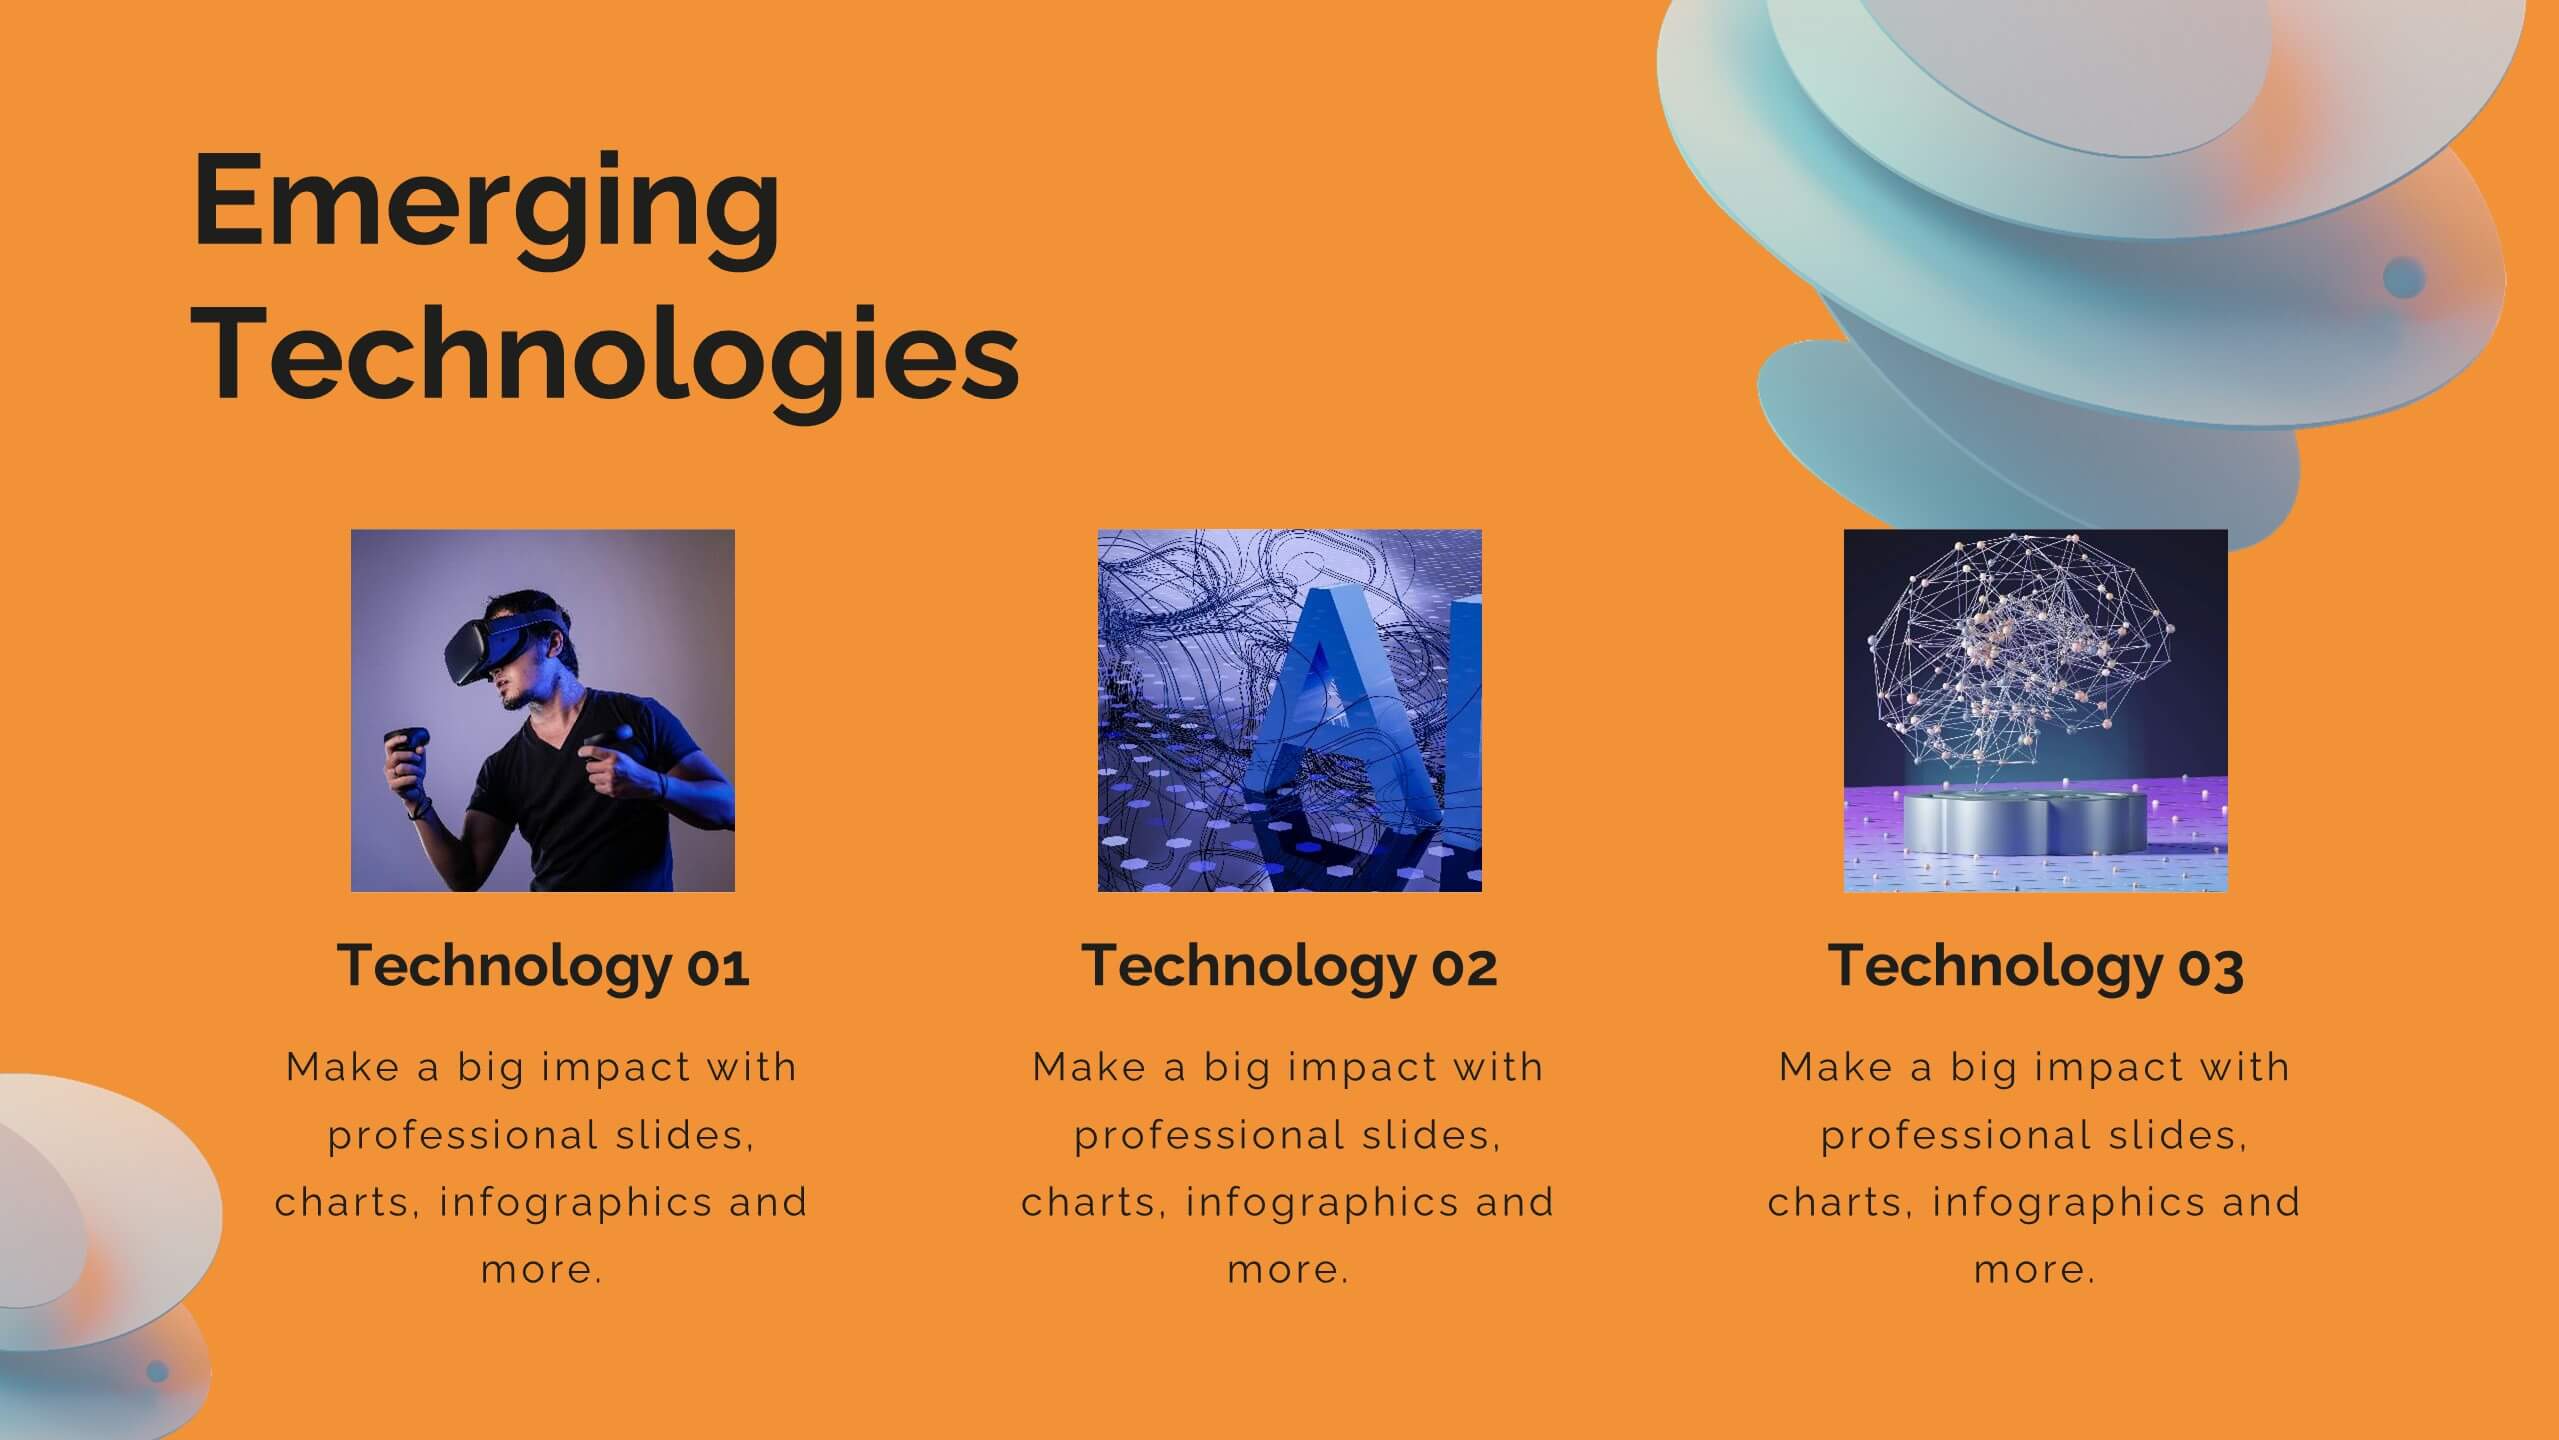
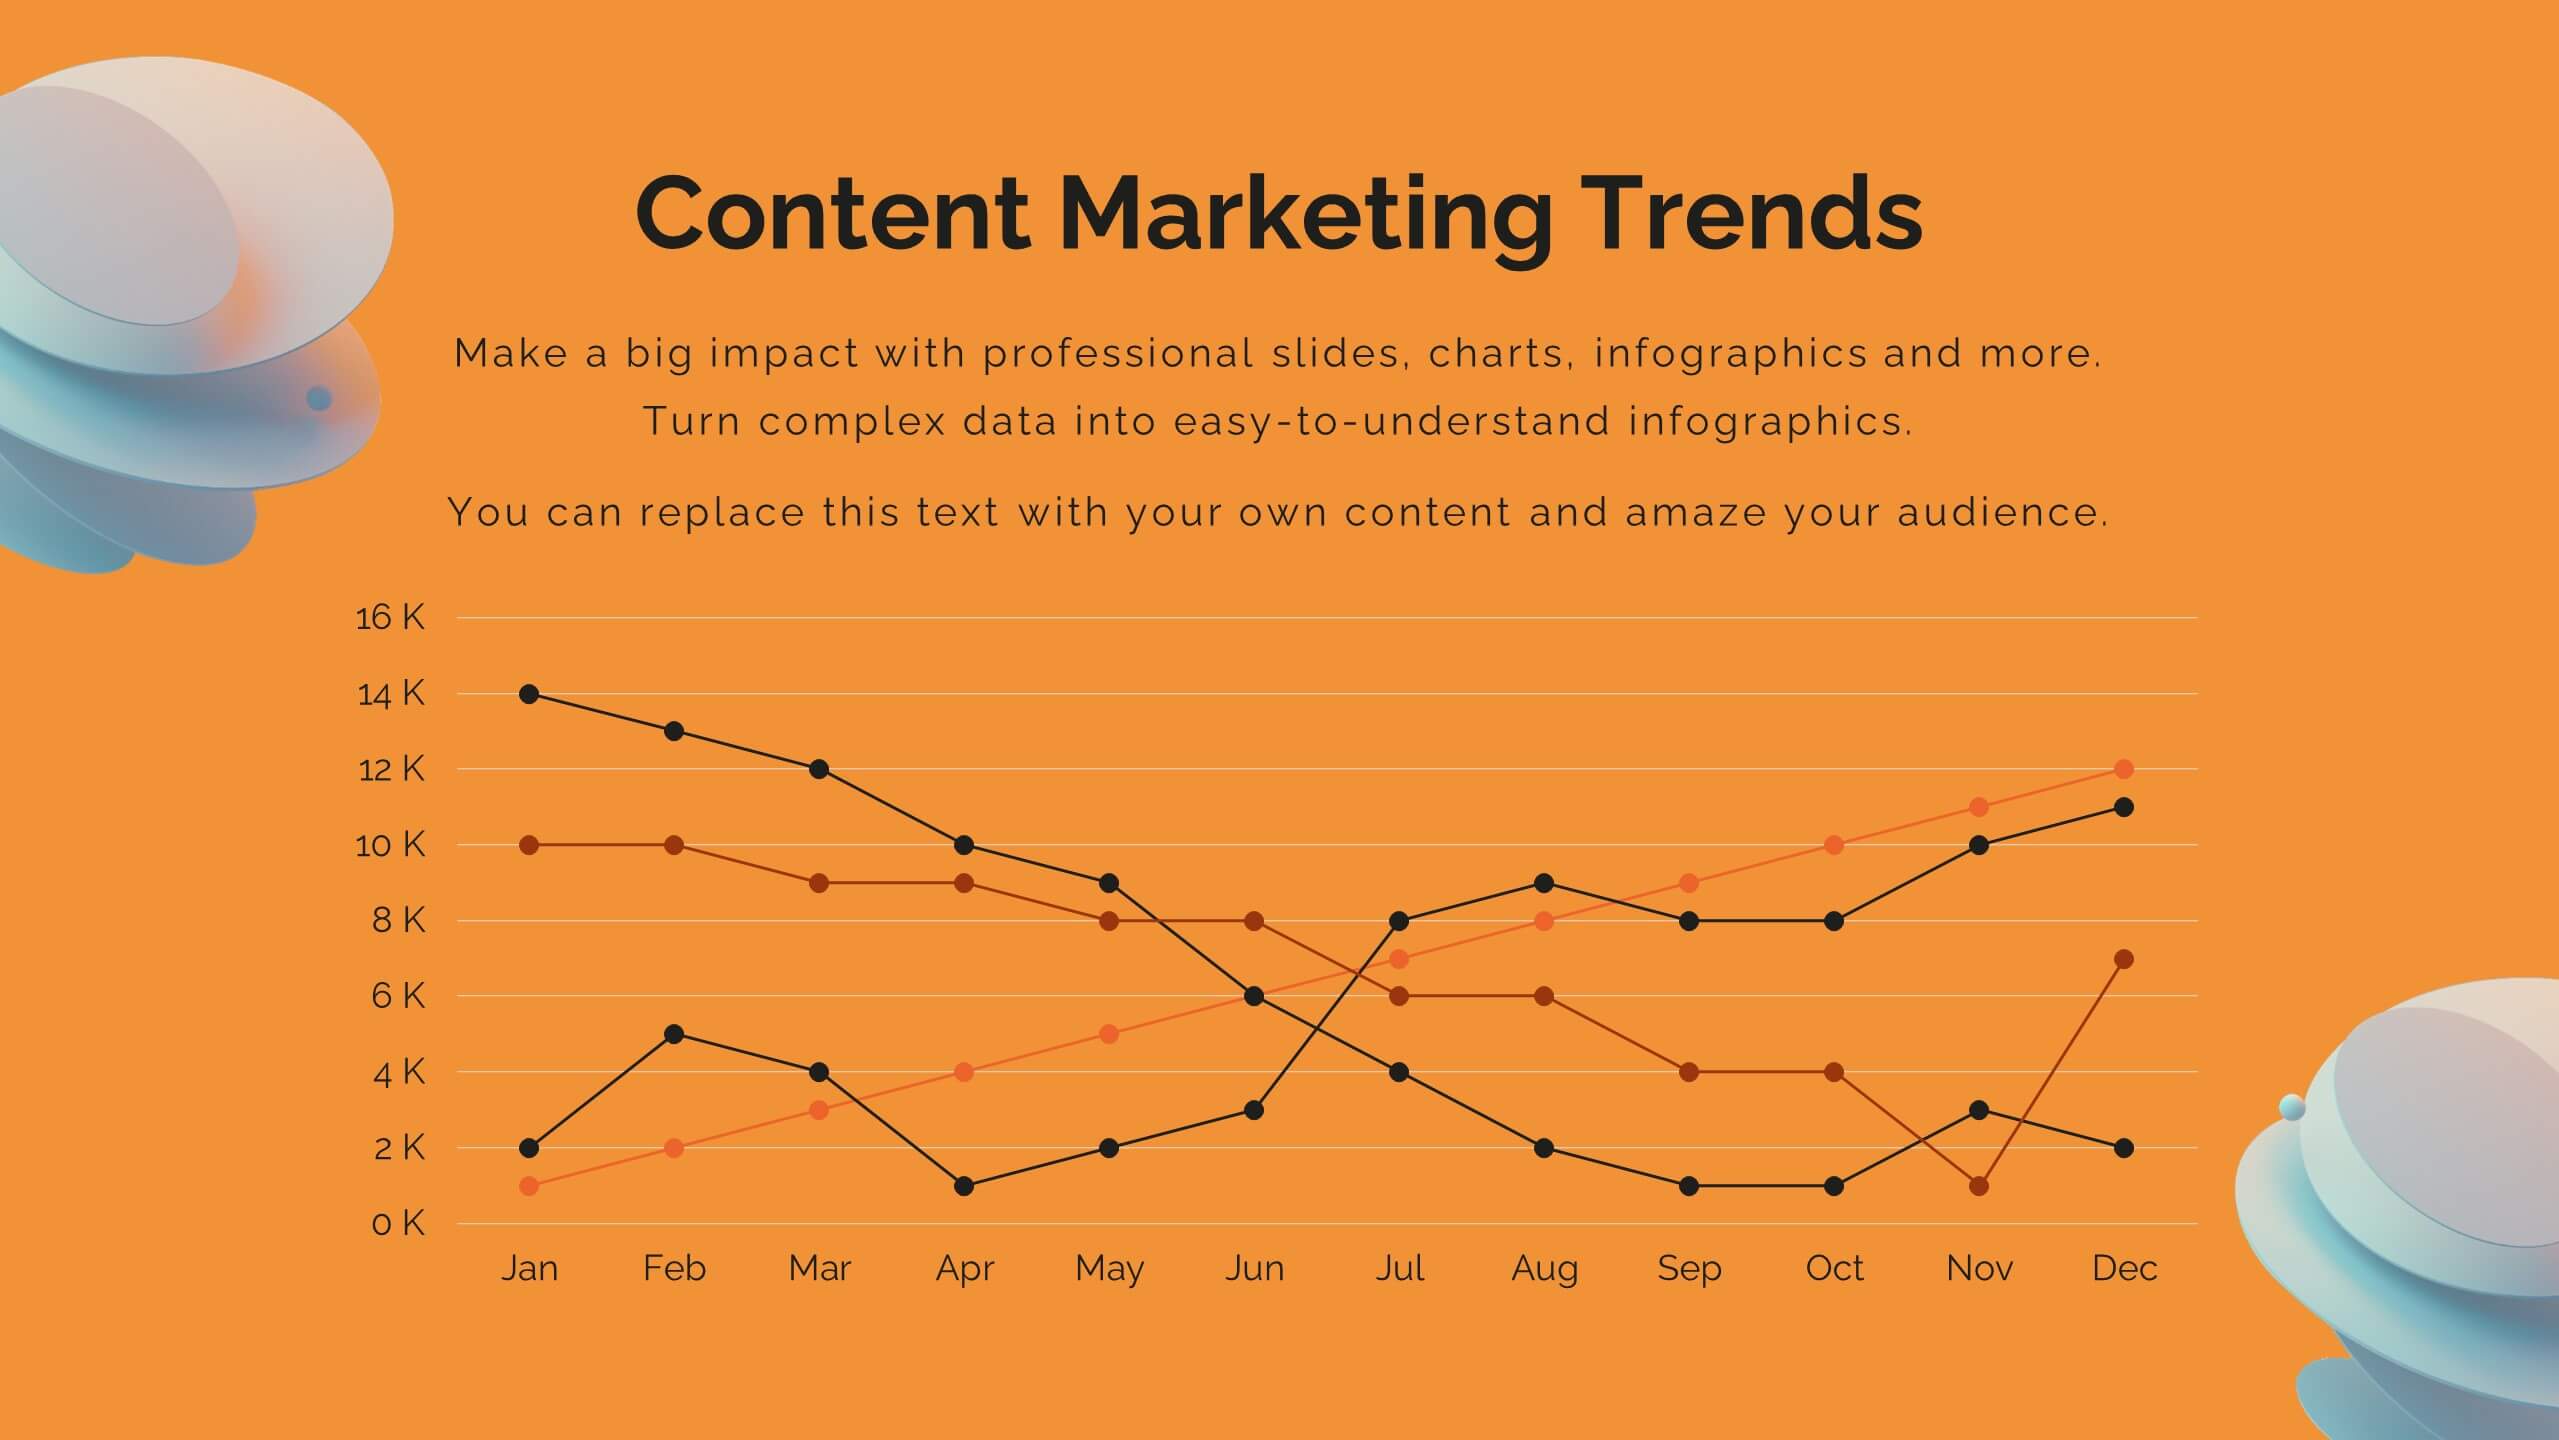
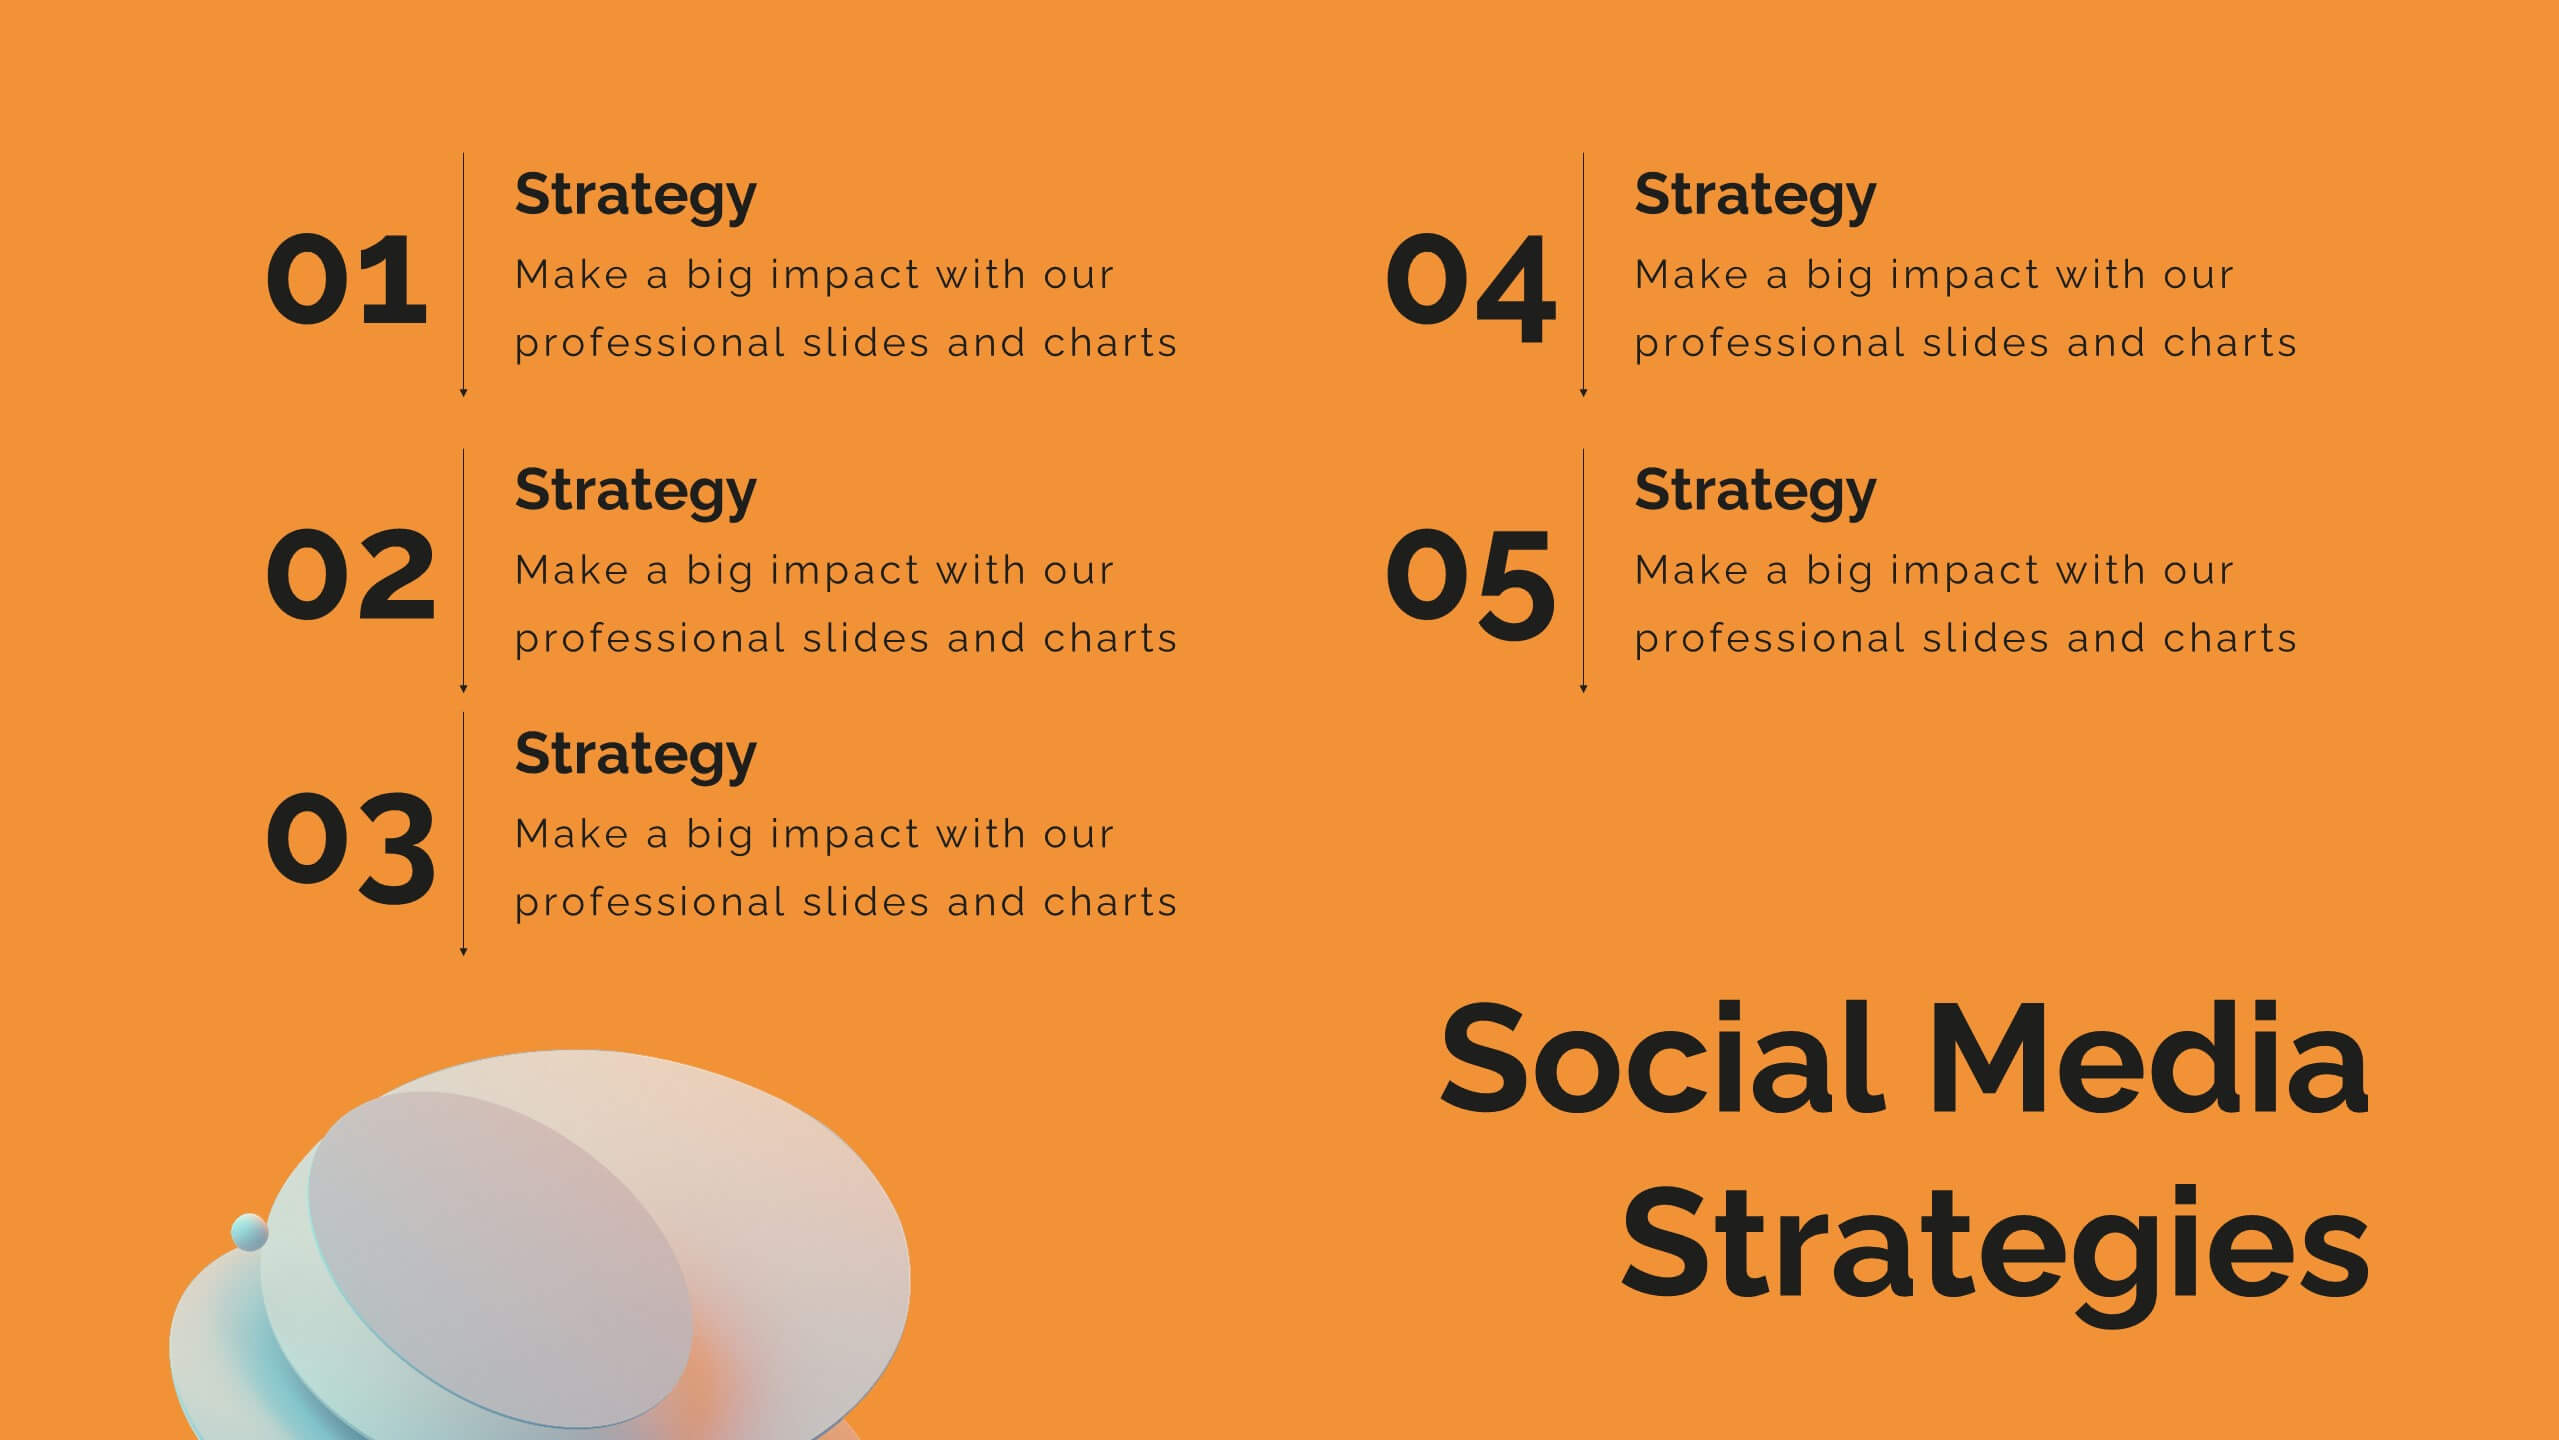
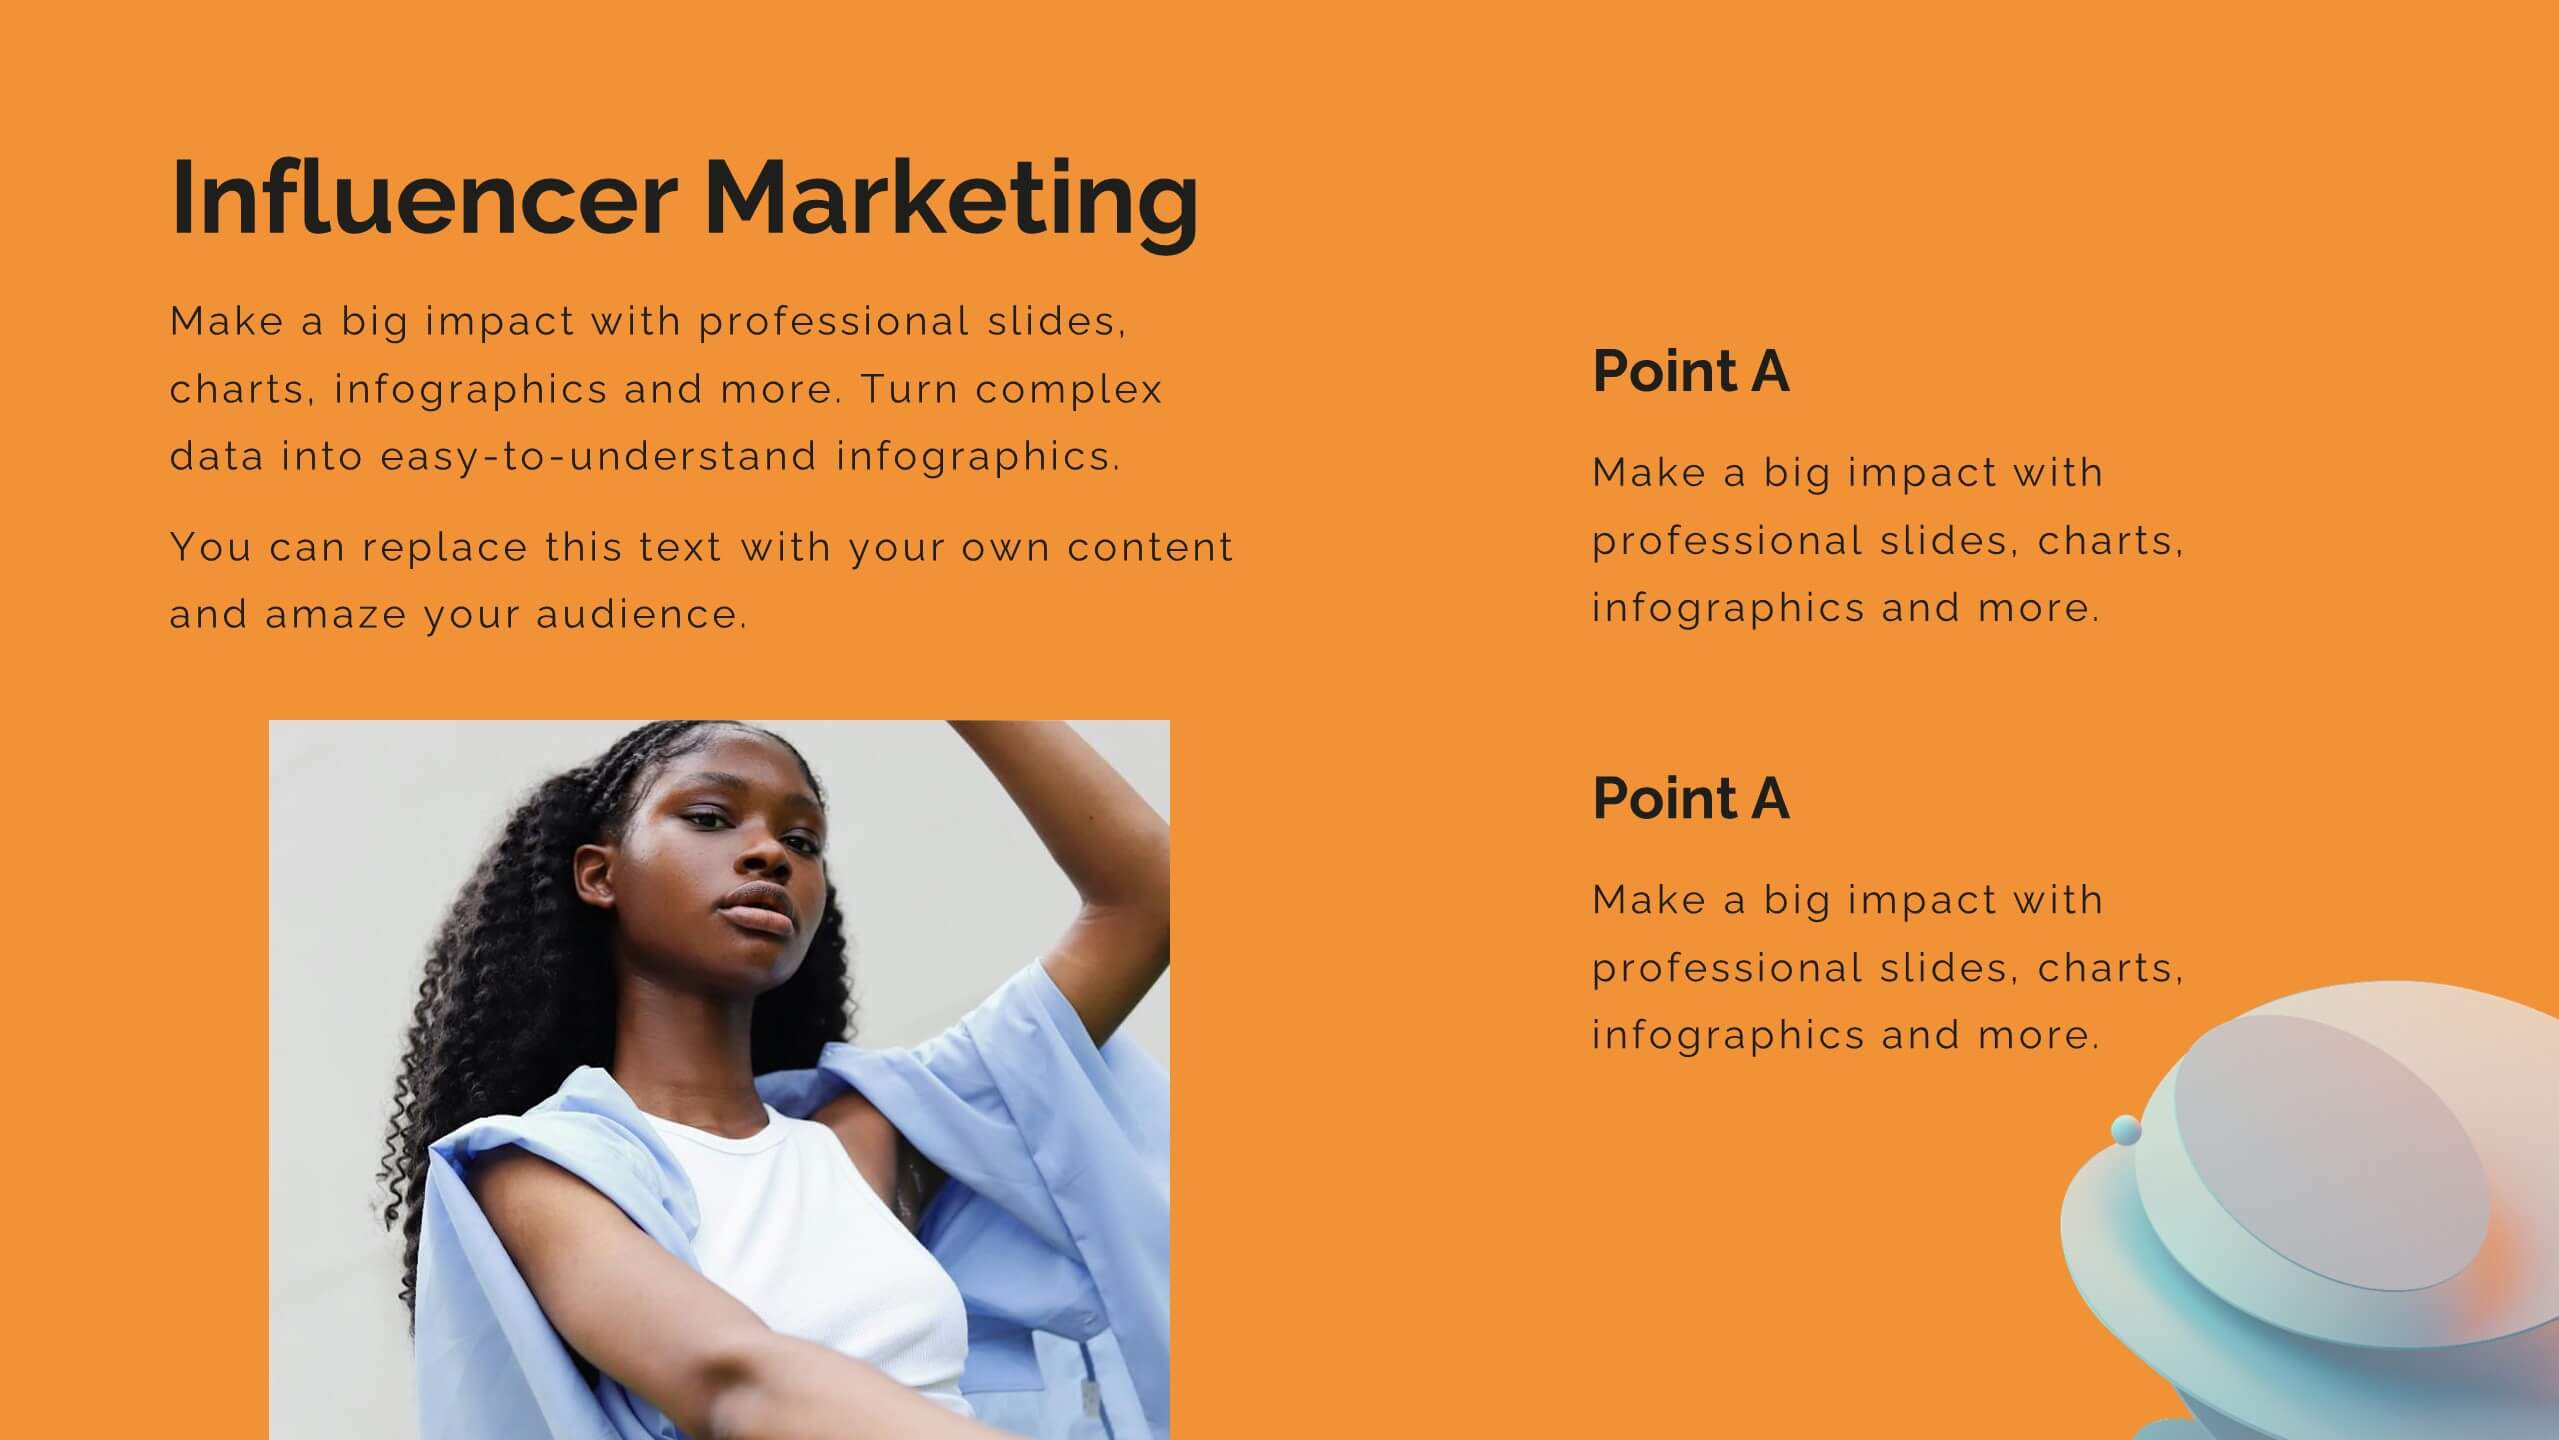
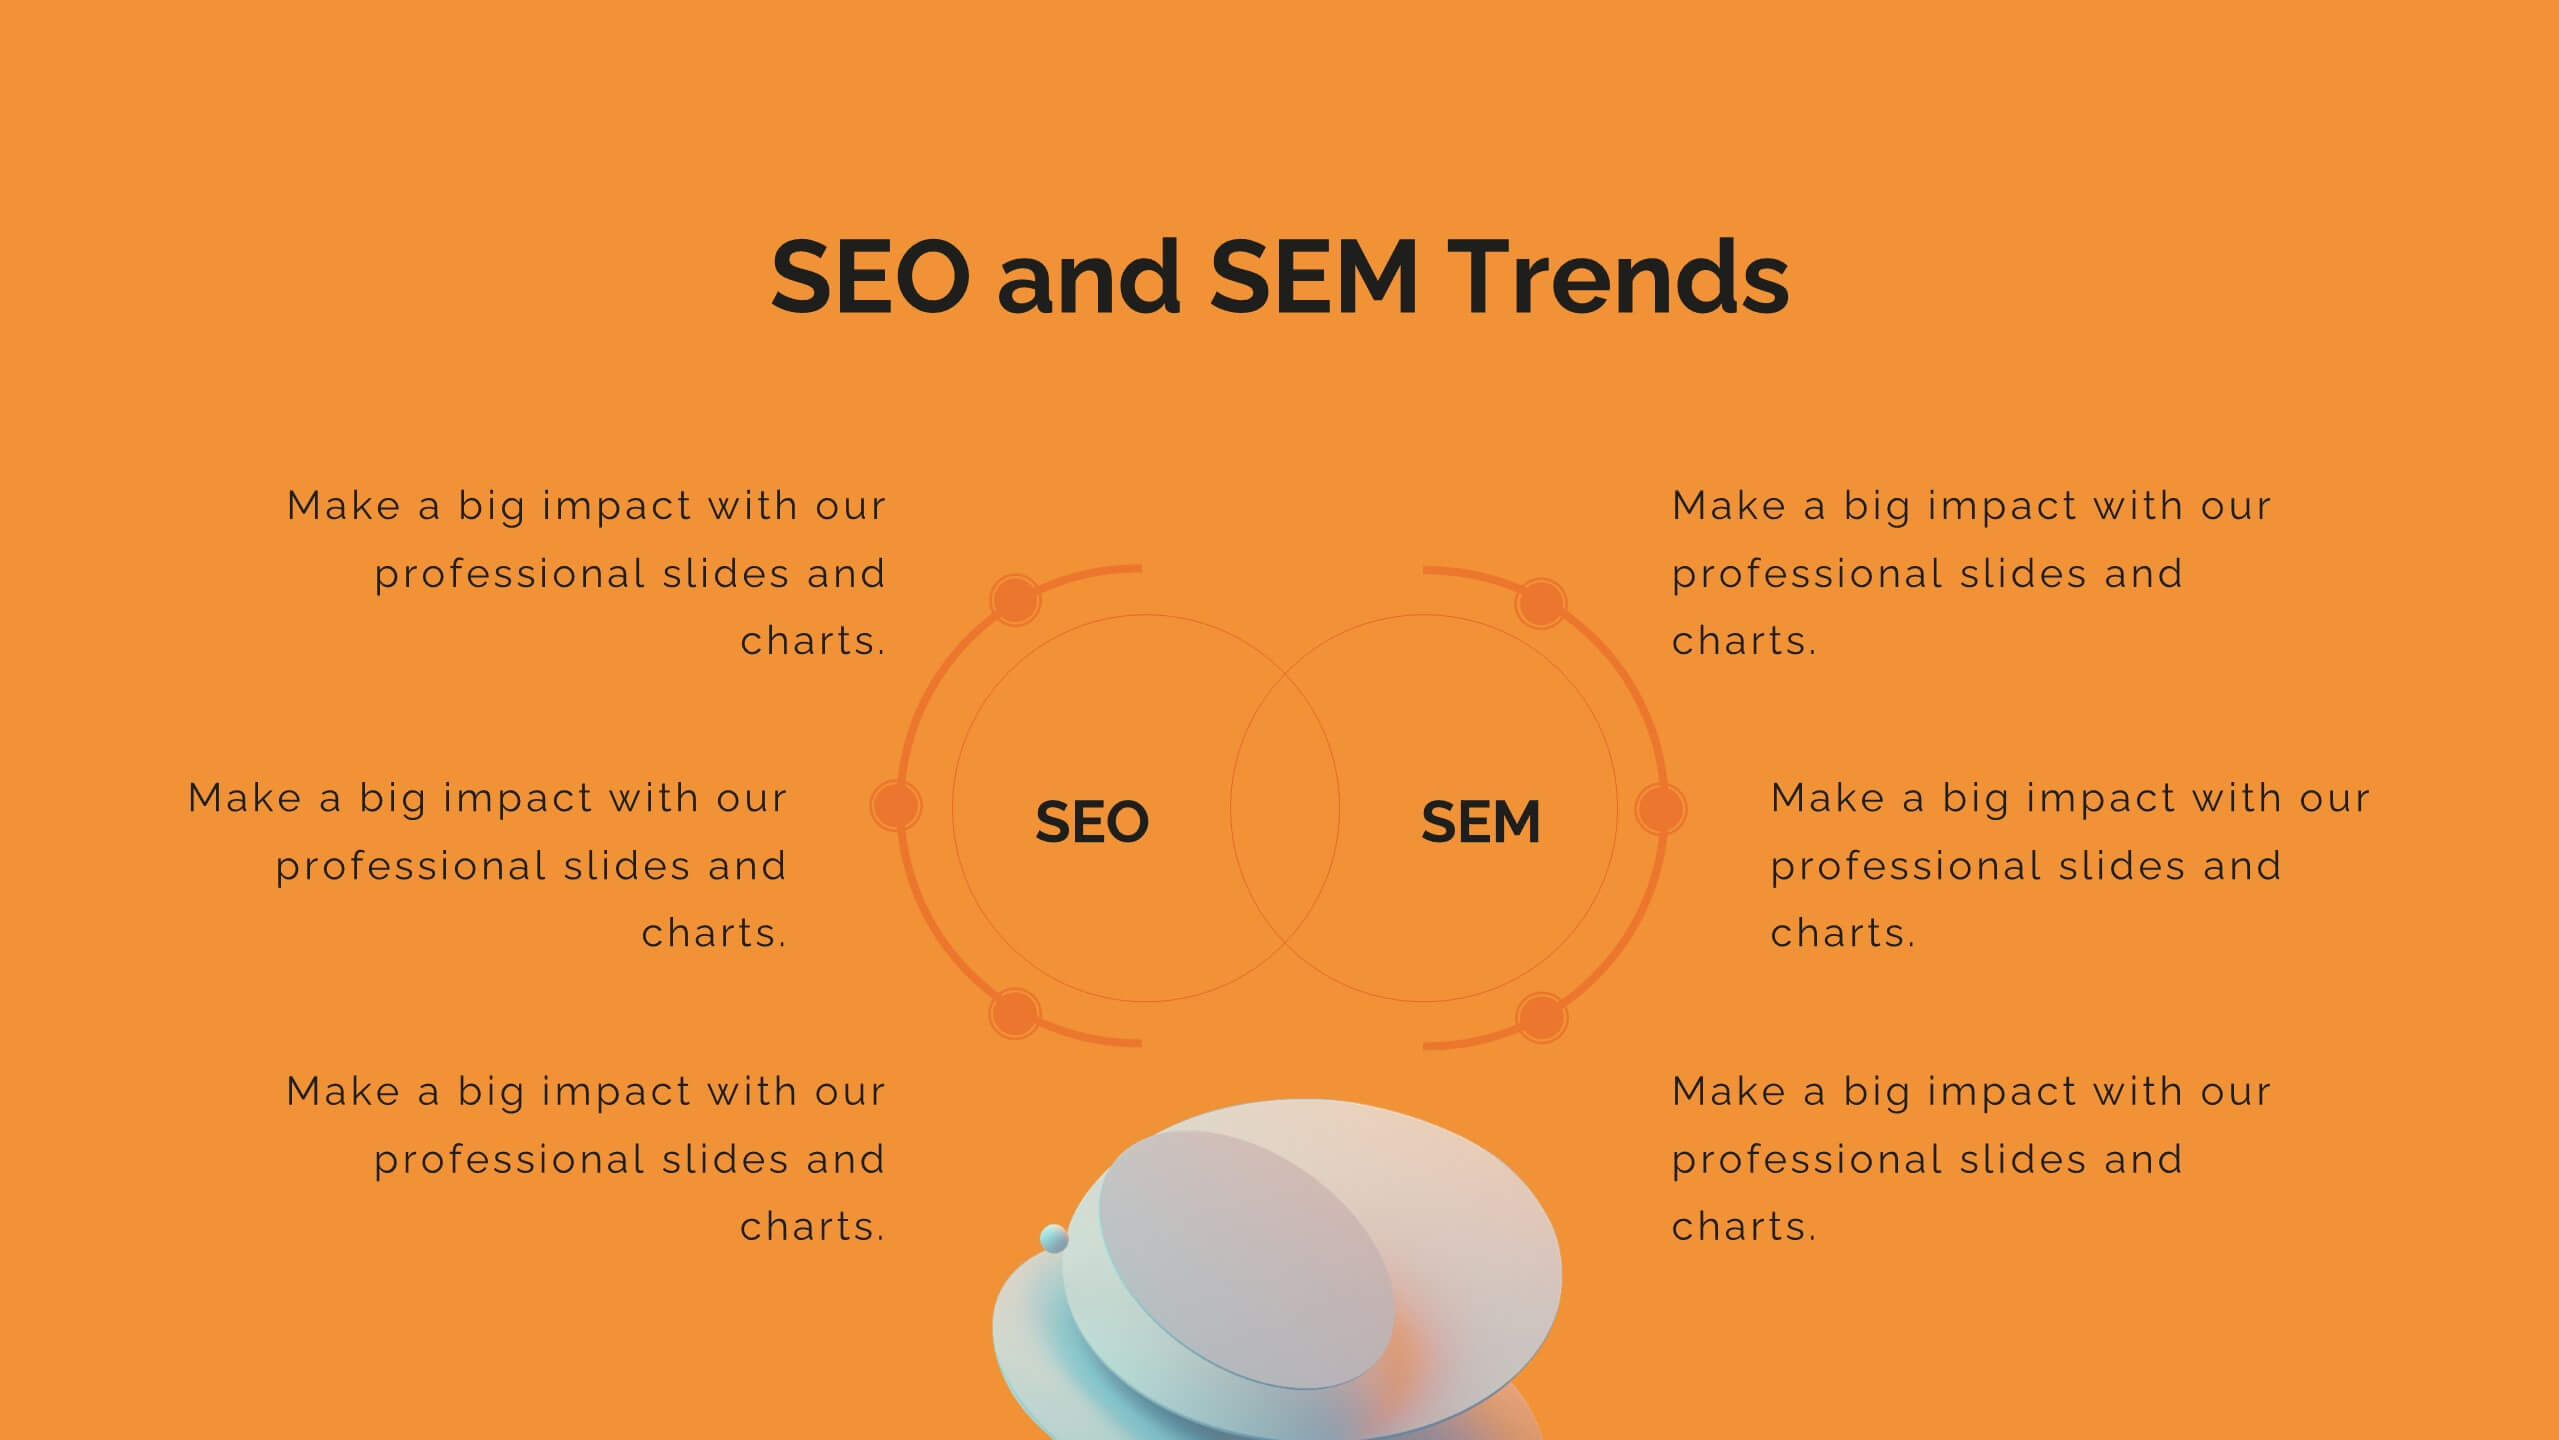
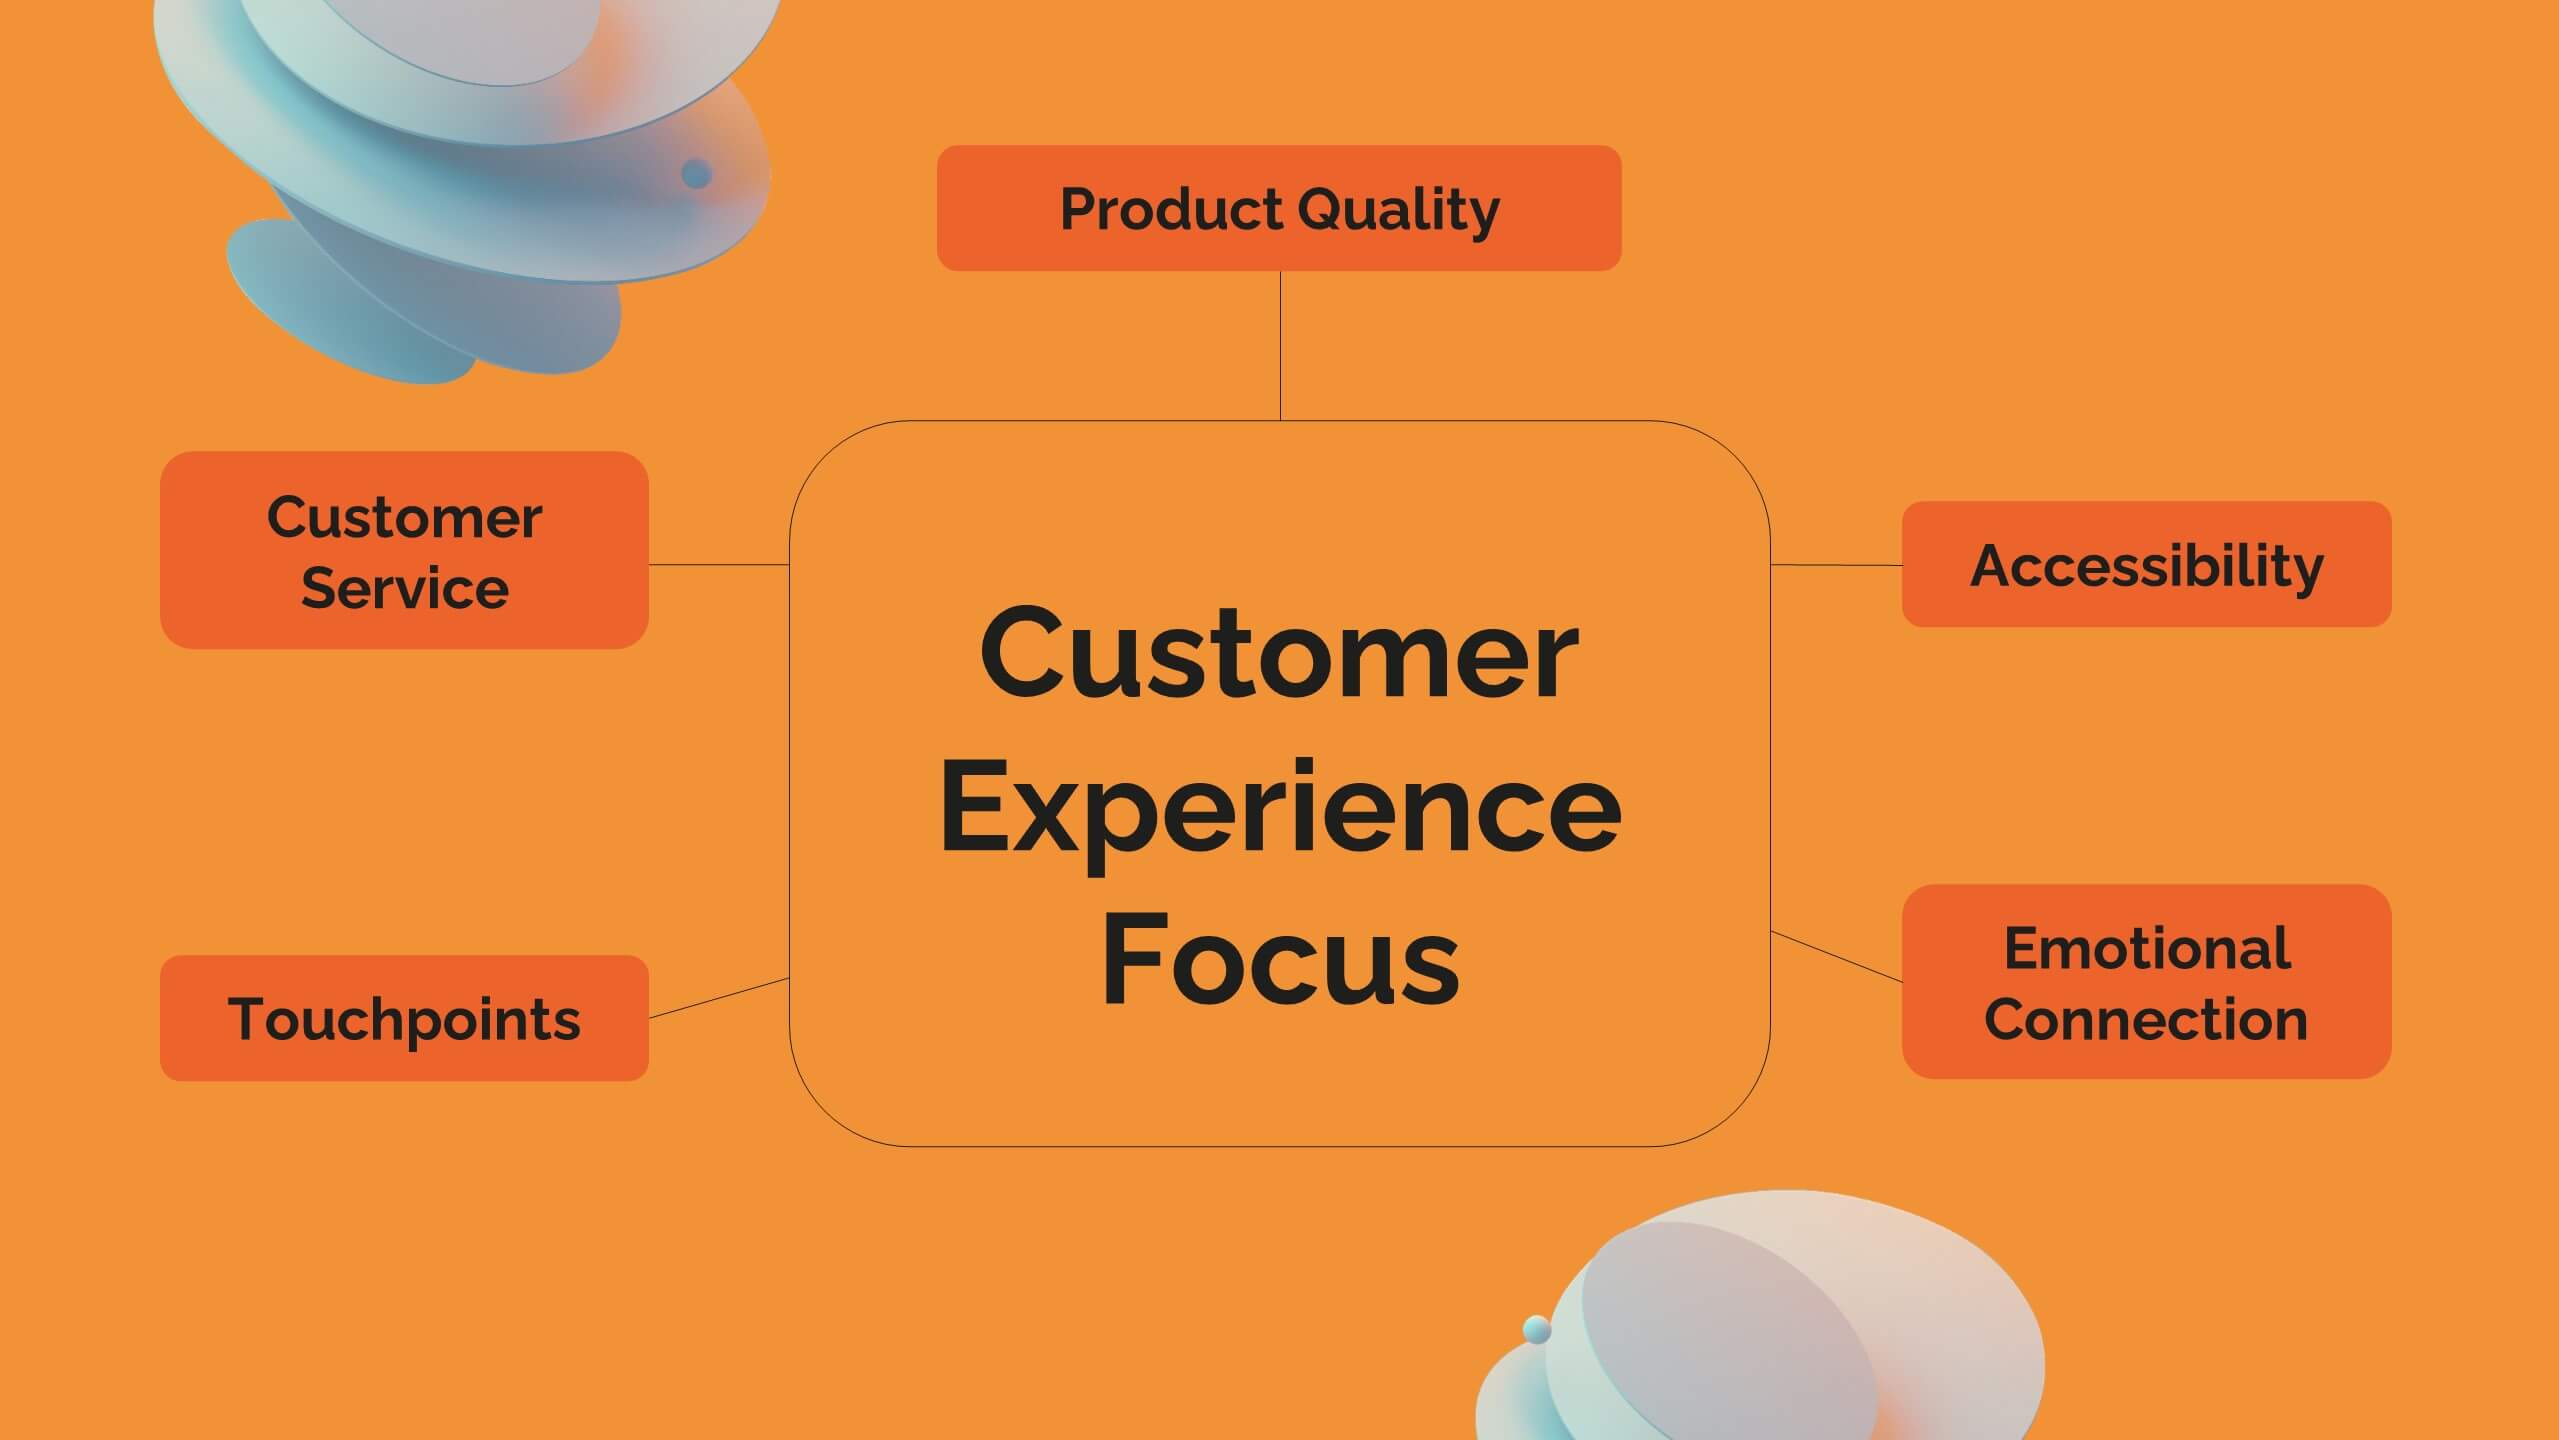
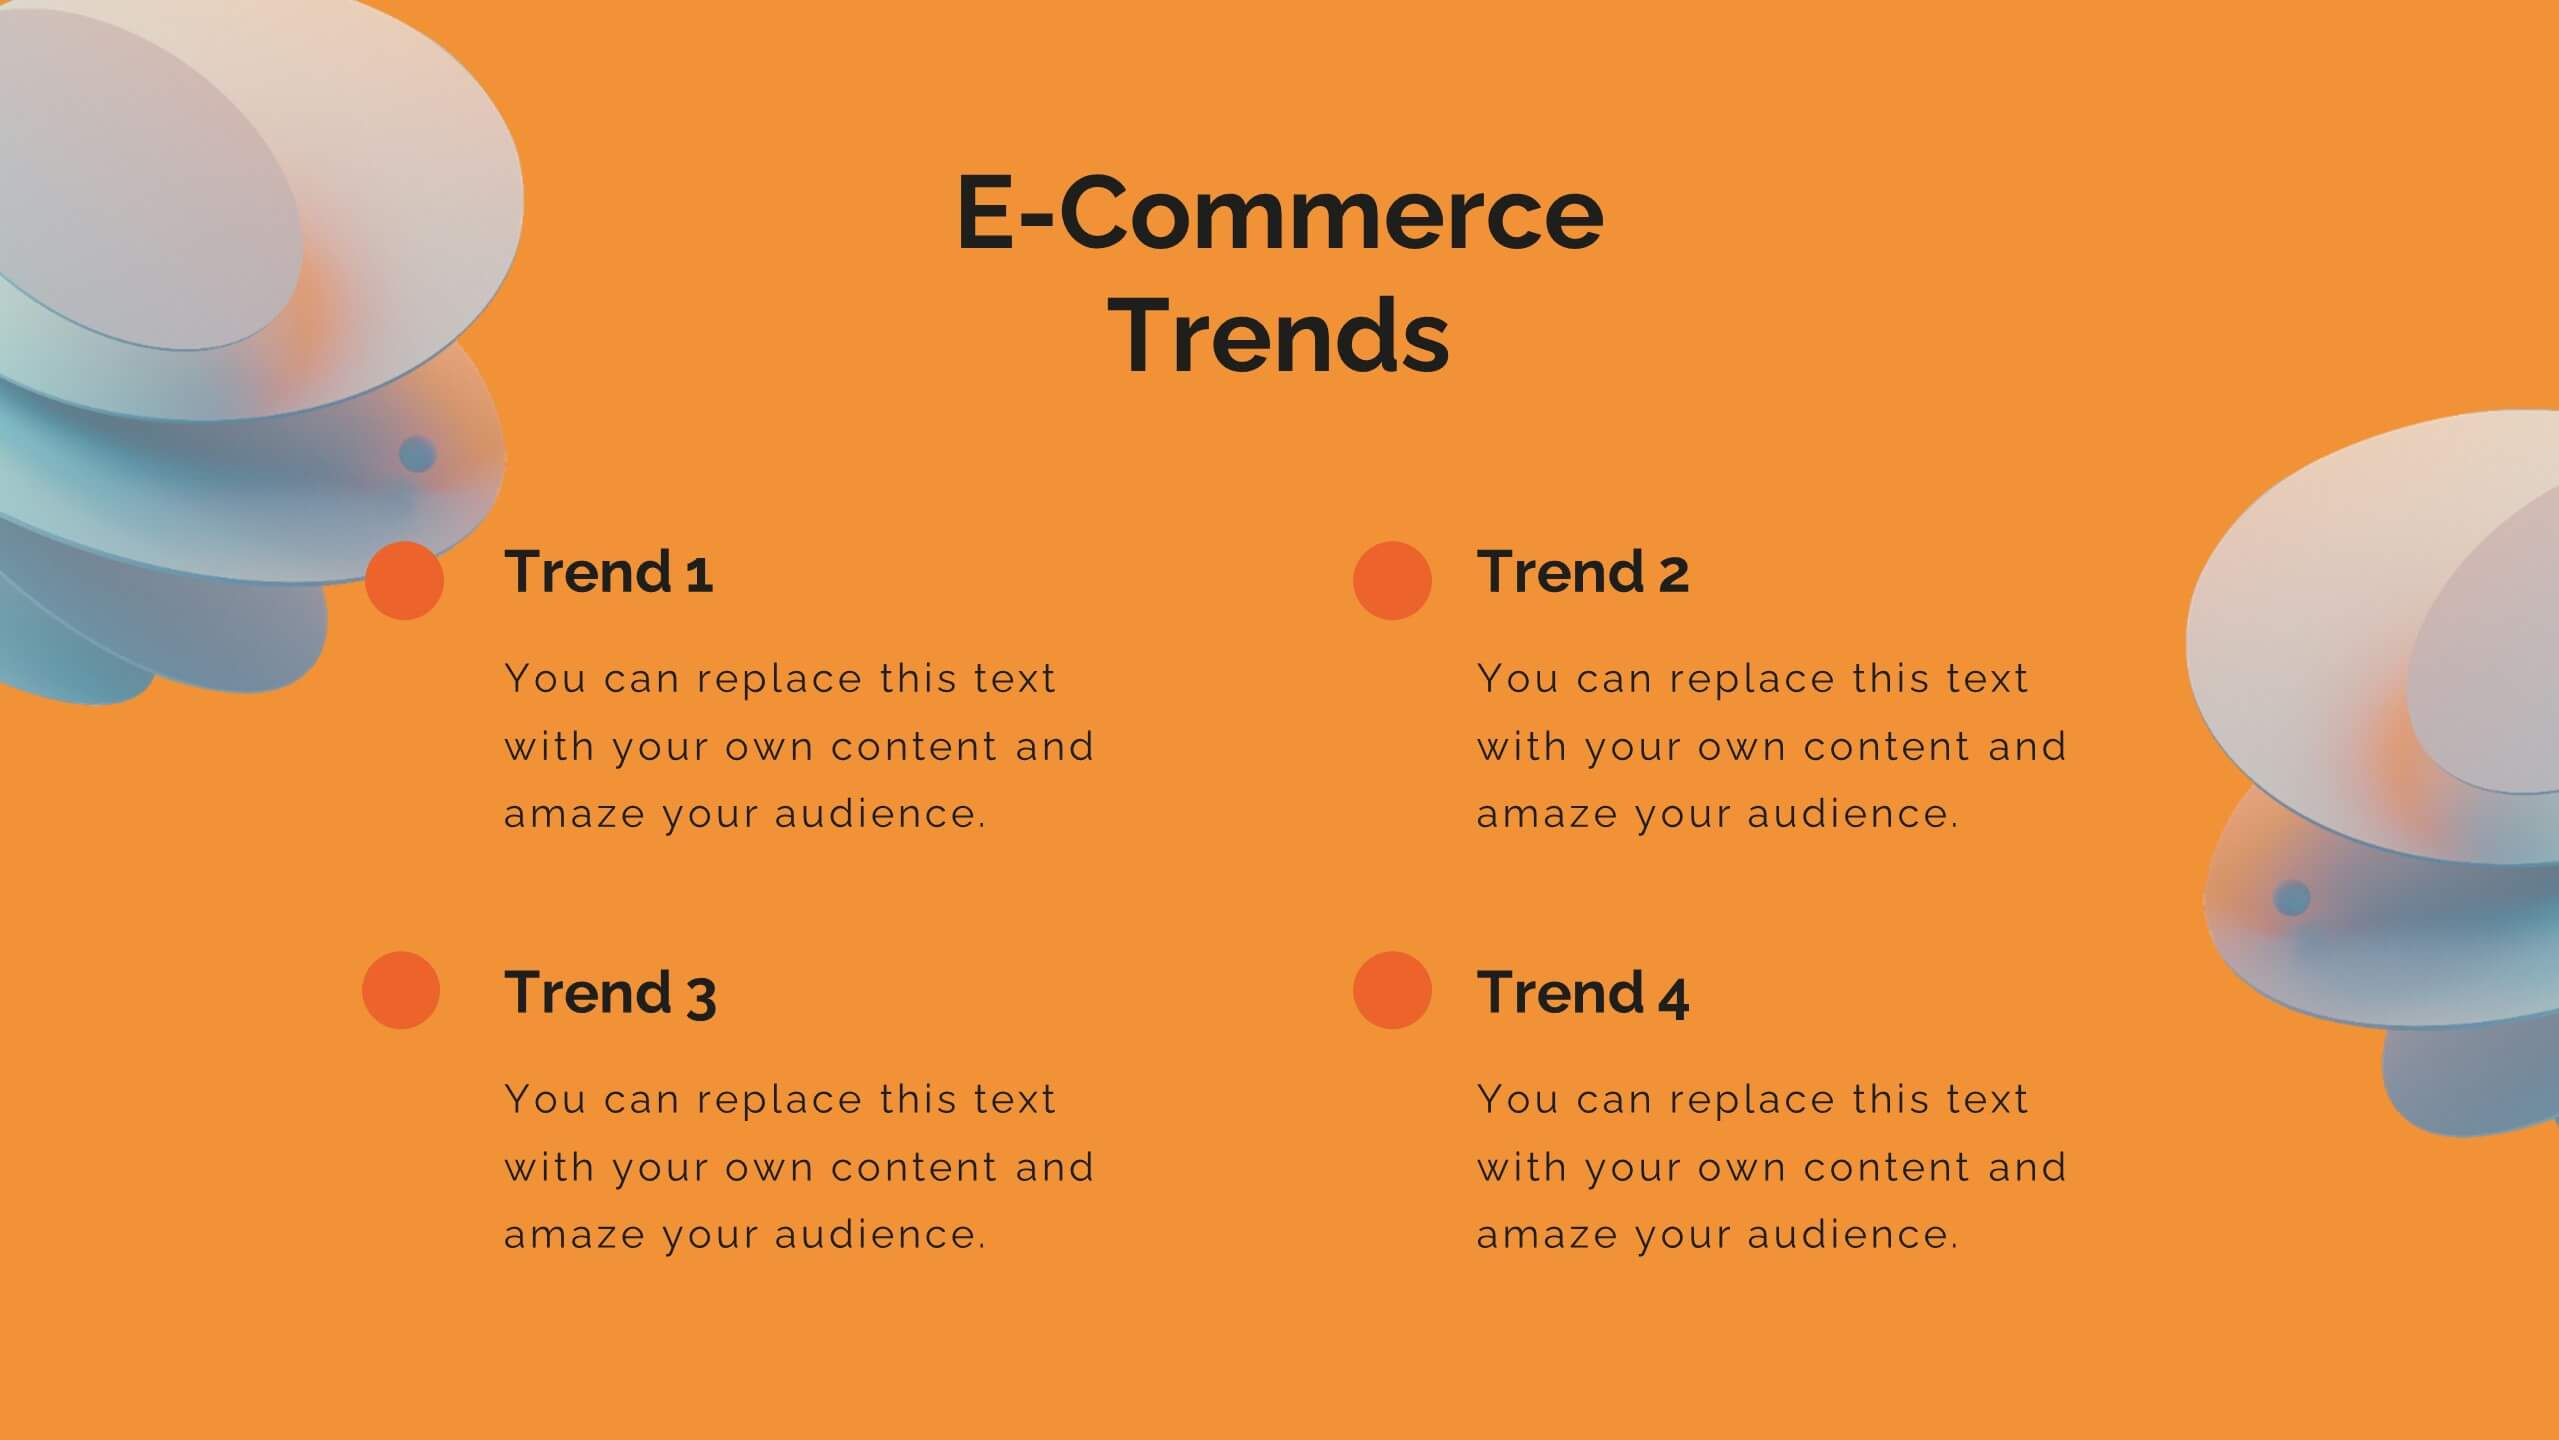
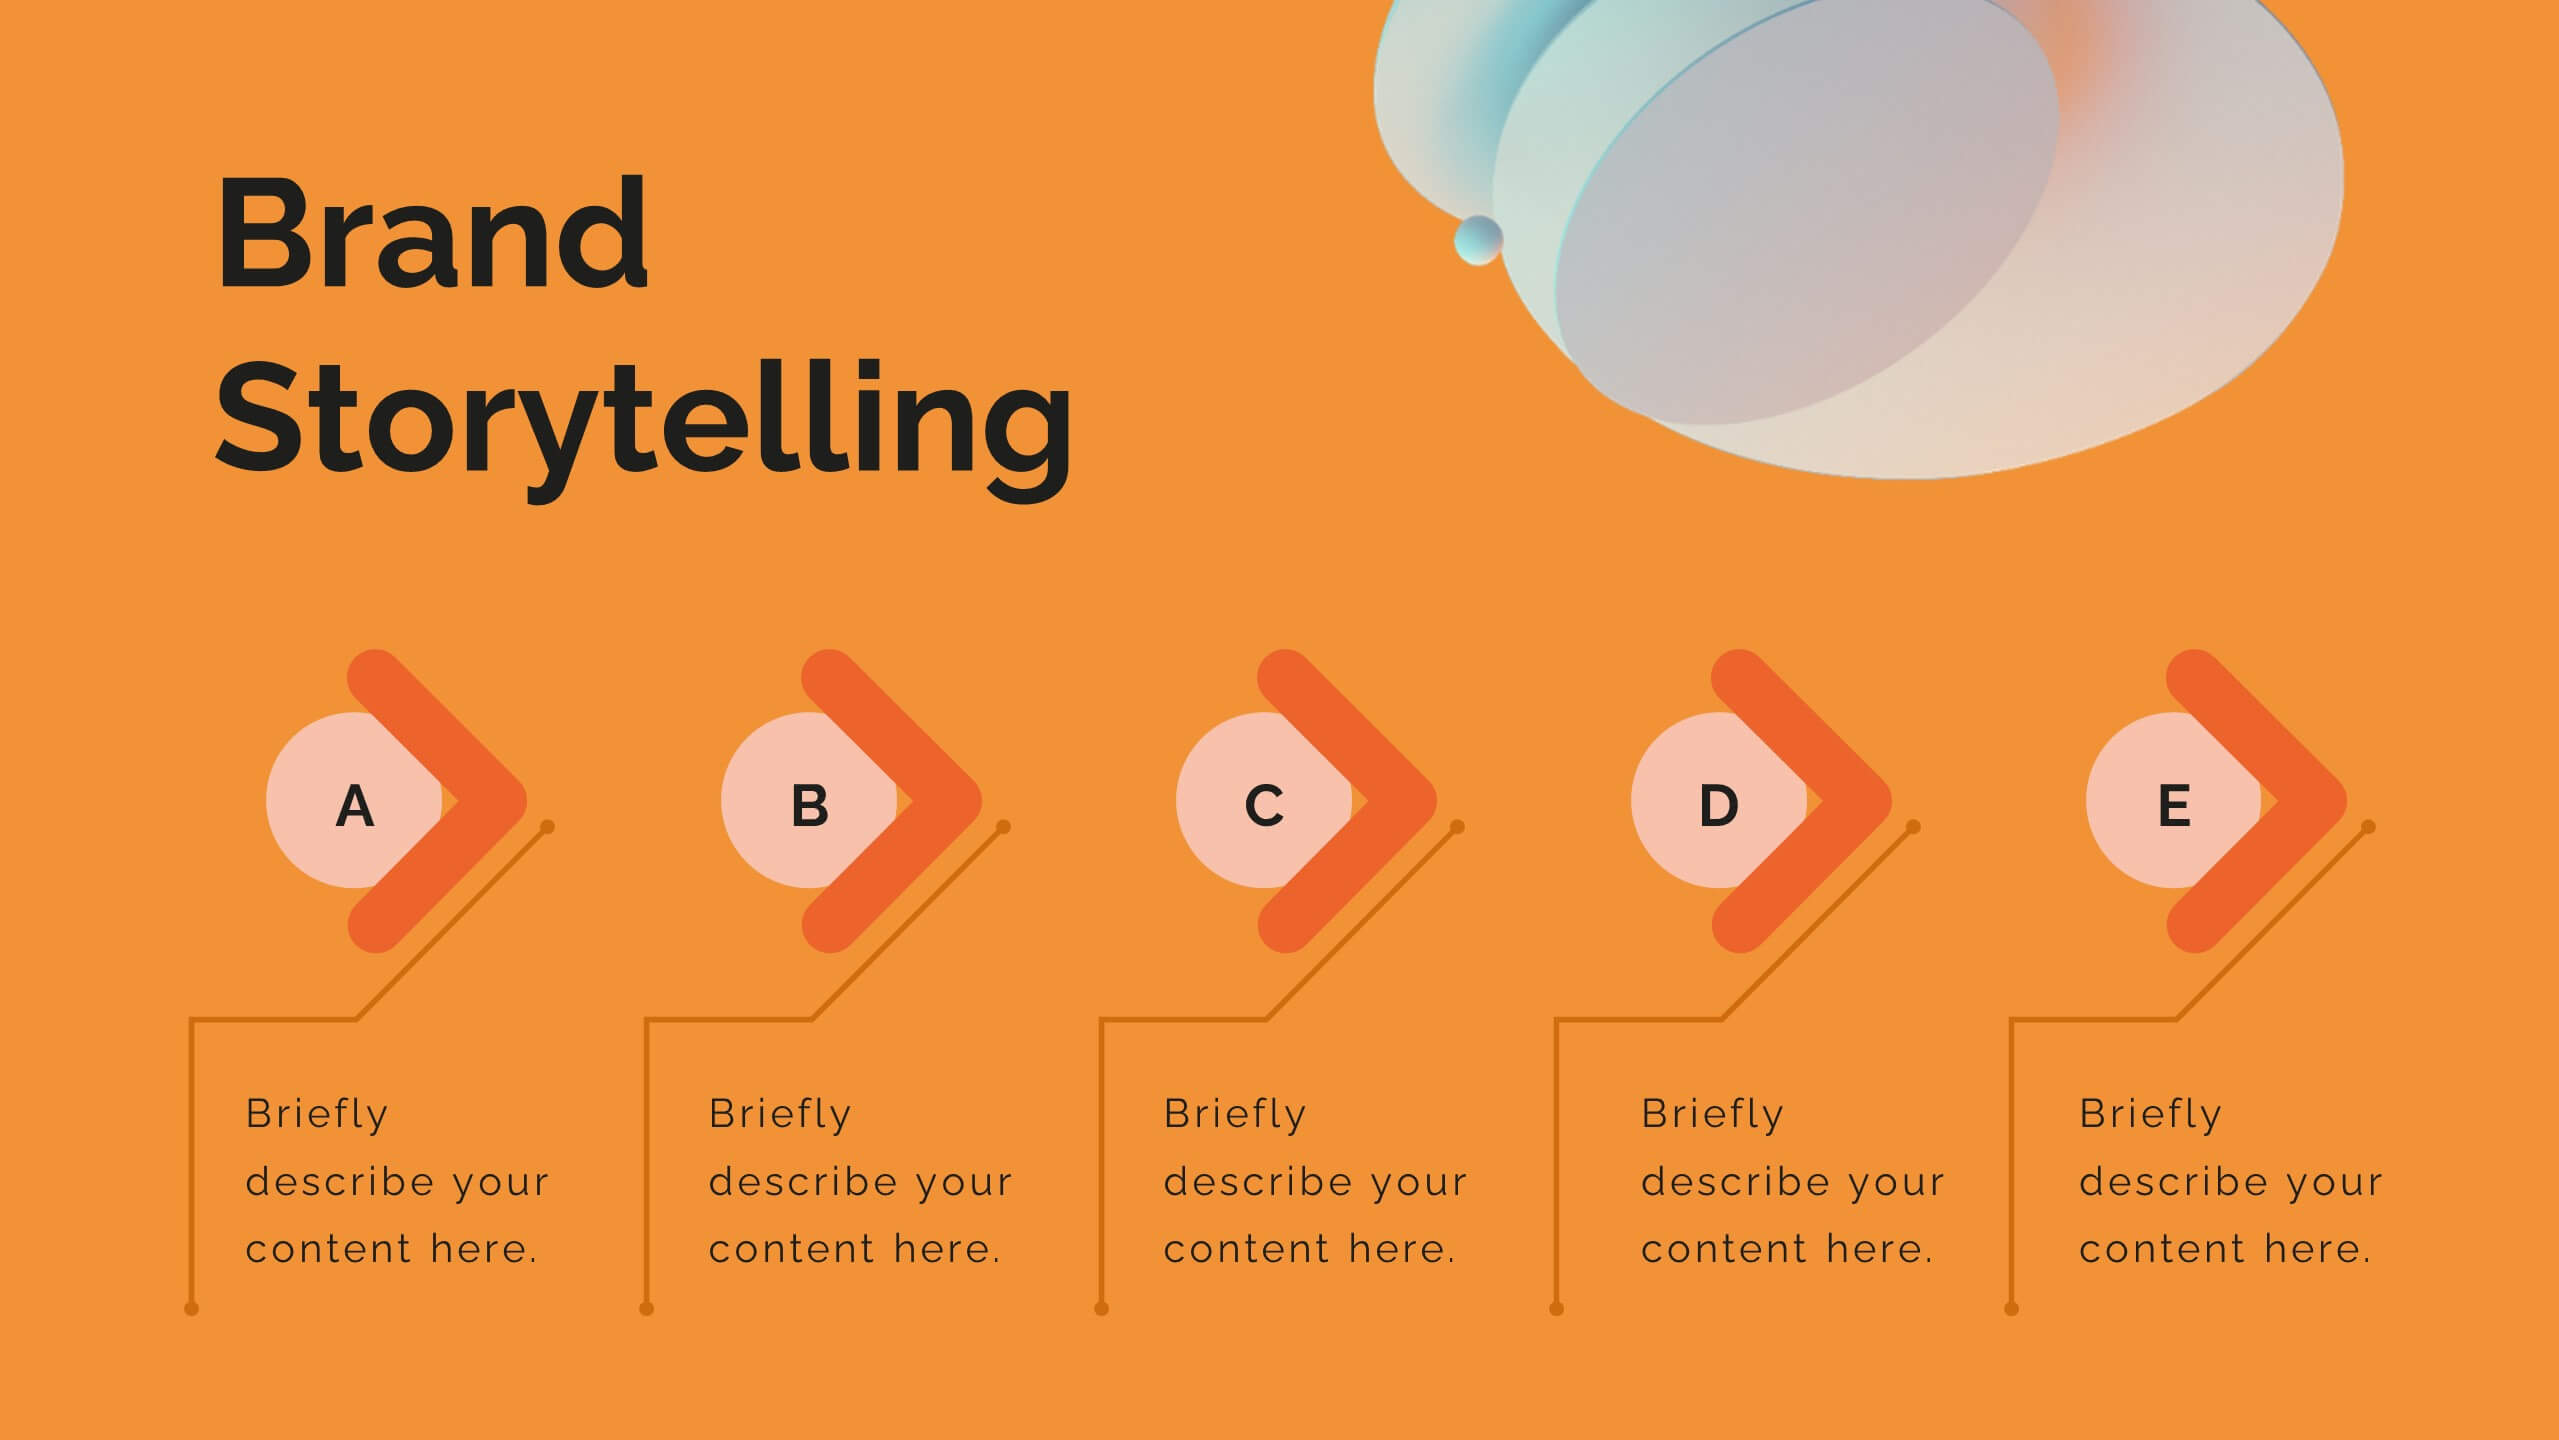
Breeze Content Marketing Pitch Deck Presentation
Elevate your content marketing strategy with this vibrant pitch deck! Perfect for outlining industry trends, consumer behavior, and innovative techniques. Ideal for marketers aiming to impress clients and stakeholders. Compatible with PowerPoint, Keynote, and Google Slides, this template ensures your pitch is engaging, persuasive, and professional. Achieve marketing success today!


4 diapositivas
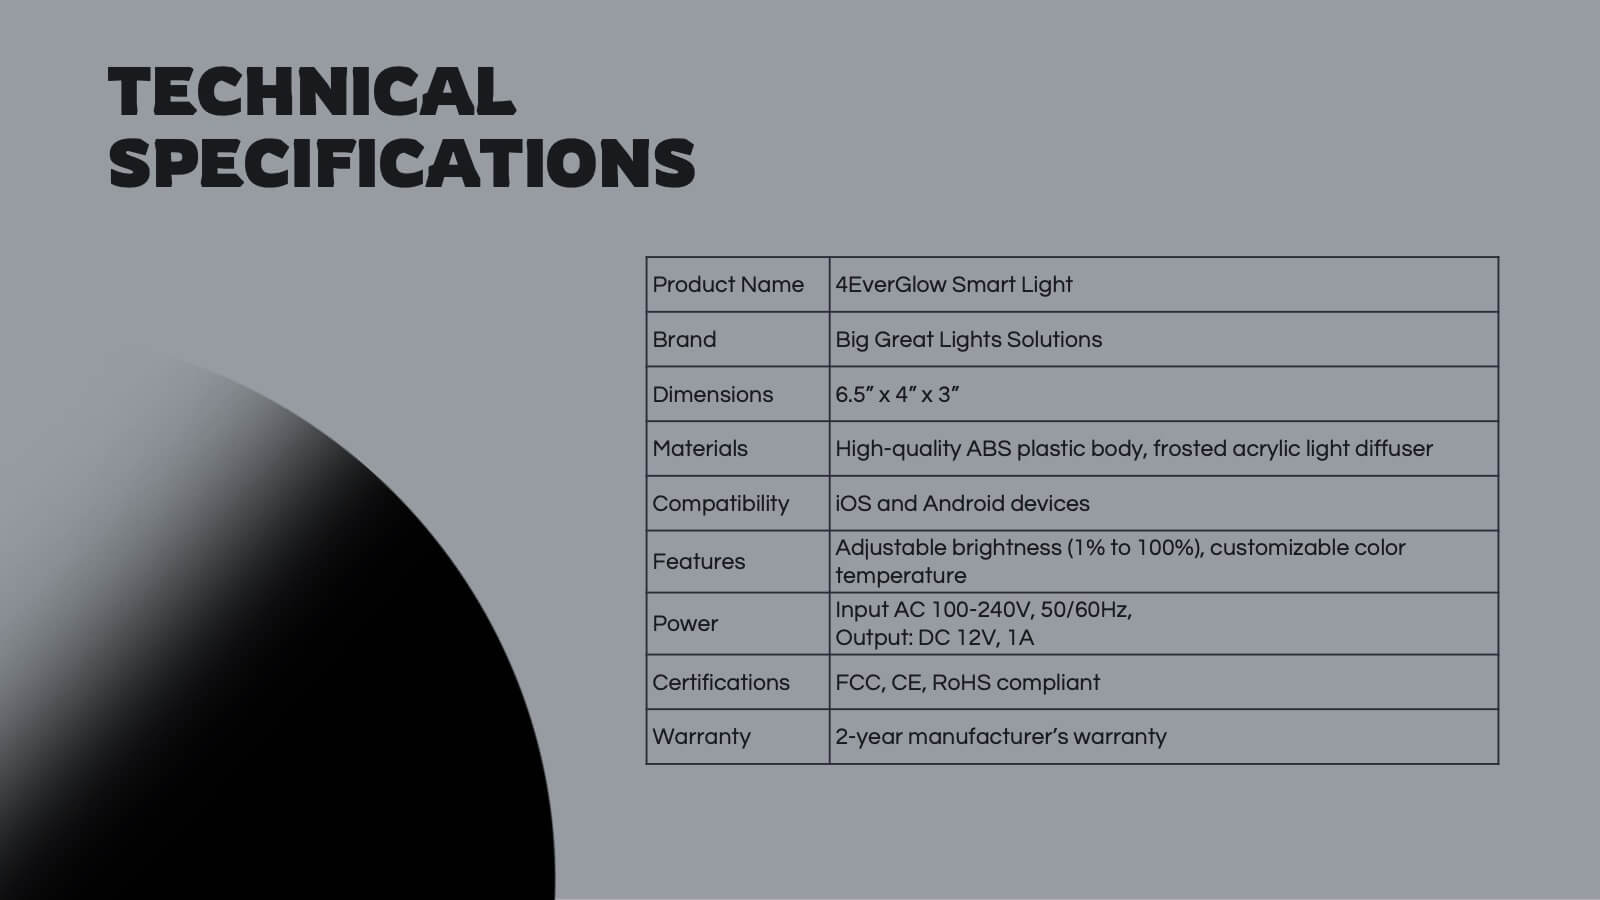
Data Table Infographic Presentation
Organize complex information clearly with the Data Table Infographic Presentation. This slide design features a structured table layout paired with icon-labeled column headers for visual clarity. Ideal for presenting statistics, performance metrics, survey data, or structured comparisons. Highlighted headers draw attention to key sections, making your data easy to digest. Fully editable in PowerPoint, Keynote, and Google Slides.


7 diapositivas
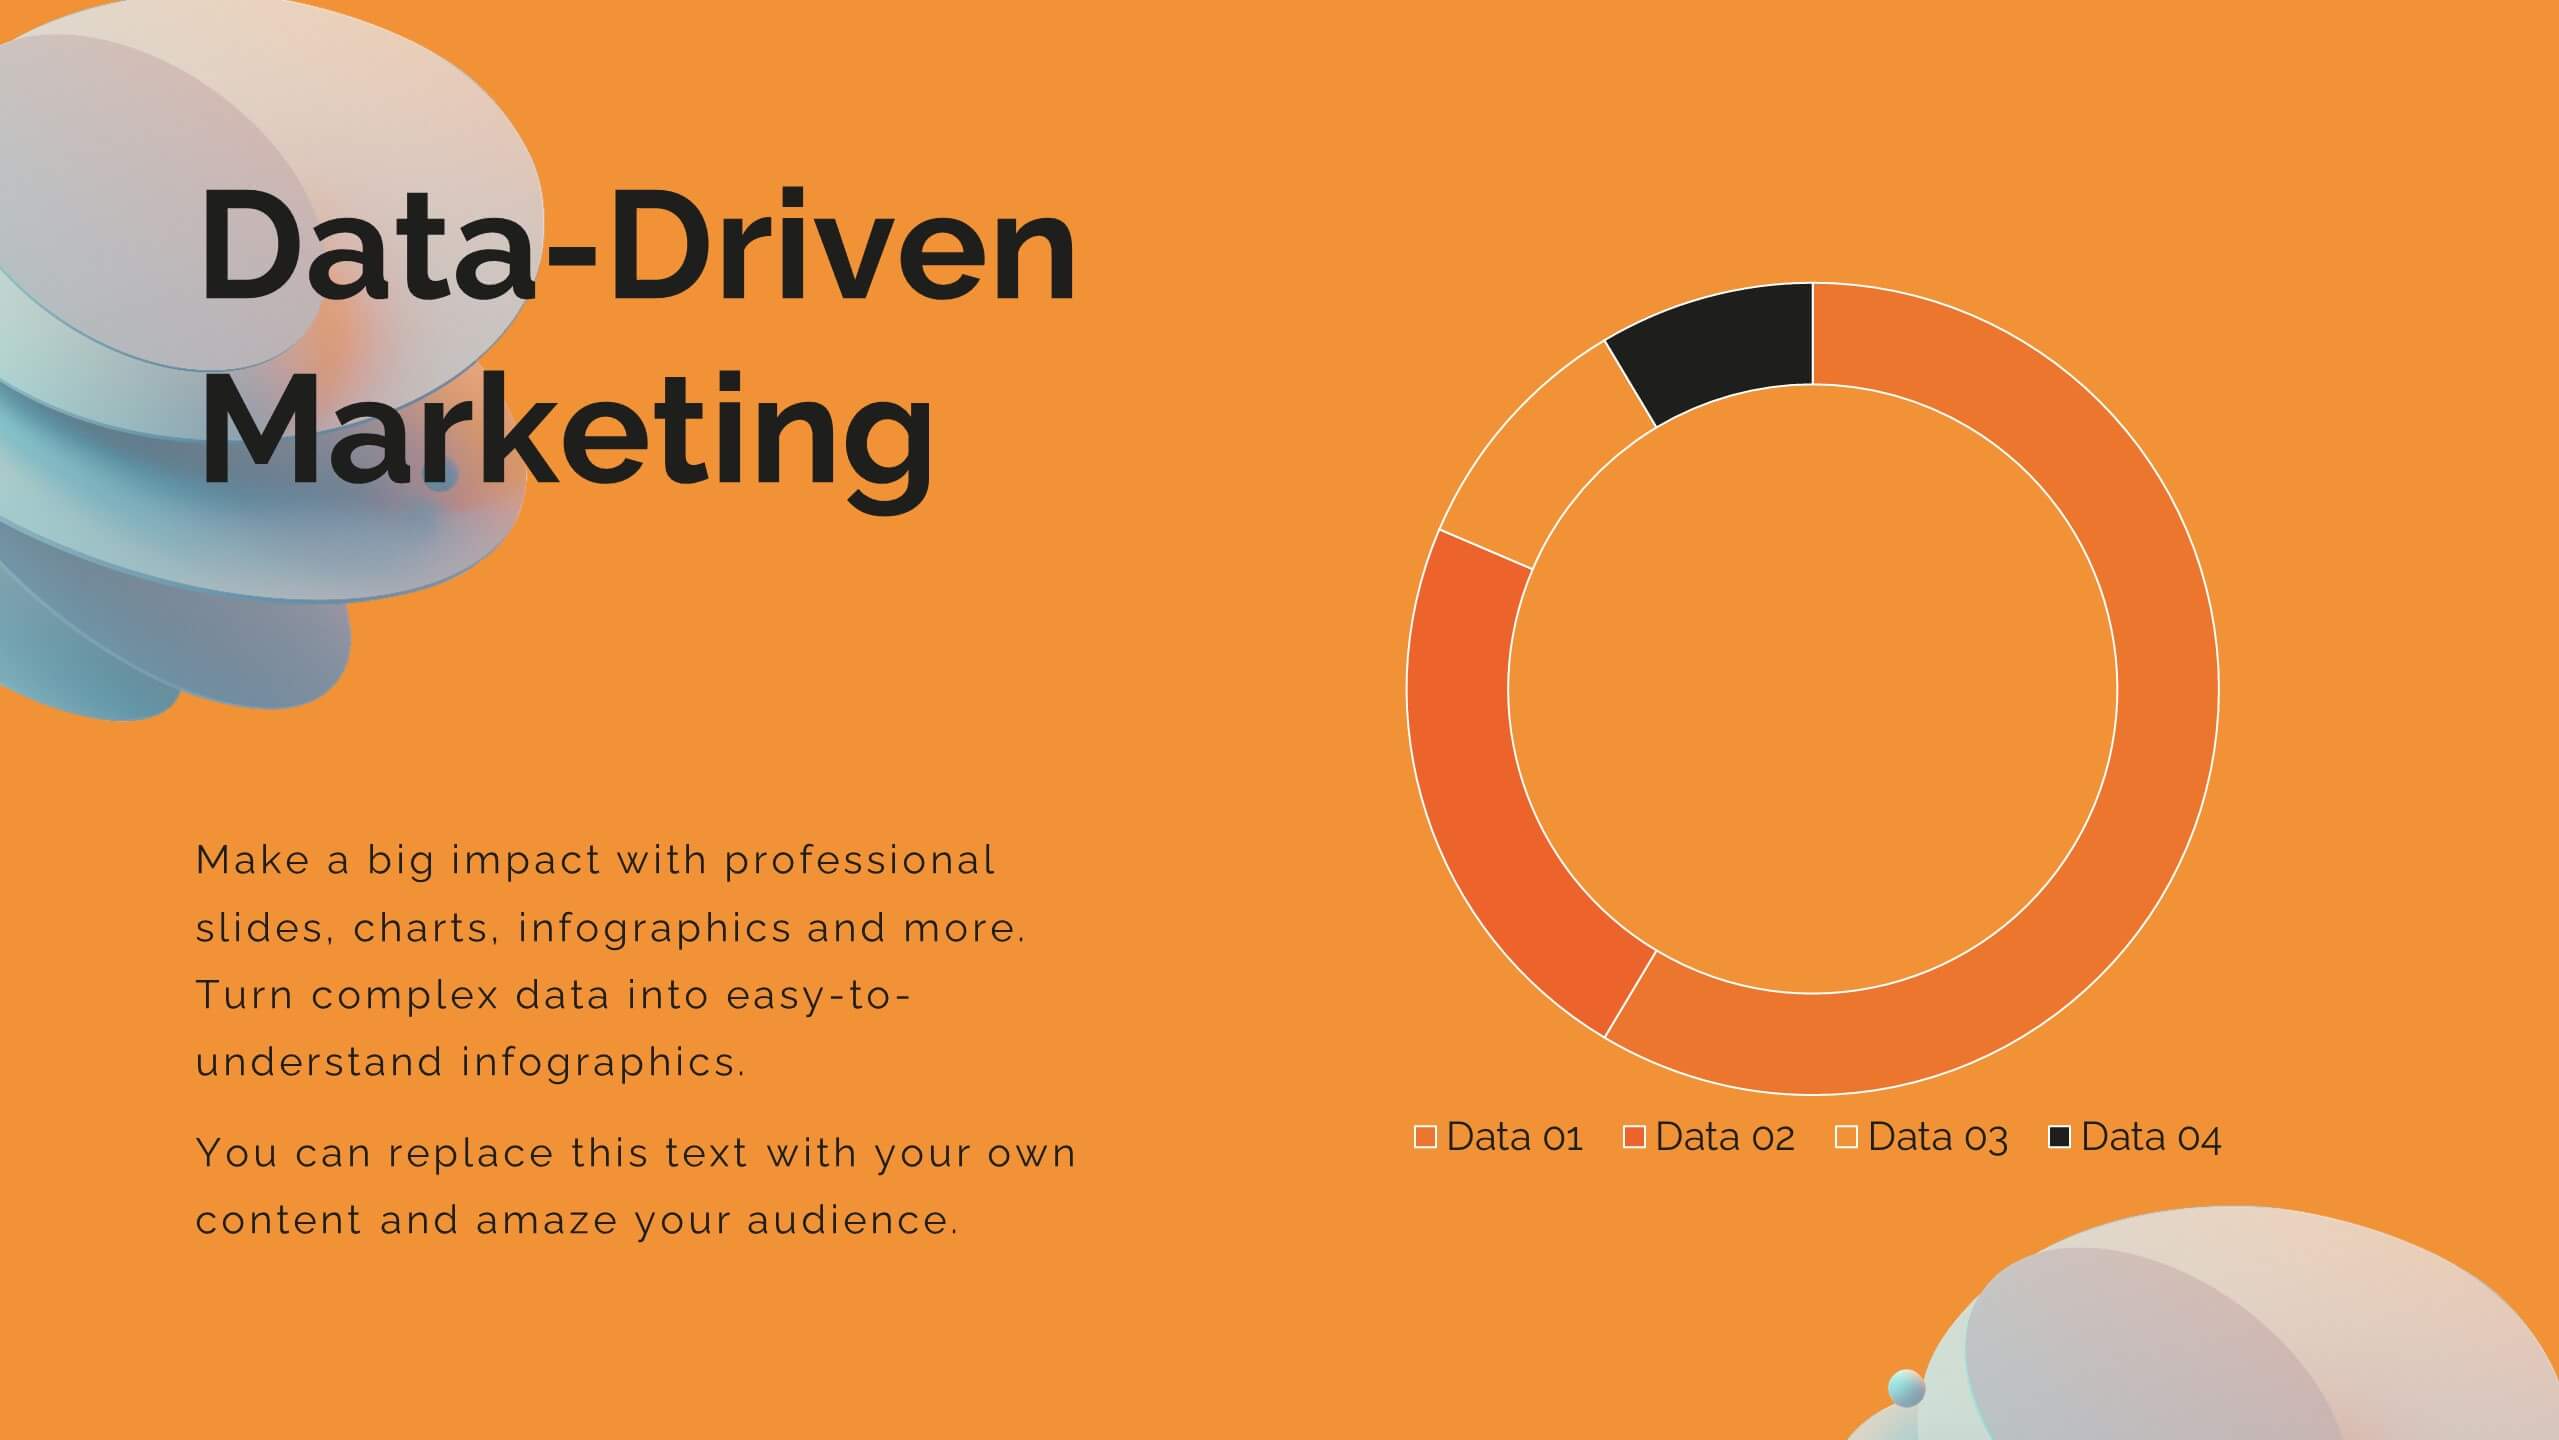
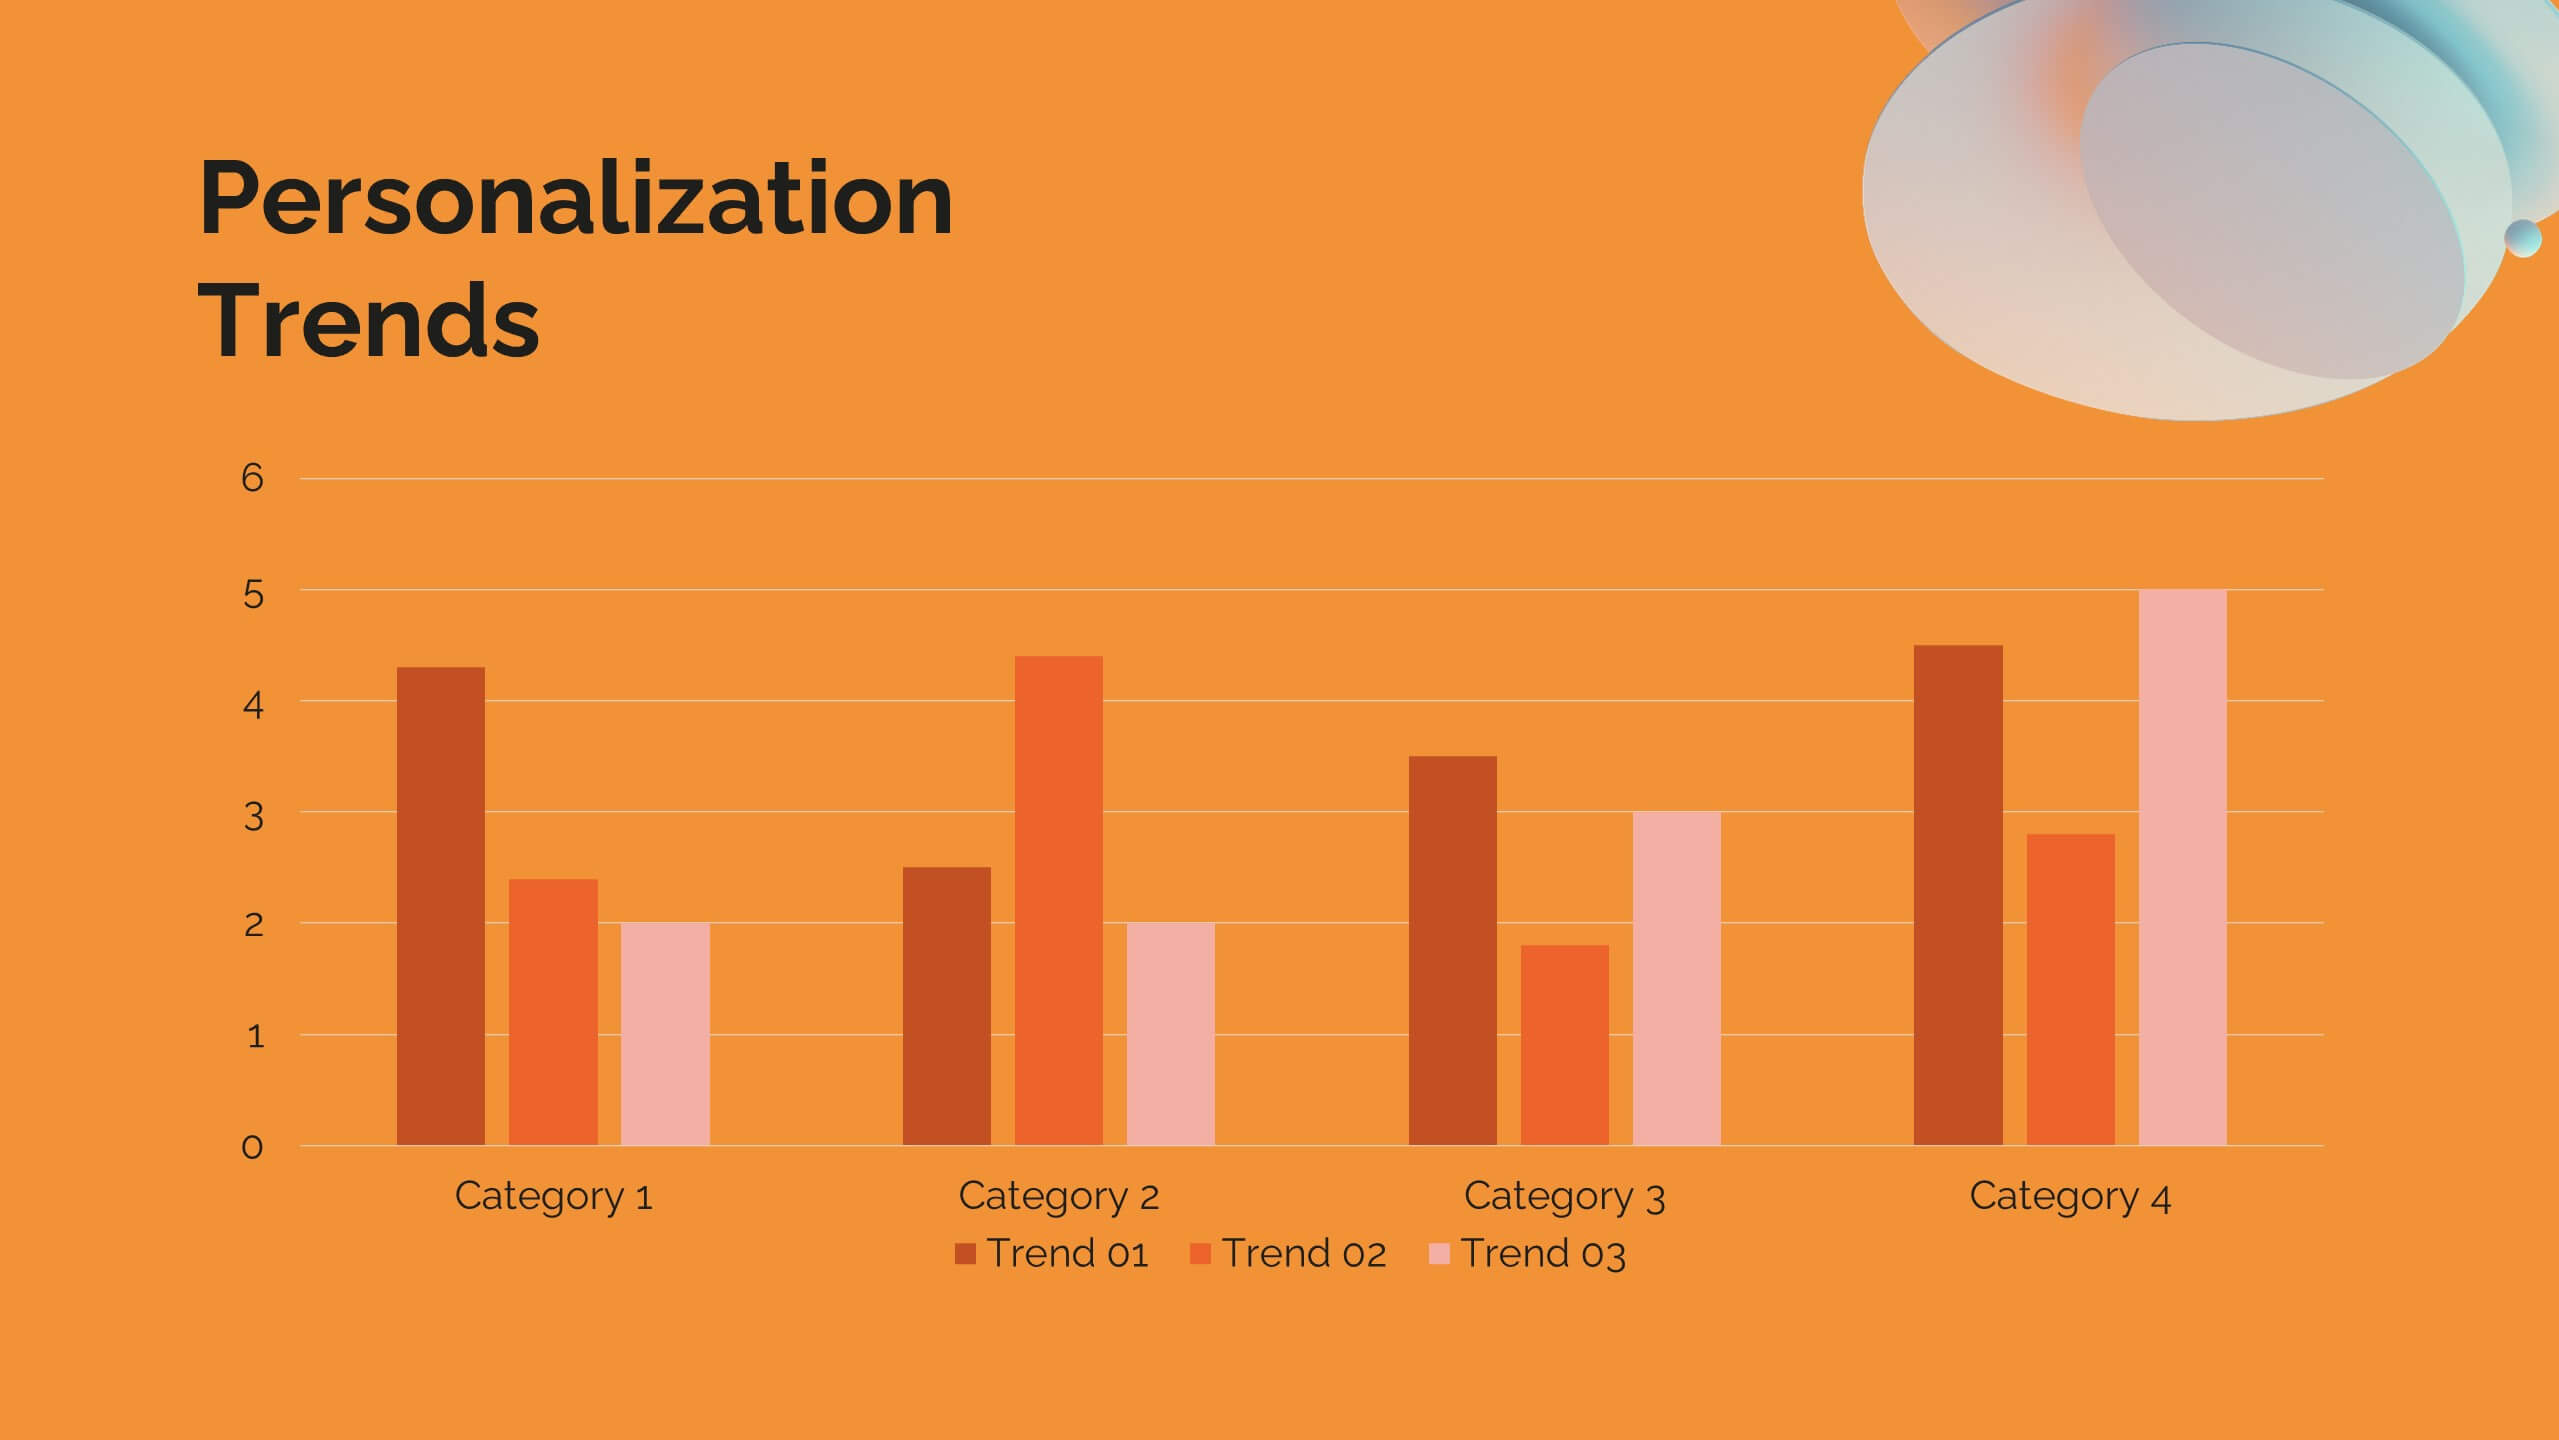
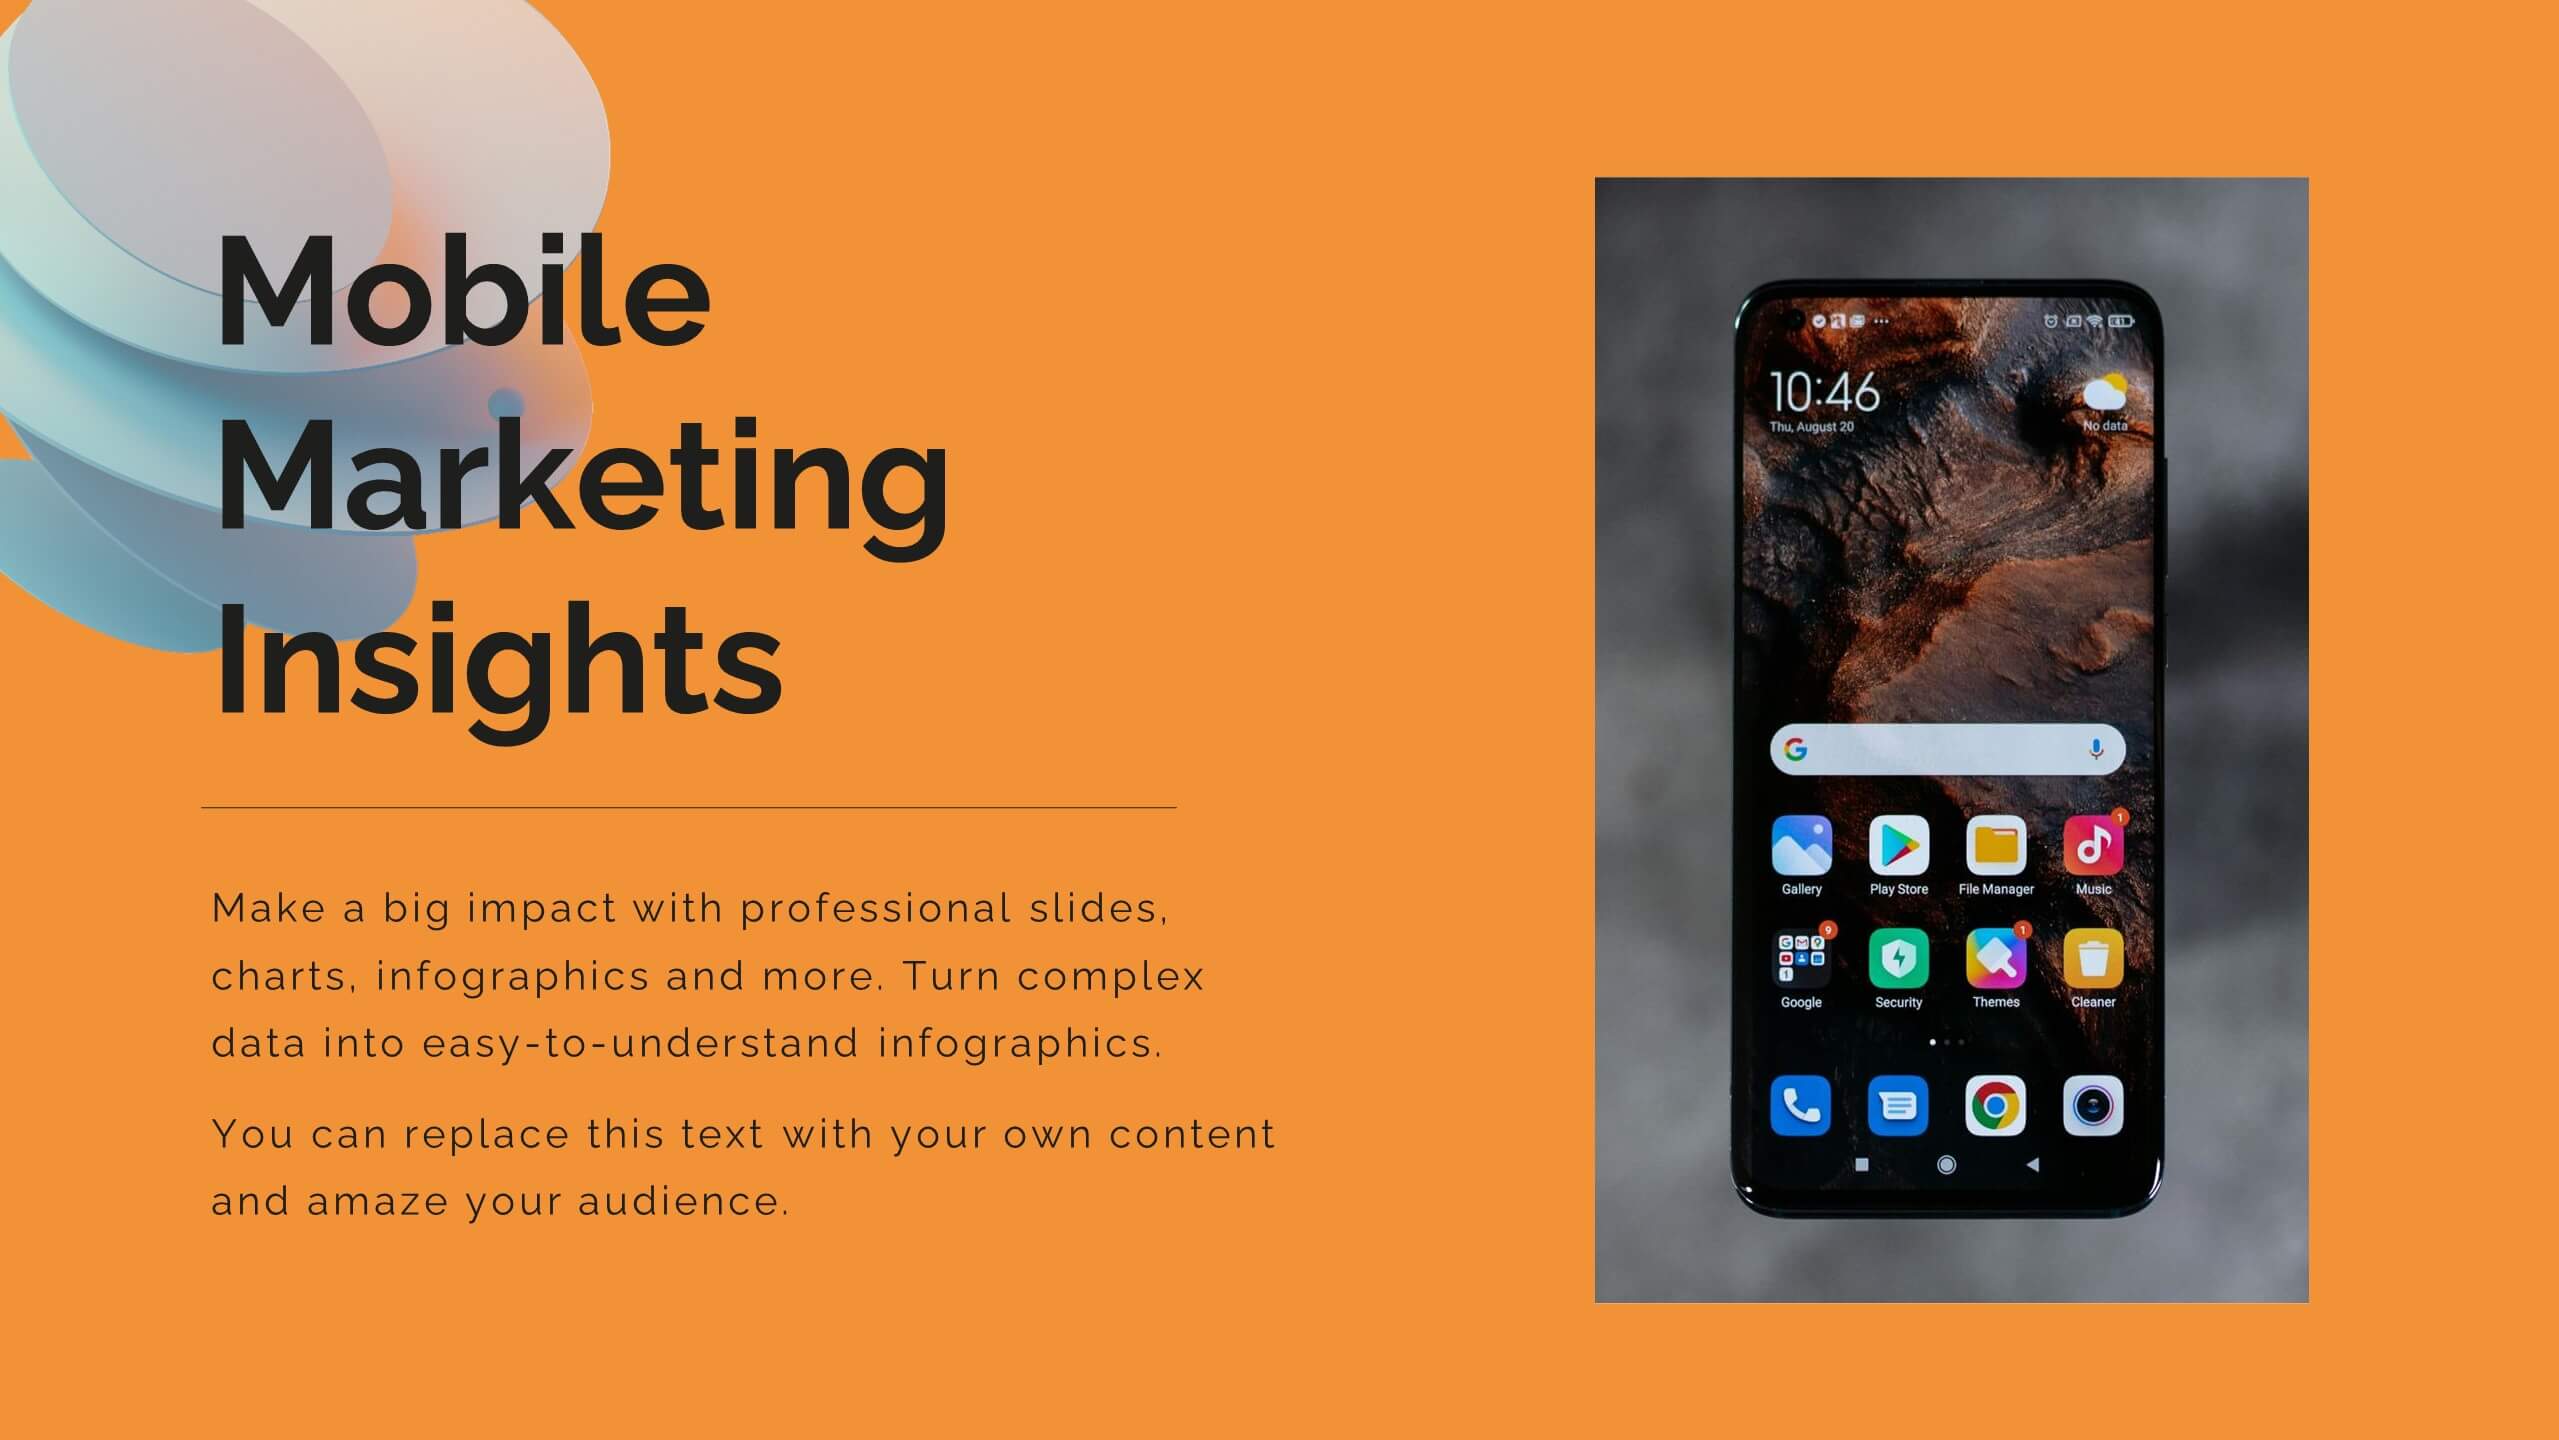
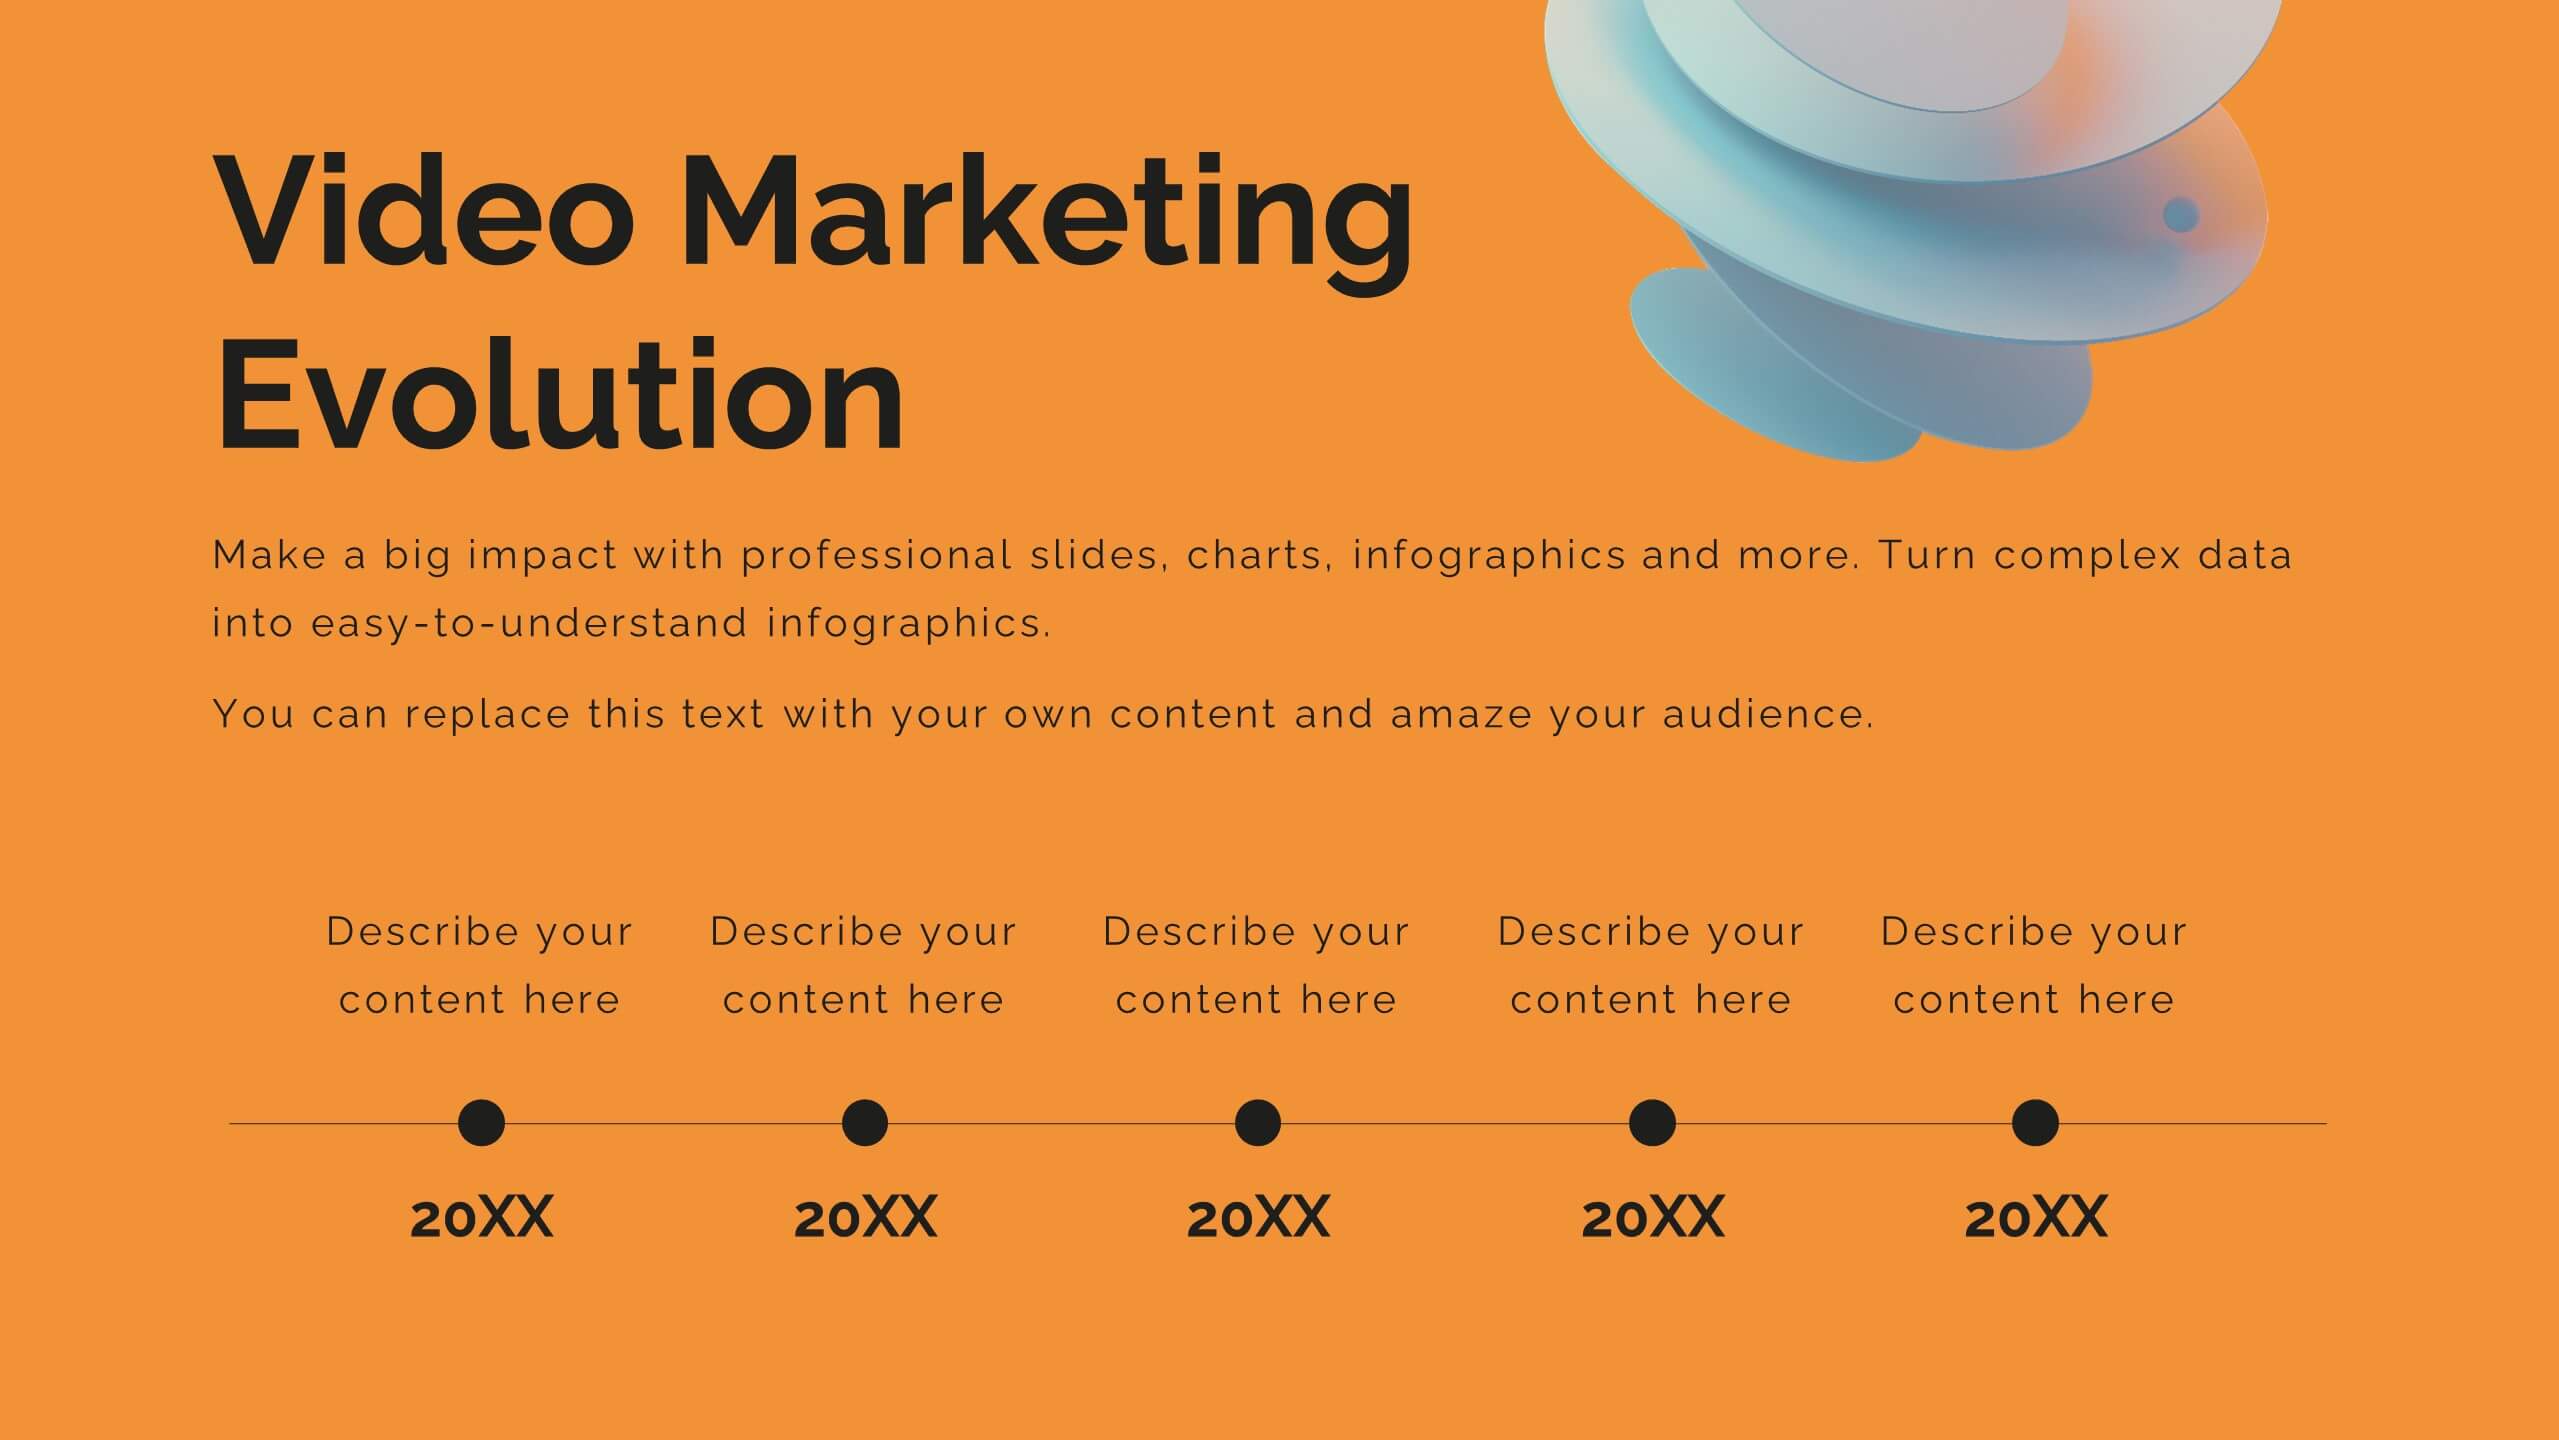
Chart Comparison Infographic Presentation
Chart Comparison is the process of comparing different charts or graphs to identify similarities. It involves analyzing multiple sets of data by visually presenting them in charts. Use this template to show the comparison of various charts and how things look when they are compared. This template will help you create a professional Infographic presentation that highlights the key differences between data sets. Each chart can have it's own color, so you can use any color you want. You can also add text in the chart with your own content, and edit in Powerpoint, Keynote, or Google Slides.


6 diapositivas
Ecommerce KPI Dashboards Infographic
Elevate your eCommerce reporting with our comprehensive KPI Dashboard Infographics. Tailored for seamless integration with PowerPoint, Google Slides, and Keynote, this template offers a clear and colorful representation of key performance indicators critical to online business success. From tracking sales growth to monitoring customer engagement metrics, our infographics provide an intuitive layout to display data-driven insights that drive decision-making. This template transforms complex data sets into straightforward visuals, making it easier to communicate progress with your team. Use this template to keep a pulse on your eCommerce performance and narrate the story behind the numbers.


4 diapositivas
Clinical Workflow and Patient Info Layout Presentation
Visualize patient pathways with the Clinical Workflow and Patient Info Layout Presentation. This diagram-based template simplifies complex clinical processes using a clear, step-by-step structure with decision nodes and action points. Ideal for hospital teams, medical administrators, and EHR system walkthroughs. Fully customizable in PowerPoint, Keynote, Google Slides, and Canva.


5 diapositivas
Lean Startup Business Presentation
A fresh, energetic layout brings your ideas to life, making it easy to present streamlined processes and early-stage strategies with clarity. This presentation highlights key steps, insights, and goals in a clean, modern flow designed for fast-moving teams. Fully compatible with PowerPoint, Keynote, and Google Slides.


6 diapositivas
Achievements and Goals Milestone Presentation
Celebrate every step toward success with a bold visual that climbs to the top. This infographic template is designed to highlight key goals, project milestones, or achievements using a mountain-inspired layout that’s both symbolic and practical. Perfect for roadmaps, team highlights, or quarterly wins—works seamlessly with PowerPoint, Keynote, and Google Slides.


22 diapositivas
SEO Report Presentation
Optimize your SEO strategies using our comprehensive SEO Report template. It includes sections for keyword performance, market trends, competitor insights, and client feedback. Tailored for digital marketers and SEO specialists, this template supports presentations in PowerPoint, Keynote, and Google Slides.

21 diapositivas
Spinel Product Strategy Report Presentation
Take your product strategy to the next level with this polished, spinel-inspired presentation! Designed to effectively communicate your product's goals, market analysis, and strategy roadmap, this template is both visually striking and easy to navigate. Its sharp design ensures a professional touch. Compatible with PowerPoint, Keynote, and Google Slides.


5 diapositivas
Business Project Status Review Presentation
Present your team's progress with clarity using this hexagon-icon based project review layout. Designed for status updates, this slide includes four visually distinct sections with toggle-style indicators for highlighting progress, milestones, or tasks. Ideal for project managers, corporate teams, or consultants. Fully editable in PowerPoint, Keynote, and Google Slides.


22 diapositivas
Jade Graphic Design Project Plan Presentation
Unleash creativity with this vibrant Graphic Design Project template! Perfect for showcasing your design process, prototypes, and assets, it keeps the audience captivated with clean visuals and a fresh, modern look. Whether you're outlining color palettes or final designs, every slide exudes style. Ideal for PowerPoint, Keynote, and Google Slides!


6 diapositivas
Demographic Transition Infographics
Embark on a journey through the fascinating concept of demographic transition! This infographic opens the door to understanding how societies evolve over time in terms of population growth and age structure. From the early stages of high birth and death rates to the advanced stages of low birth and death rates, we unveil the intricate phases of demographic transition that shape our world. Discover the profound impacts of demographic transition on societies and economies. Learn how changes in population structure affect labor markets, healthcare systems, and social welfare. Understand the opportunities for economic growth and development that can arise from a favorable demographic transition. With this engaging infographic, compatible with PowerPoint, Keynote, and Google Slides, sharing your understanding of demographic transition has never been more accessible. Empower yourself with the knowledge to comprehend and discuss this vital aspect of our world's development. Dive into the complexities of demographic transition and embark on a journey of exploration and enlightenment.


5 diapositivas
3-Level Concentric Diagram Presentation
Bring clarity and structure to your ideas with a clean, layered diagram design that simplifies complex concepts. Perfect for showcasing stages, hierarchies, or interconnected systems, it keeps your audience engaged with visual balance and flow. Fully compatible with PowerPoint, Keynote, and Google Slides for effortless customization and presentation flexibility.


5 diapositivas
Task Management and Scheduling
Stay organized and efficient with this clear task management and scheduling layout. This presentation makes it easy to prioritize assignments, allocate time slots, and track progress using a visual clock-based design. Perfect for business operations, project coordination, workflow planning, and productivity meetings. Fully customizable and compatible with PowerPoint, Keynote, and Google Slides.