


Características


¿Tienes alguna pregunta?
Recomendar


6 diapositivas
Economic Pyramid Infographic
Showcase economic structures with our Economic Pyramid Infographic, compatible with Powerpoint, Google Slides, and Keynote. This template is designed for economists, educators, and business professionals, providing a visual hierarchy of economic indicators or demographics. Each level of the pyramid represents a different segment, such as income brackets, consumer classes, or resource distribution. It's an ideal tool for presentations that require a clear depiction of economic stratification or market segmentation. Customizable and easy to understand, this infographic helps simplify complex economic data into digestible visual tiers for any audience.


26 diapositivas
Geometric Technology Presentation
Technology has changed the world we live in, it is a powerful tool when used correctly and with caution. This template offers a sleek way to deliver your message and is designed with geometric shapes that are arranged in a flexible design. It includes a backdrop with a geometric pattern, which can be customized with your own images and colors. This template is a great way to impress your teachers, clients, or students with the newest technologies. With an emphasis on high-quality visuals, this template is perfect for illustrating your ideas and giving people confidence in your business plan.


7 diapositivas
Customer Service Profile Infographic Presentation
A Customer Profile infographic is a visual representation of a target customer or customer segment that provides important information about their demographics, behavior, preferences, and needs. This template can help businesses and organizations understand their customers better, tailor their products or services to meet their needs, and develop effective marketing strategies. This template can be used for various purposes, such as to guide product development, to inform marketing campaigns, or to improve customer service. This template is compatible with Powerpoint, keynote and google slides.


5 diapositivas
Artificial Intelligence Categories Infographics
Artificial Intelligence has the potential to revolutionize industries and create new opportunities for businesses and individuals. These infographic templates provide an overview of the different categories of artificial intelligence based on their functionality and applications. These infographics feature futuristic designs with icons and illustrations to represent each category of AI. The categories in this template are described with a short summary and corresponding icon or illustration. The infographic is designed with a vertical layout and uses a blue color scheme throughout. This template is perfect to introduce the basics of AI to an audience.


23 diapositivas
Wave Small Business Pitch Deck Presentation
This business pitch deck is your key to winning over investors! It covers everything from company background and product overview to SWOT analysis and market opportunity. With clear visuals of financial performance and strategic goals, this deck provides the perfect roadmap for success. Ideal for PowerPoint, Keynote, and Google Slides presentations!


6 diapositivas
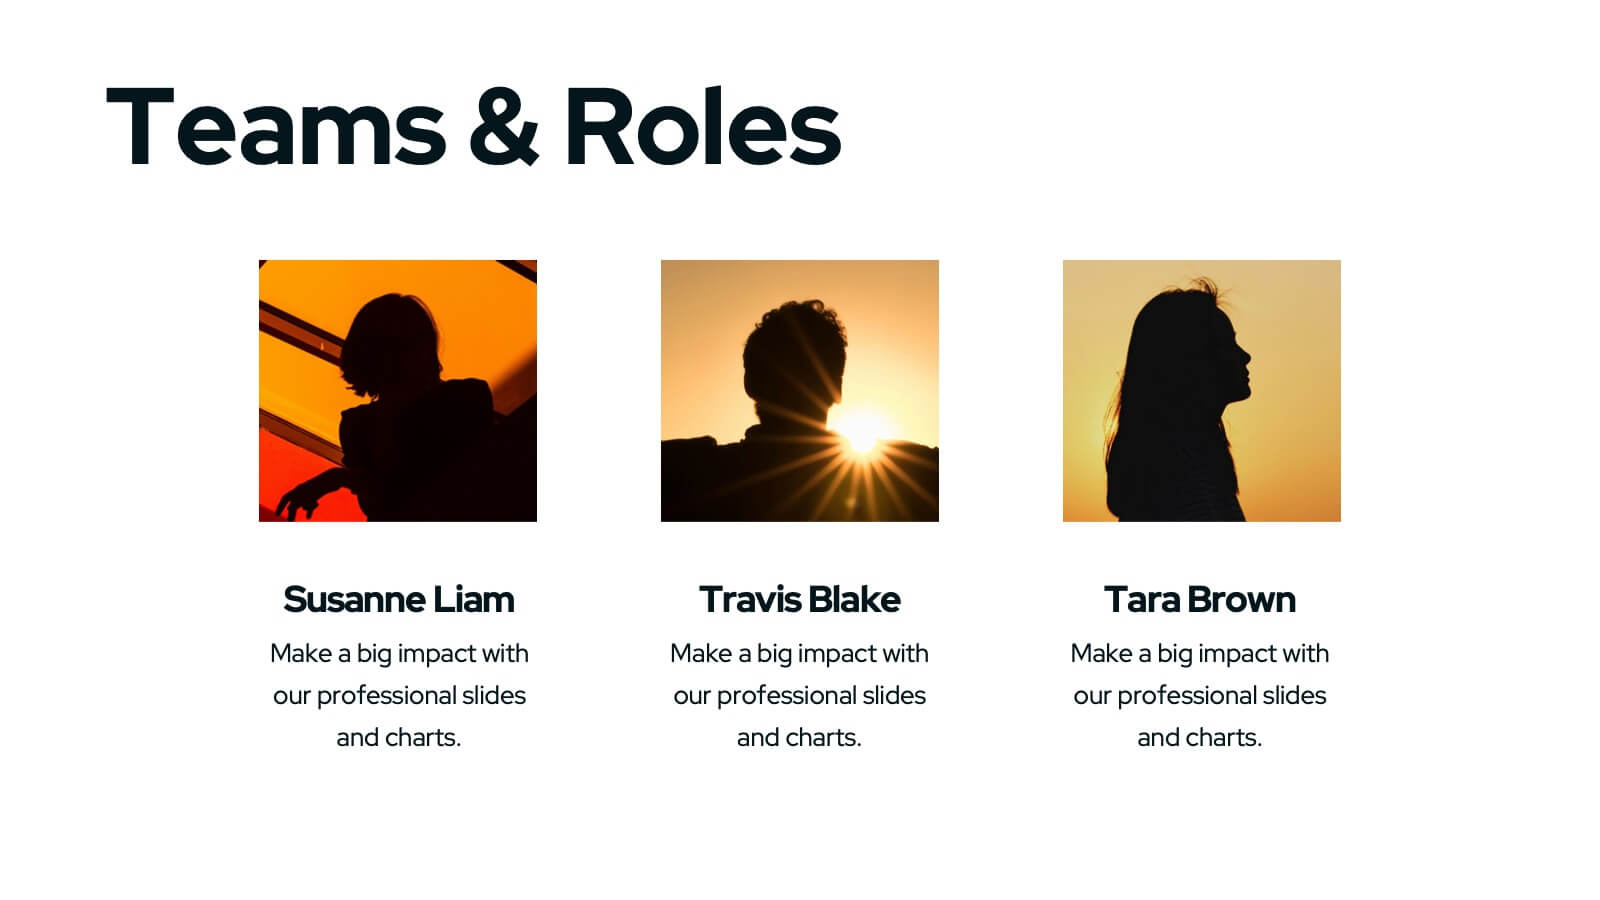
Effective Team Structure Guide Presentation
Visualize your team's structure with clarity using this team guide presentation. Designed for highlighting roles, connections, and reporting lines, each slide helps communicate responsibilities and hierarchy efficiently. Ideal for HR, managers, and team leads. Fully editable in PowerPoint, Keynote, and Google Slides—customize colors, names, and positions with ease.


7 diapositivas
Business Pricing Table Slides Infographic
Streamline your product offerings with our Business Pricing Infographic, designed to clearly present pricing tiers and package options. This infographic is essential for sales teams, marketing professionals, and business owners to communicate value propositions to potential customers. Our Business Pricing Infographic allows for a clean, comparative view of different pricing plans, showcasing features, benefits, and cost-effectiveness at a glance. It includes customizable sections for various packages, making it easy to distinguish between basic, standard, and premium options. With this tool, you can highlight key differences and unique selling points of each package, aiding customers in making informed purchasing decisions. This SEO-friendly infographic is crafted to attract and educate potential buyers, providing them with transparent pricing information. Adopt this infographic in your marketing materials to facilitate a straightforward shopping experience, helping customers choose the right product that fits their needs and budget.


26 diapositivas
Building Community Networks Presentation
Strengthen connections and foster collaboration with this engaging presentation on building community networks. Covering key topics like social engagement, resource sharing, grassroots initiatives, and digital networking, this template helps highlight strategies for creating meaningful relationships. Fully customizable and compatible with PowerPoint, Keynote, and Google Slides for a seamless and impactful presentation experience.

21 diapositivas
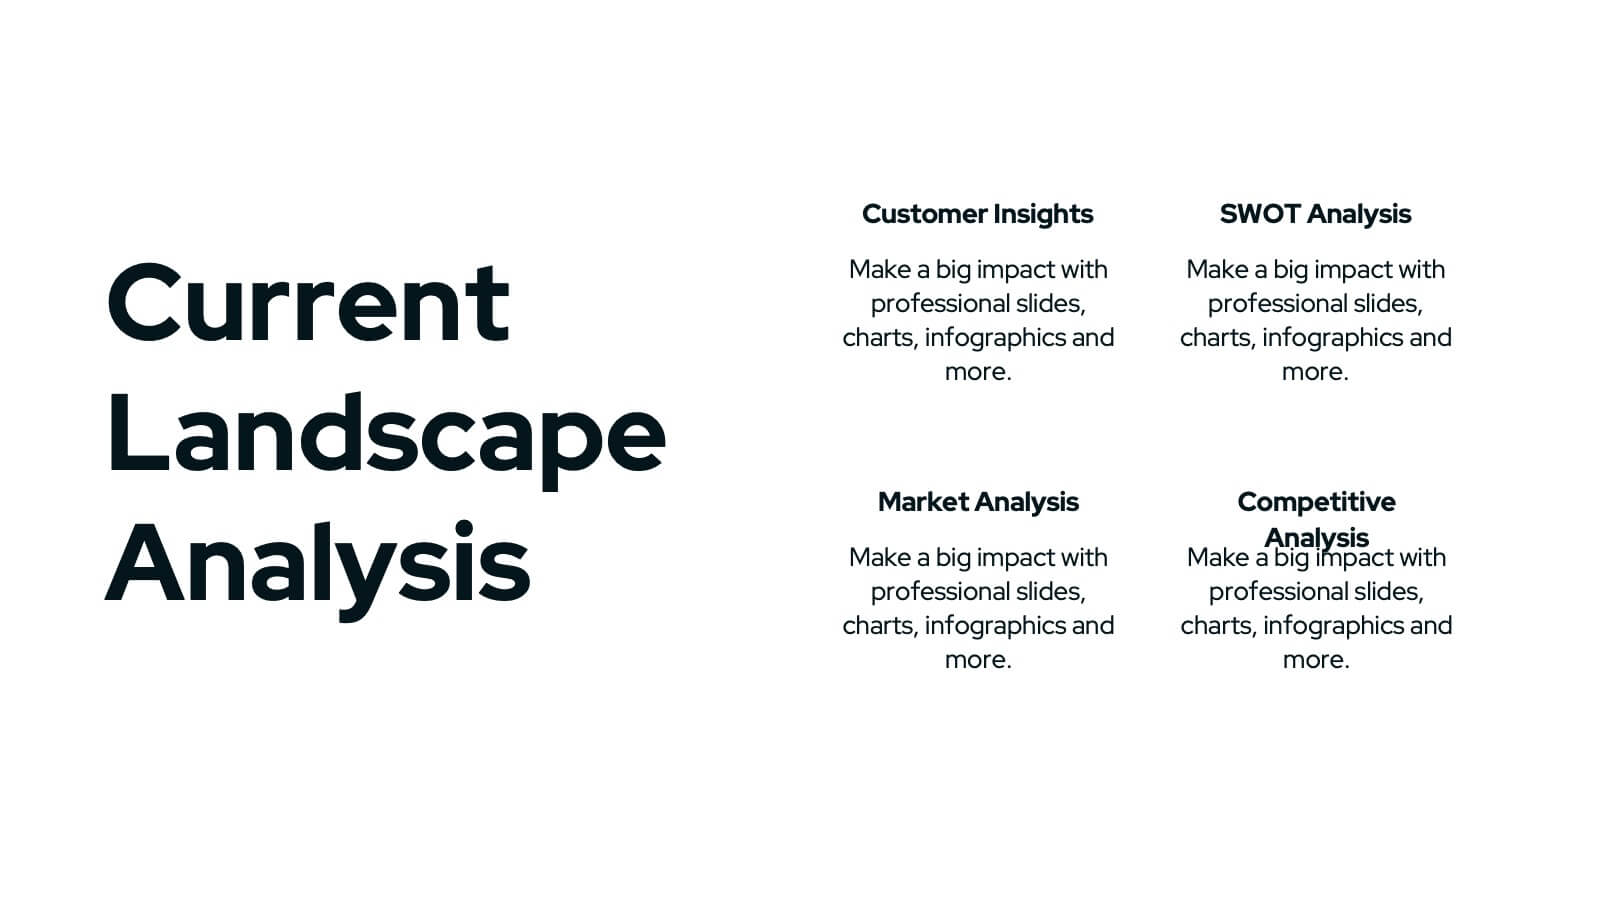
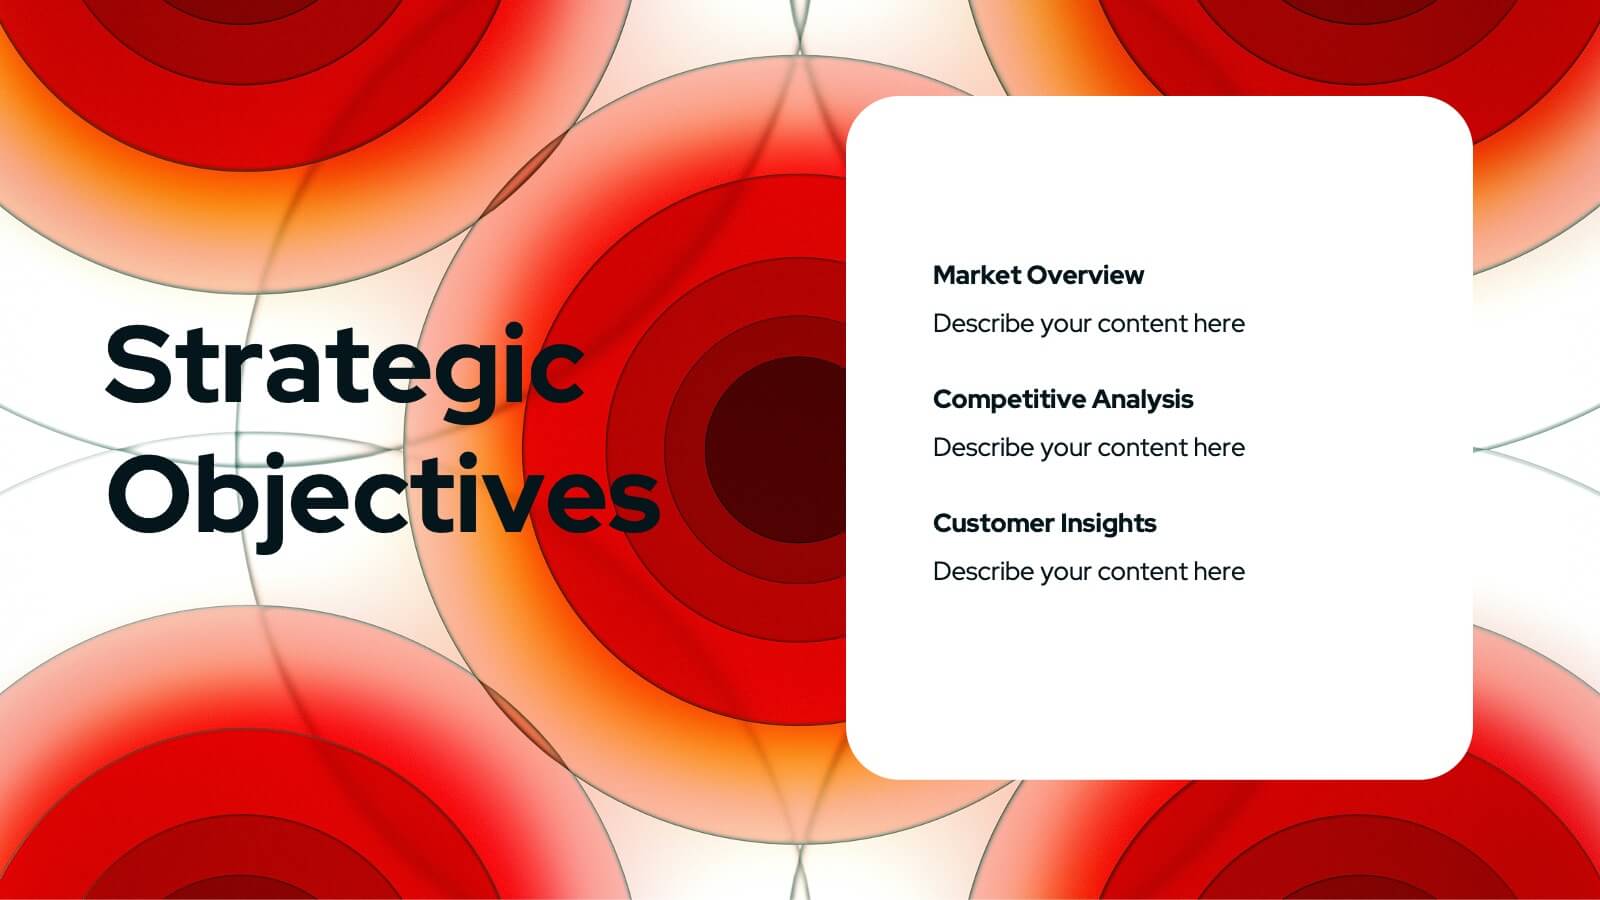
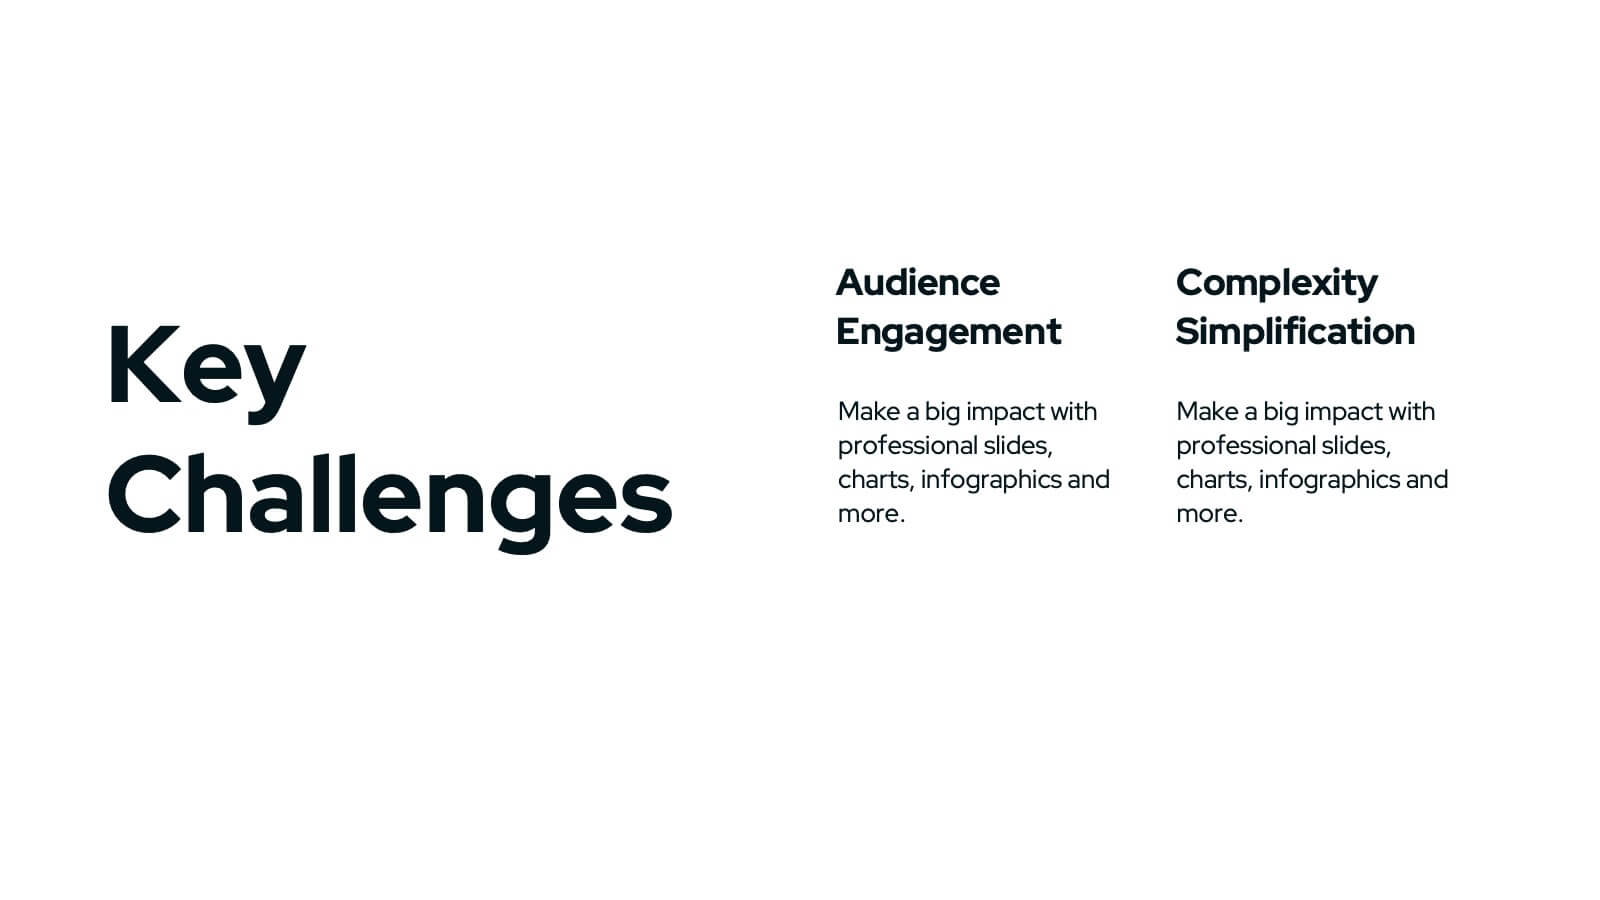
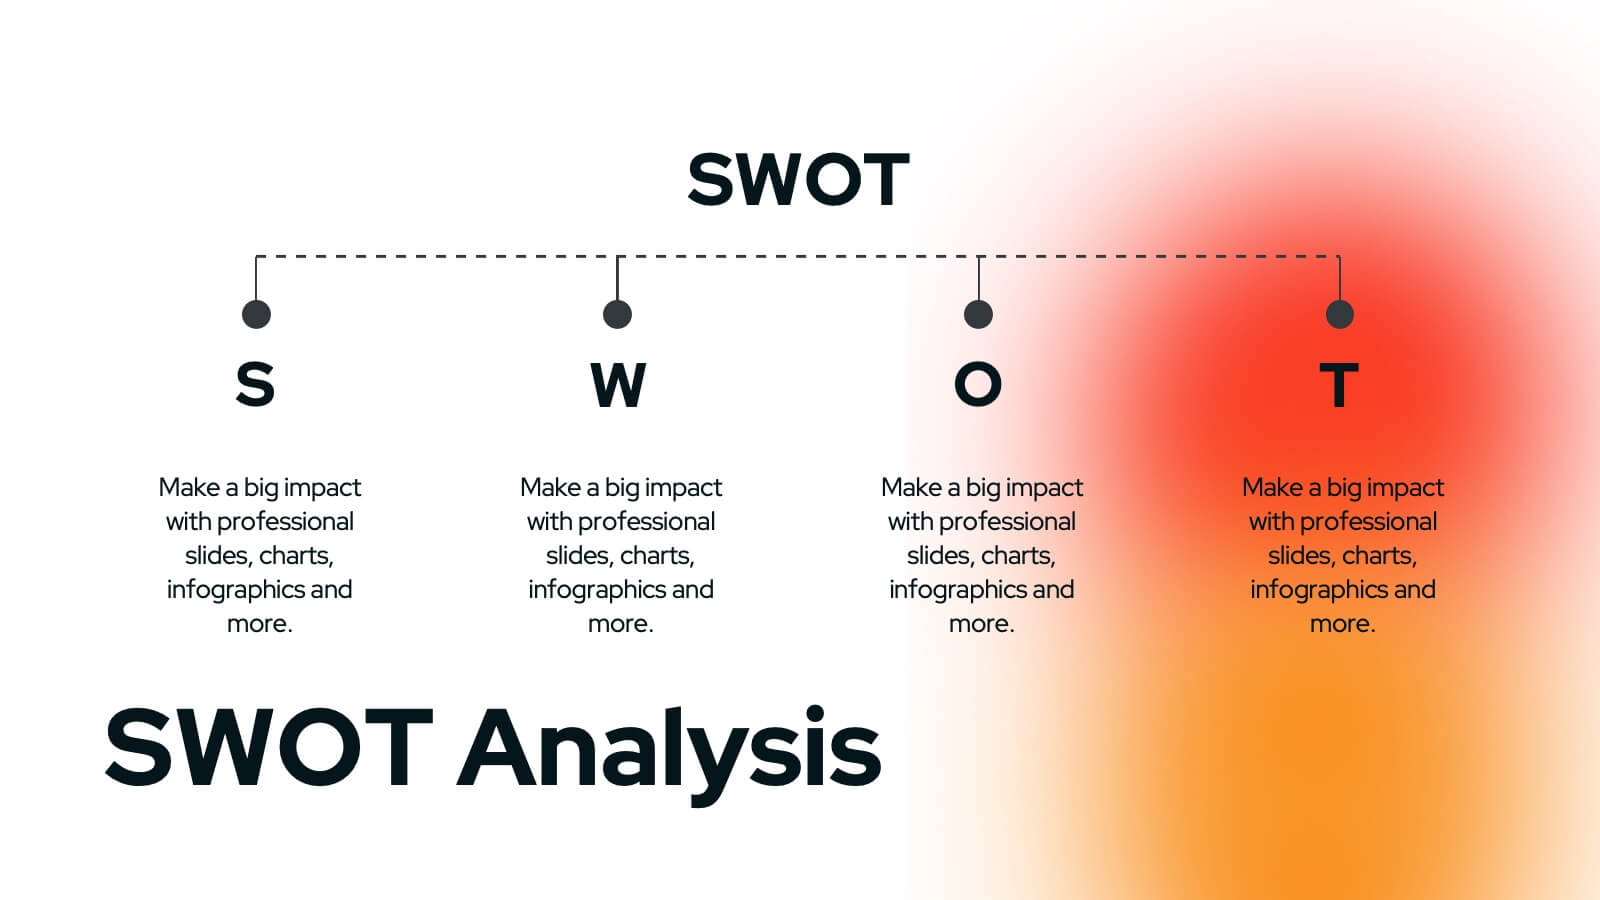
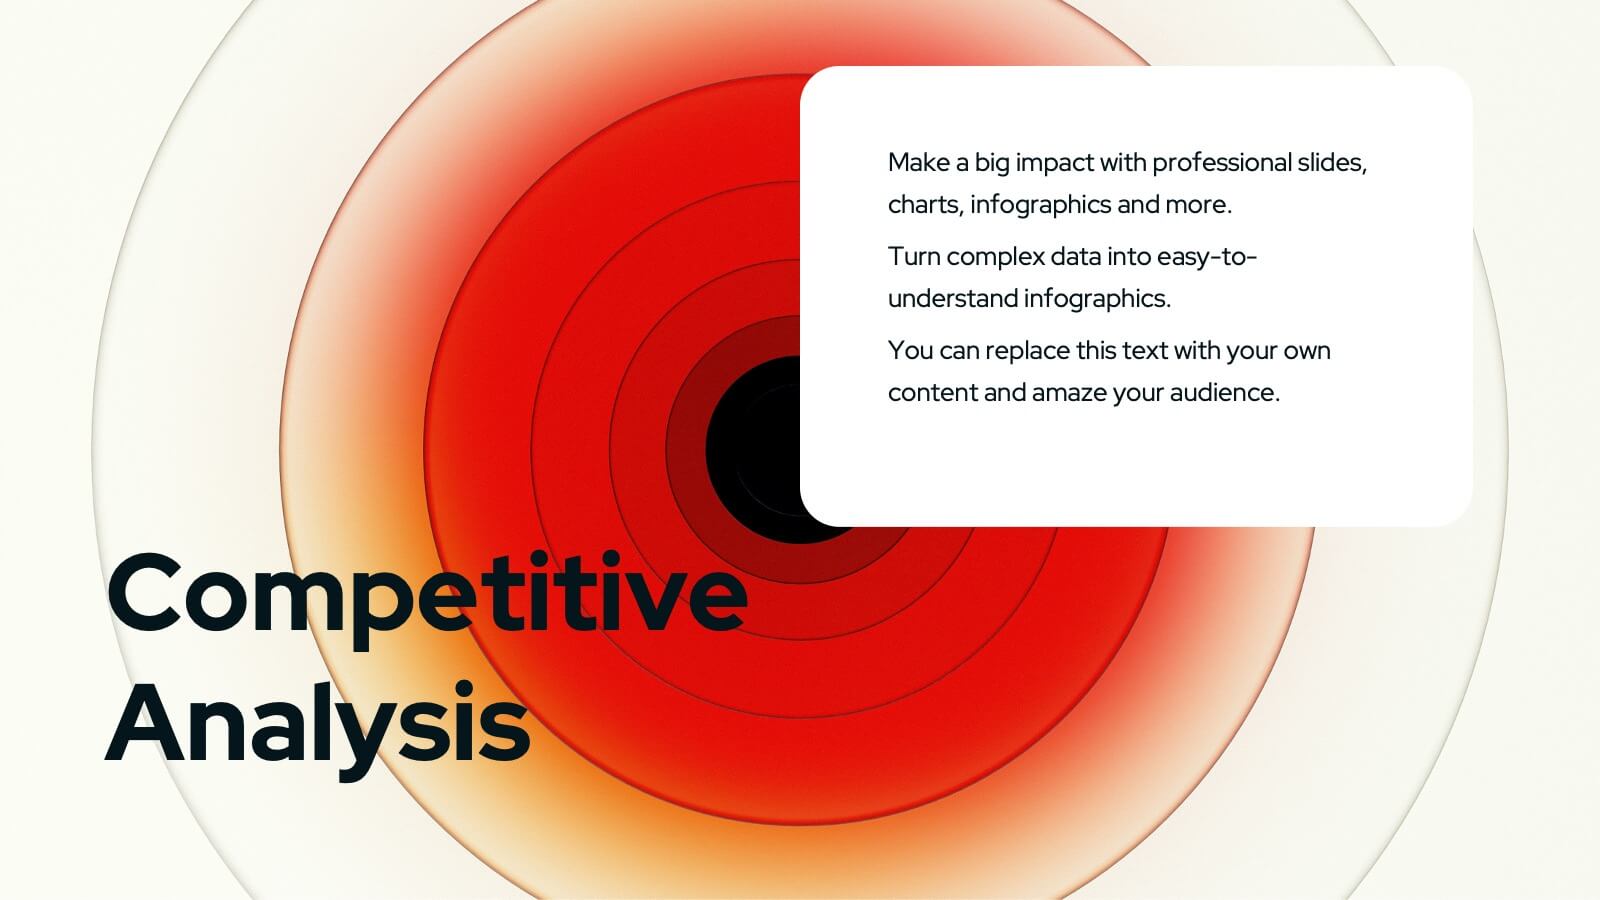
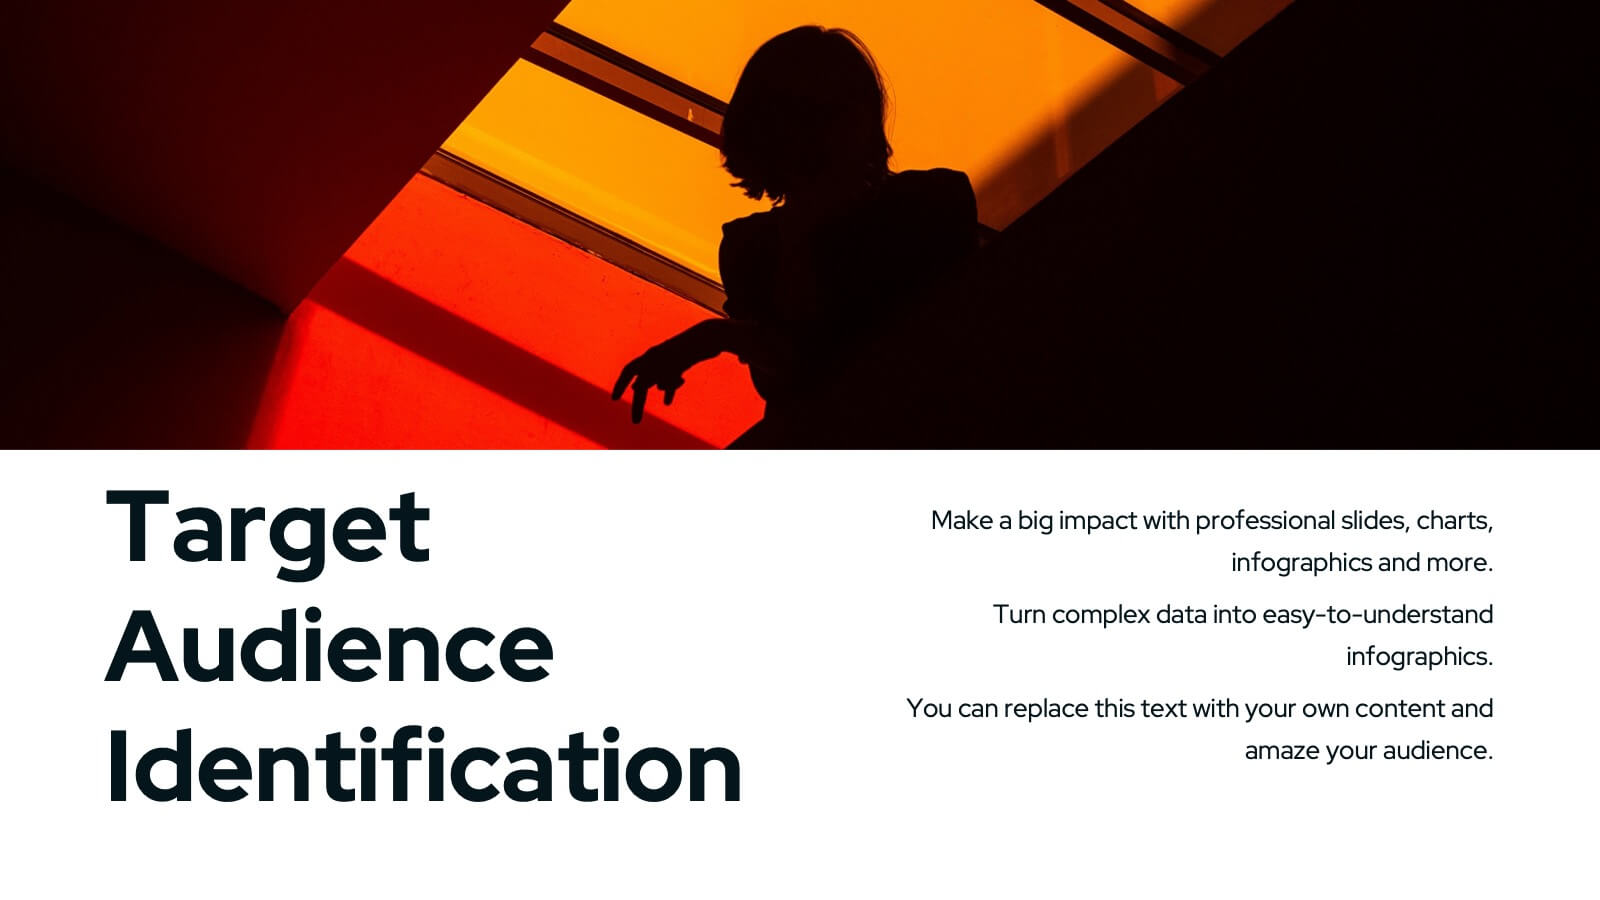
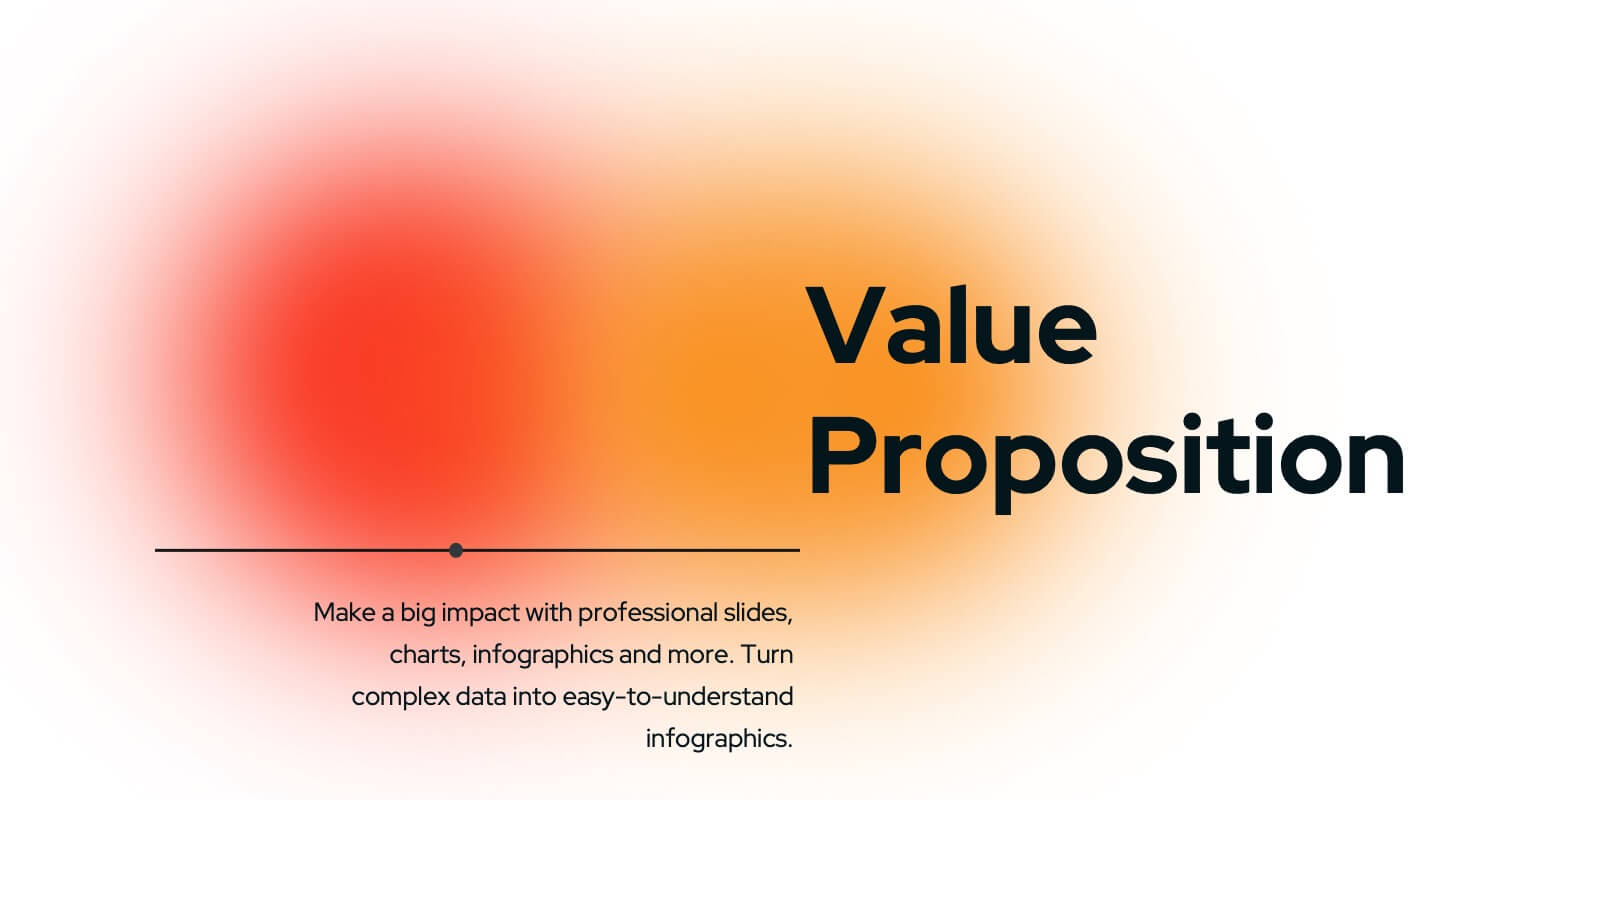
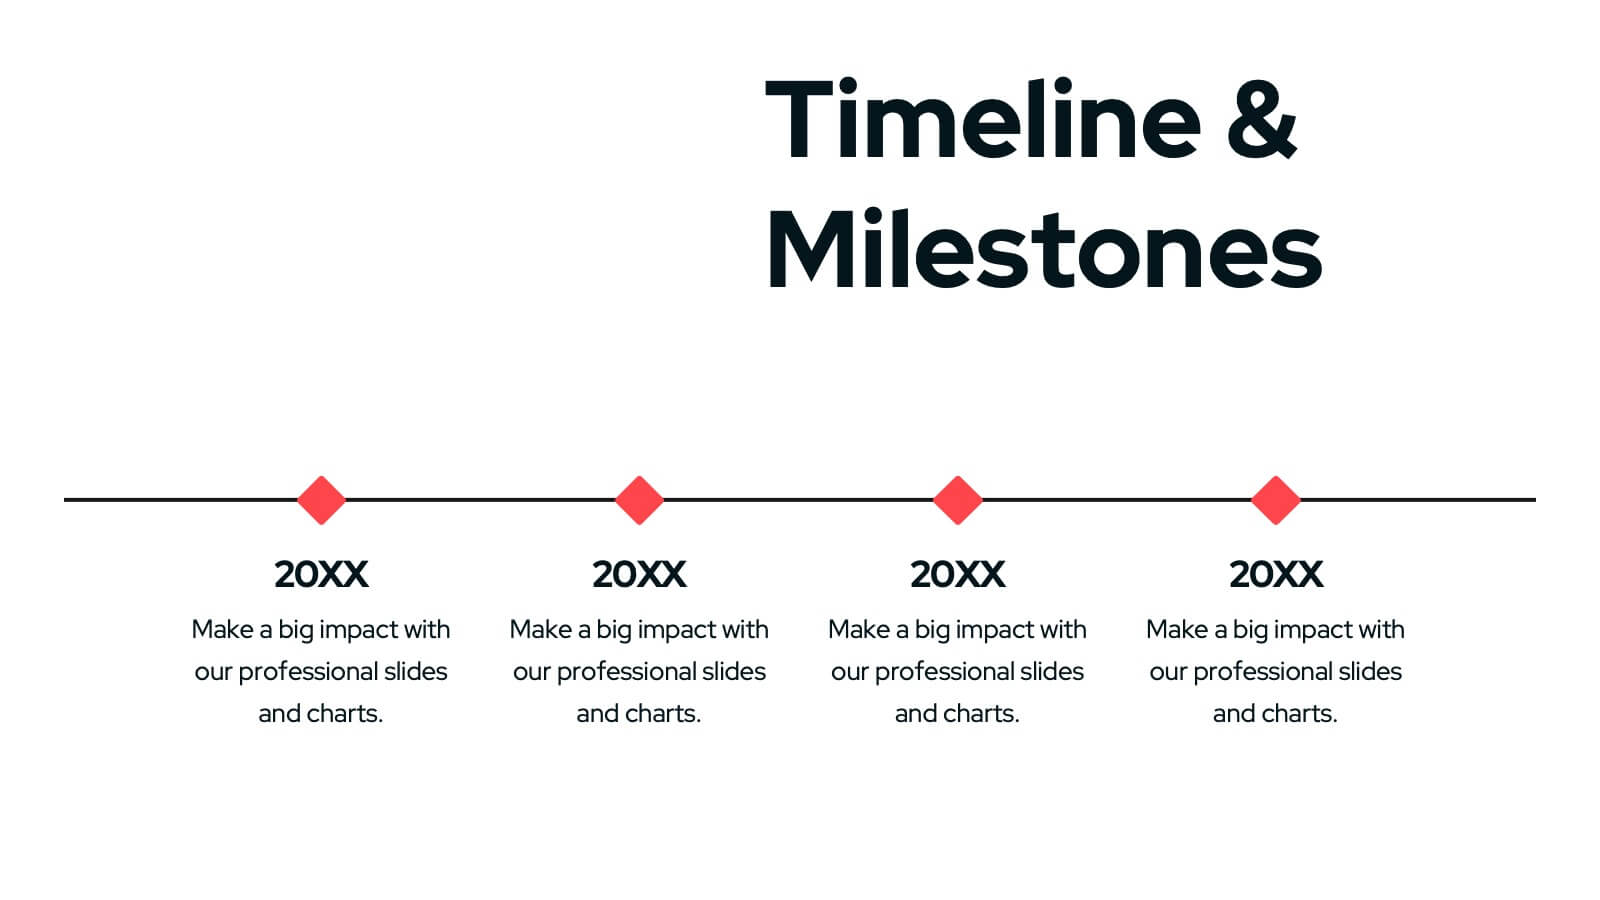
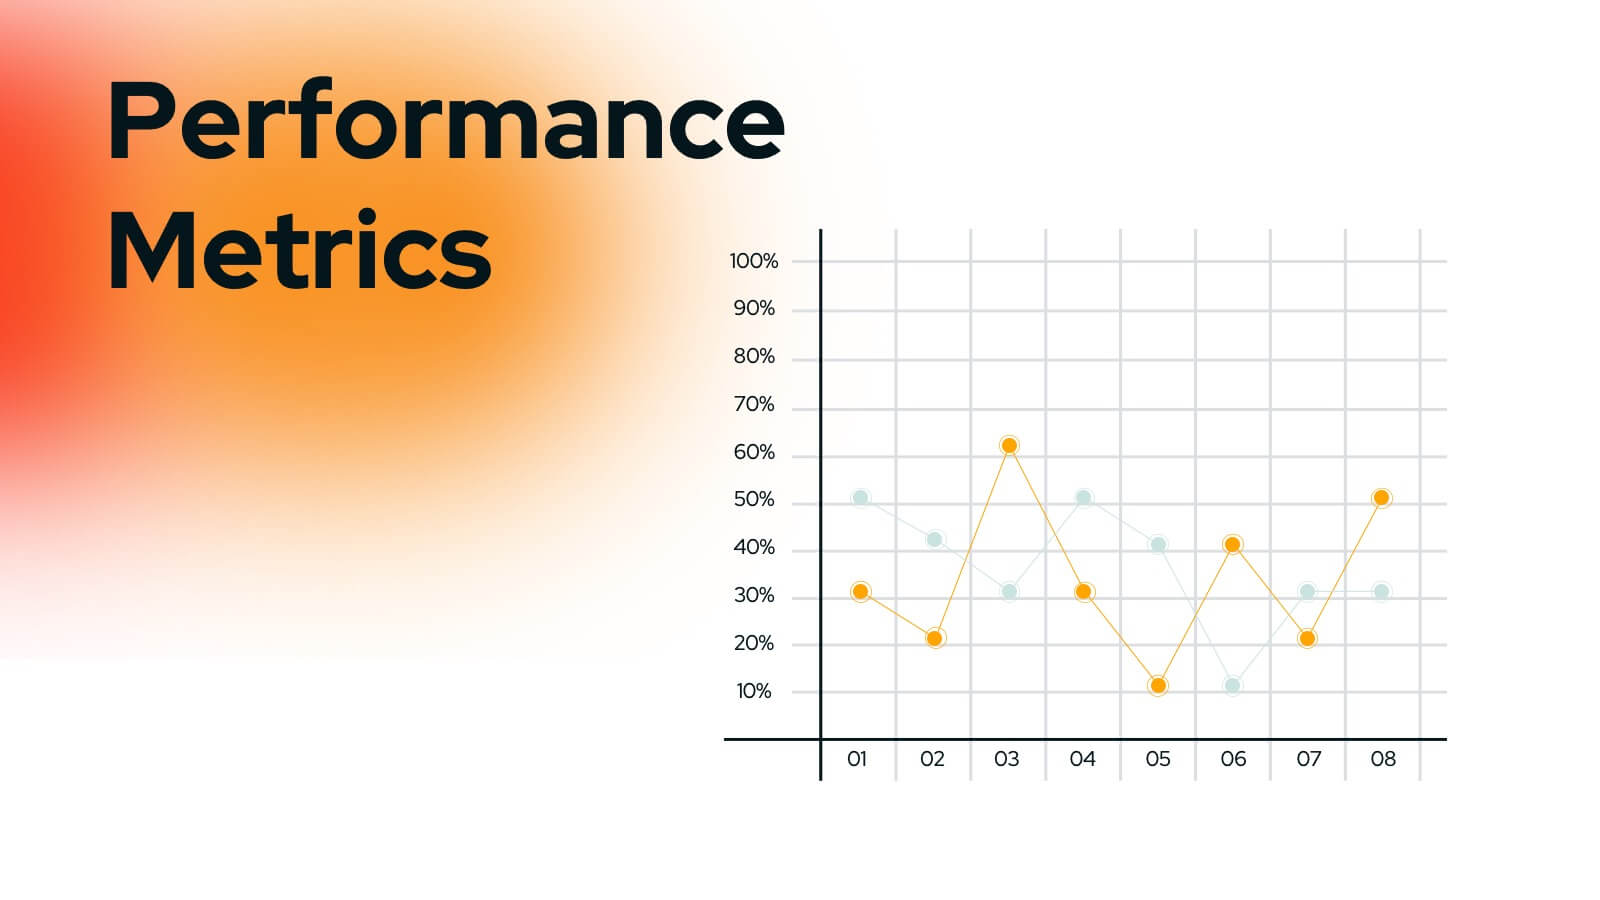
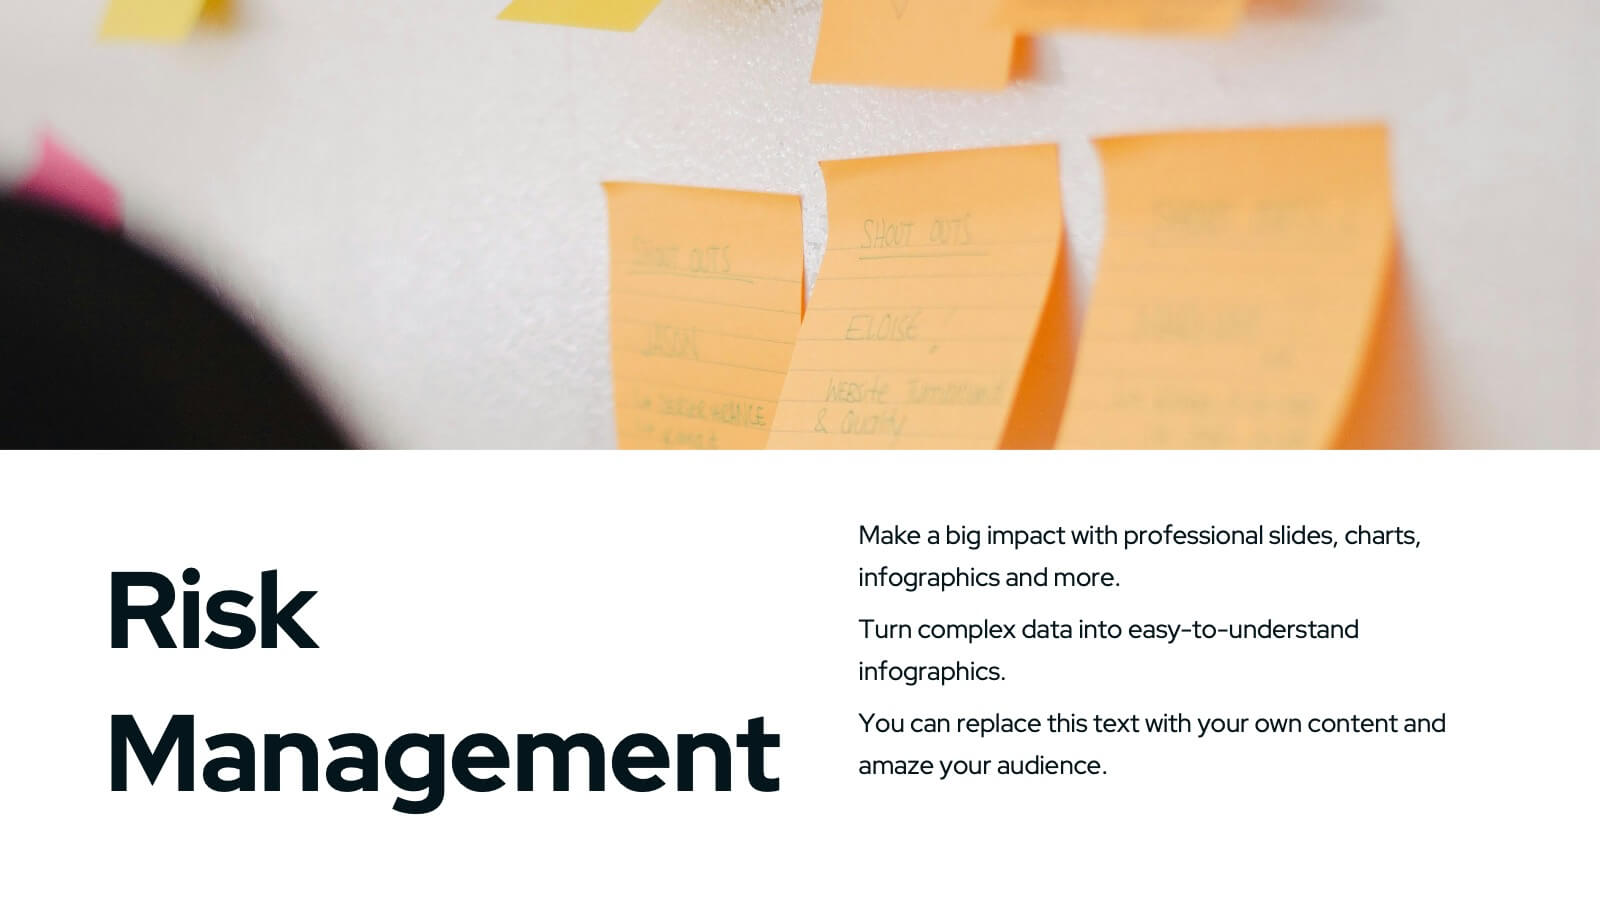
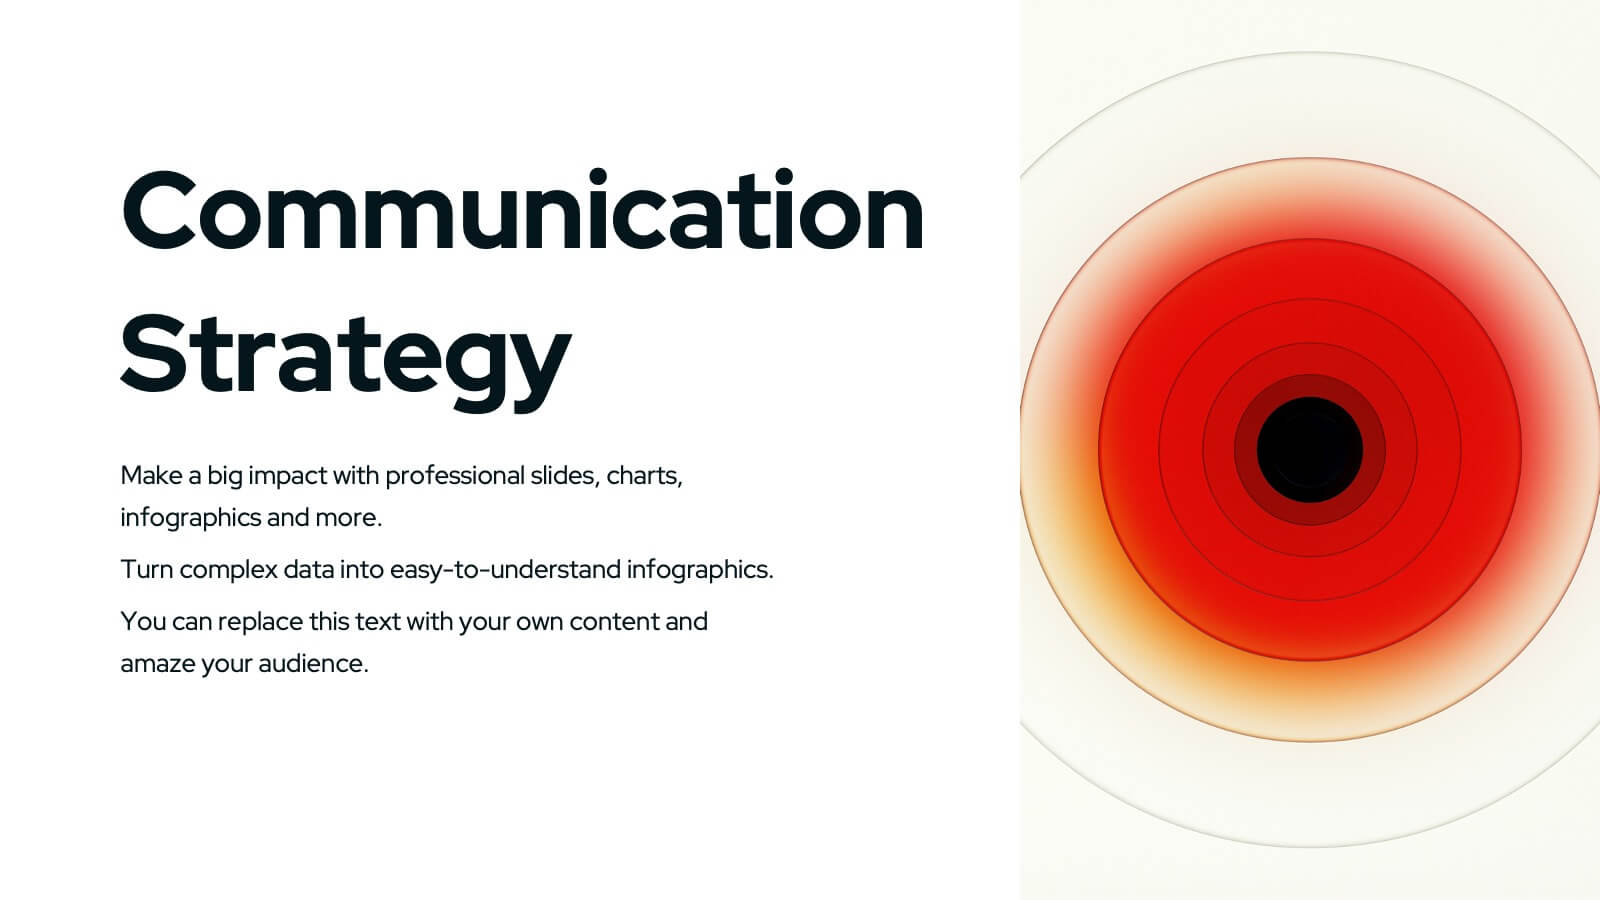
Wyrm Marketing Strategy Plan Presentation
Unleash the power of your marketing strategy with this bold and dynamic presentation template! Perfect for covering everything from landscape analysis and target audience identification to performance metrics and risk management. This template helps guide your audience through key challenges, SWOT analysis, and strategic initiatives with clarity and impact. Compatible with PowerPoint, Keynote, and Google Slides for effortless and engaging presentations.


3 diapositivas
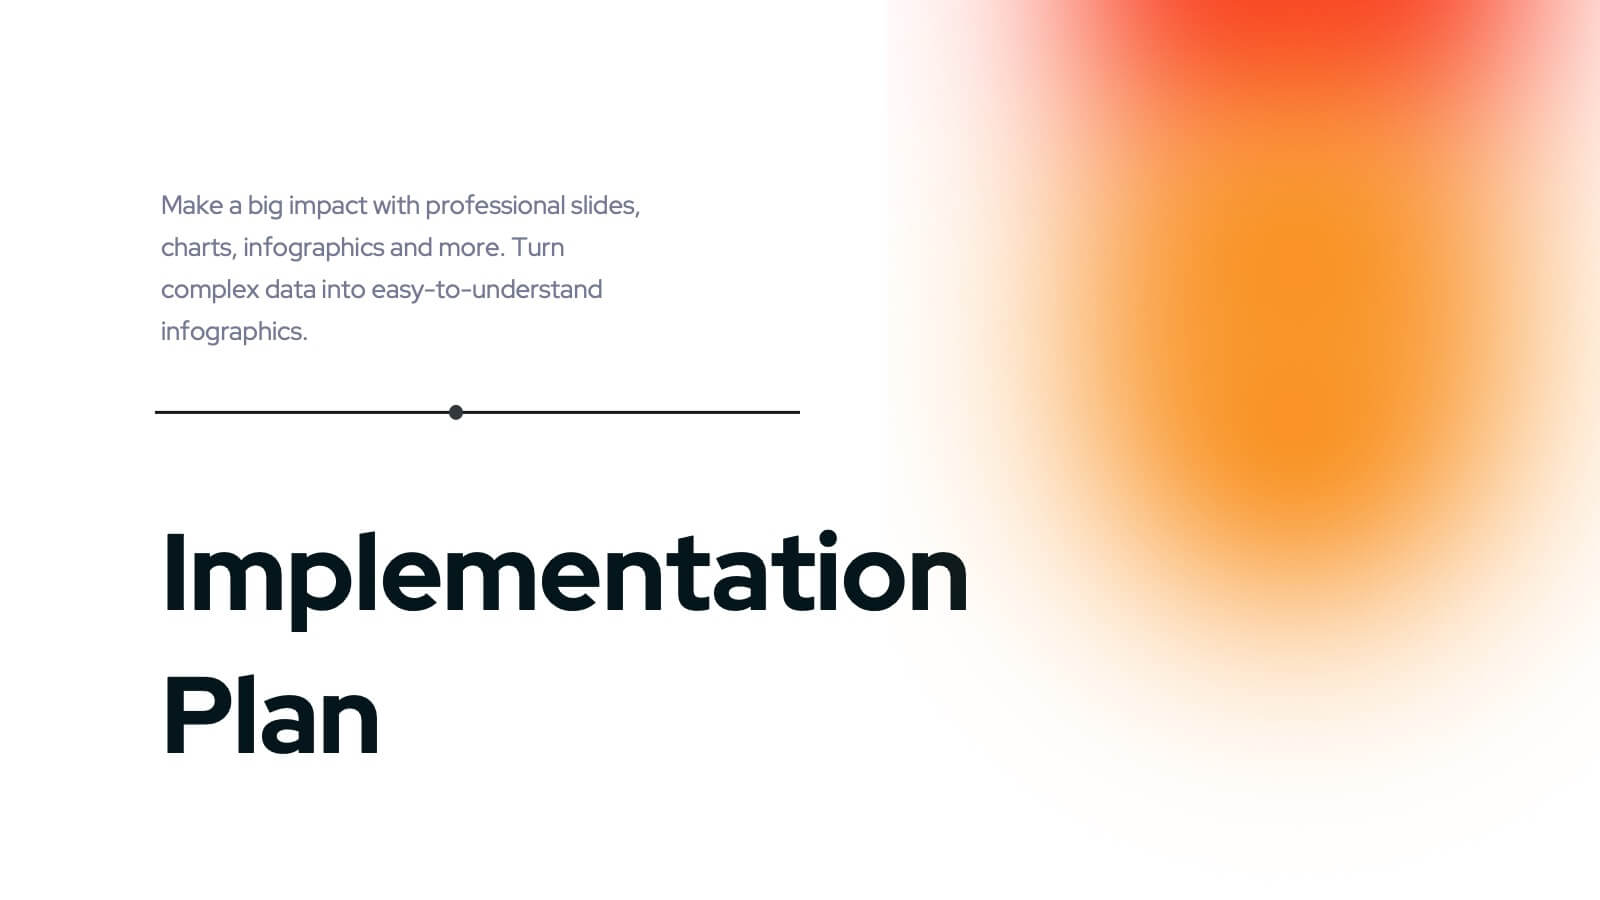
Digital Course Planning and LMS Strategy Presentation
Design your online courses like a pro with this clean, easy-to-follow visual. Ideal for mapping course flow, LMS strategy, and learner journeys, this presentation template breaks down complex processes into digestible steps. Fully customizable and compatible with PowerPoint, Keynote, and Google Slides for flexible e-learning presentation creation.


4 diapositivas
RACI Matrix for Role Assignment Presentation
Simplify team roles and task ownership with this RACI Matrix for Role Assignment slide. Clearly map out who is Responsible, Accountable, Consulted, and Informed for each project task across team members. Ideal for project planning, team meetings, or stakeholder alignment. This structured matrix layout allows easy customization for names, tasks, and role indicators. Fully editable and compatible with PowerPoint, Keynote, and Google Slides.


8 diapositivas
Virtual Team Collaboration Presentation
The "Virtual Team Collaboration" presentation template is designed to highlight different facets of teamwork in a remote setting. Each slide features a central visual metaphor illustrated by connected circles, symbolizing the interconnected nature of virtual team activities and communication. The layout provides placeholders for titles and descriptive text, making it suitable for detailing various aspects of virtual collaboration such as project management, communication protocols, and role assignments. The design encourages a clear and organized presentation of information, facilitating discussions on best practices and strategies for effective remote teamwork.


10 diapositivas
Startup Pitch Deck Presentation
Make your big idea impossible to ignore with a sleek, investor-ready design that tells your startup’s story with clarity and confidence. This presentation helps you outline your vision, market potential, and business strategy in a compelling way. Fully compatible with PowerPoint, Keynote, and Google Slides for effortless customization.


4 diapositivas
Artistic Watercolor Theme Presentation
Make a bold creative statement with this Artistic Watercolor Theme Presentation. Featuring a painter’s palette design and vibrant color splashes, this layout is ideal for showcasing four key ideas or creative concepts. Perfect for designers, educators, and artists, the layout is fully customizable in PowerPoint, Keynote, and Google Slides.


4 diapositivas
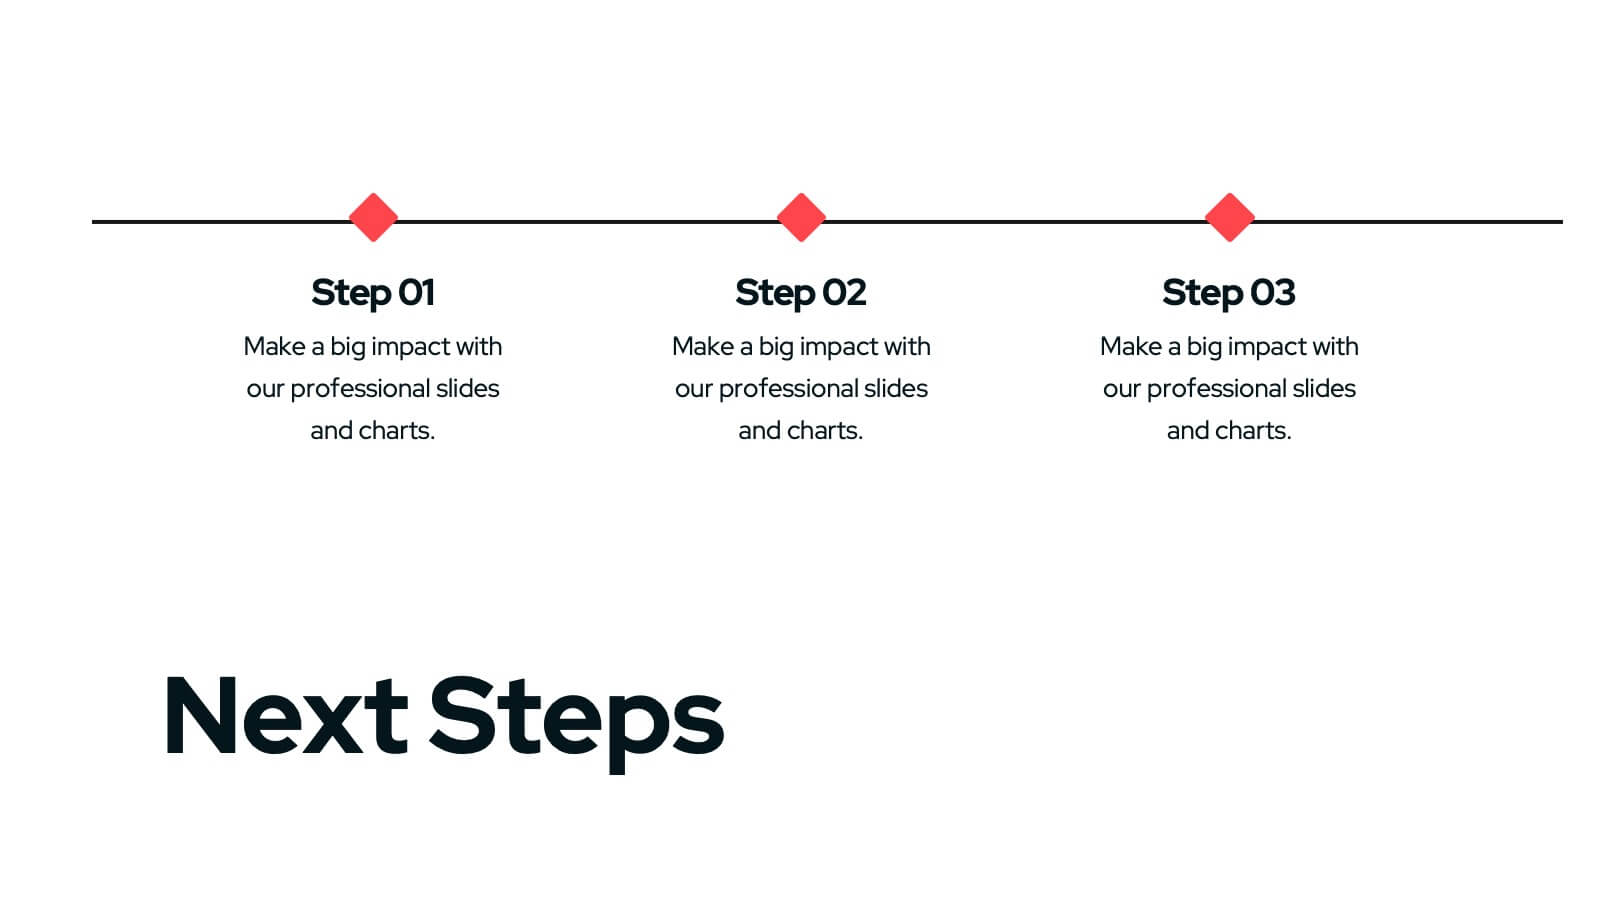
Conversion Funnel Stages Presentation
Bring clarity to every step of your customer journey with this clean, visually aligned funnel layout designed for quick understanding. This presentation breaks your process into clear stages, helping you explain performance, drop-offs, and opportunities with ease. Fully compatible with PowerPoint, Keynote, and Google Slides.


6 diapositivas
Psychology Mind Map Template Presentation
Unlock the brain’s potential with this smart and sleek visual! Perfect for organizing complex concepts, this mind map template helps you visualize psychological theories, thoughts, or data connections in a head-shaped layout using colored hexagons. Easily editable and professionally designed, it works seamlessly in PowerPoint, Keynote, and Google Slides.


5 diapositivas
Multi-Level Concentric Circles Framework Presentation
Visualize relationships and layered strategies with the Multi-Level Concentric Circles Framework Presentation. This template uses interlinked circular nodes to represent multi-tier systems, process flows, or strategic components in an intuitive layout. Easily editable in PowerPoint, Keynote, and Google Slides for seamless integration into your presentations.