


Características


¿Tienes alguna pregunta?
Recomendar

23 diapositivas
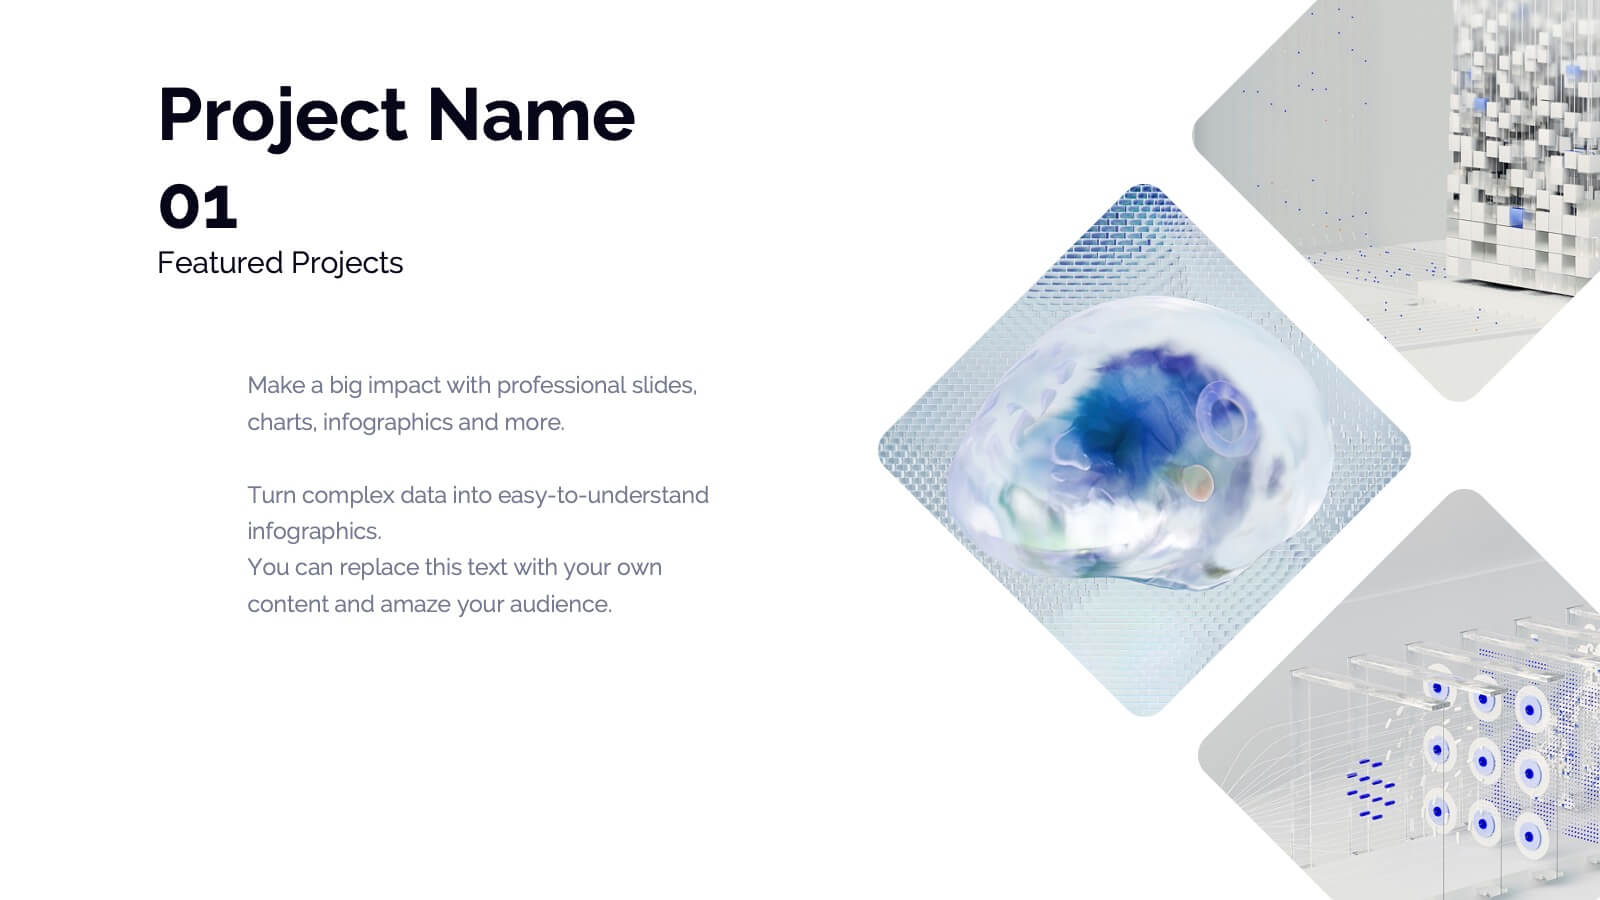
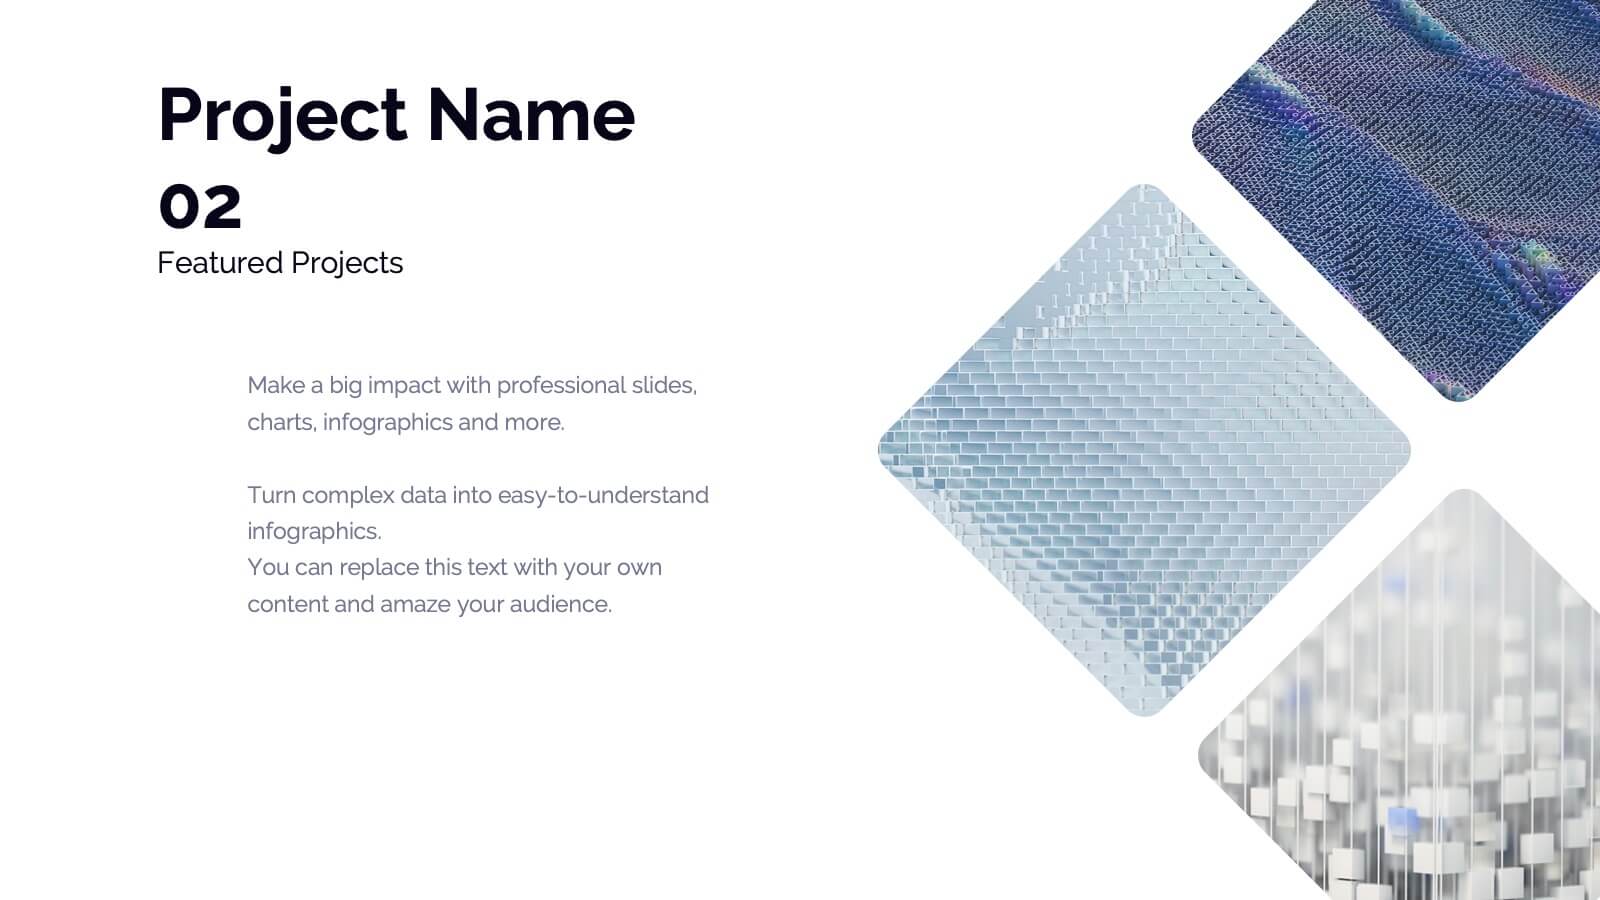
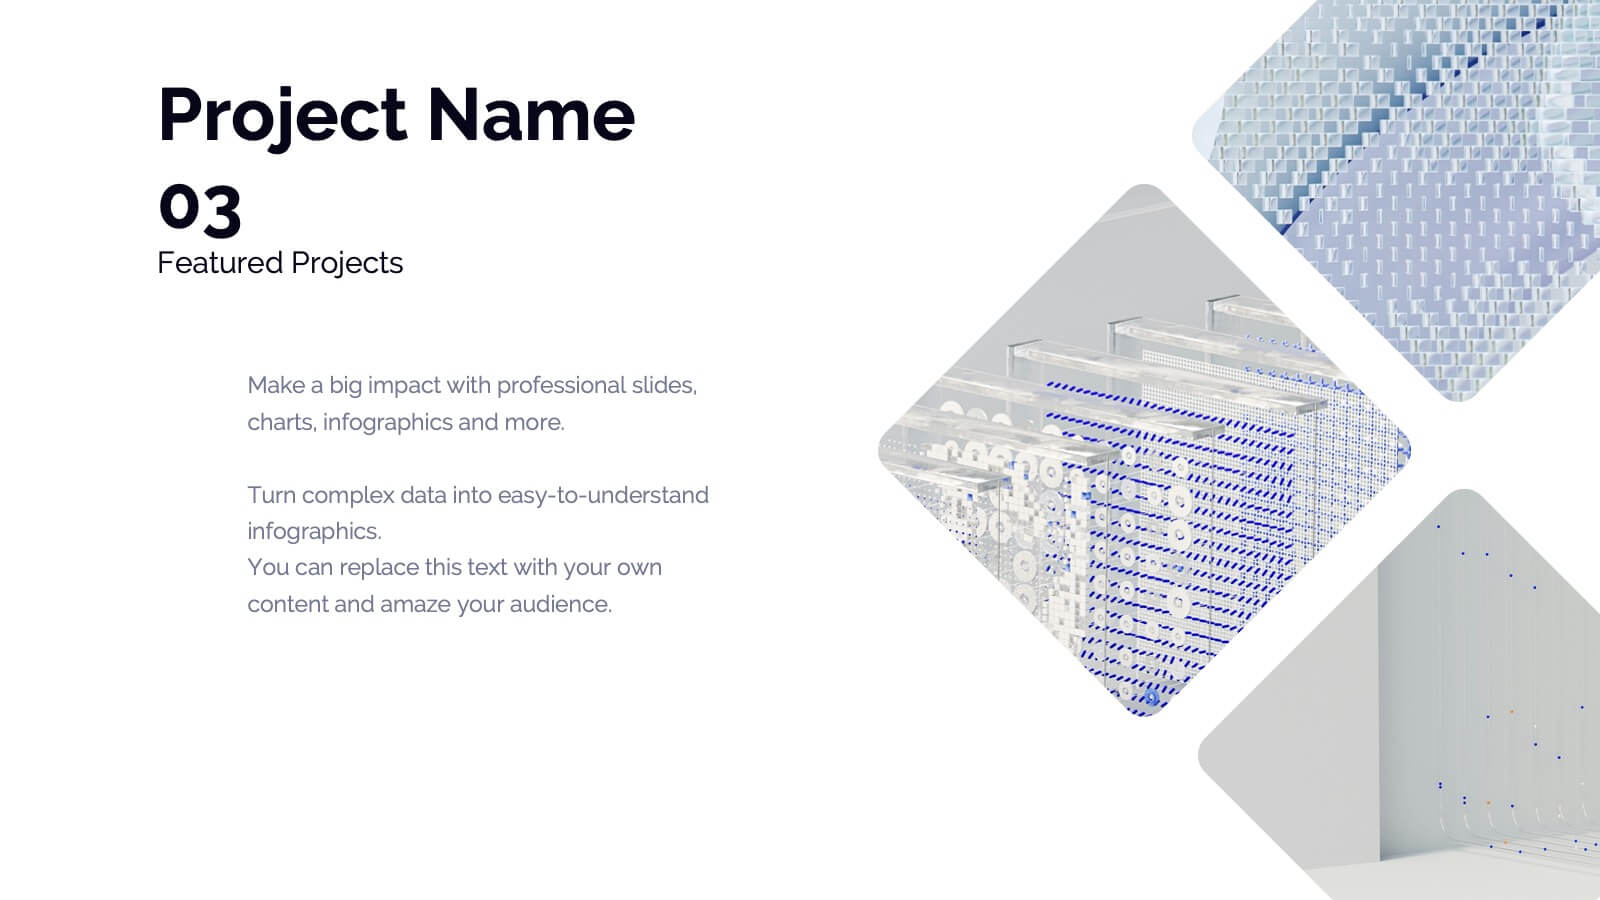
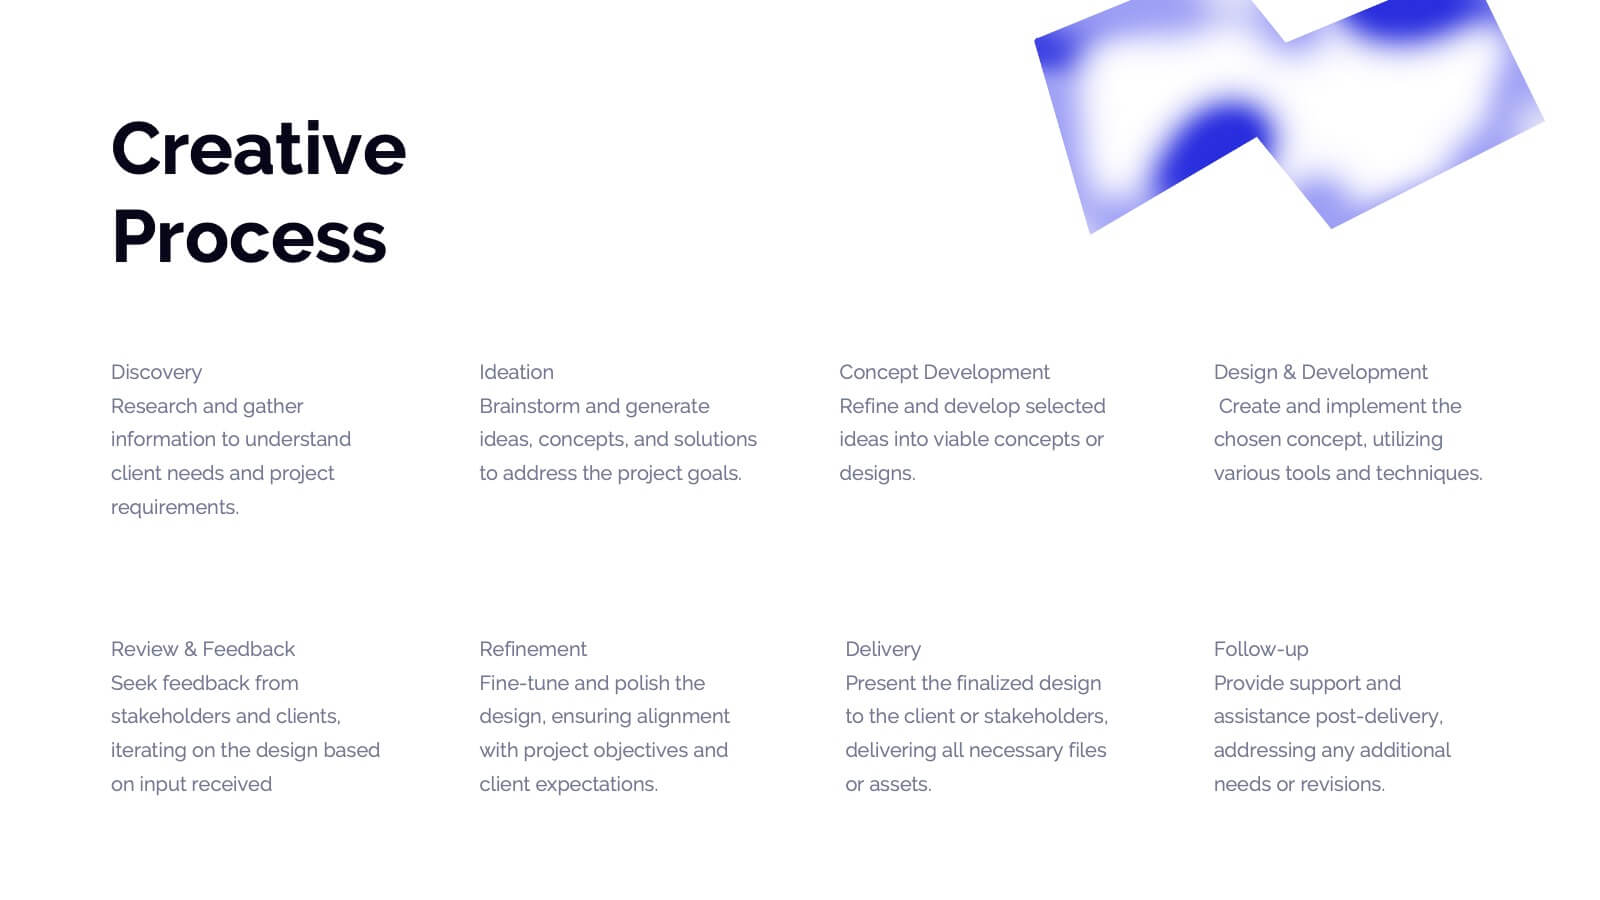
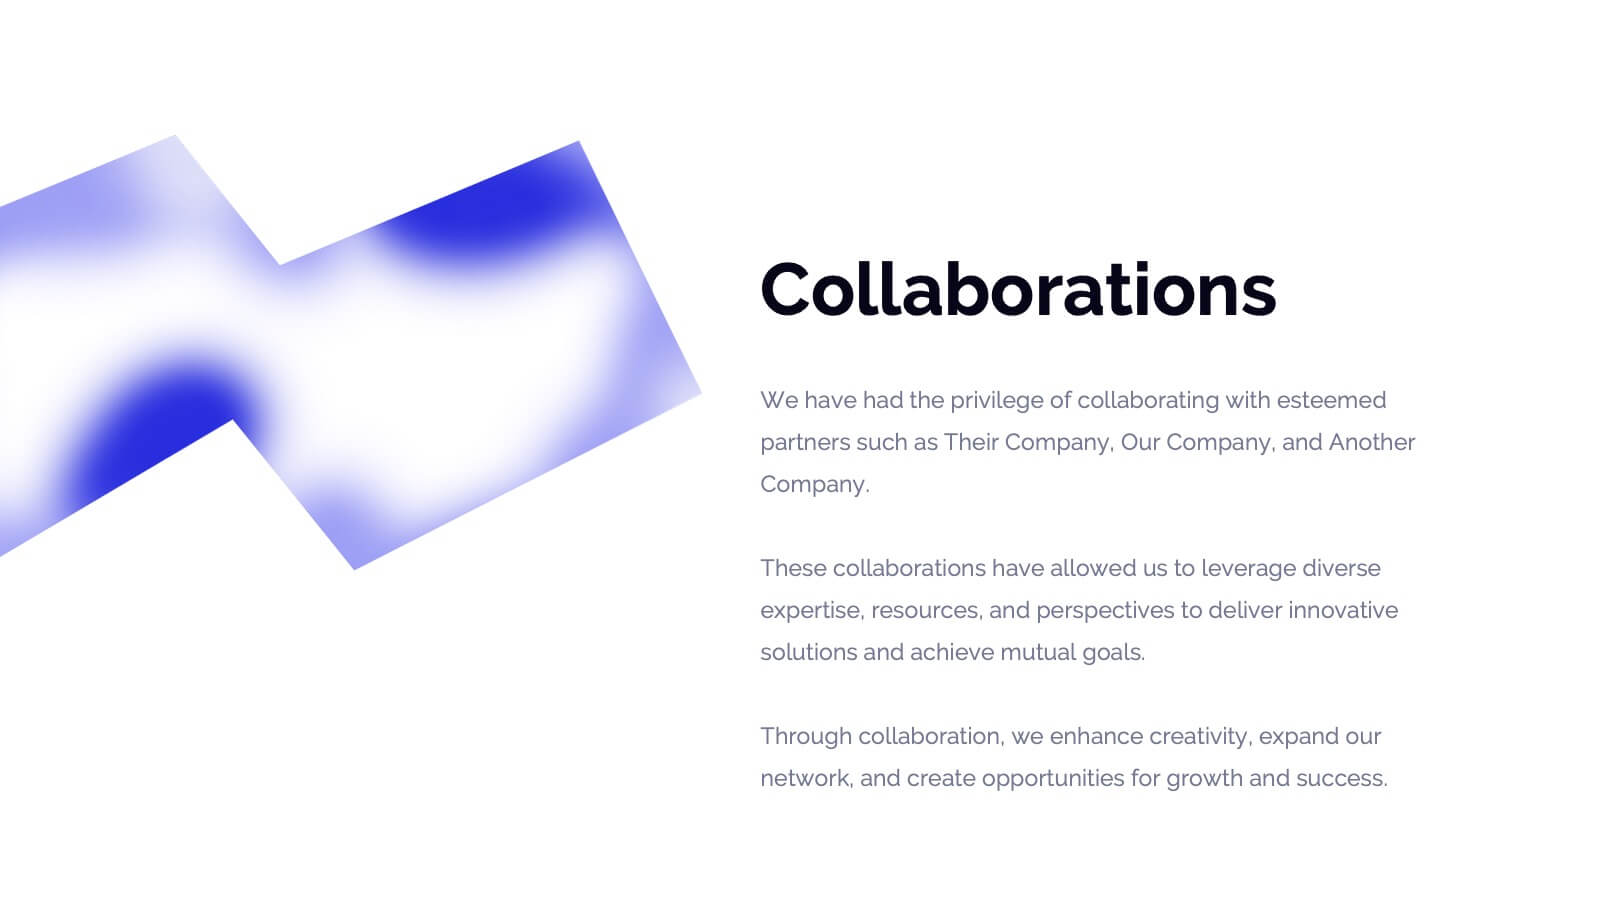
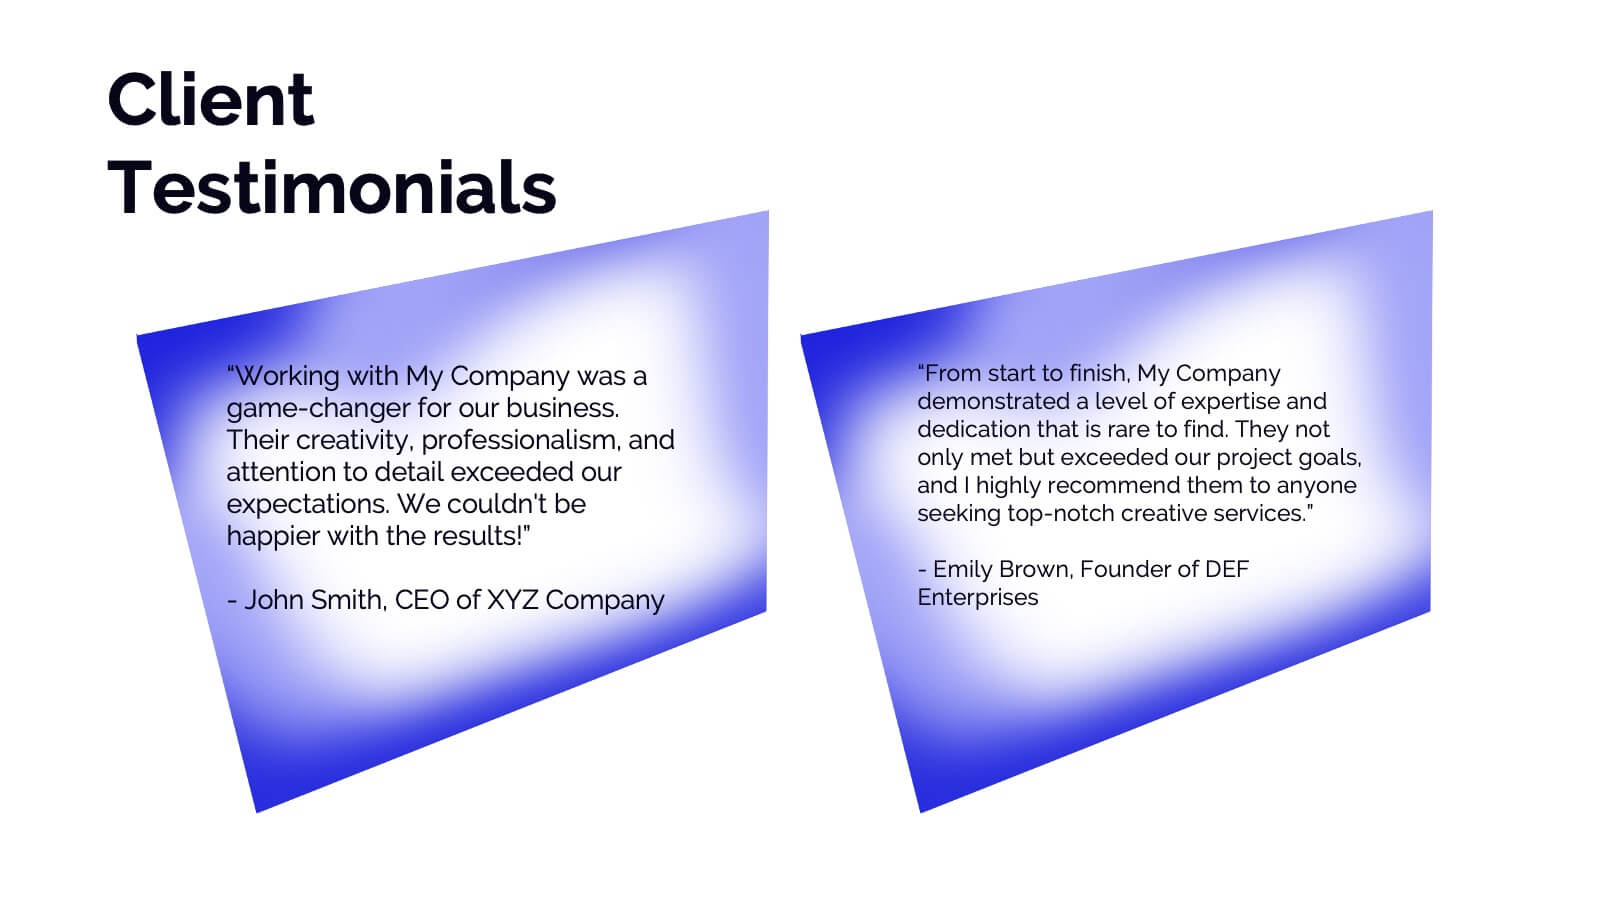
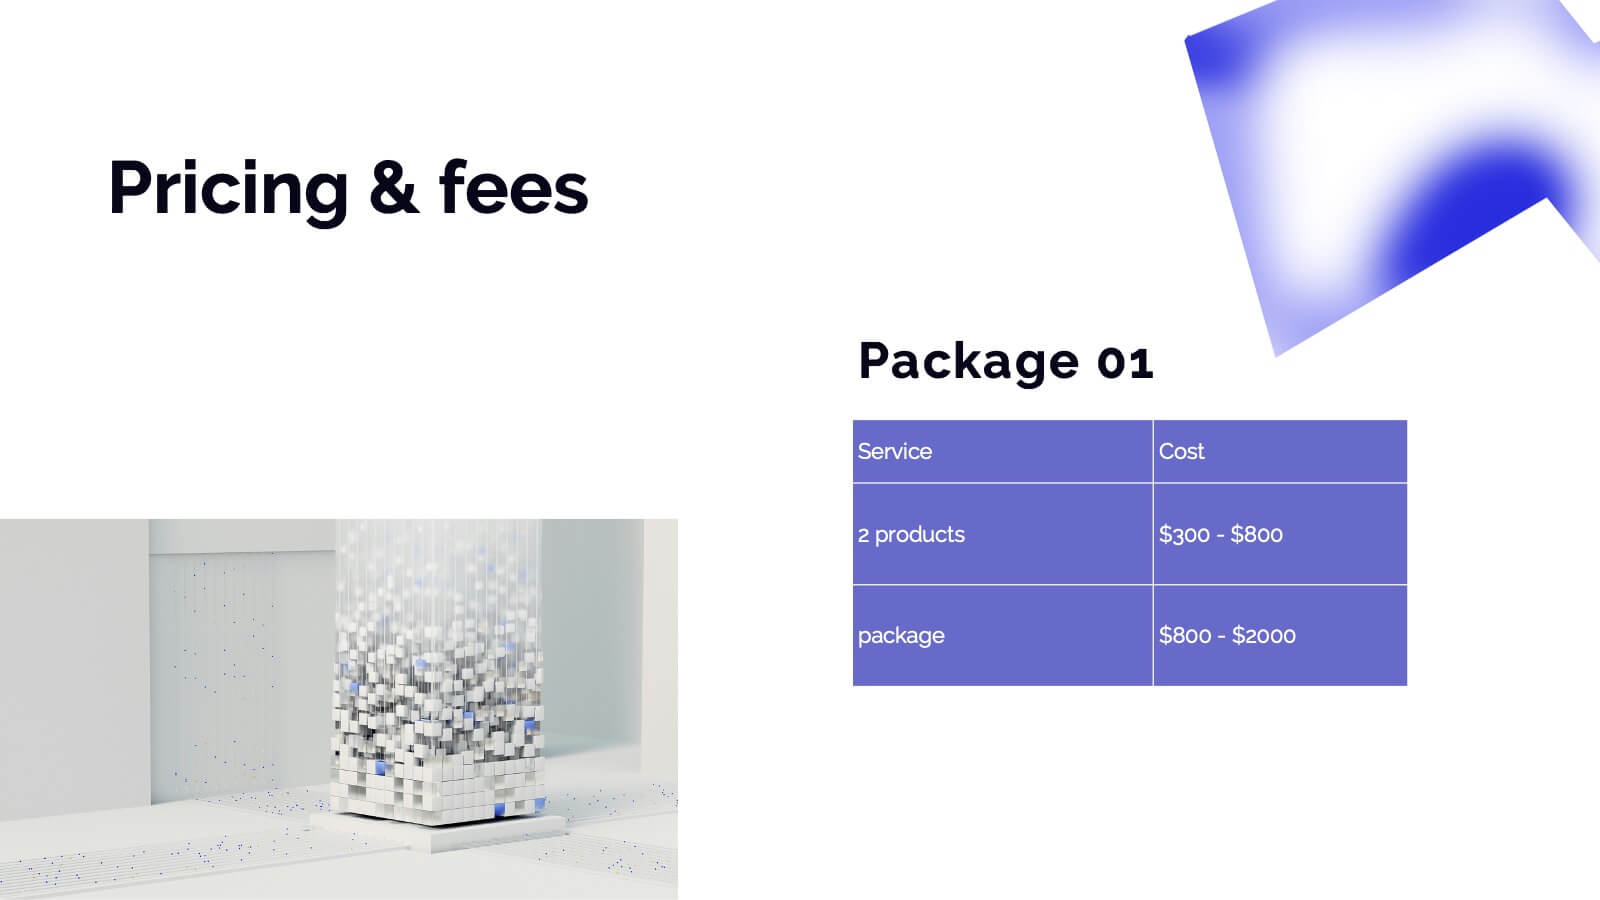
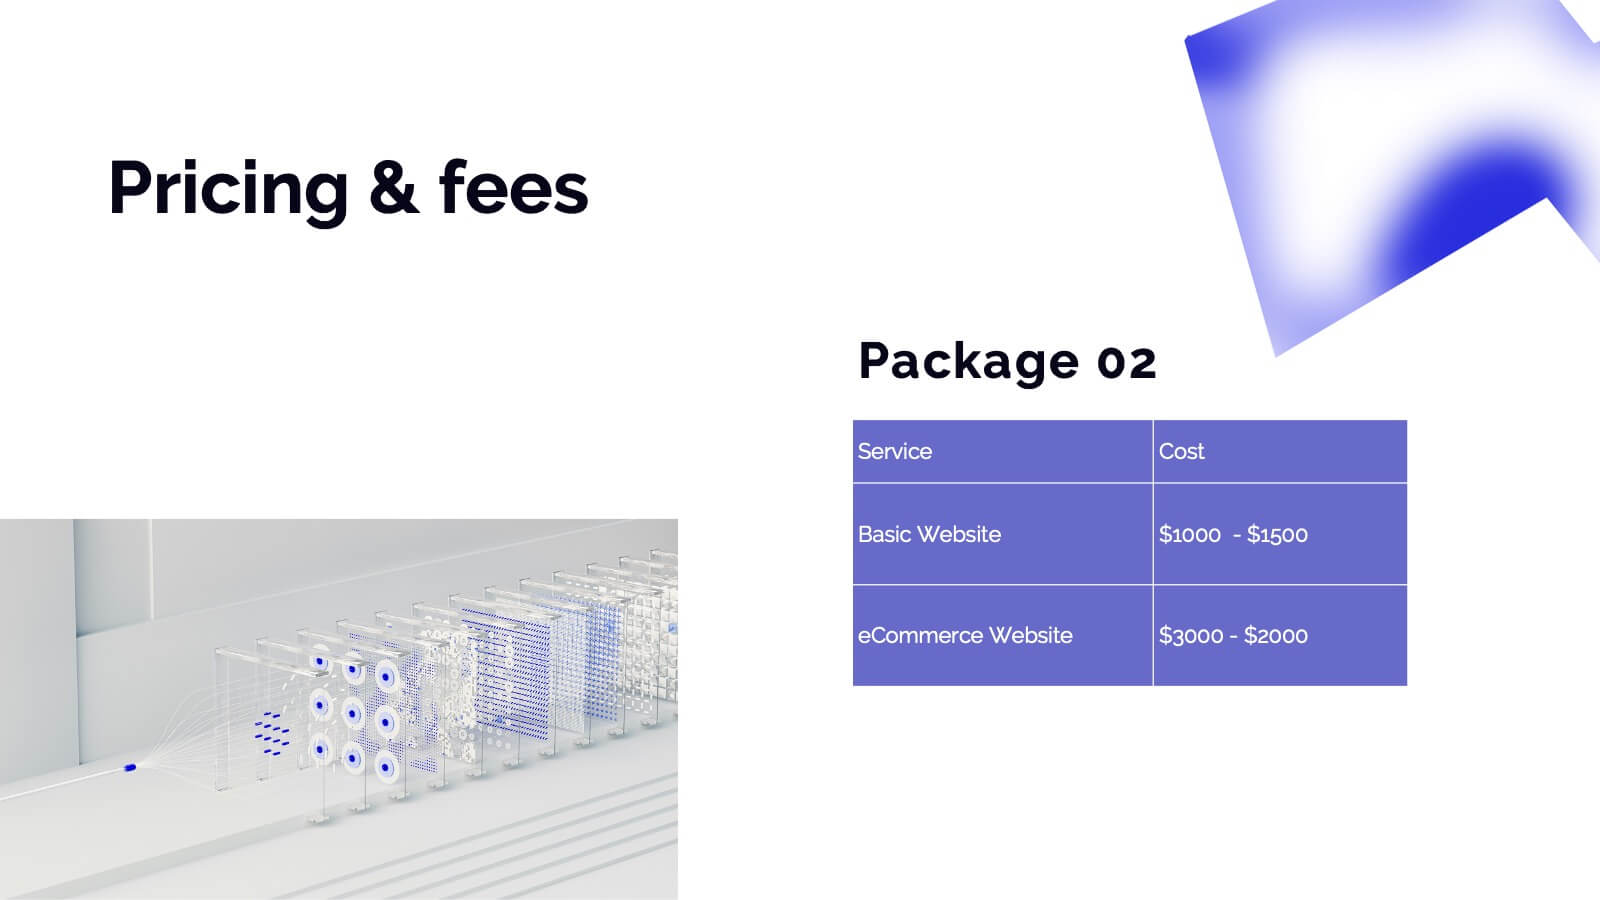
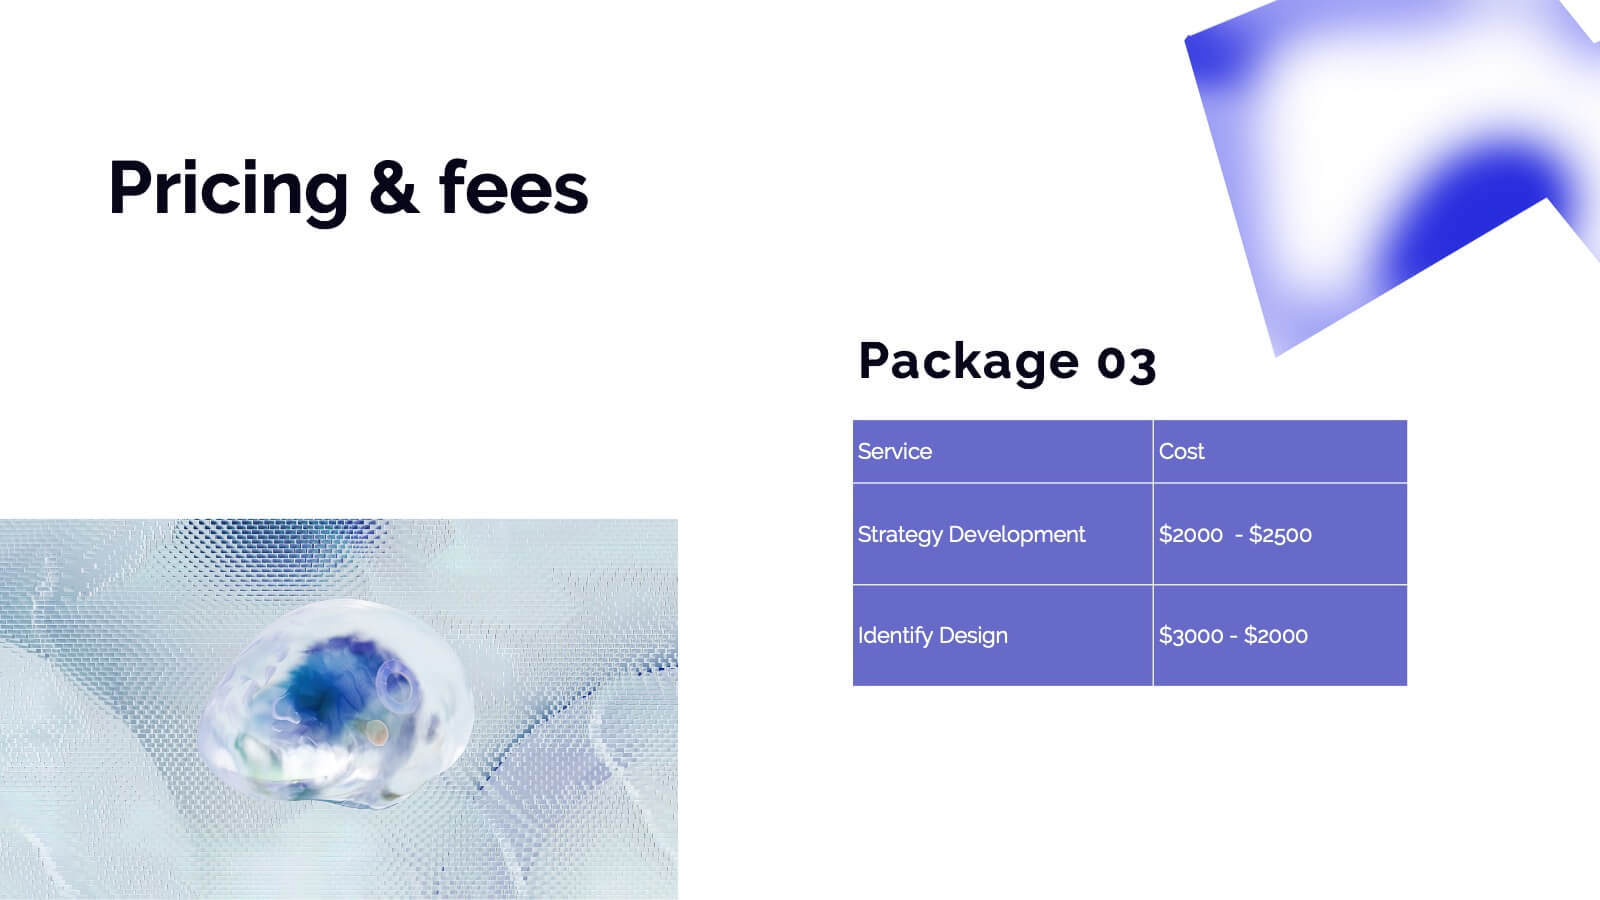
Dryad Photography Portfolio Template Presentation
Showcase your photography skills with this elegant and professional portfolio presentation template! Perfect for highlighting your projects, style, and creative process, this template covers everything from client testimonials to pricing and services offered. It’s ideal for photographers wanting to present their work with style and clarity. Compatible with PowerPoint, Keynote, and Google Slides for effortless sharing and presentations.


7 diapositivas
Future Vision Infographic
Chart a course towards a visionary future with our Future Vision Infographic Template. This dynamic template is designed to help organizations articulate and visualize their long-term goals and strategies in a clear and compelling way. Each slide offers a unique blend of geometric designs and bold color palettes, ideal for engaging stakeholders and inspiring action. Perfect for corporate presentations, strategic meetings, or digital showcases, this template allows you to lay out your vision with precision. It guides viewers through your roadmap to success, highlighting key milestones and the innovative steps you plan to take. Customize each element to echo your organizational identity and values, ensuring that your future aspirations resonate deeply with your audience. Whether you're aiming to motivate your team, attract investors, or inform your partners, our Future Vision template provides a robust foundation for powerful storytelling and strategic clarity.


8 diapositivas
International Data Visualization Map Presentation
Present global data with clarity using this International Data Visualization Map. Highlight regional performance, market share, or user distribution through clean, infographic-style visuals. Ideal for business reports, global strategy updates, or research findings. Fully editable in PowerPoint, Keynote, and Google Slides—designed for sleek, professional storytelling across international audiences.


6 diapositivas
COVID-19 Impact on Business Presentation
Visually communicate the key effects of the pandemic with this clean and engaging slide layout. Featuring a central storefront icon surrounded by six customizable virus-themed icons, this design allows you to outline critical changes, challenges, or strategic shifts. Ideal for presentations on crisis management, business continuity, or recovery planning. Fully editable in PowerPoint, Keynote, and Google Slides.


8 diapositivas
Blue Ocean Strategy Business Model Presentation
Chart unexplored market territories with our Blue Ocean Strategy Business Model template! This dynamic presentation tool, designed to simplify complex business strategies, illustrates the pivotal elements of cost reduction and value innovation to unlock new buyer value. Compatible with PowerPoint, Keynote, and Google Slides, it's ideal for strategists aiming to create uncontested market spaces and make competition irrelevant. Perfect for workshops, business meetings, or strategy sessions.


2 diapositivas
Small Business Success Illustrations
Get your business on the right track with our small business success illustrations pack! These illustrations will help you with your next business presentation and make it more engaging and catchy. Fully compatible with Powerpoint, Keynote, and Google Slides. You can use these in your website, blog or social media posts. Turn your vision into a reality—download the small business success illustrations pack today!


5 diapositivas
Types of Natural Disasters Infographics
Immerse in the dynamic realm of nature with our types of natural disasters infographics. Utilizing an earthy color scheme of blue, tan, and red, this template plunges viewers into the heart of environmental extremities. It's an invaluable resource for educators, students, and environmentalists. Compatible with Powerpoint, Keynote, and Google Slides. The design, brimming with creative vigor, incorporates striking graphics and icons, offering a vivid exploration of the various forces that shape our planet. This compilation doesn't just inform but captivates, turning statistics and data into compelling storytelling.


7 diapositivas
PESTEL Market Analysis Infographic
PESTEL analysis is a crucial framework for comprehending the macro-environmental factors influencing a market. Our PESTEL market analysis infographic, rendered in lively shades of green and orange against a pristine white backdrop, provides a concise yet comprehensive overview of Political, Economic, Social, Technological, Environmental, and Legal aspects. Specifically tailored for business analysts, strategists, and market researchers, this template serves as a vibrant visual guide for dissecting the external market environment. With compatibility spanning PowerPoint, Keynote, and Google Slides, it promises a dynamic addition to your market analysis presentations.


19 diapositivas
Prism Design Strategy Proposal Presentation
Bring your design strategy to life with this modern and stylish presentation template! Perfect for showcasing your design concepts, processes, and elements, this template ensures that your ideas are communicated effectively. With a sleek layout for design briefs, mood boards, prototypes, and project timelines, it's the ideal tool for creative professionals. Customize it easily in PowerPoint, Keynote, or Google Slides to make a lasting impression on your audience.


10 diapositivas
Profitability and Cost Analysis
Streamline your financial storytelling with this interlinked diagram template. Designed for business consultants, CFOs, and analysts, it helps visualize cost components and profit drivers across five stages. Each segment is clearly labeled and color-coded for easy comprehension. Fully customizable in PowerPoint, Keynote, and Google Slides.


34 diapositivas
Saas Startup
A Saas Startup refers to a startup company that offers software as a service as its primary business model. It is a software licensing and delivery model in which software applications are provided over the internet, and users can access them through a web browser without needing to install the software locally. This template is designed with a bold and dynamic color palette, perfect for business models that want to convey a sense of innovation and excitement. The Customizable slides grab attention and create a sense of excitement. They showcase your product, features, benefits, market analysis, and growth strategy.


5 diapositivas
Product Development Empathy Mapping
Bridge the gap between user insight and product success. This empathy mapping slide is perfect for product development teams to capture what users see, hear, think, feel, and experience—along with their pains and gains. Fully customizable and compatible with PowerPoint, Keynote, and Google Slides.


5 diapositivas
Buyer Journey Infographic Presentation
Understanding how buyers move from awareness to action becomes effortless with this clean, visual presentation. It guides you through each stage, helping you explain behaviors, insights, and touchpoints with clarity. Easy to customize and fully compatible with PowerPoint, Keynote, and Google Slides.


5 diapositivas
Growth and Expansion Scale Model Presentation
Visualize your business growth with the Growth and Expansion Scale Model presentation. This template is designed to illustrate strategic progress, scaling efforts, and key milestones in business development. Ideal for executives, entrepreneurs, and business strategists, it offers customizable elements to align with your objectives. Fully compatible with PowerPoint, Keynote, and Google Slides.


7 diapositivas
Blue Ocean Summary Infographic
Blue Ocean Strategy encourages businesses to innovate in ways that stand out in the market, often by challenging traditional assumptions and industry norms. This infographic template is a bold, dynamic visual tool designed to chart unexplored territories and navigate the strategic depths of blue ocean thinking. Dive into this infographic to discover a world of untapped opportunities and unlock the keys to innovation and market success. Compatible with Powerpoint, Keynote, and Google Slides. Prepare to conquer new market territories, leave competition in your wake, and sail towards uncharted success with our Blue Ocean Summary Infographic.


5 diapositivas
Campaign Funnel & Outreach Strategy Presentation
Present your marketing funnel clearly with this layered funnel chart design. Ideal for outlining awareness, engagement, and conversion stages, this slide helps visualize outreach strategies effectively. Fully editable in PowerPoint, Keynote, and Google Slides—perfect for campaign overviews, marketing reports, or client presentations that require structured, strategic communication.
20 diapositivas
Beacon Content Marketing Pitch Deck Presentation
Ignite your marketing strategies with this dynamic and sleek content marketing pitch deck! Filled with modern design and comprehensive insights, this template is perfect for showcasing trends, influencer marketing, and emerging technologies. Make your brand's story stand out while captivating your audience. Fully compatible with PowerPoint, Keynote, and Google Slides!