


Características


¿Tienes alguna pregunta?
Recomendar


10 diapositivas
Business Relationship Management Presentation
Navigate the nuances of professional partnerships with the "Business Relationship Management" presentation templates. These layouts offer a structured approach to delineating the roles and interactions within business relationships, making them an essential tool for managers and team leaders. Designed to be compatible with PowerPoint, Keynote, and Google Slides, these templates provide a clear pathway for discussing and managing business relationships effectively.


3 diapositivas
Business Ethics and Legal Guidelines Presentation
Navigate the complexities of corporate governance with the "Business Ethics and Legal Guidelines" template, designed to simplify and clarify the presentation of legal standards and ethical expectations in business environments.This visually engaging layout helps emphasize the progression and importance of each principle, ensuring clarity in communication. Ideal for training modules, compliance meetings, or strategic planning sessions, it's compatible with PowerPoint, Keynote, and Google Slides.


5 diapositivas
Food Industry Trends Presentation
Stay ahead of the curve with this visual presentation designed to spotlight key developments in the food industry. Featuring a creative pie chart integrated with food icons and utensils, this layout is perfect for data storytelling, market insights, or trend analysis. Fully editable in PowerPoint, Keynote, and Google Slides.


12 diapositivas
Business Issue Root Cause Identification Presentation
Pinpoint Business Challenges with Precision using this Business Issue Root Cause Identification presentation template. Designed to uncover underlying problems efficiently, this template features structured visuals, hierarchical frameworks, and clear labeling to facilitate root cause analysis. Whether you're a business strategist, operations manager, or consultant, this template helps identify, analyze, and resolve critical business issues. Fully customizable and compatible with PowerPoint, Keynote, and Google Slides, ensuring a seamless and professional presentation experience.


4 diapositivas
Corporate Planning and Analysis Presentation
Simplify strategic discussions with this Corporate Planning and Analysis Presentation. Featuring a circular 4-piece puzzle diagram, each section highlights a different business focus area using icons and color coding. Ideal for illustrating synergy between departments or initiatives. Fully customizable in PowerPoint, Keynote, and Google Slides.


6 diapositivas
Timeline Planning with Gantt Layout Presentation
Organize your schedules clearly with this Timeline Planning with Gantt Layout presentation. Designed for efficient project tracking, this template breaks down tasks across phases and months, using a clean horizontal bar layout. Perfect for teams, planners, and managers. Fully editable in Canva, PowerPoint, and Google Slides to suit any workflow.


6 diapositivas
Execution Phase and Follow-up Steps Presentation
Make your process crystal clear with the Execution Phase and Follow-up Steps Presentation. Featuring a dynamic six-step linked chain design, this template is ideal for showcasing sequential workflows, project lifecycles, or task dependencies. Each step is color-coded with icons to enhance clarity and engagement. Fully customizable in PowerPoint, Keynote, and Google Slides.


5 diapositivas
Sub-Saharan Africa Region Presentation
Showcase regional insights with a sleek, professional map highlighting key areas across Africa’s southern nations. Ideal for presenting economic data, development initiatives, or regional comparisons, this layout balances clarity with visual impact. Fully compatible with PowerPoint, Keynote, and Google Slides for smooth editing and impactful presentations.


7 diapositivas
Job Objective Infographic Presentation
A Job Objective is an introduction that summarizes an individual's career goals and objectives. This Template is designed to create a visual experience with a focus of solving your objectives, showcasing your expertise and individuality. Use this infographic to help you visually communicate your knowledge and skills with a powerful presentation. Highlight your experience, skills and key achievements. You can edit the graphics, photos, data and text in this template so that it fits your needs perfectly. All you have to do is just download this template in PowerPoint, Keynote, or Google Slides.


23 diapositivas
Quest Corporate Strategy Proposal Presentation
Unlock success with this powerful corporate strategy template! Detail strategic objectives, market trends, and growth opportunities. Ideal for business leaders aiming to drive growth. Compatible with PowerPoint, Keynote, and Google Slides, this template ensures your strategy is clear, professional, and compelling. Make your vision a reality with impactful presentations.


7 diapositivas
Online Meeting Infographic
Online meetings, also known as virtual meetings or web meetings, are gatherings or discussions that take place over the internet, enabling participants to communicate, collaborate, and interact with each other remotely. This infographic template is a great way to streamline the process and enhance the efficiency of virtual meetings. This template aims to provide a comprehensive guide to conducting effective online meetings. Compatible with Powerpoint, Keynote, and Google Slides. Customize the content and design to suit your specific needs and ensure your online meetings are efficient, engaging, and productive.


7 diapositivas
Future Vision Infographic
Chart a course towards a visionary future with our Future Vision Infographic Template. This dynamic template is designed to help organizations articulate and visualize their long-term goals and strategies in a clear and compelling way. Each slide offers a unique blend of geometric designs and bold color palettes, ideal for engaging stakeholders and inspiring action. Perfect for corporate presentations, strategic meetings, or digital showcases, this template allows you to lay out your vision with precision. It guides viewers through your roadmap to success, highlighting key milestones and the innovative steps you plan to take. Customize each element to echo your organizational identity and values, ensuring that your future aspirations resonate deeply with your audience. Whether you're aiming to motivate your team, attract investors, or inform your partners, our Future Vision template provides a robust foundation for powerful storytelling and strategic clarity.


6 diapositivas
Annual Scheduling with Calendar Milestones Presentation
Make your year feel like a well-oiled machine with this bold, color-coded visual layout. It helps you map out project phases, monthly milestones, and long-term plans with clarity and structure. Ideal for strategy meetings or annual reviews, this editable template works seamlessly in PowerPoint, Keynote, and Google Slides.


5 diapositivas
Healthcare Industry Report
Deliver key medical insights with this modern, stethoscope-themed slide. Ideal for showcasing health metrics, clinical data, or medical updates, the layout includes four sections with health icons and clear callouts for easy readability. Fully customizable in PowerPoint, Keynote, and Google Slides.


5 diapositivas
Hierarchical Pyramid Diagram Presentation
The "Hierarchical Pyramid Diagram Presentation" template is designed to effectively represent organizational structures, data hierarchies, or step-by-step processes. This versatile template features a layered pyramid structure, enabling clear visualization of relationships and dependencies between different levels or components within a system. Ideal for business presentations, strategy discussions, and educational materials, this template aids in conveying complex information in a straightforward and visually appealing manner. The use of distinct colors for each level enhances readability, making it easier to identify and discuss each segment in detail during presentations.


22 diapositivas
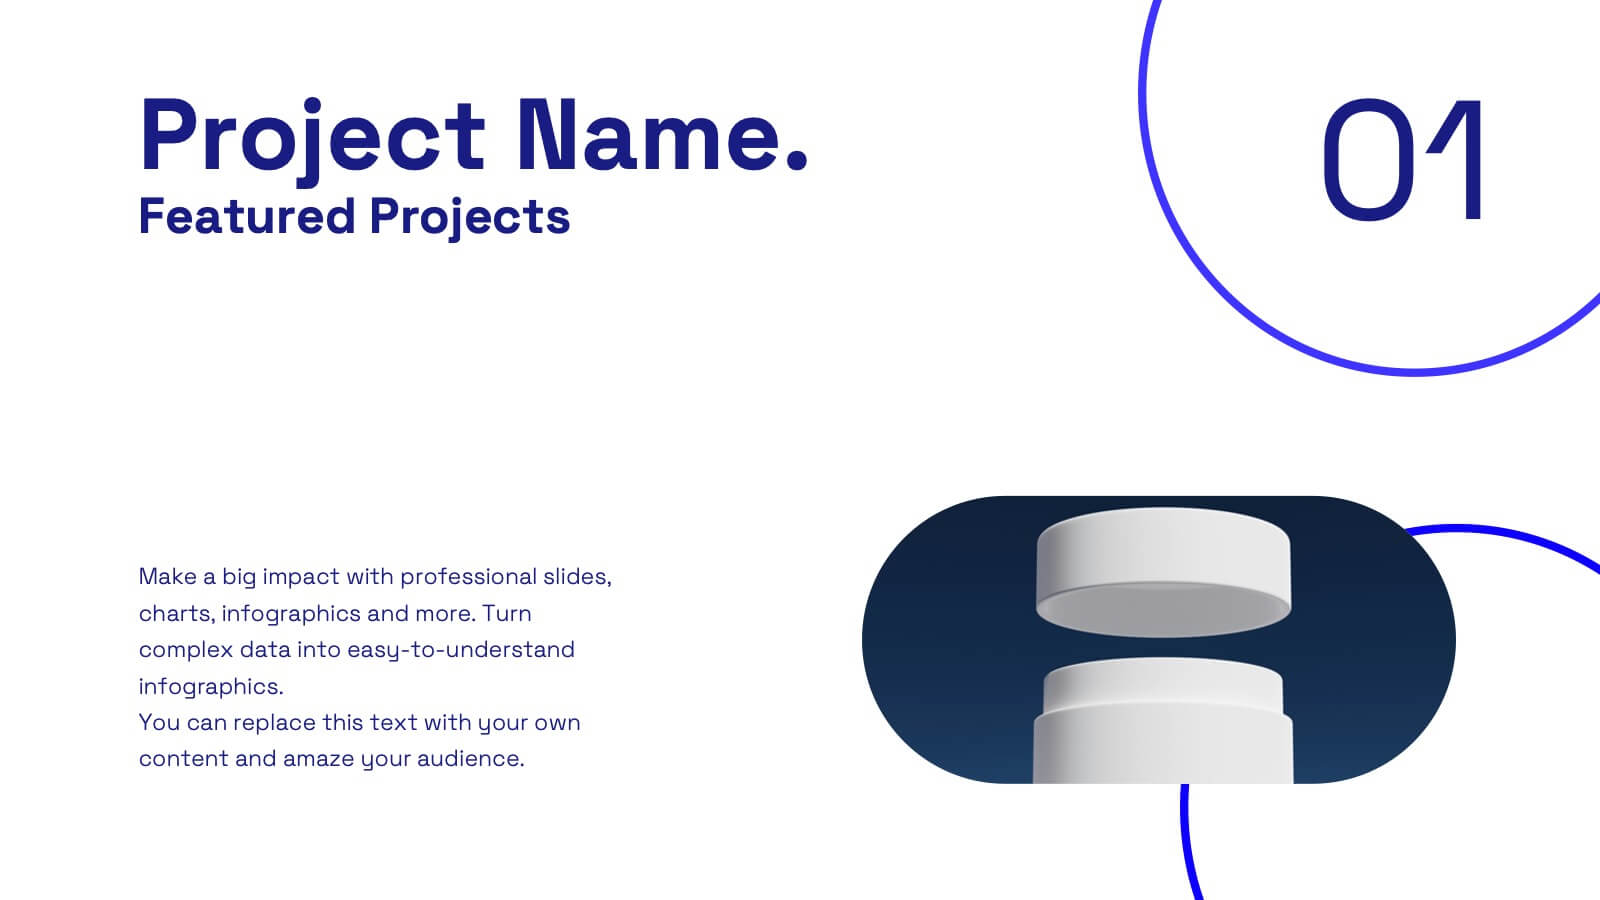
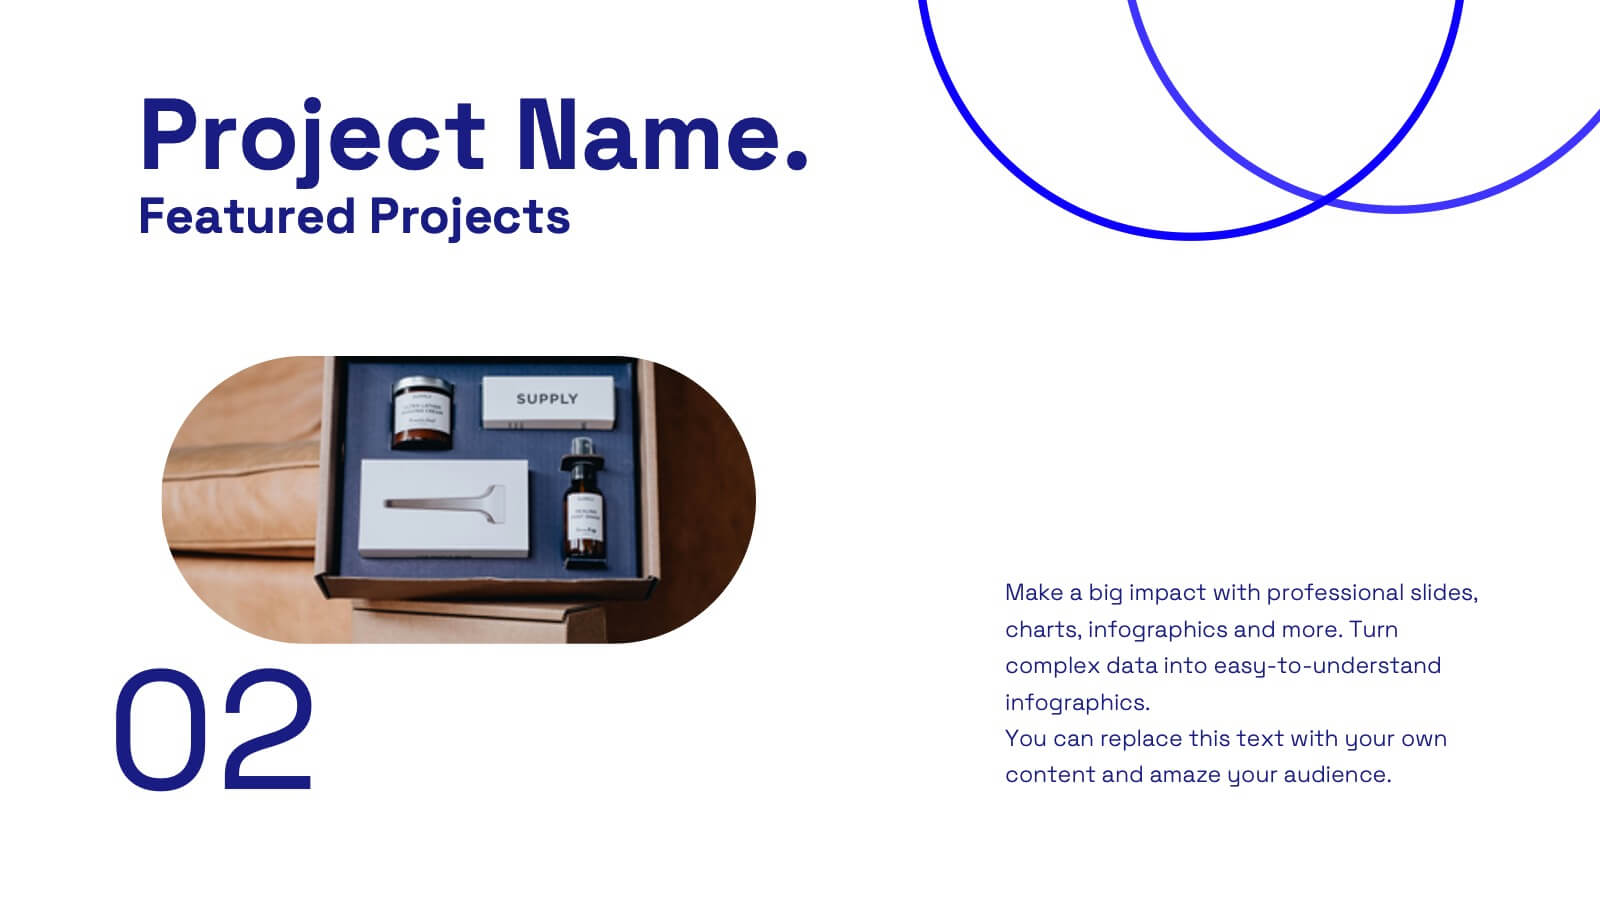
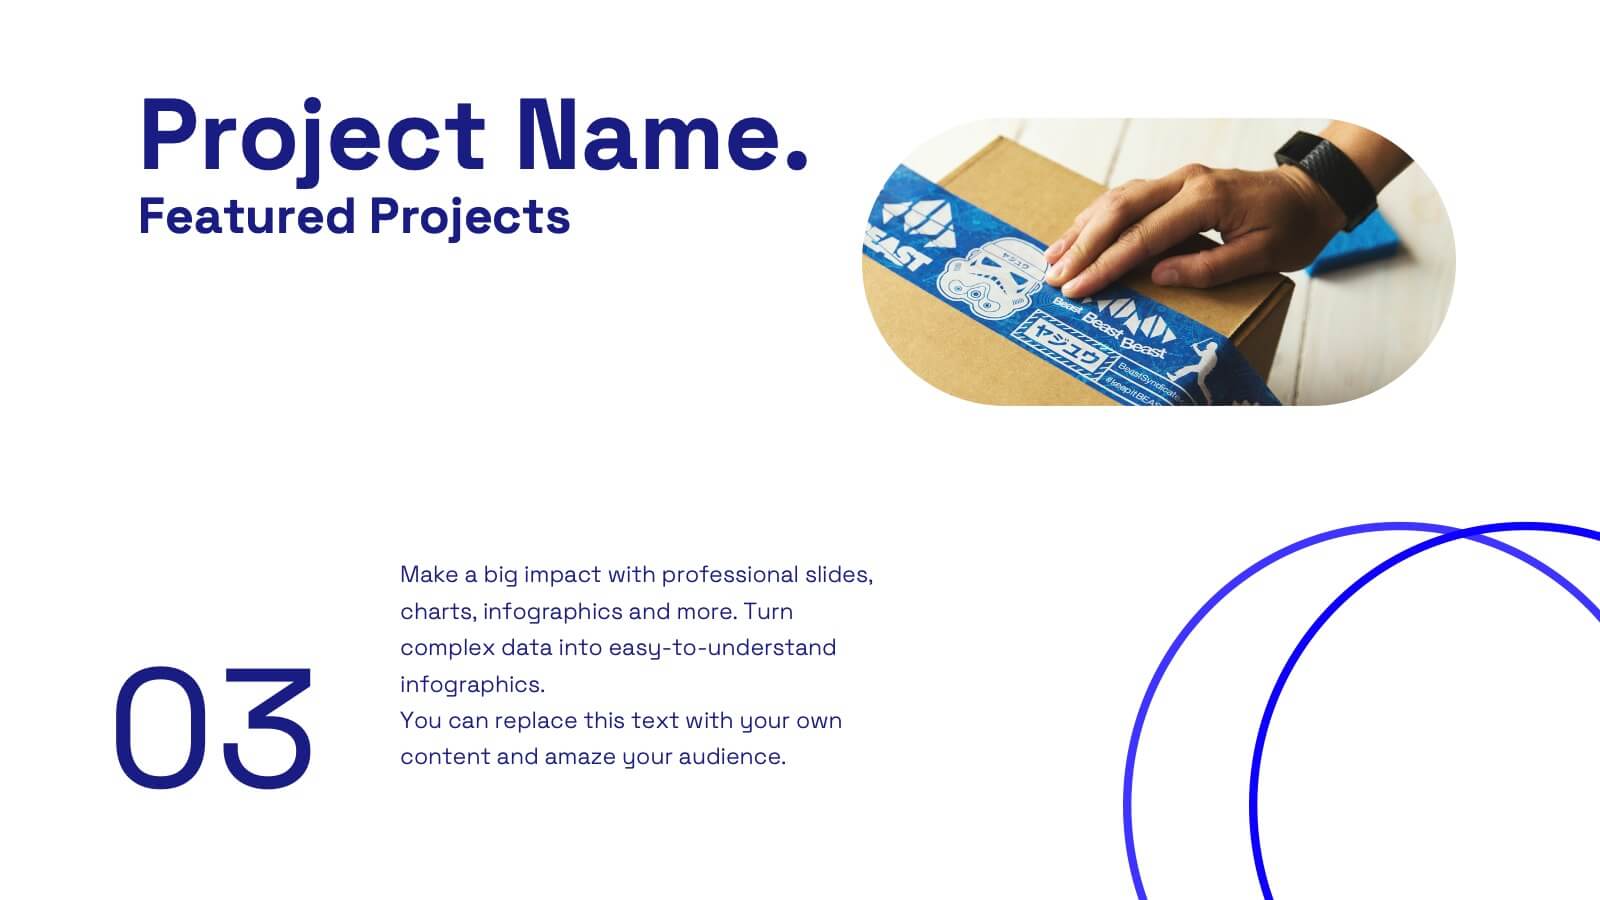
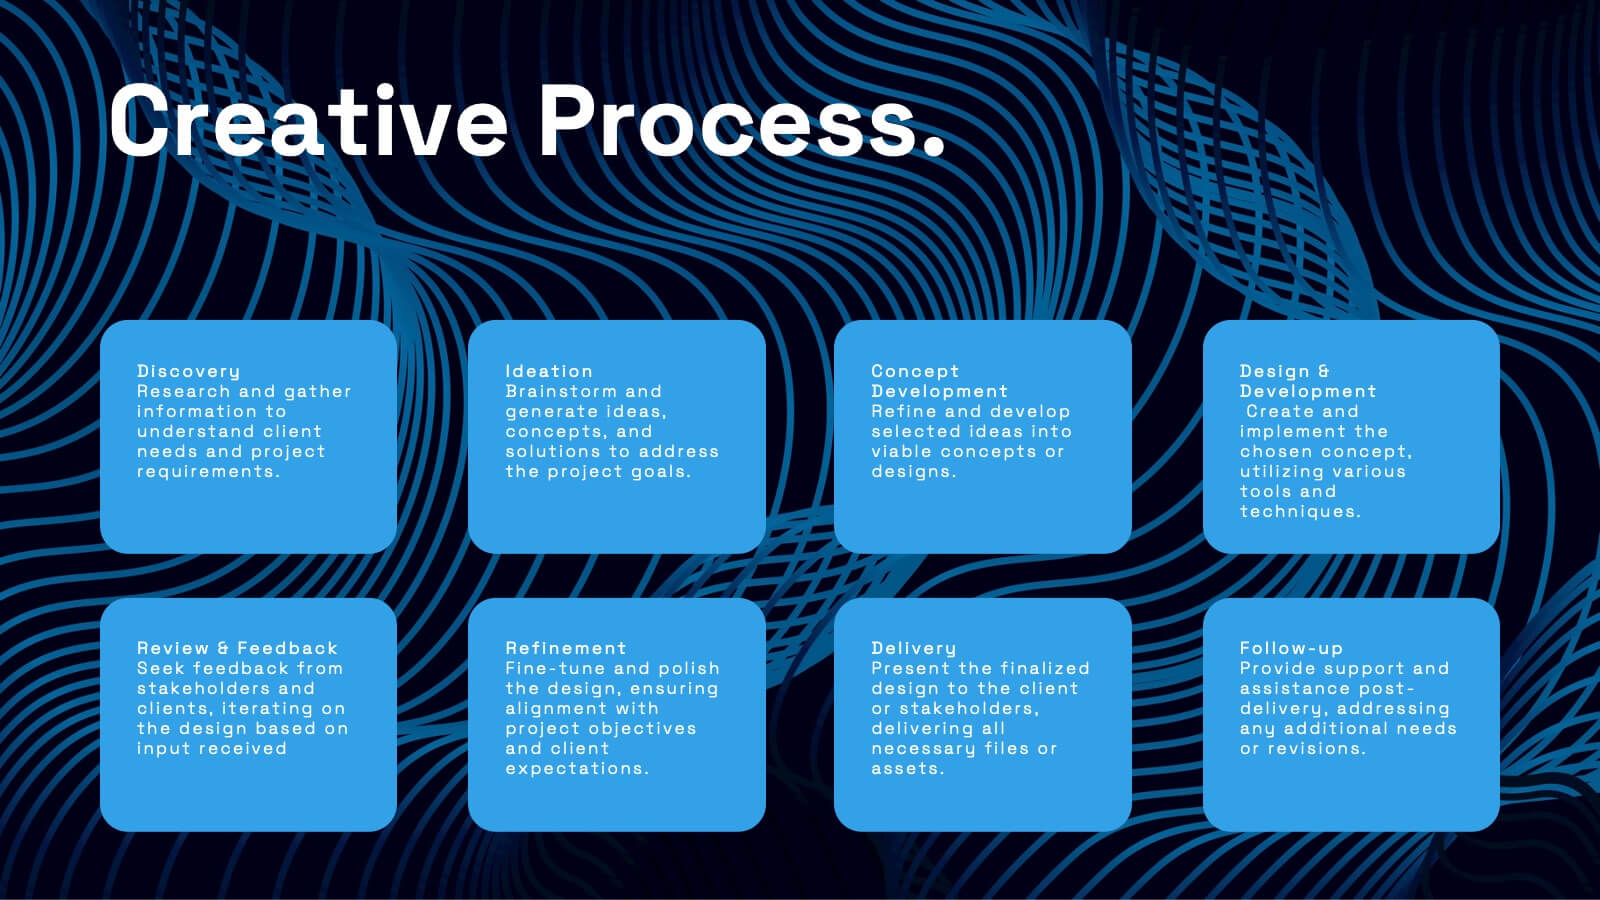
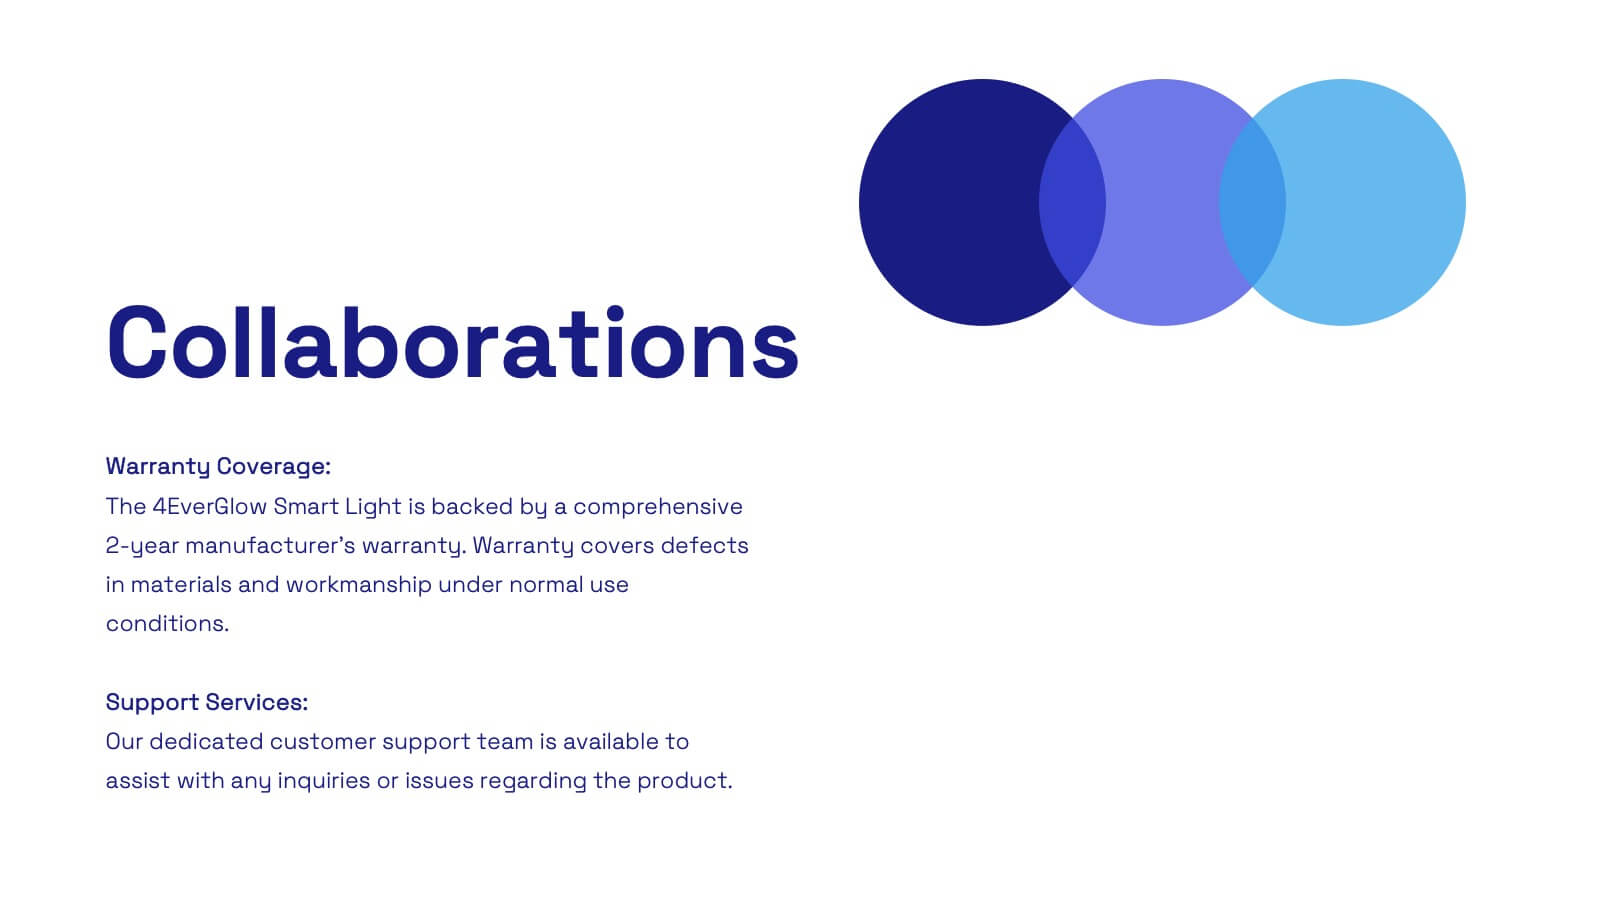
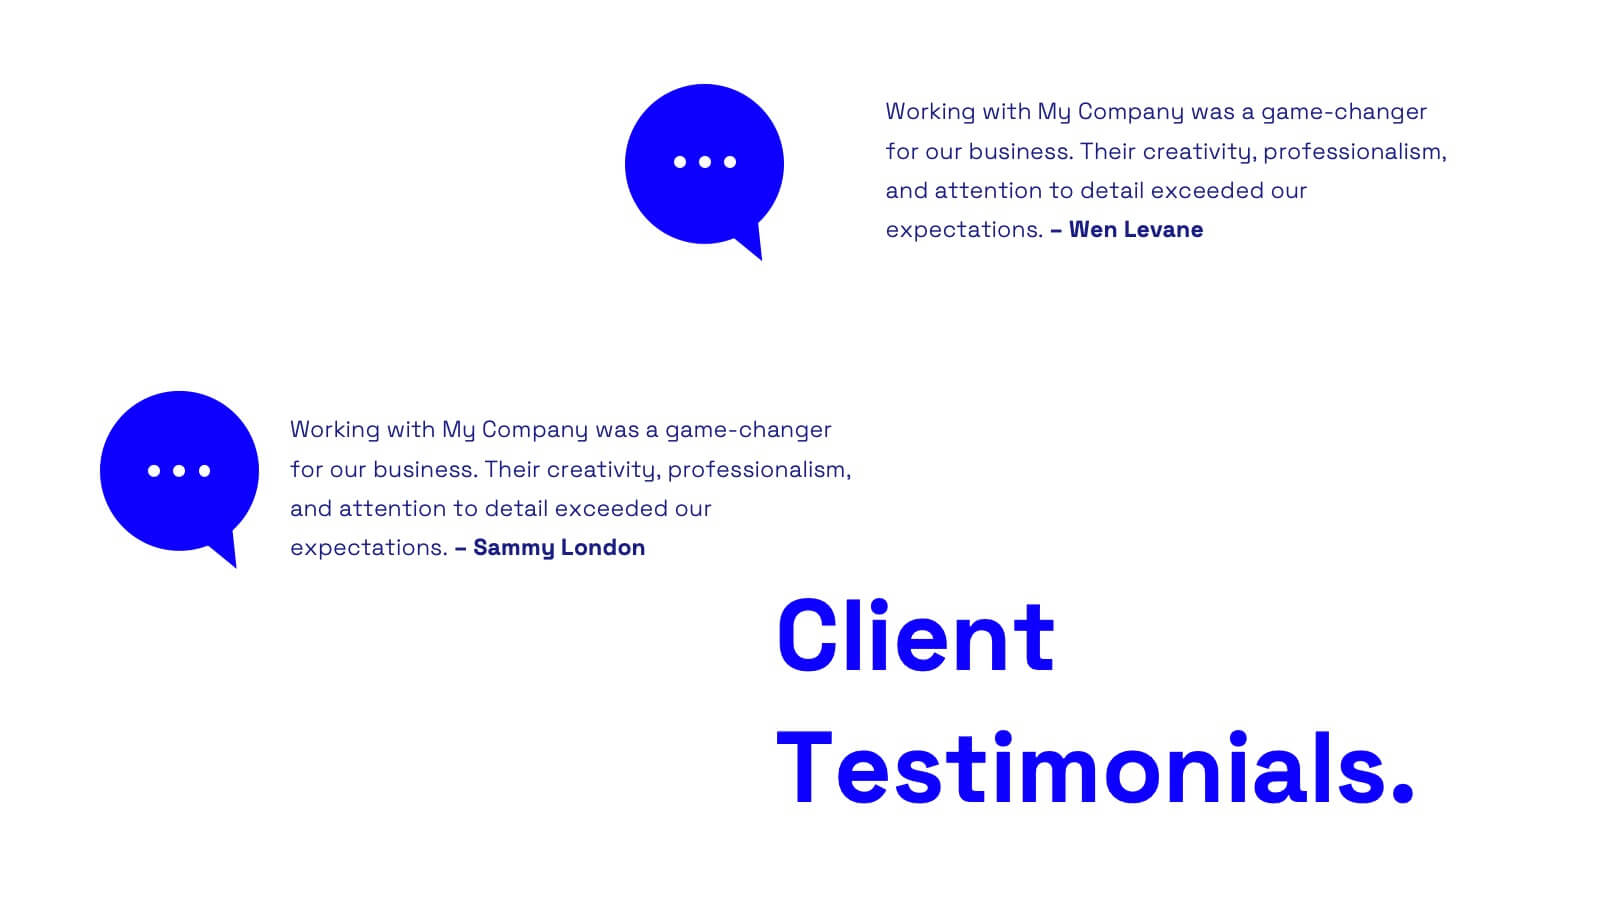
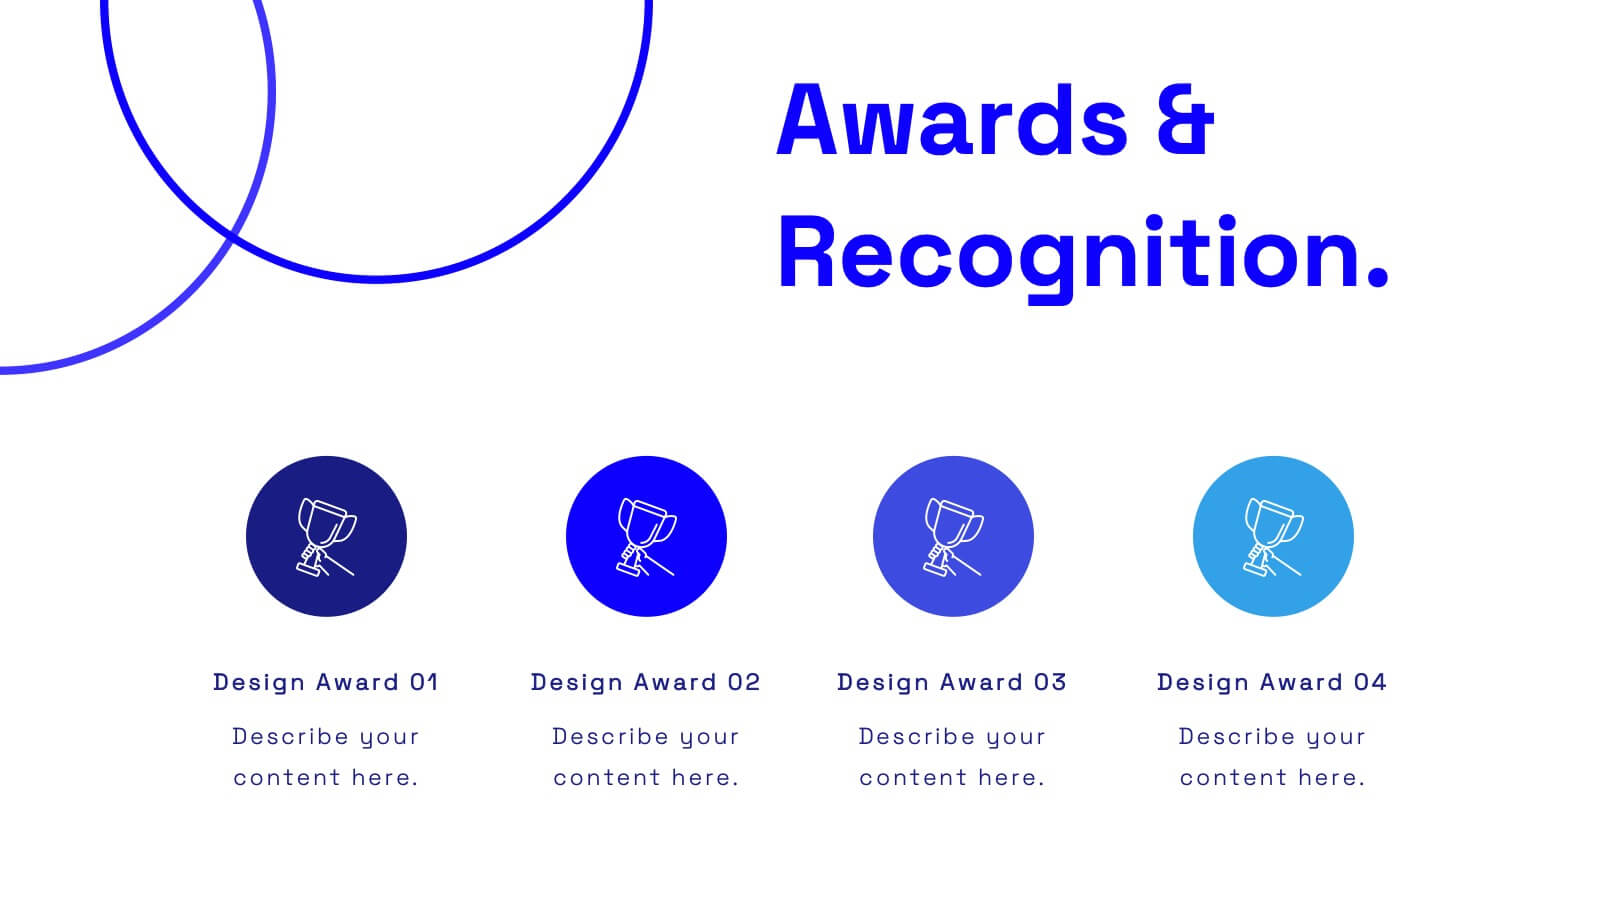
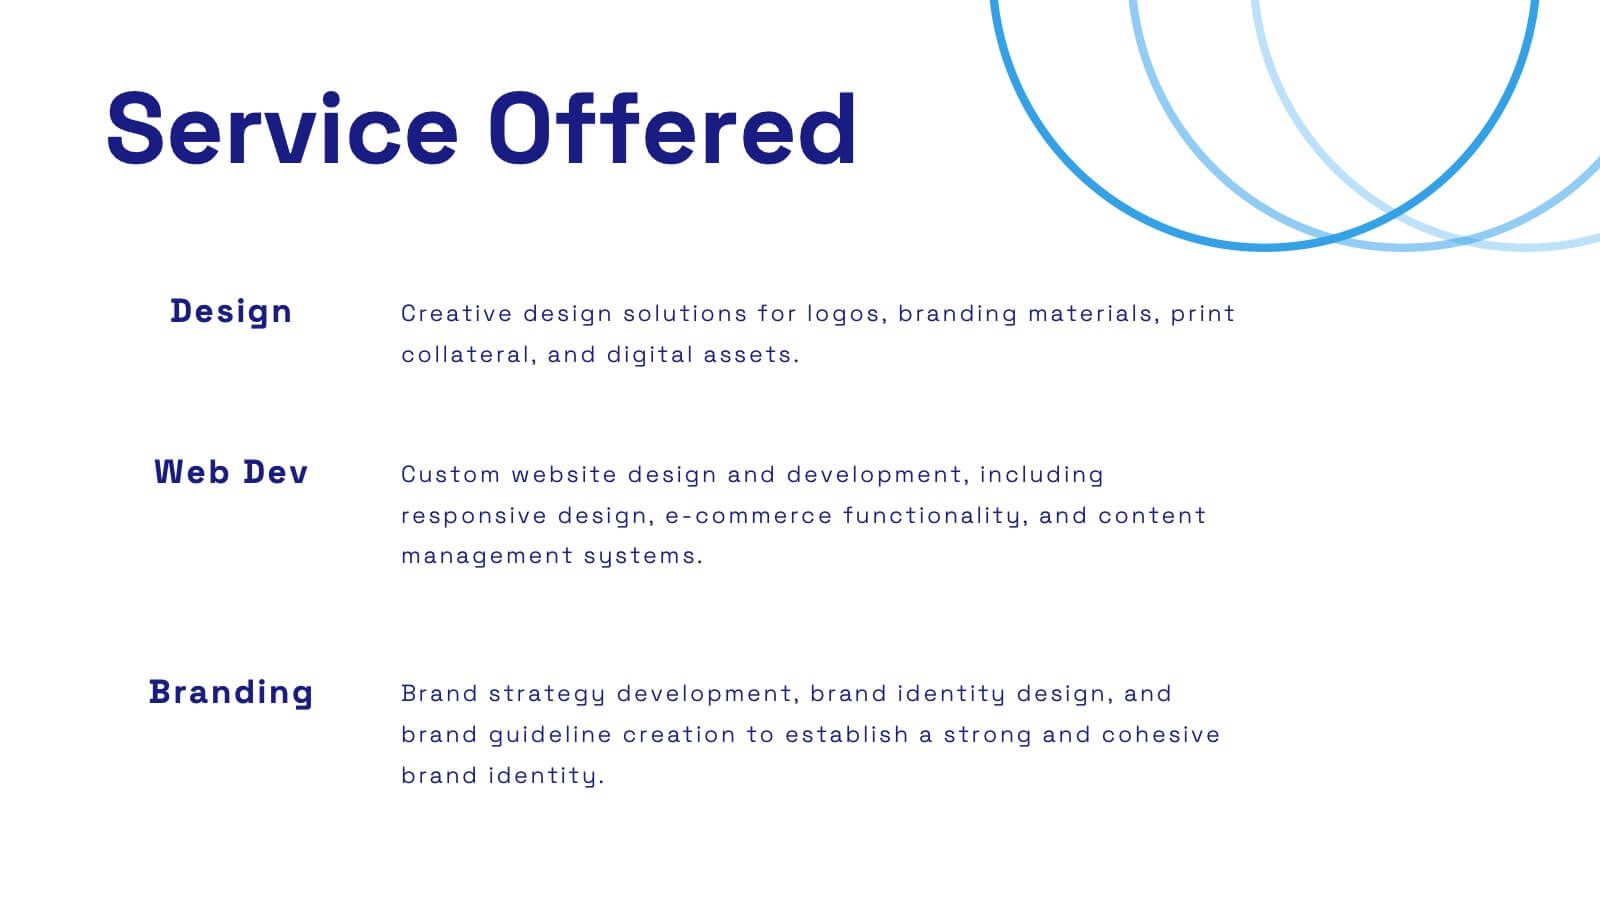
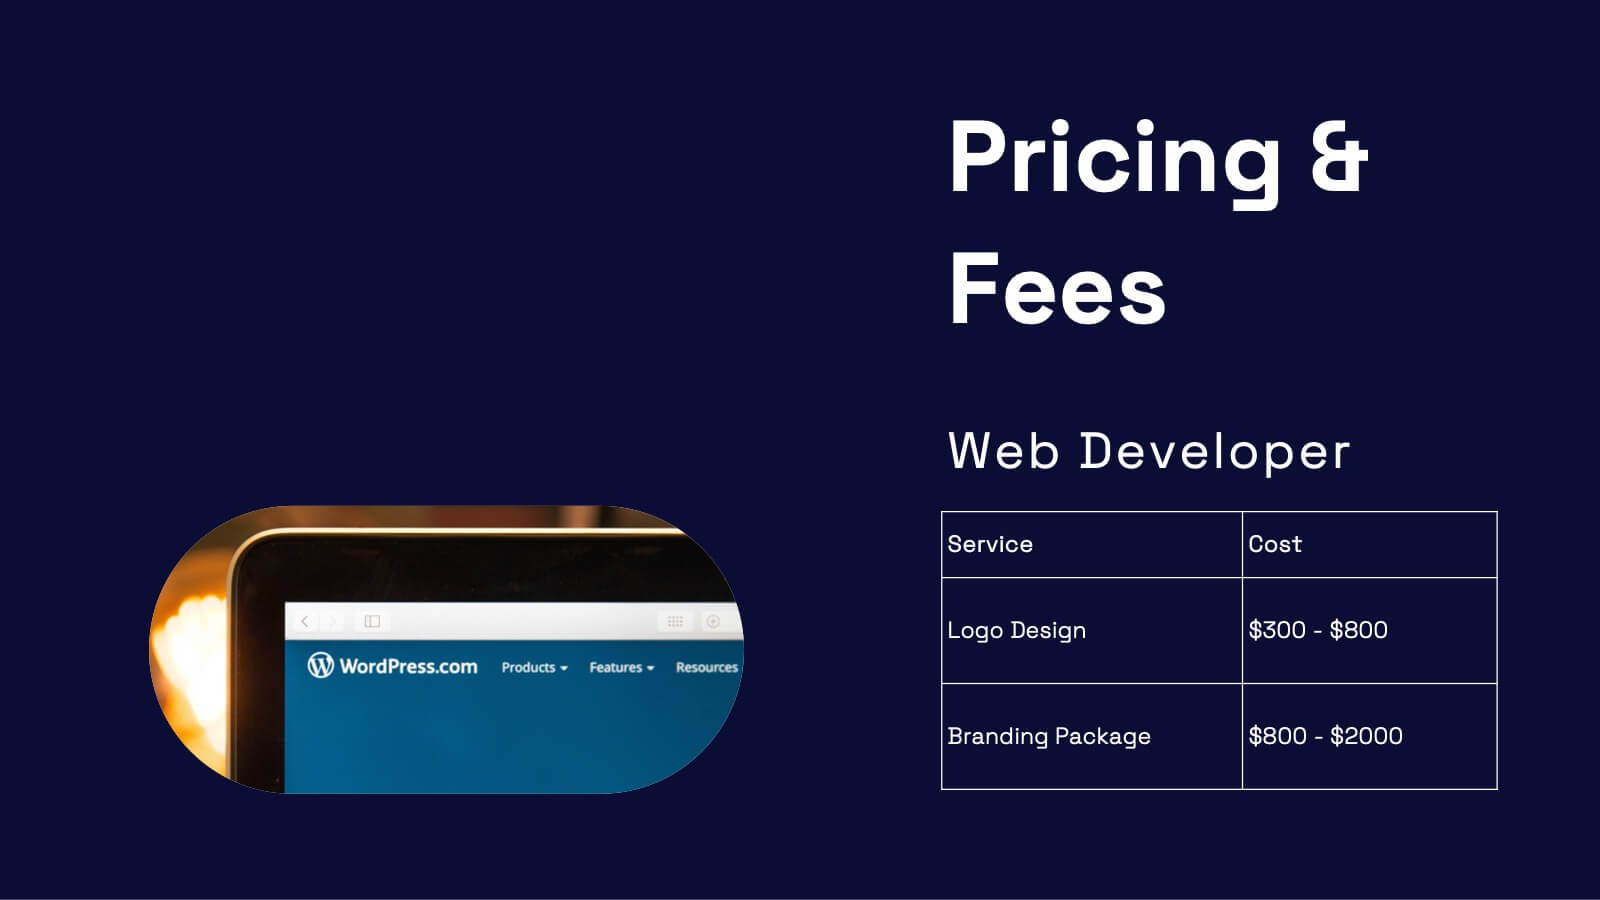
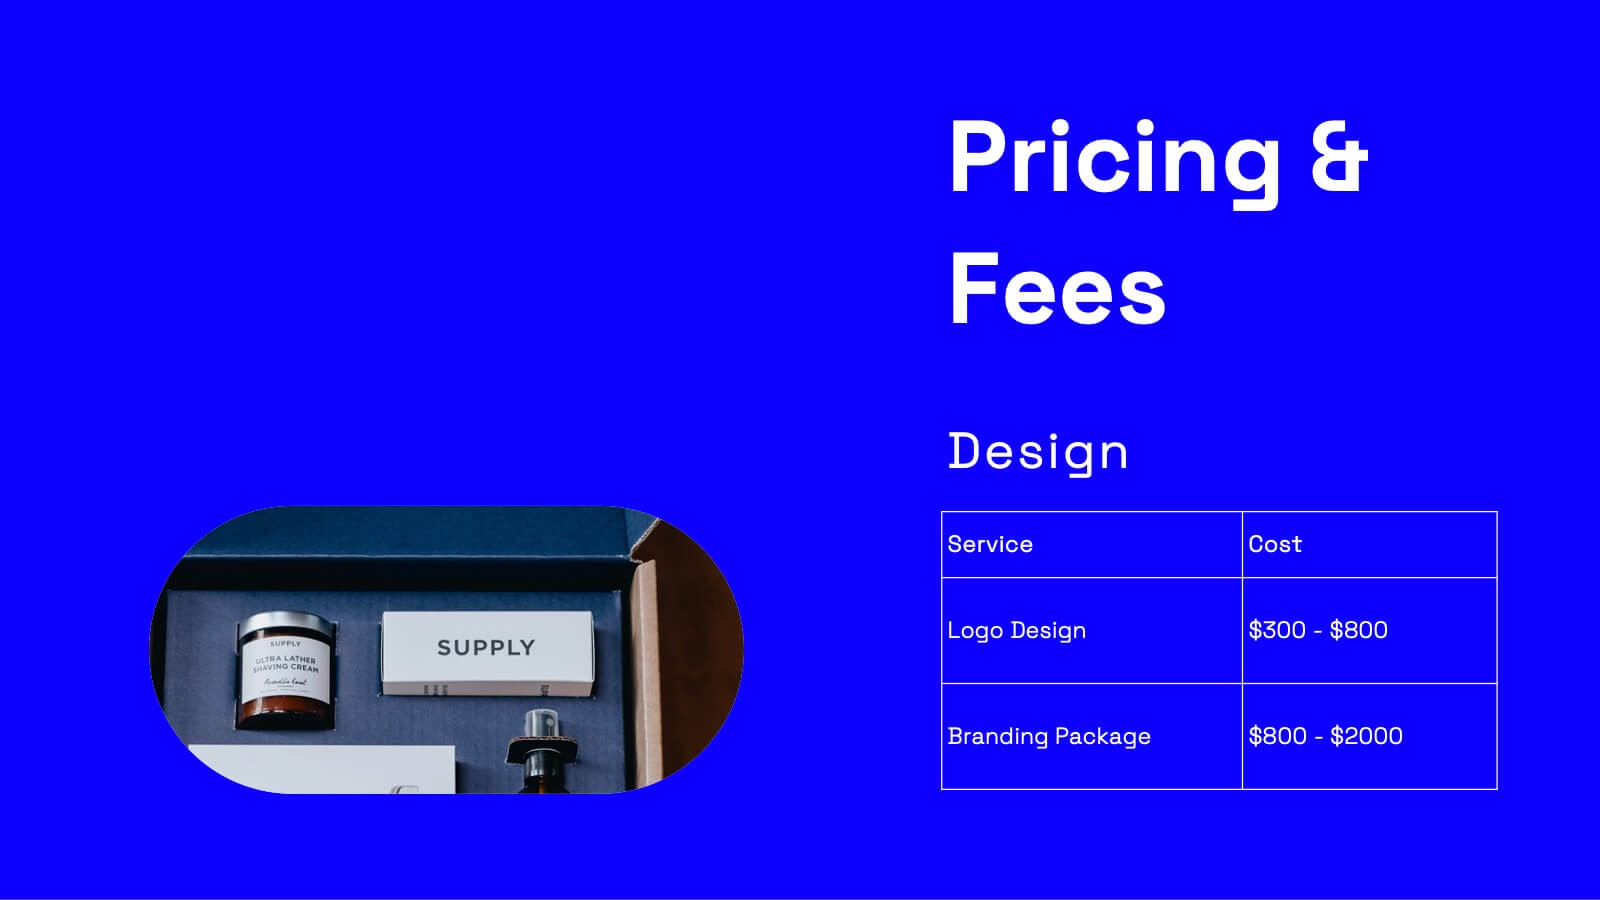
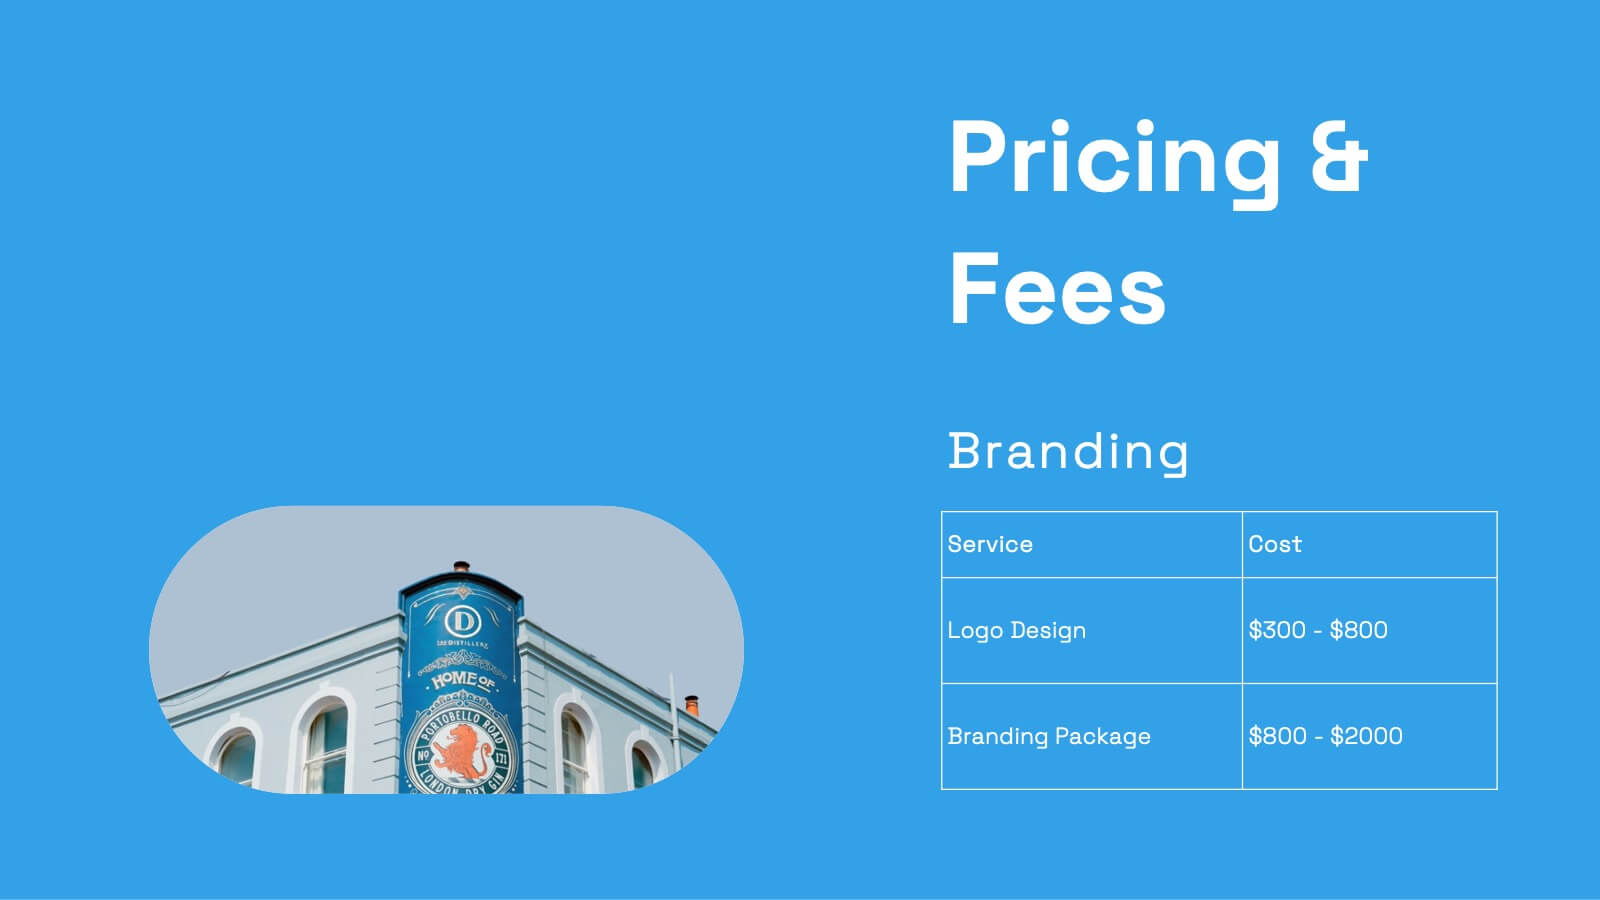
Wanderer Professional Portfolio Showcase Presentation
Showcase your creative work with this sleek, modern portfolio template. Perfect for highlighting your projects, philosophy, and client testimonials, it features a professional design with a dynamic layout. Display your awards, services offered, and pricing clearly to impress potential clients. Compatible with PowerPoint, Keynote, and Google Slides, it ensures seamless presentations on any platform.


6 diapositivas
6-Step Circular Process Diagram Presentation
Bring your workflow to life with a clean circular layout that makes every phase feel connected and easy to follow. This presentation breaks complex processes into six intuitive steps, ideal for strategy, planning, or operations. Fully compatible with PowerPoint, Keynote, and Google Slides.