


Características


¿Tienes alguna pregunta?
Recomendar


7 diapositivas
Innovation Technology Infographics
Innovation technology refers to the application of technology or the use of innovative approaches to create new products, services, processes, or business models. This infographic template is designed to showcase the cutting-edge technologies shaping our future. Let the vibrant visuals and insightful content guide you through the exciting realm of innovation and technology. Compatible with Powerpoint, Keynote, and Google Slides. Fully customizable, explore this infographic and step into the future. The visuals are designed to ignite your imagination and enlighten your audience about the limitless potential of innovation and technology.


5 diapositivas
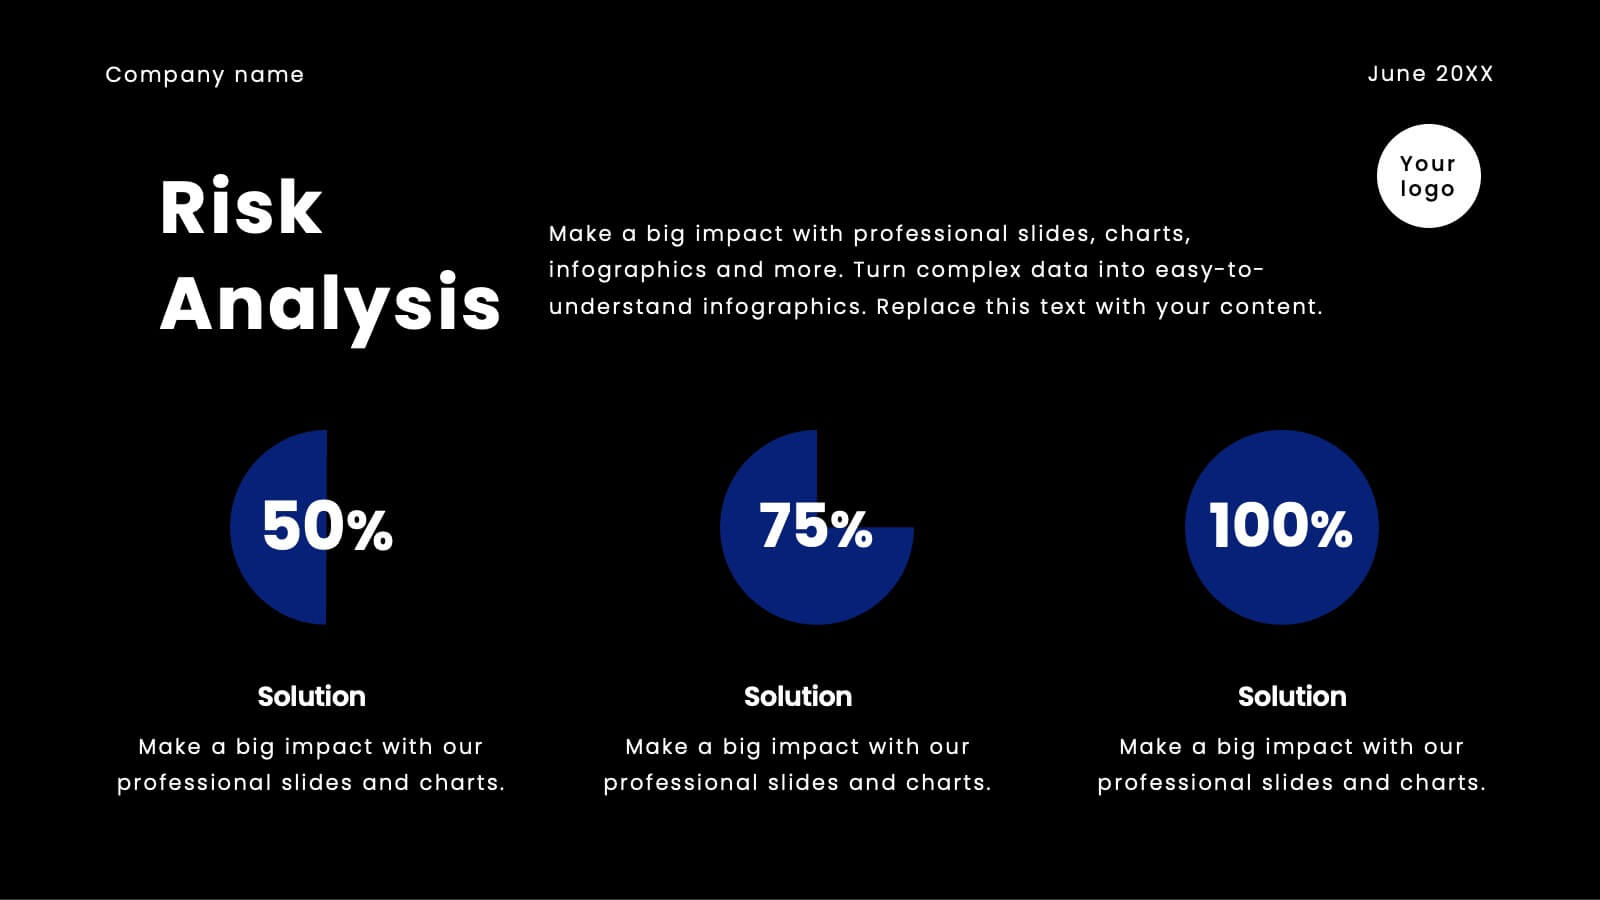
IT Service Operations Strategy Presentation
Streamline your IT presentations with the IT Service Operations Strategy Presentation template. This structured layout is designed to showcase key service operation metrics, strategies, and performance indicators in a visually engaging format. Ideal for IT teams, service managers, and business analysts, this slide helps simplify complex IT processes with clear data points and percentages. Fully customizable in PowerPoint, Keynote, and Google Slides for effortless adaptation to your needs.


11 diapositivas
Moodboard Presentation
This Moodboard template is a vibrant tool for designers and creatives looking to showcase the aesthetic direction of their project. It starts with a dynamic cover slide, drawing you into the visual theme. As you progress through the slides, you are greeted with rich textures and a spectrum of colors carefully selected to inspire and evoke emotion. The slides dedicated to 'Textures' and 'Colors' serve not only as a palette but also as a canvas to communicate the essence of your creative vision. Questions like "Have you chosen your colors yet?" engage the audience, encouraging interaction and reflection on their choices. The 'Concept' and 'Keys' slides further detail the creative process and the core elements that will define the final design. The comprehensive Moodboard culminates in a credits slide, attributing all the inspirational sources that fueled the visual journey.


5 diapositivas
Competitor Features Comparison Matrix Presentation
Clearly highlight competitive advantages with the Competitor Features Comparison Matrix Presentation. This sleek, easy-to-read slide lets you compare product features or service offerings across up to four competitors. Use checkmarks and icons to visually emphasize strengths and gaps. Fully editable in Canva, PowerPoint, and Google Slides—perfect for strategy, sales, or pitch decks.


2 diapositivas
Client-Oriented Project Proposal Deck Presentation
Deliver polished, persuasive proposals with the Client-Oriented Project Proposal Deck Presentation. Designed to balance visual appeal and clarity, this layout is perfect for consultants, agencies, or freelancers presenting solutions to clients. Includes space for project overviews, photos, and key value points. Fully editable in PowerPoint, Keynote, and Google Slides.

22 diapositivas
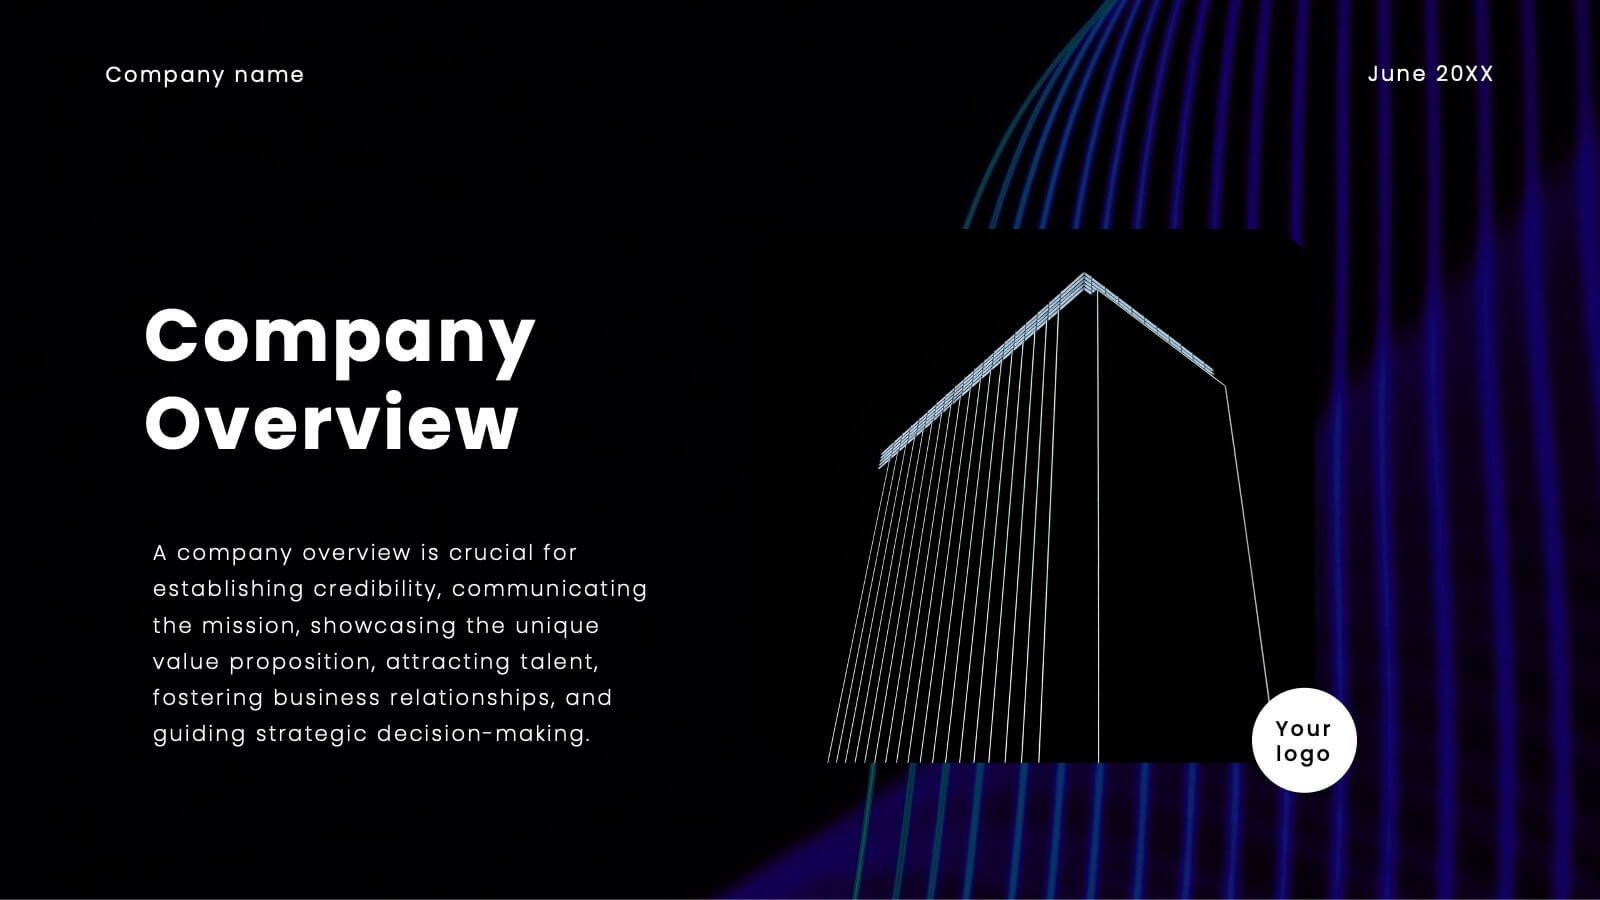
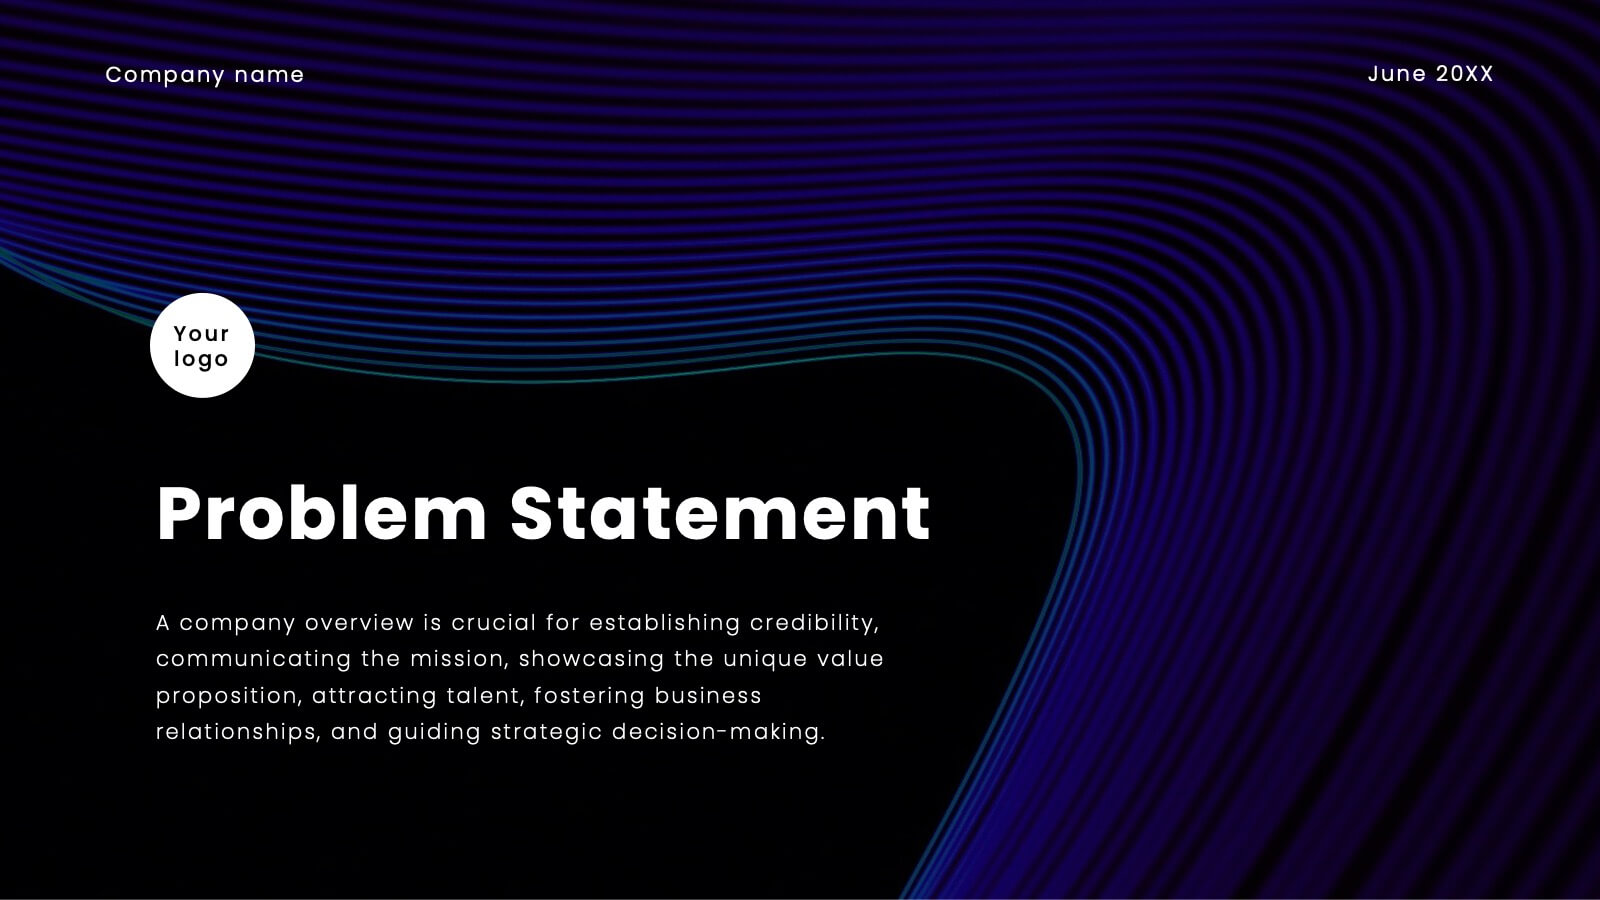
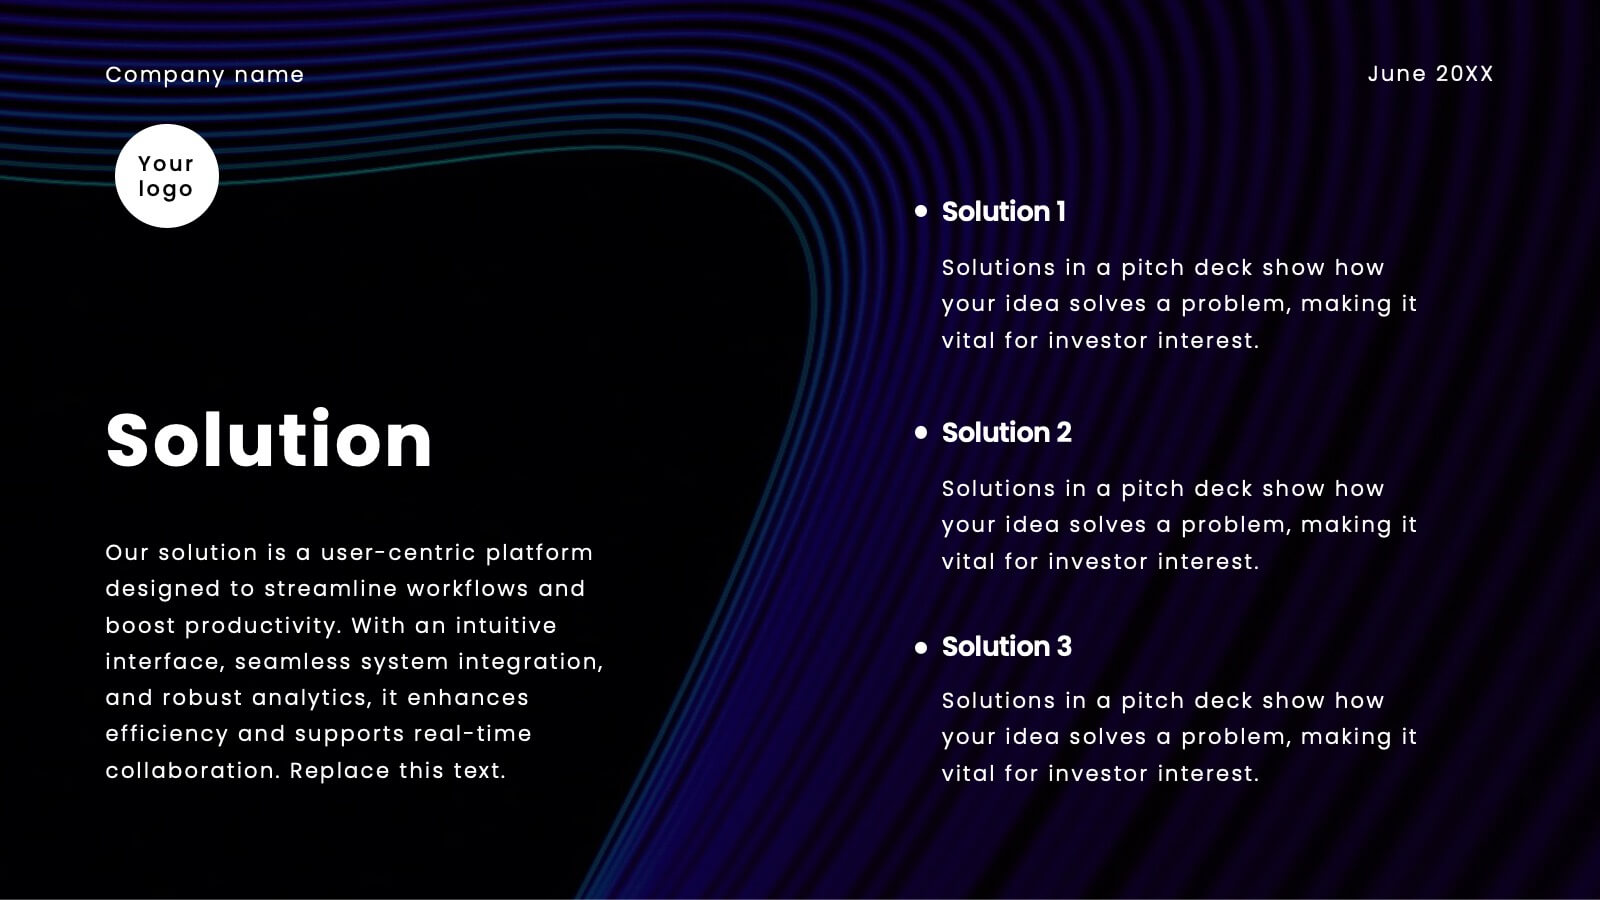
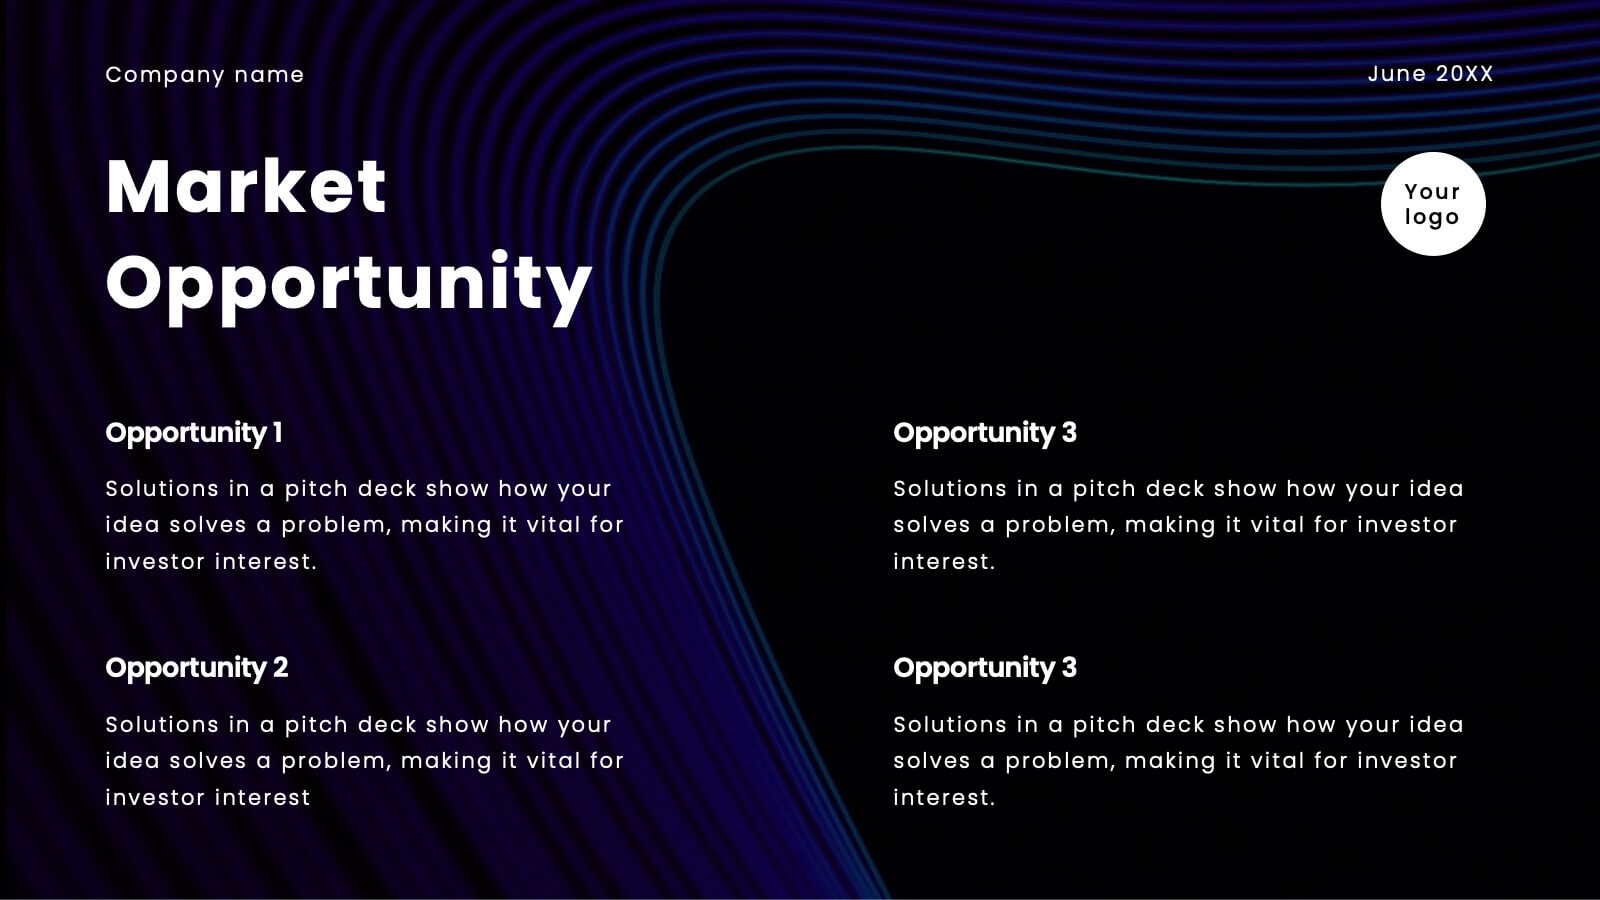
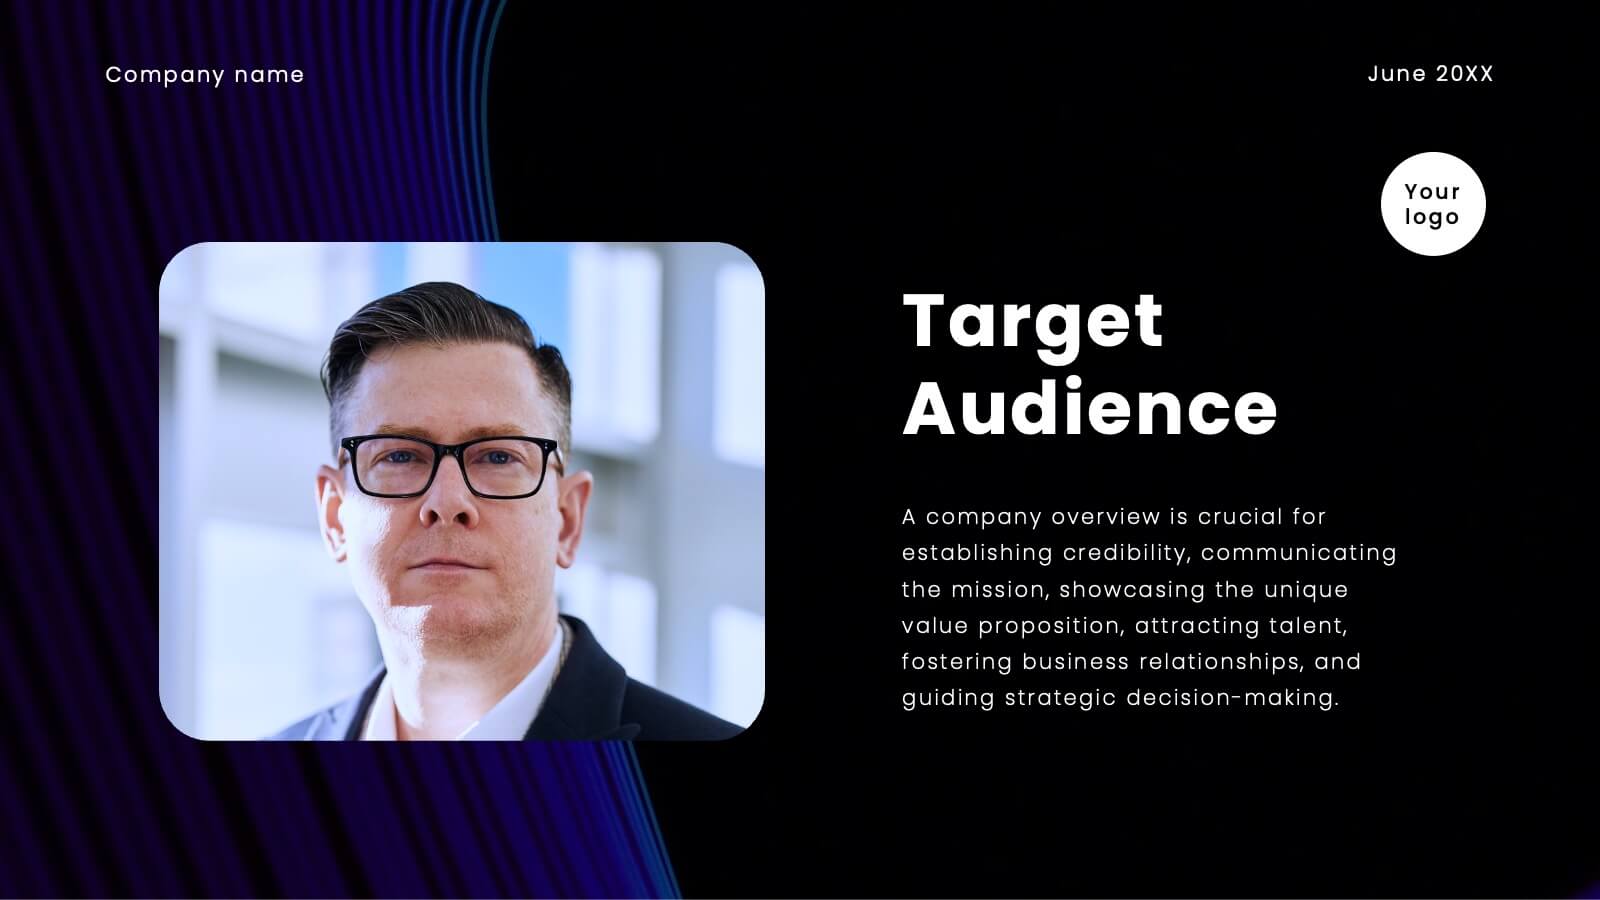
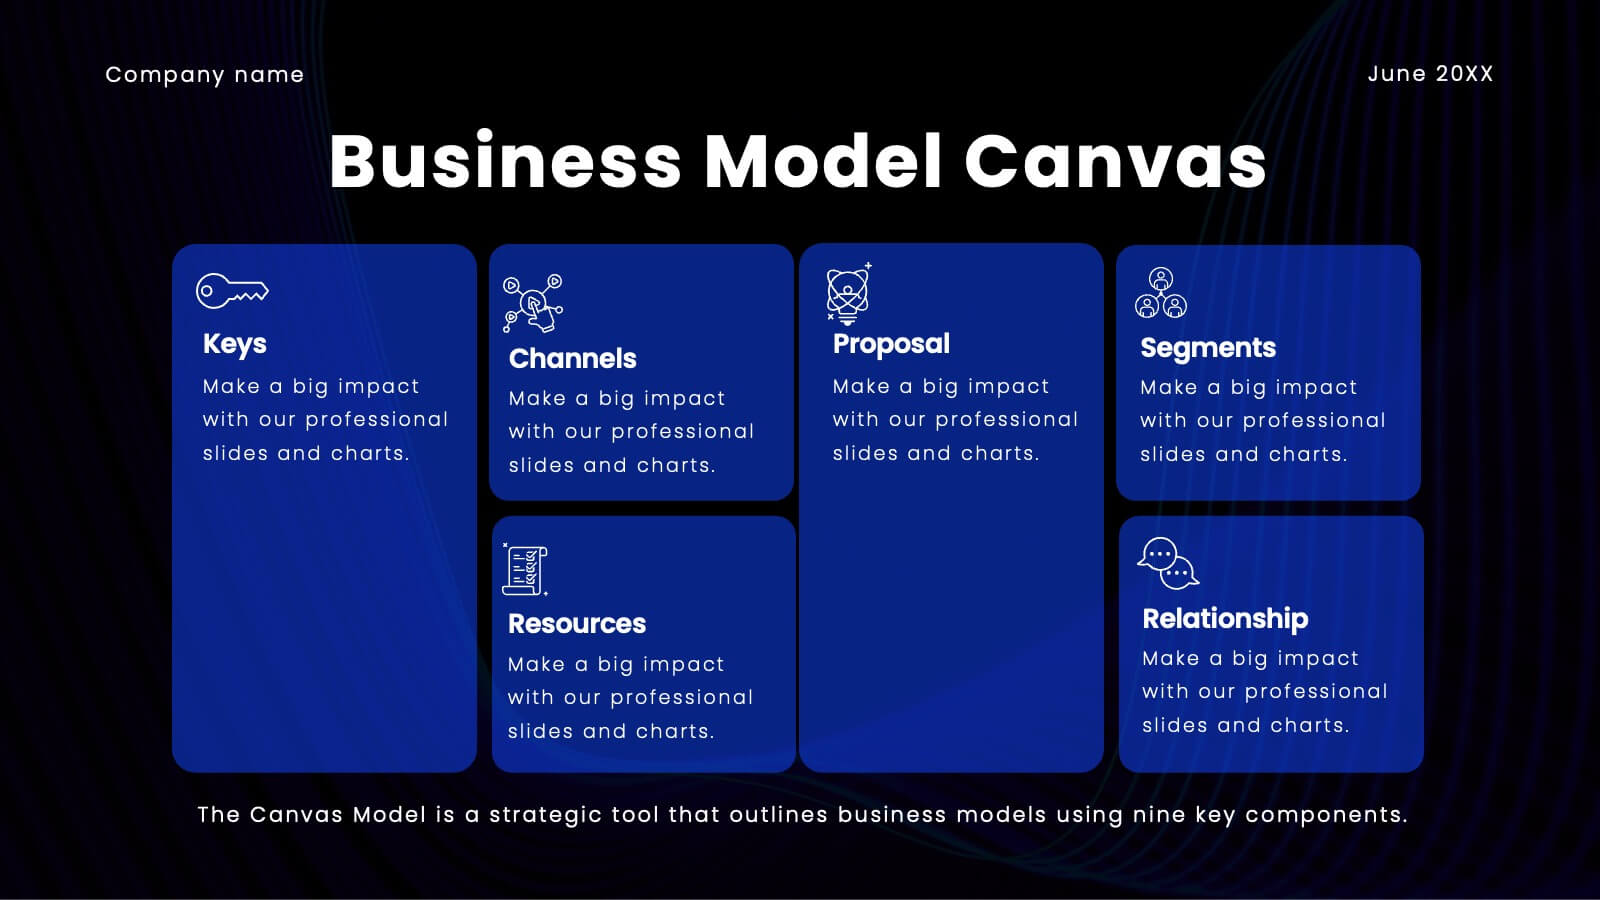
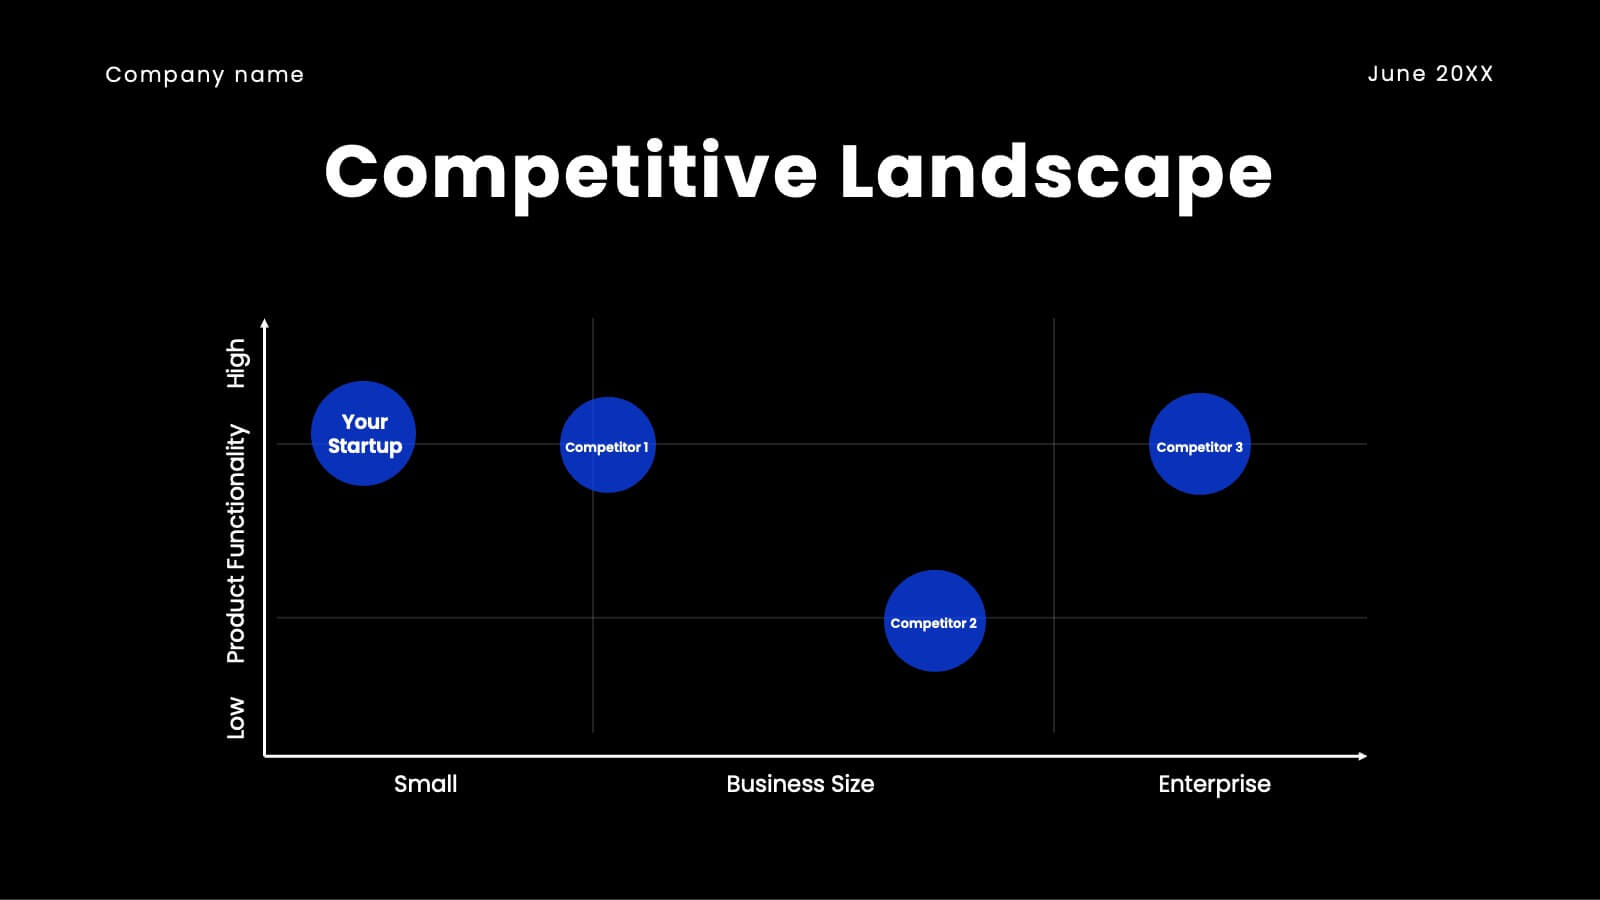
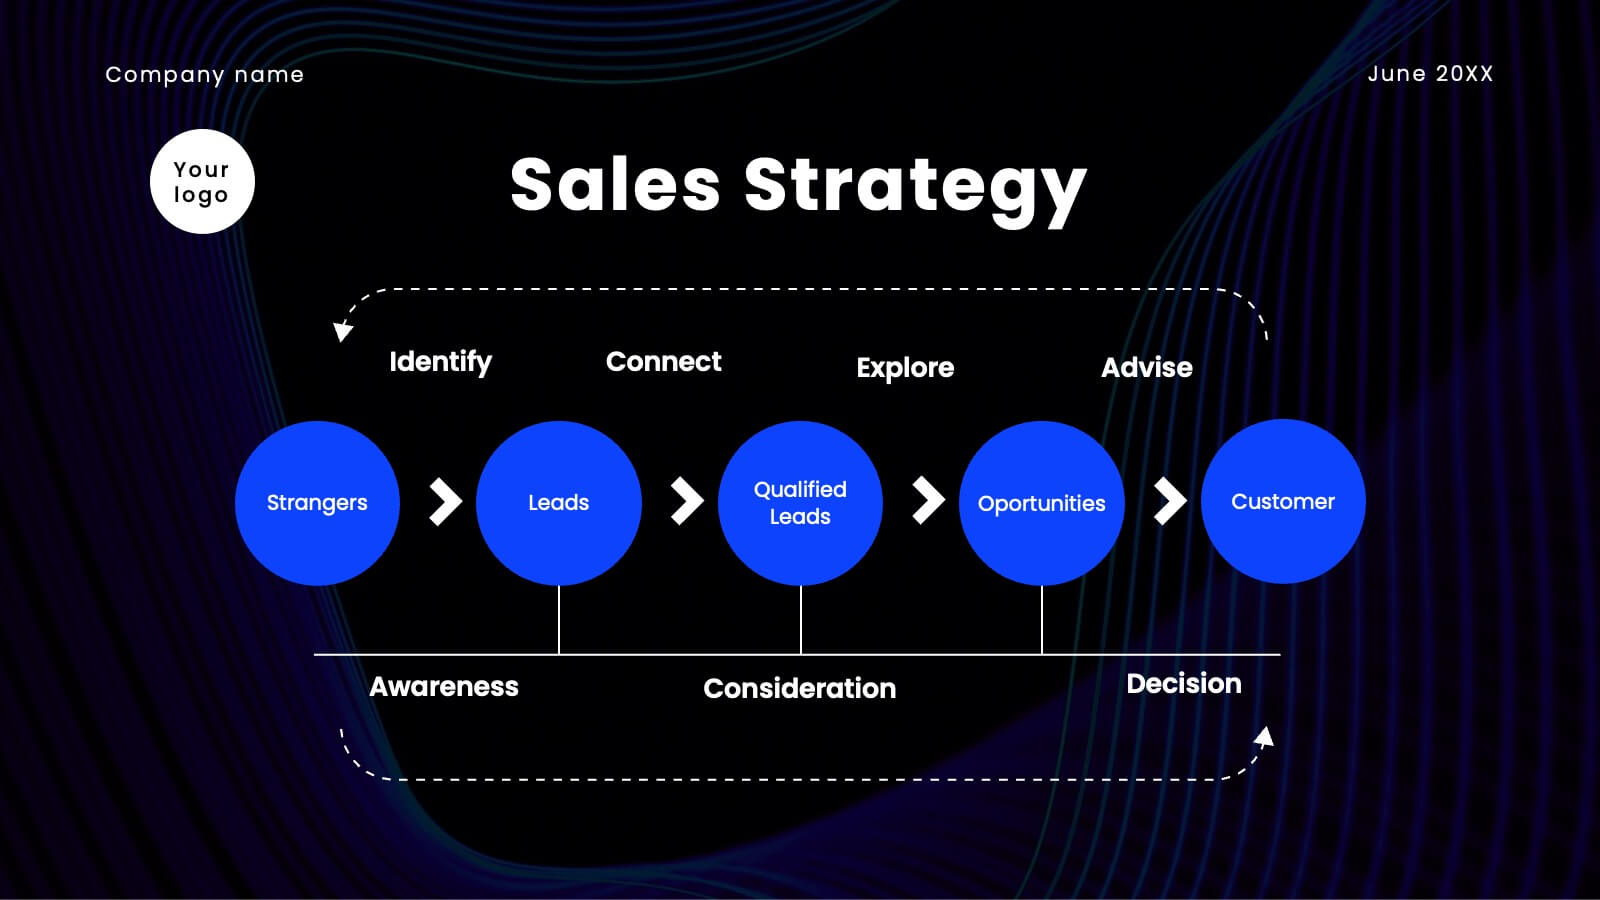
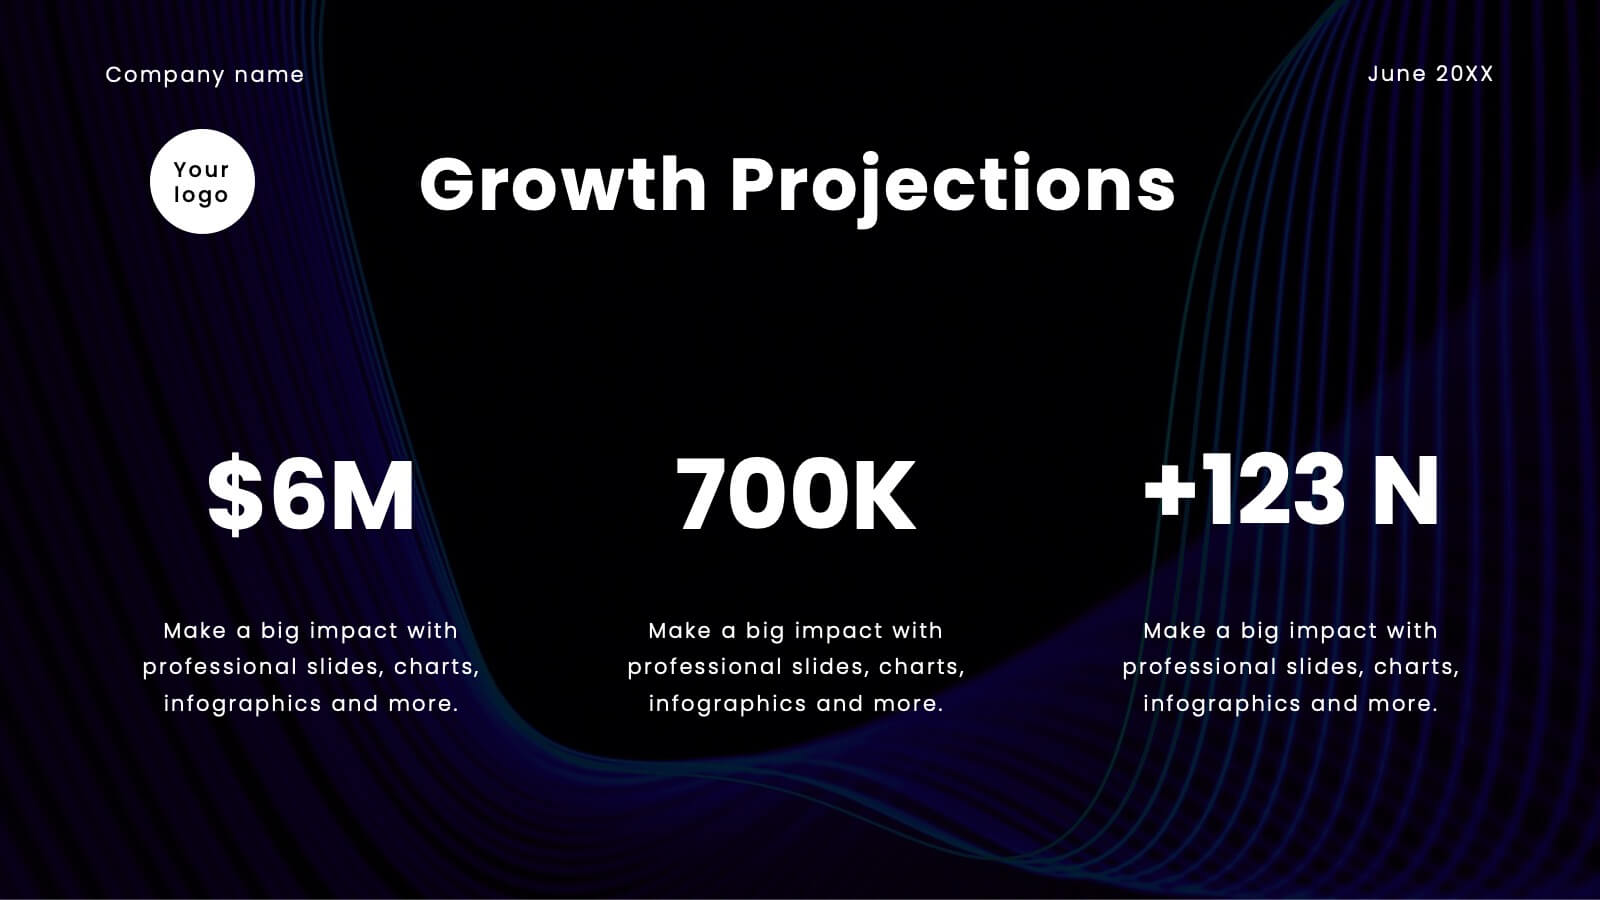
Jolt Business Idea Pitch Deck Presentation
Prepare to electrify your audience with a pitch deck that’s nothing short of spectacular! This high-impact template is designed to captivate, engage, and persuade your stakeholders with every slide. It’s more than just a presentation; it’s your gateway to showcasing your company’s unique value proposition, innovative solutions, and future growth potential in a way that’s visually stunning and incredibly compelling. From the moment you unveil your company overview to the final slide on financials and funding requirements, this template ensures your pitch is memorable, powerful, and impossible to ignore. The sleek, modern design highlights your strategic vision, competitive advantages, and market opportunities, making a bold statement that you’re ready to lead the future. Compatible with PowerPoint, Keynote, and Google Slides, this pitch deck template is your ultimate tool for turning heads and securing buy-in from investors, partners, and clients alike!


8 diapositivas
Employee Onboarding 30-60-90 Day Plan Presentation
Set new hires up for success with this employee onboarding 30-60-90 day plan template! Designed to streamline the onboarding process, this structured layout helps HR teams and managers define clear goals, training steps, and performance milestones. Fully customizable and compatible with PowerPoint, Keynote, and Google Slides for seamless adaptation.


4 diapositivas
Business Travel Logistic Plan Presentation
Make your business journey feel as smooth as your next flight! This infographic presentation template helps visualize logistics, travel routes, and resource allocation for corporate trips. Great for mapping key points and planning operations clearly. Fully editable and compatible with PowerPoint, Keynote, and Google Slides for easy customization and sharing.


3 diapositivas
Comprehensive Business Roadmap Strategy Presentation
Plan ahead with confidence using the Comprehensive Business Roadmap Strategy Presentation. This timeline-based slide is perfect for mapping out multi-quarter goals, initiatives, or project phases. Use the horizontal arrows to show overlapping tasks and strategic priorities by quarter. Ideal for project managers, team leads, and business strategists. Fully editable in PowerPoint, Keynote, Google Slides, and Canva.


7 diapositivas
Mind Map Project Infographic
A mind map is a visual representation of information, ideas, or concepts arranged around a central topic or theme. This template is a powerful brainstorming and organizational tool that helps individuals or teams visually connect related ideas, explore new connections, and see the bigger picture. This diagram organizes information around a central theme or idea, with branches extending outwards to represent related concepts or tasks. This infographic is perfect for for capturing ideas, and presenting complex information in a structured and easily manner. This template is customizable and compatible with Powerpoint, Keynote, and Google Slides.


5 diapositivas
Health Awareness Campaign Presentation
Bright and uplifting, this slide brings awareness to important health causes through a clean ribbon-focused layout that’s easy to read and visually engaging. It helps present key messages, statistics, or campaign steps clearly while keeping the design calm and supportive. Fully compatible with PowerPoint, Keynote, and Google Slides.
7 diapositivas
Arrow Process Flow Presentation
Illustrate step-by-step processes with the Arrow Process Flow Presentation. This dynamic template visually maps out sequential steps, making it ideal for workflow diagrams, business strategies, and project planning. Customize colors, text, and icons to align with your brand. Compatible with PowerPoint, Keynote, and Google Slides for effortless editing.


26 diapositivas
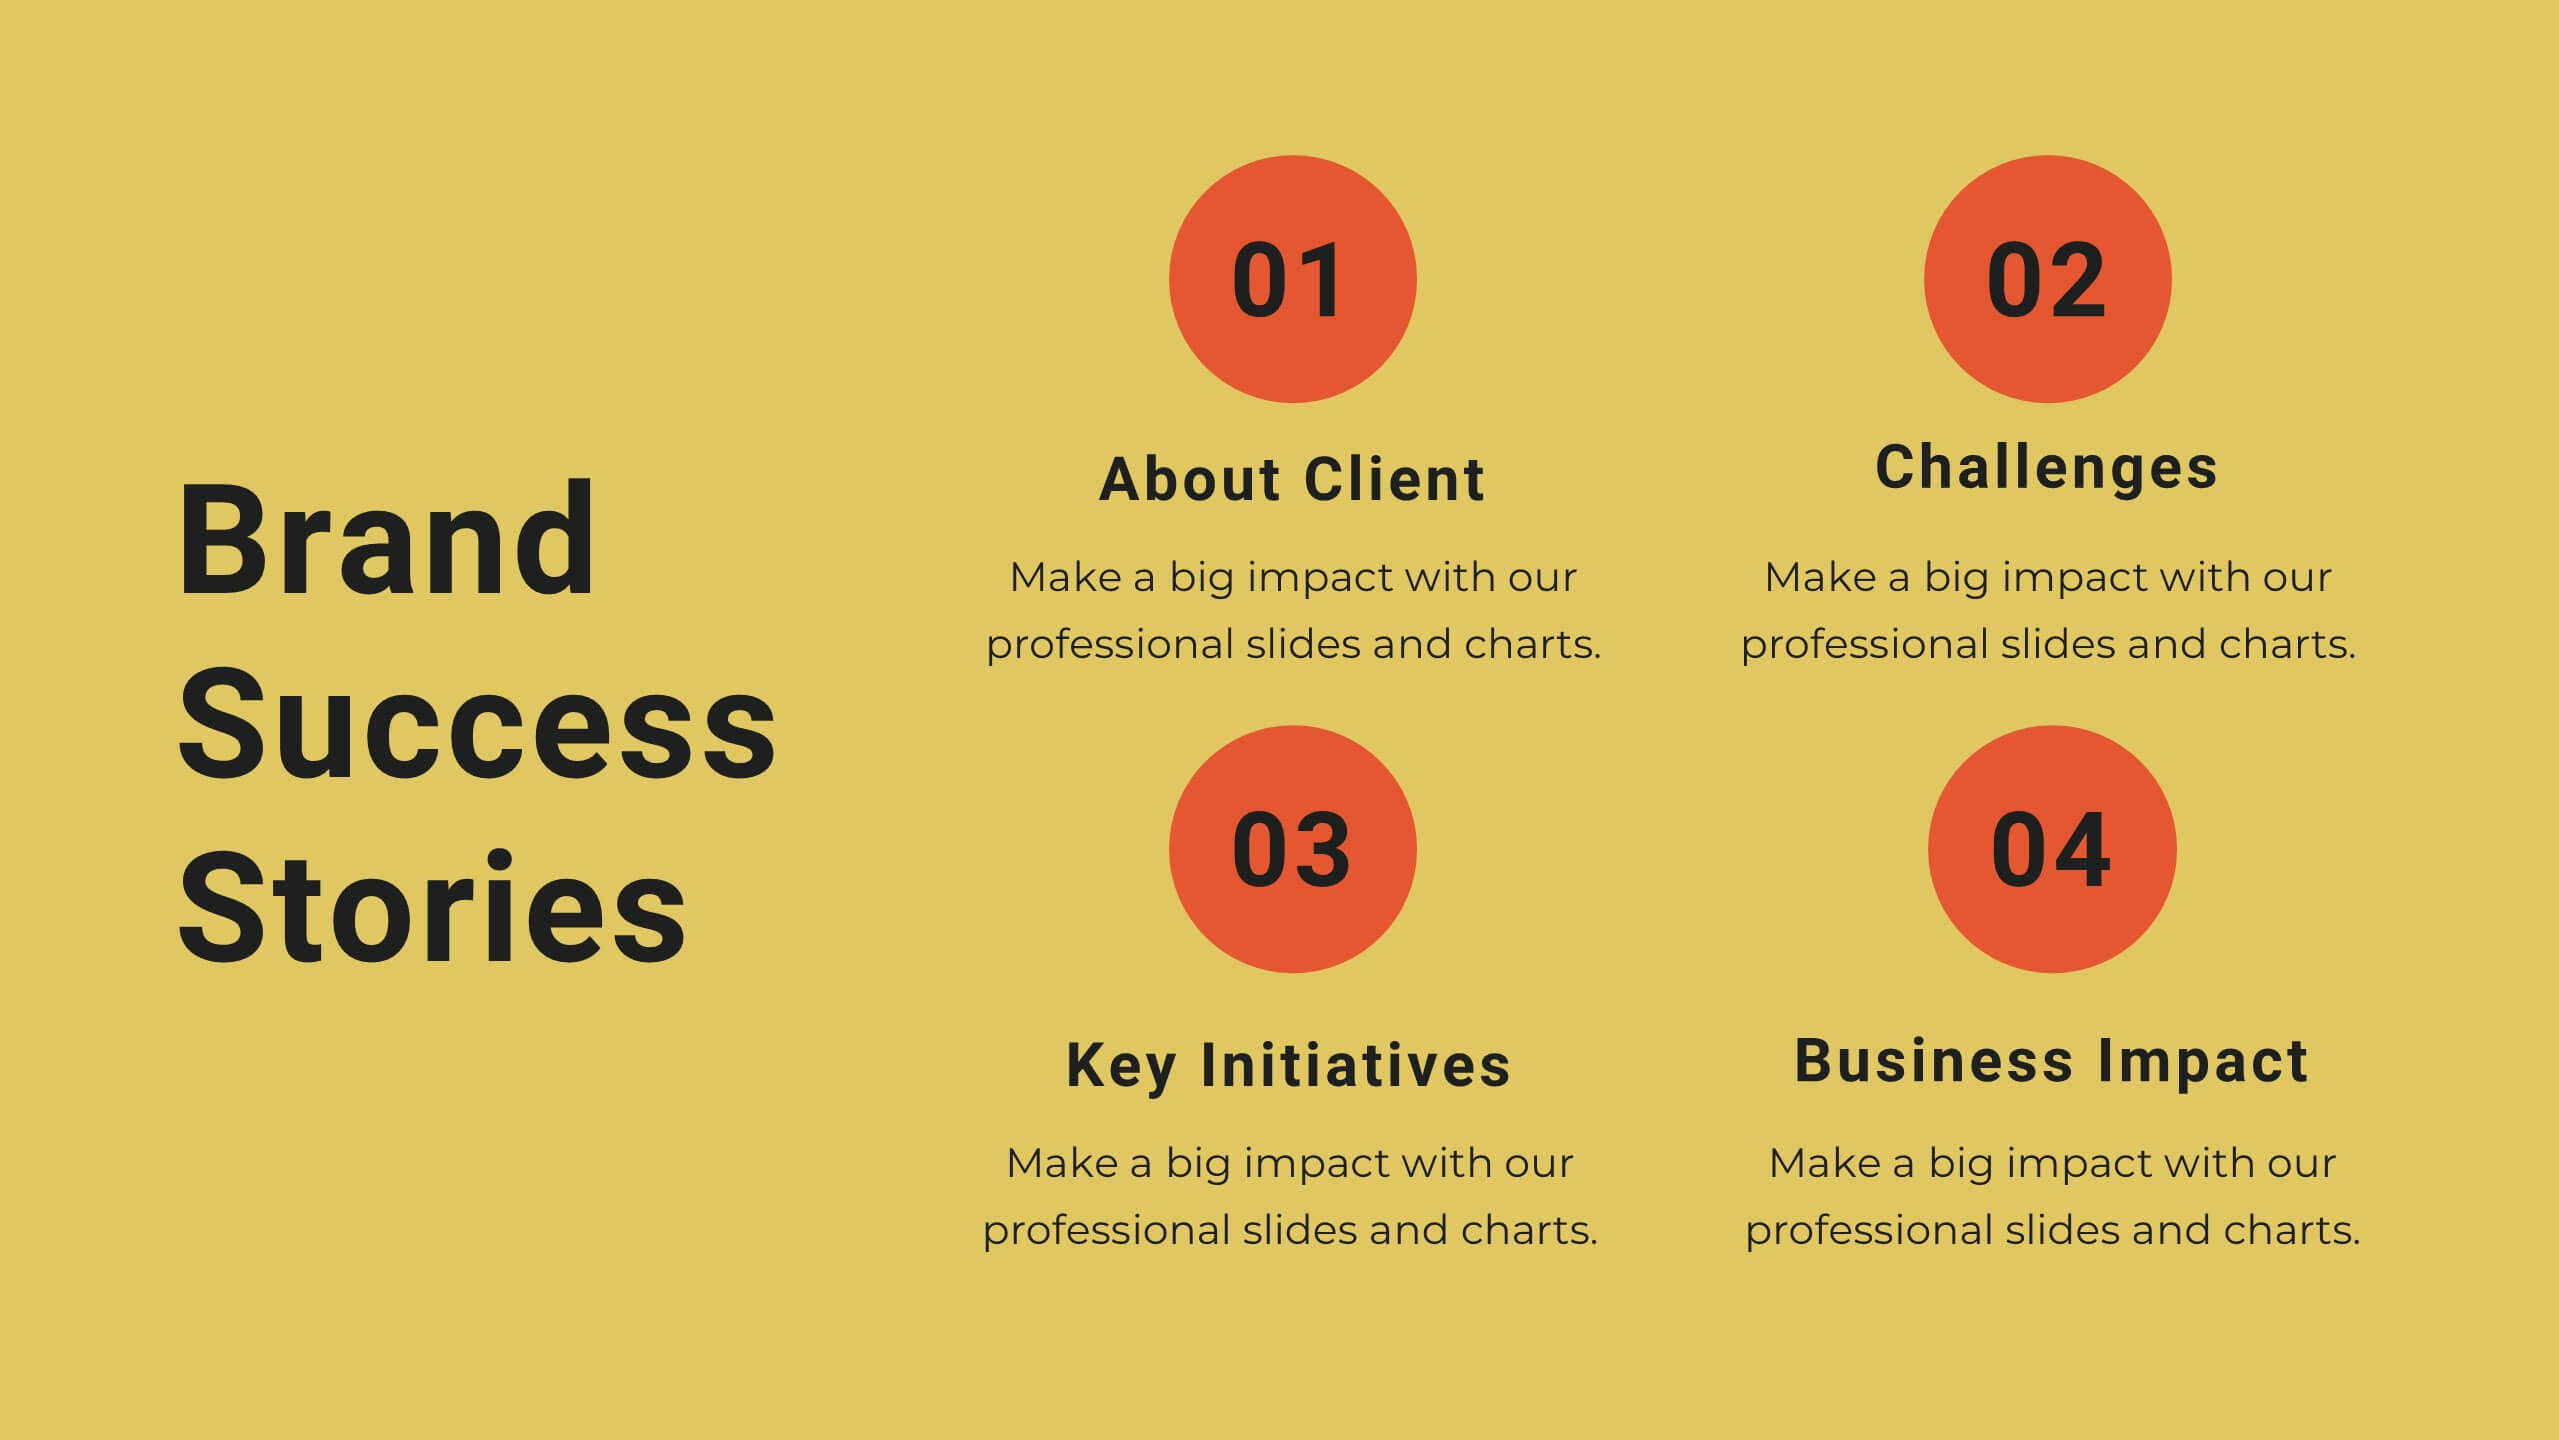
Yttrium Brand Strategy Report Presentation
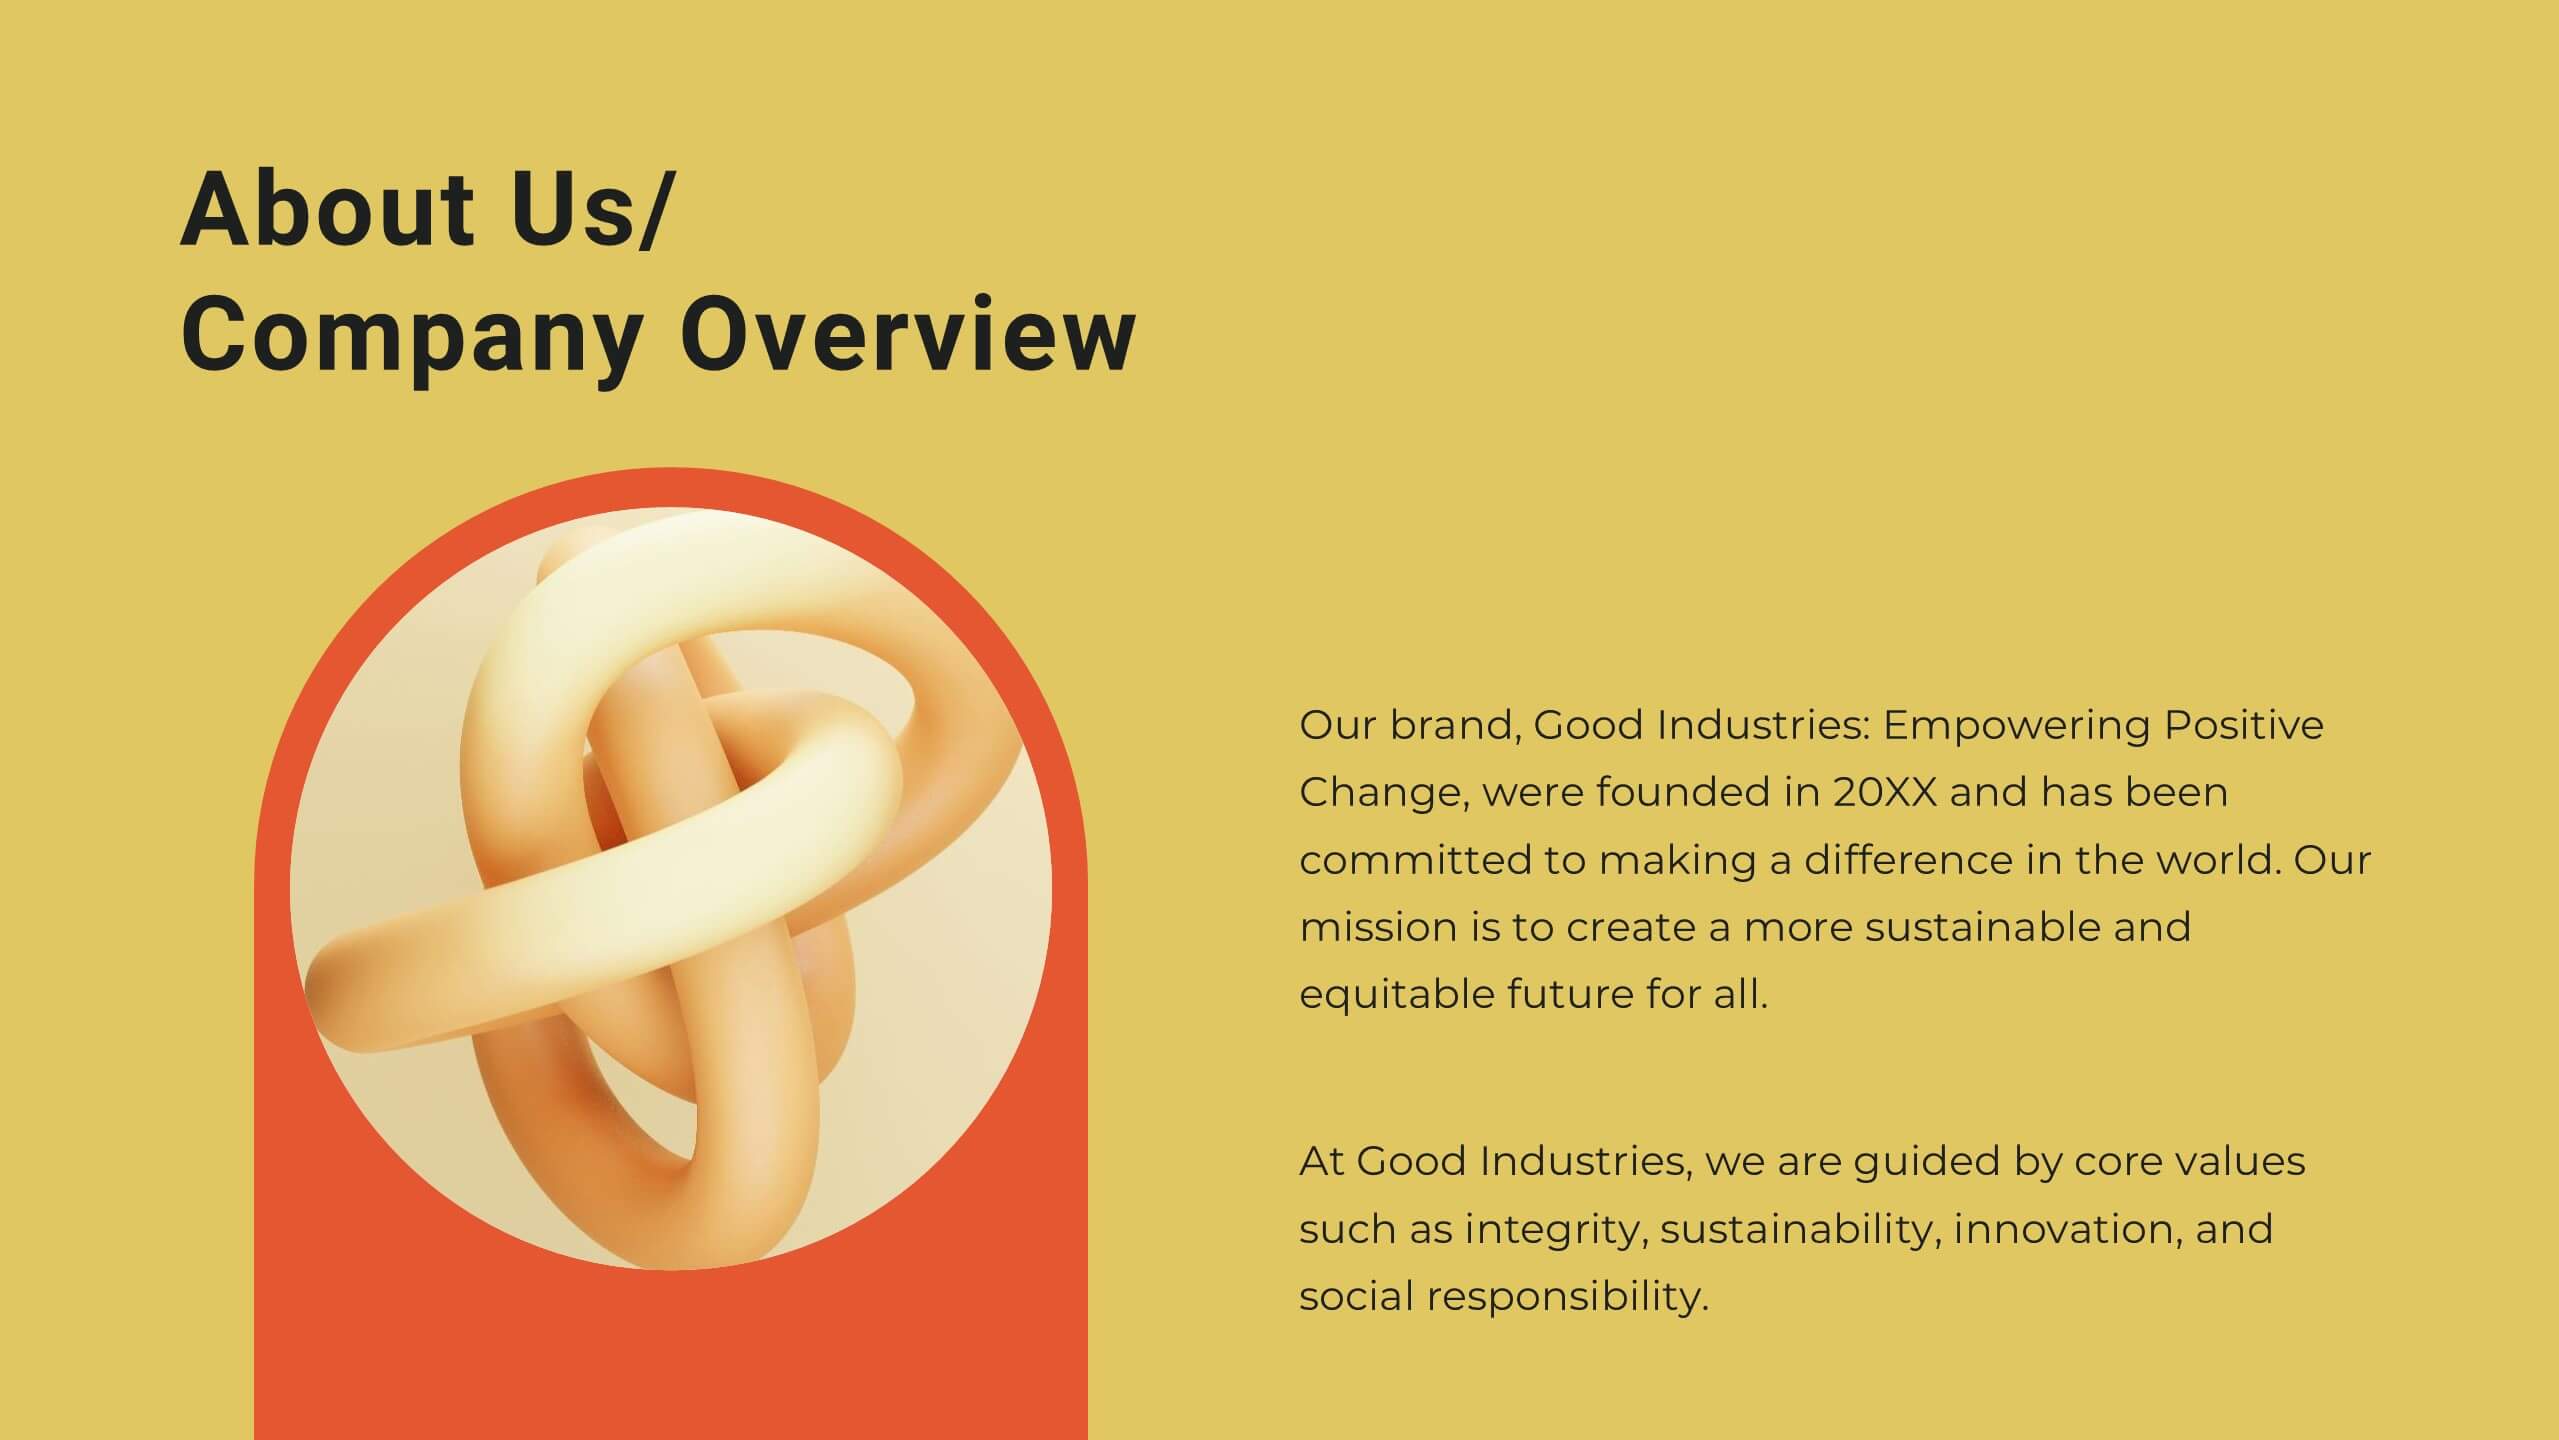
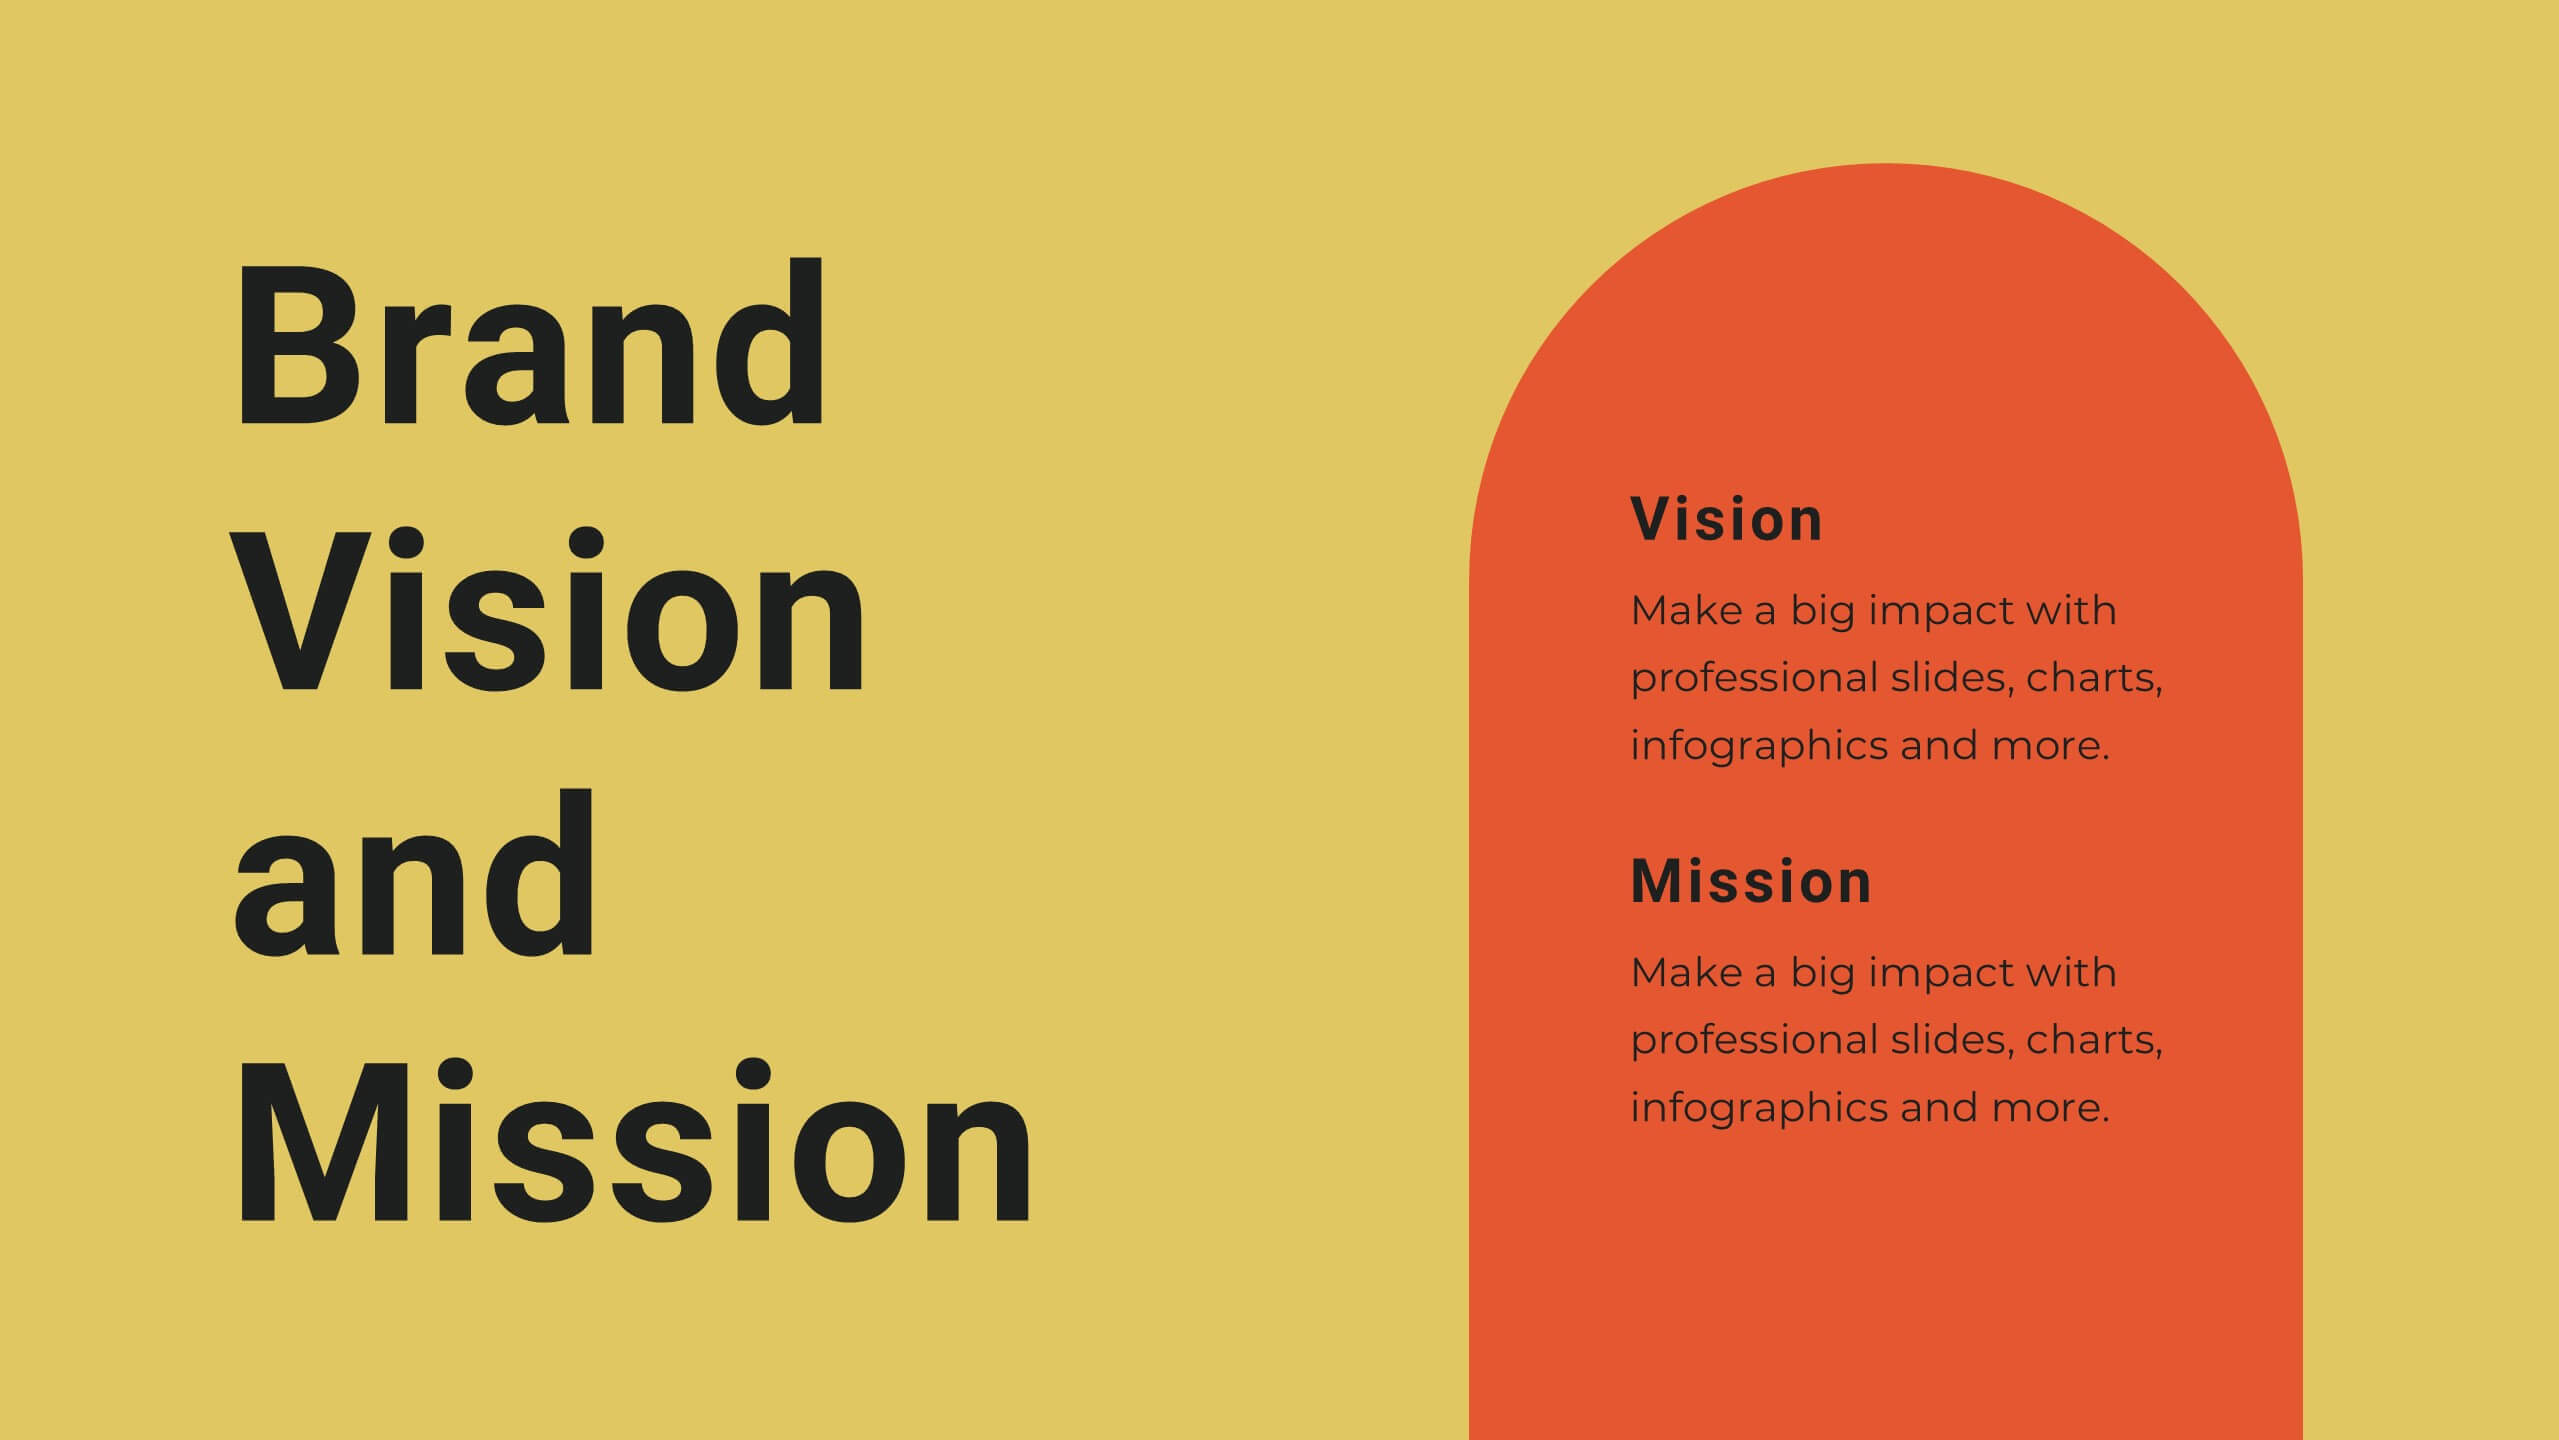
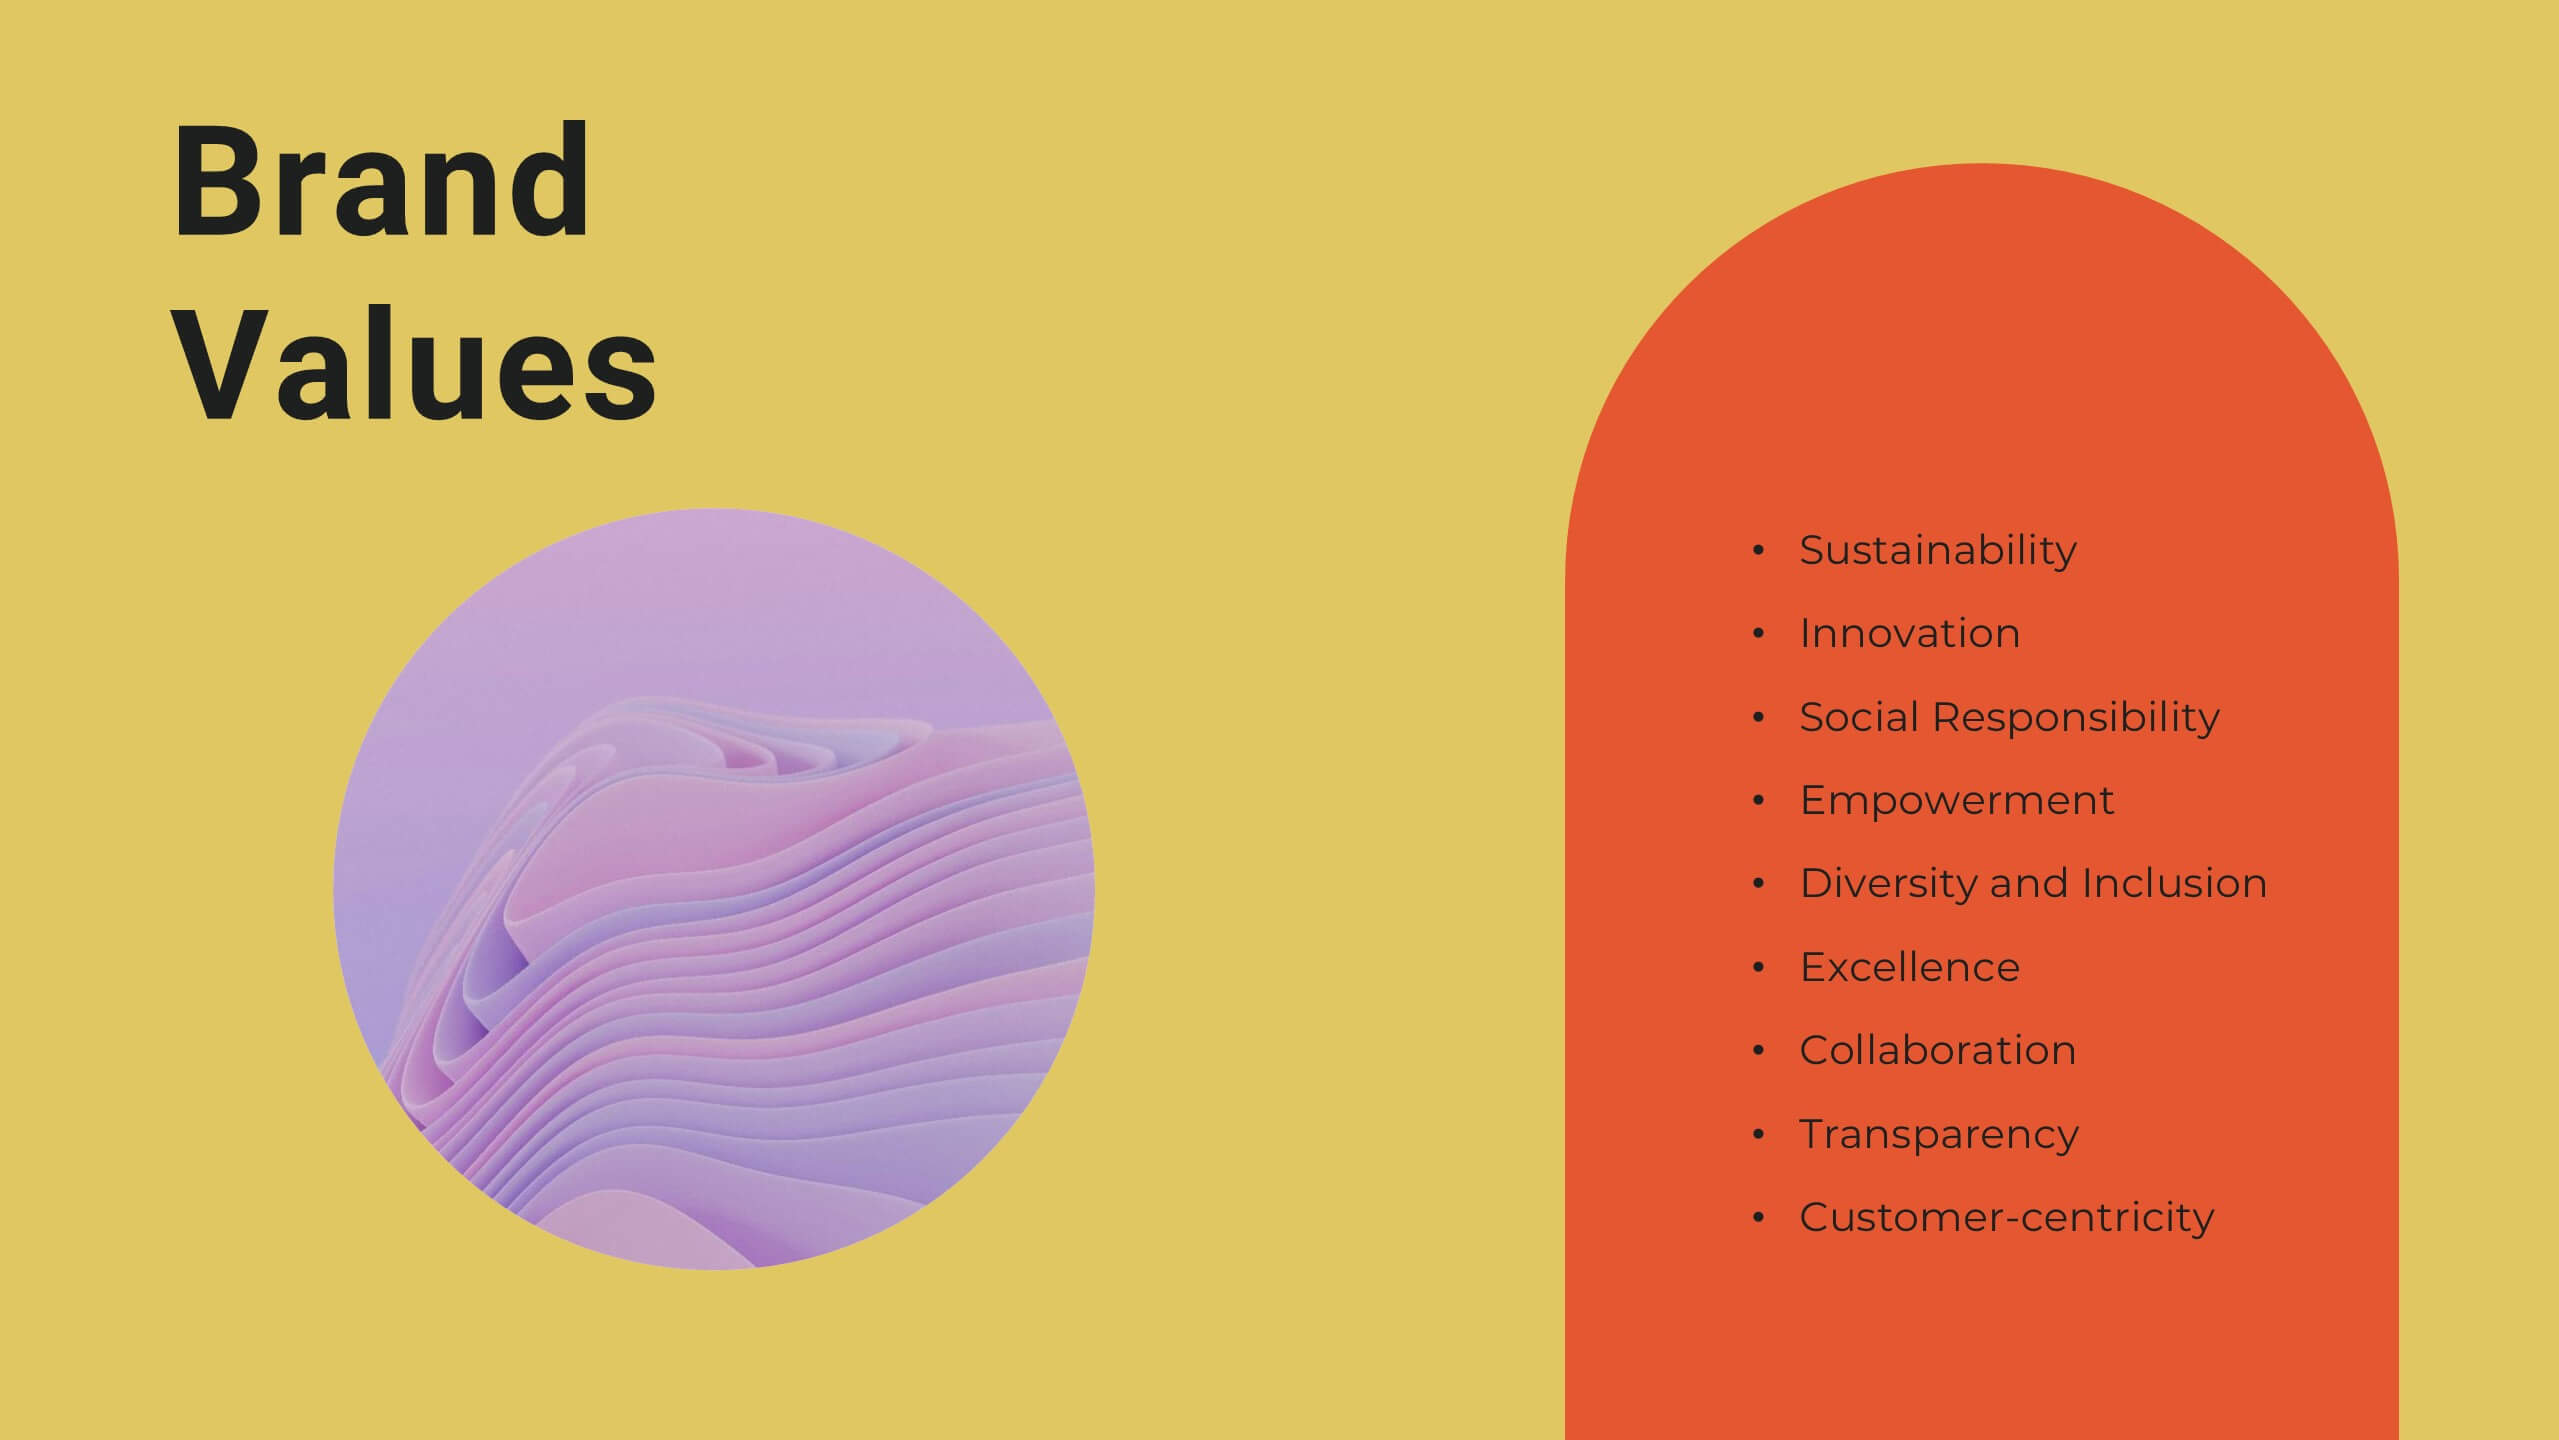
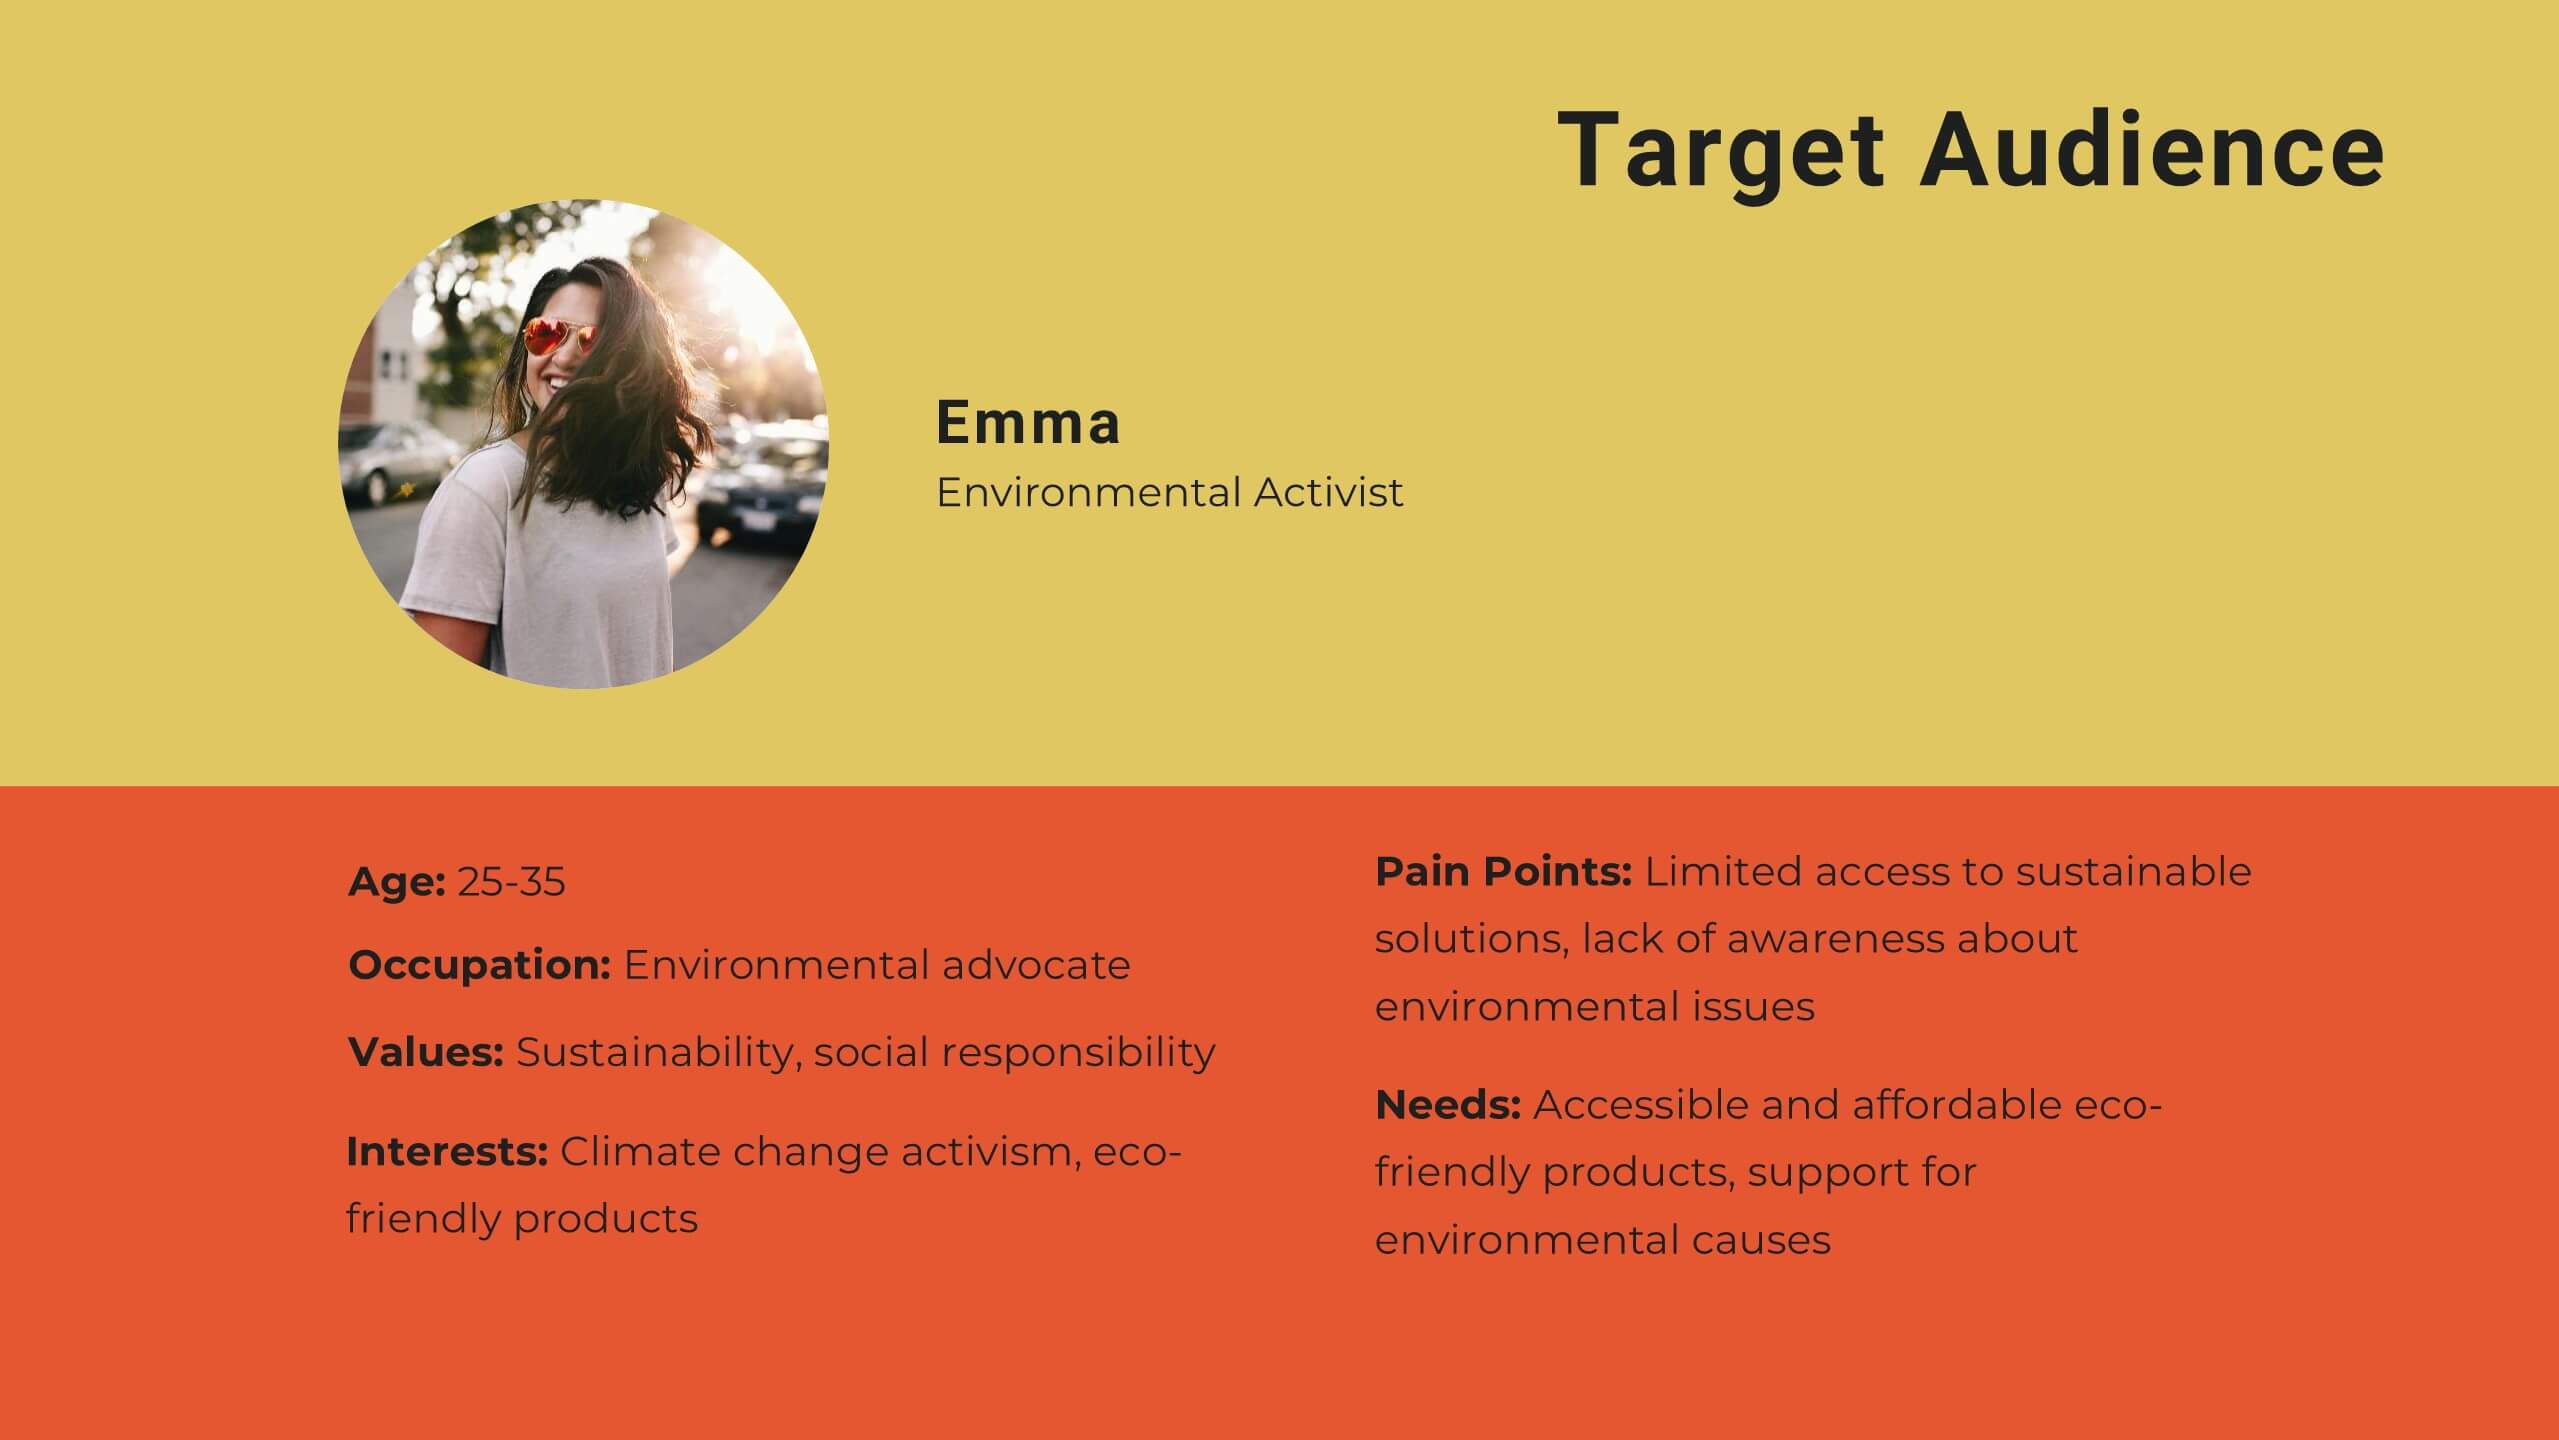
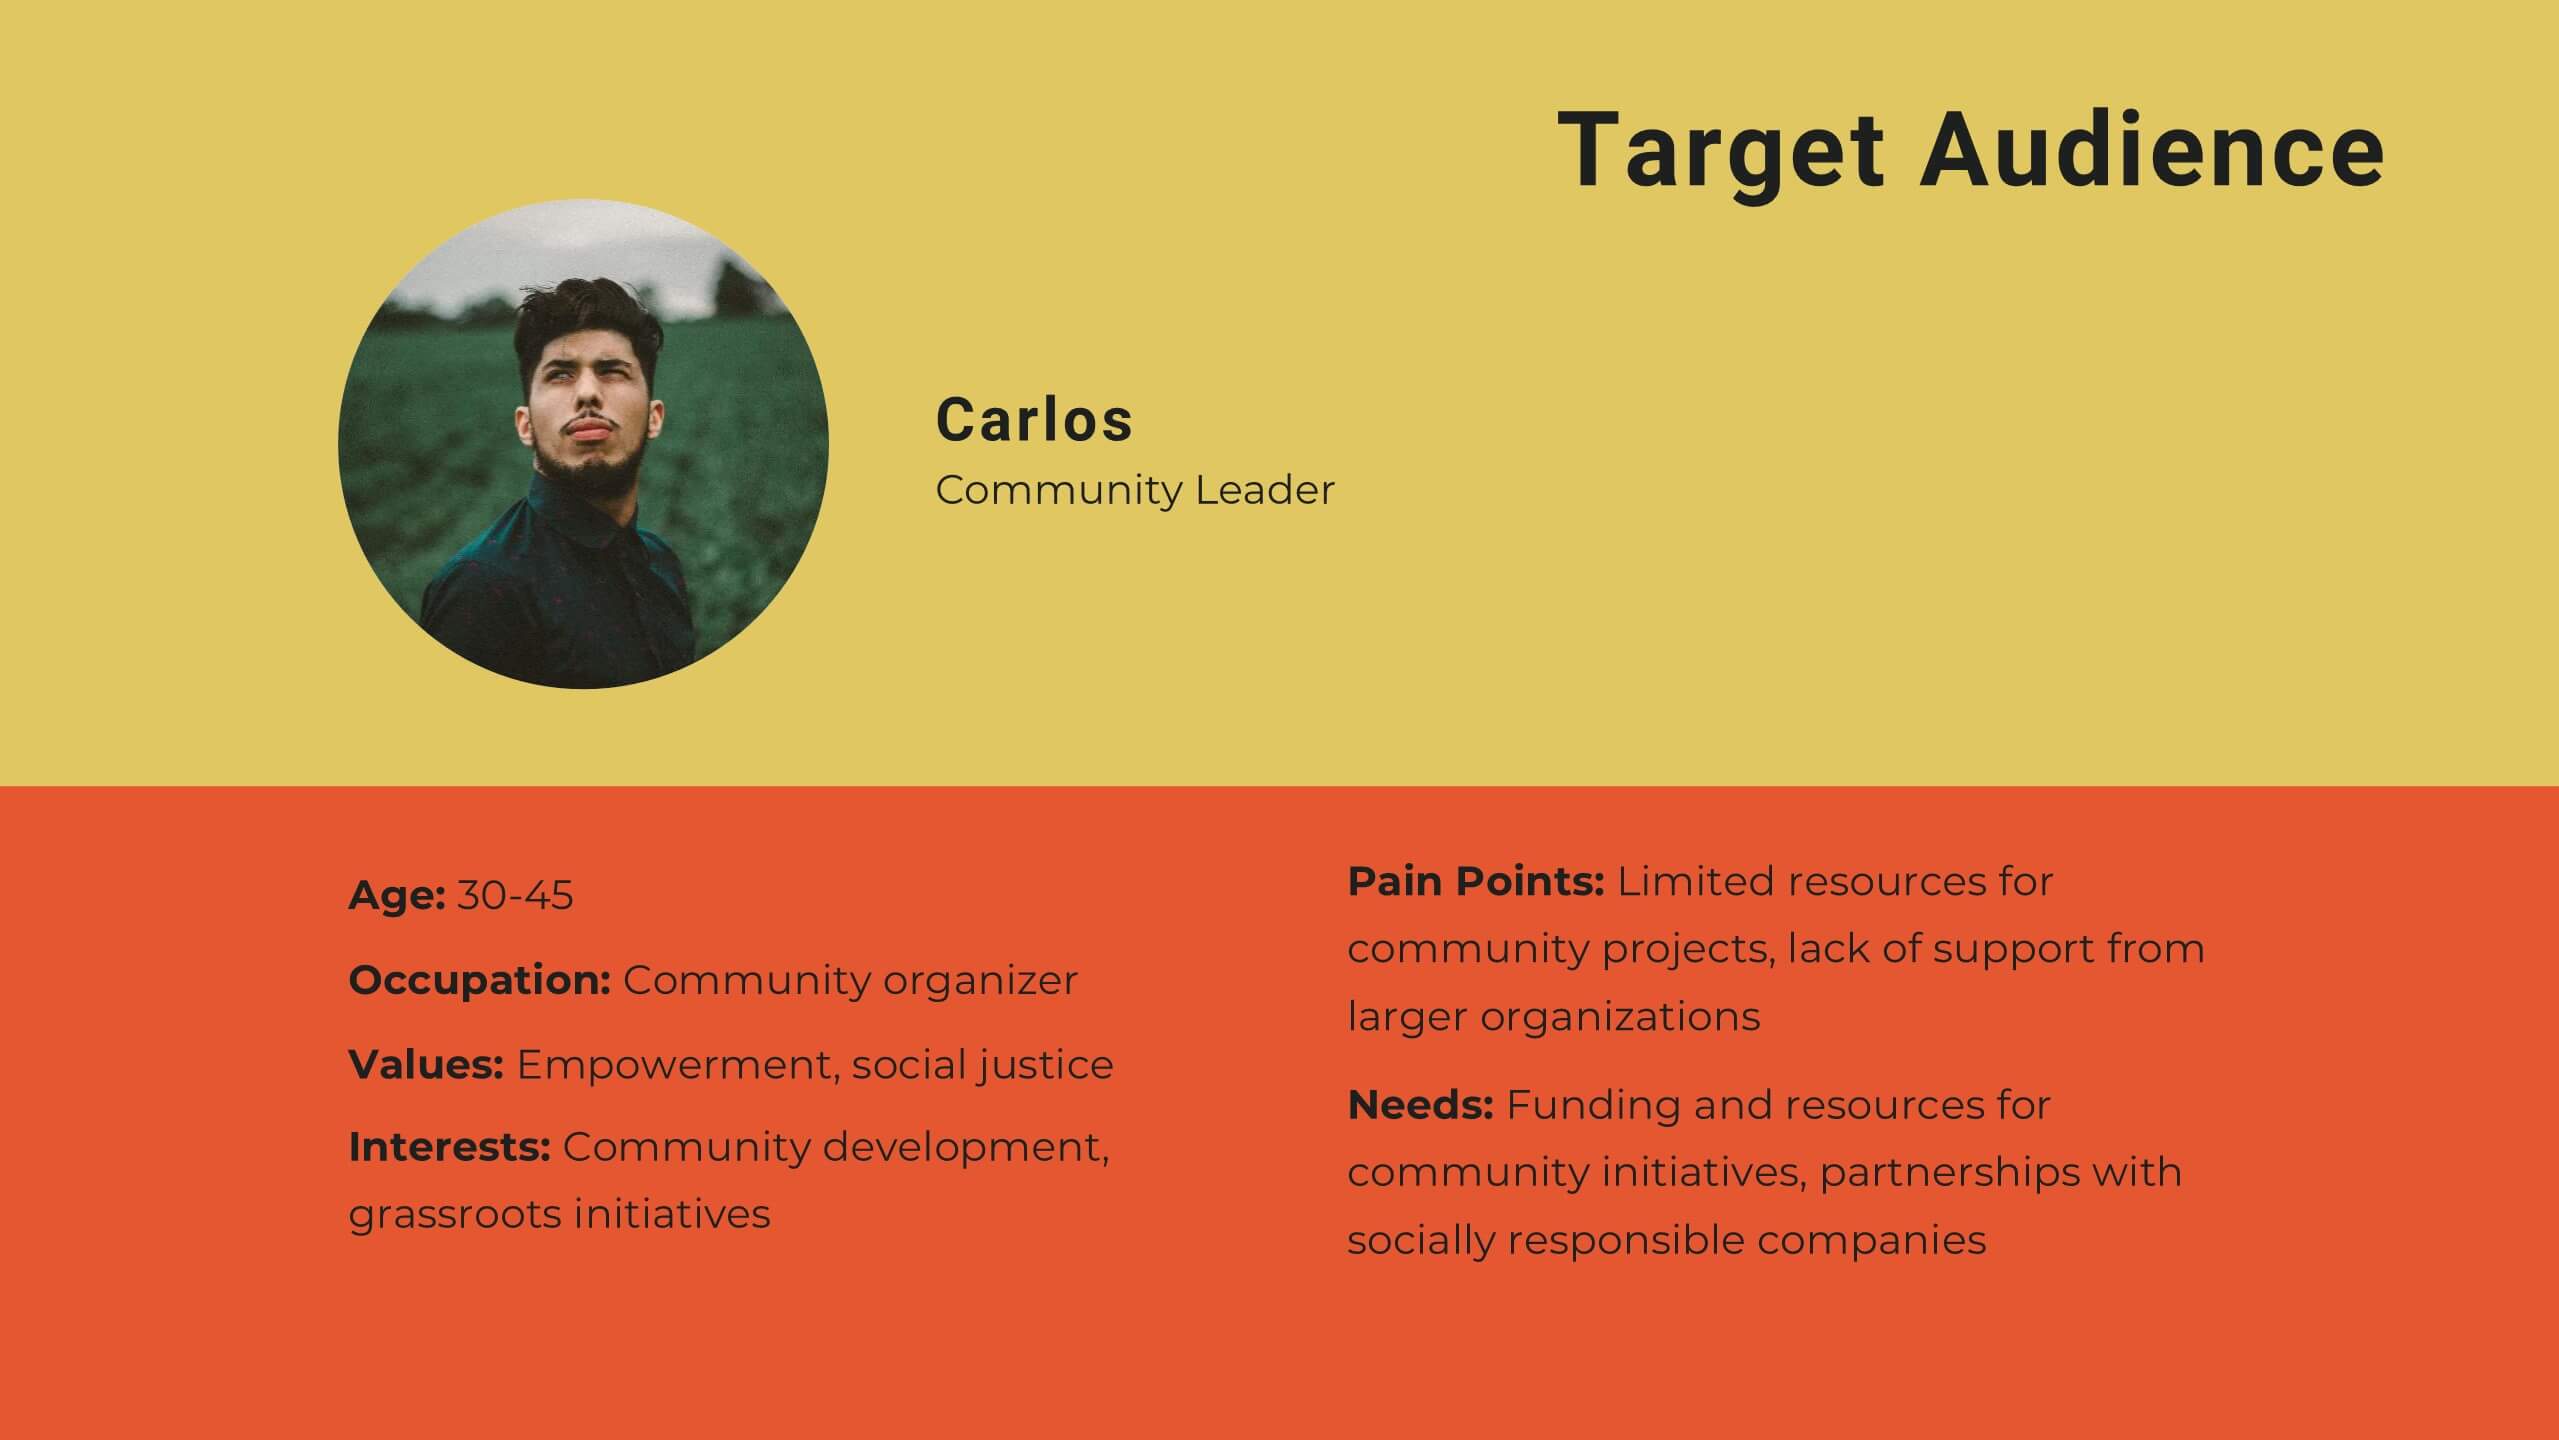
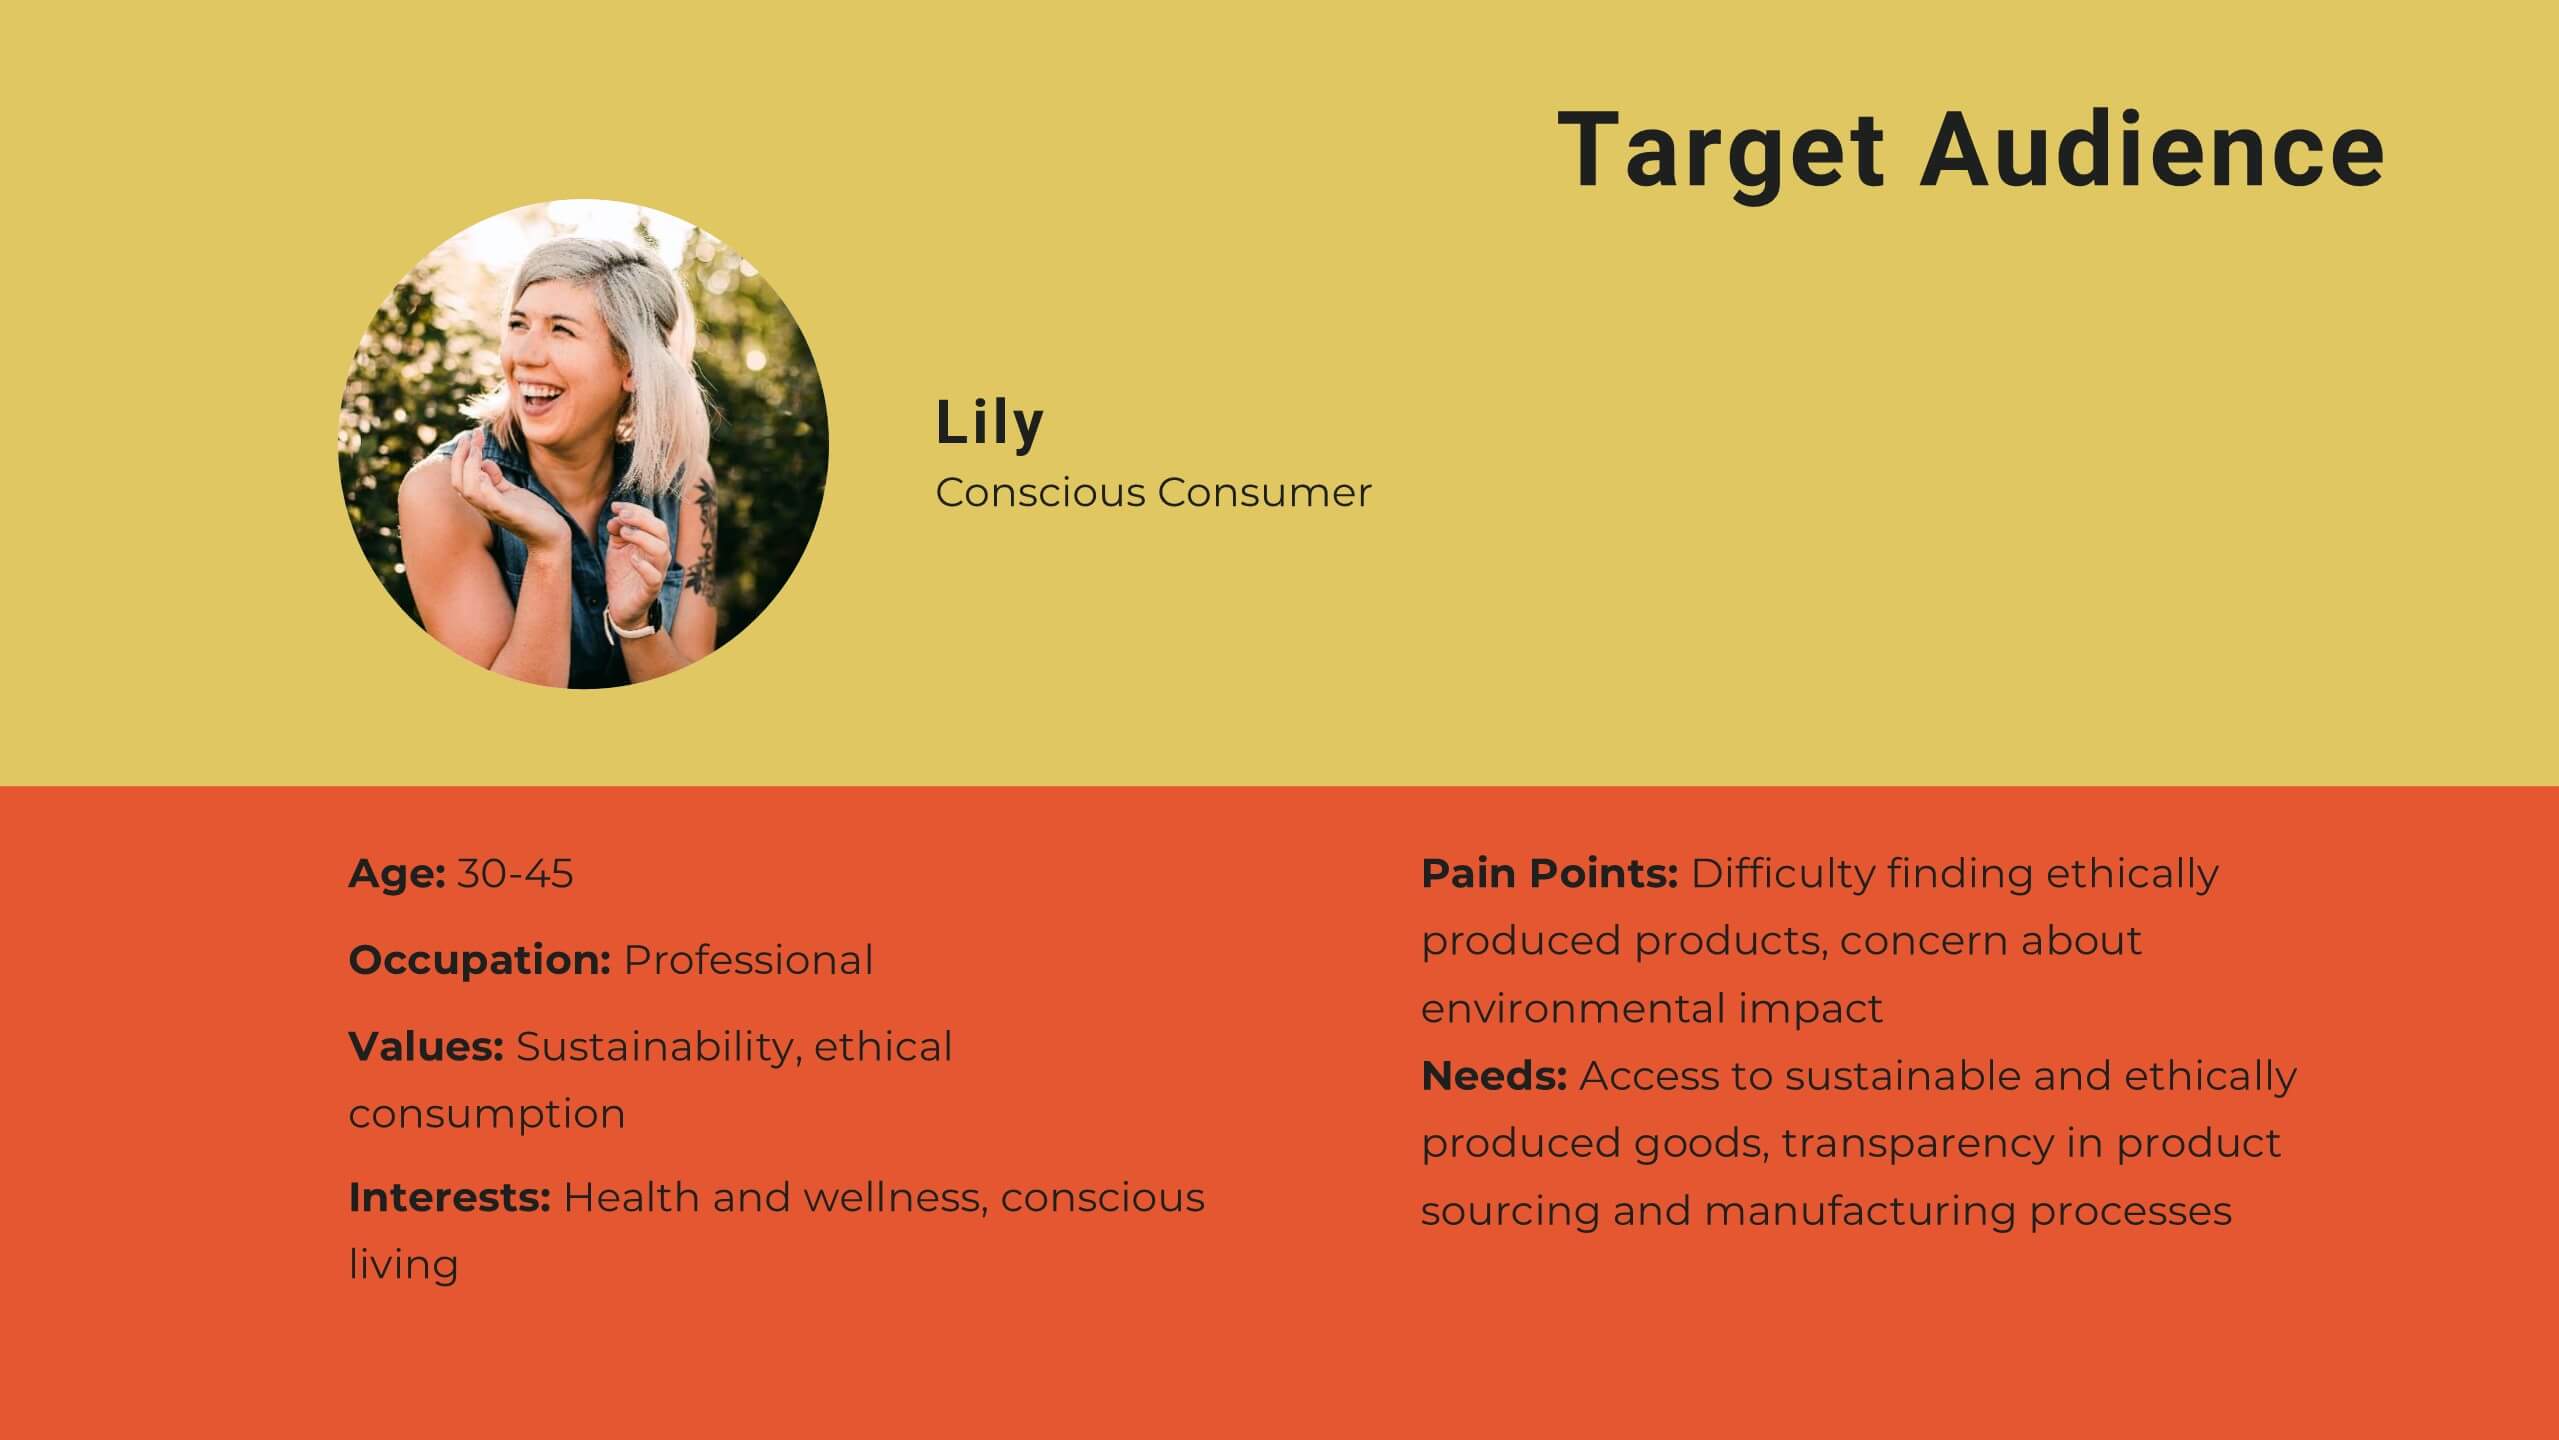
Present your brand strategy with confidence using this vibrant, structured template! Covering brand identity, values, audience personas, and positioning, this template is perfect for crafting a compelling brand narrative. Fully customizable, it’s designed for seamless use in PowerPoint, Keynote, and Google Slides, making it an ideal tool for branding presentations.


5 diapositivas
Studio Photography Infographics
Studio Photography is the practice of capturing photographs in a controlled environment, typically a dedicated photography studio. These infographic templates highlight the key aspects of studio photography with examples of fashion photography, photojournalism, and photography terminology. These are designed to assist photographers, photography studios, and enthusiasts in showcasing the essential elements and techniques involved in capturing stunning images in a studio setting. Use these to provides valuable insights and techniques to help your audience create stunning images in a studio environment. Compatible with Powerpoint, Keynote, and Google Slides.


5 diapositivas
Online Learning Platforms and Strategies Presentation
Simplify complex educational strategies with this layered house-shaped diagram designed for digital learning topics. Each tier represents a strategic element of your e-learning platform, from planning to implementation. Featuring five clearly labeled sections with editable icons and text, this slide is ideal for showcasing course structures, platform features, or training rollouts. Fully customizable in PowerPoint, Keynote, and Google Slides.


28 diapositivas
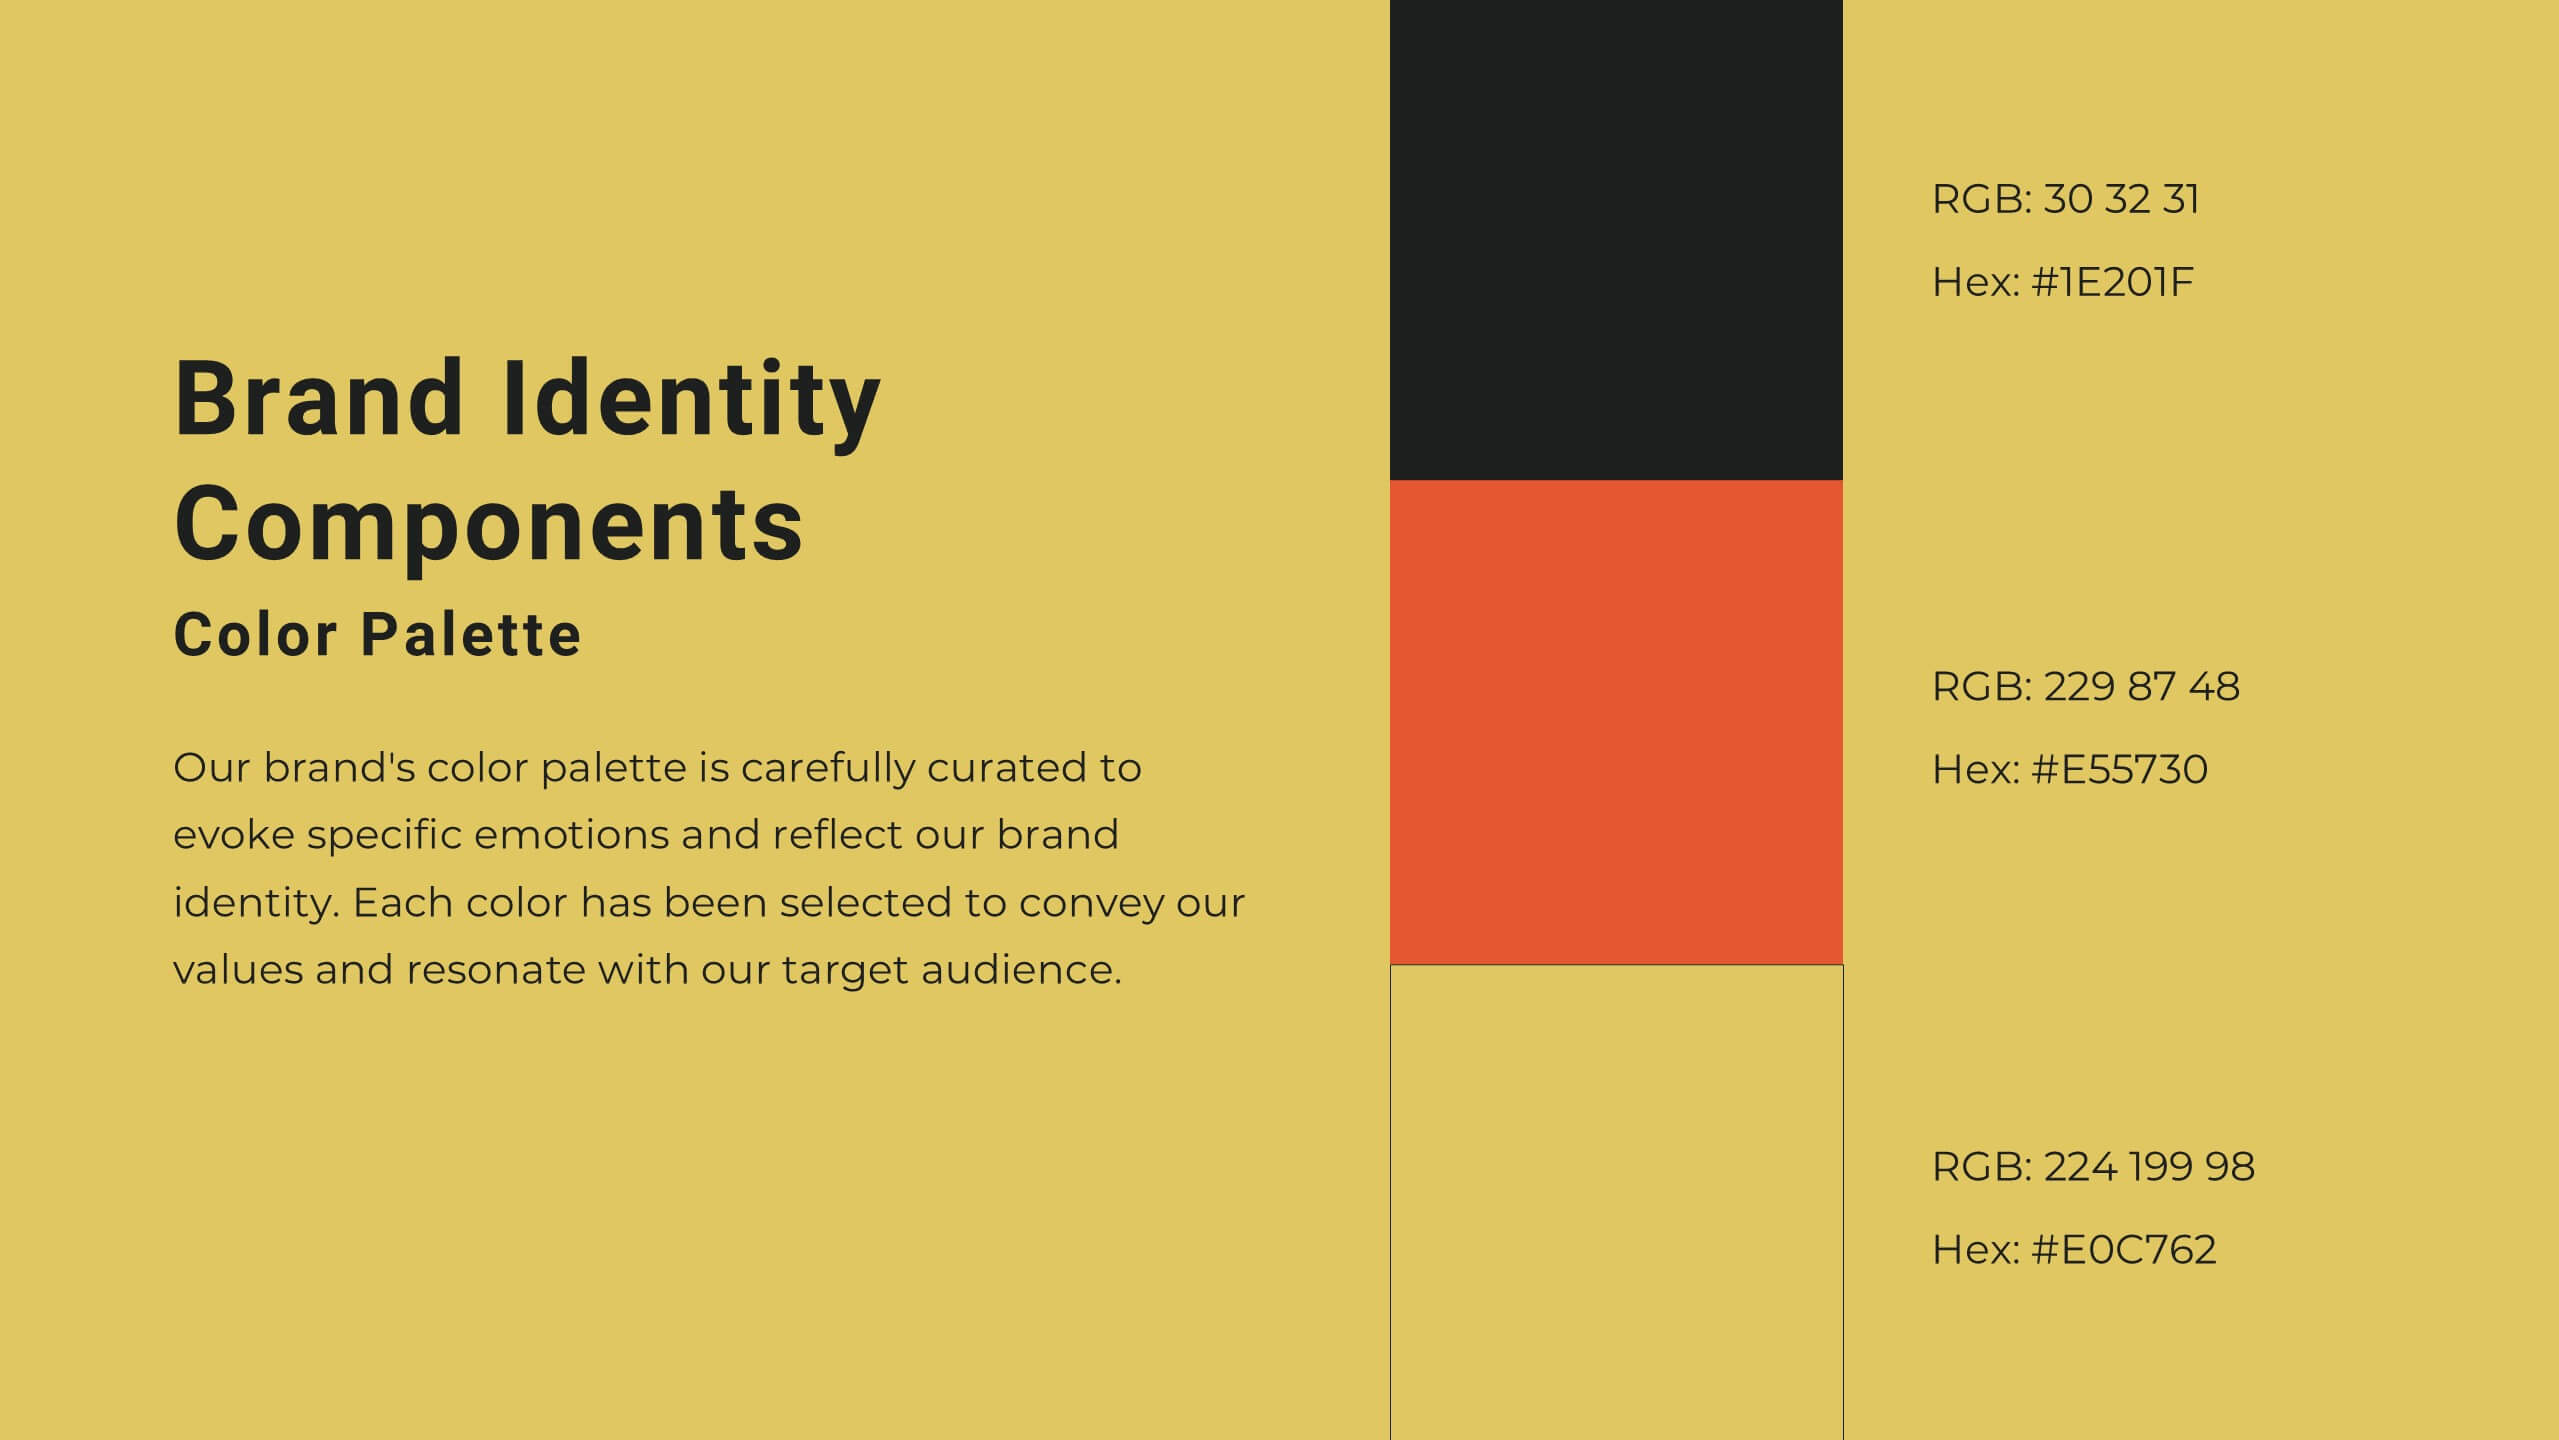
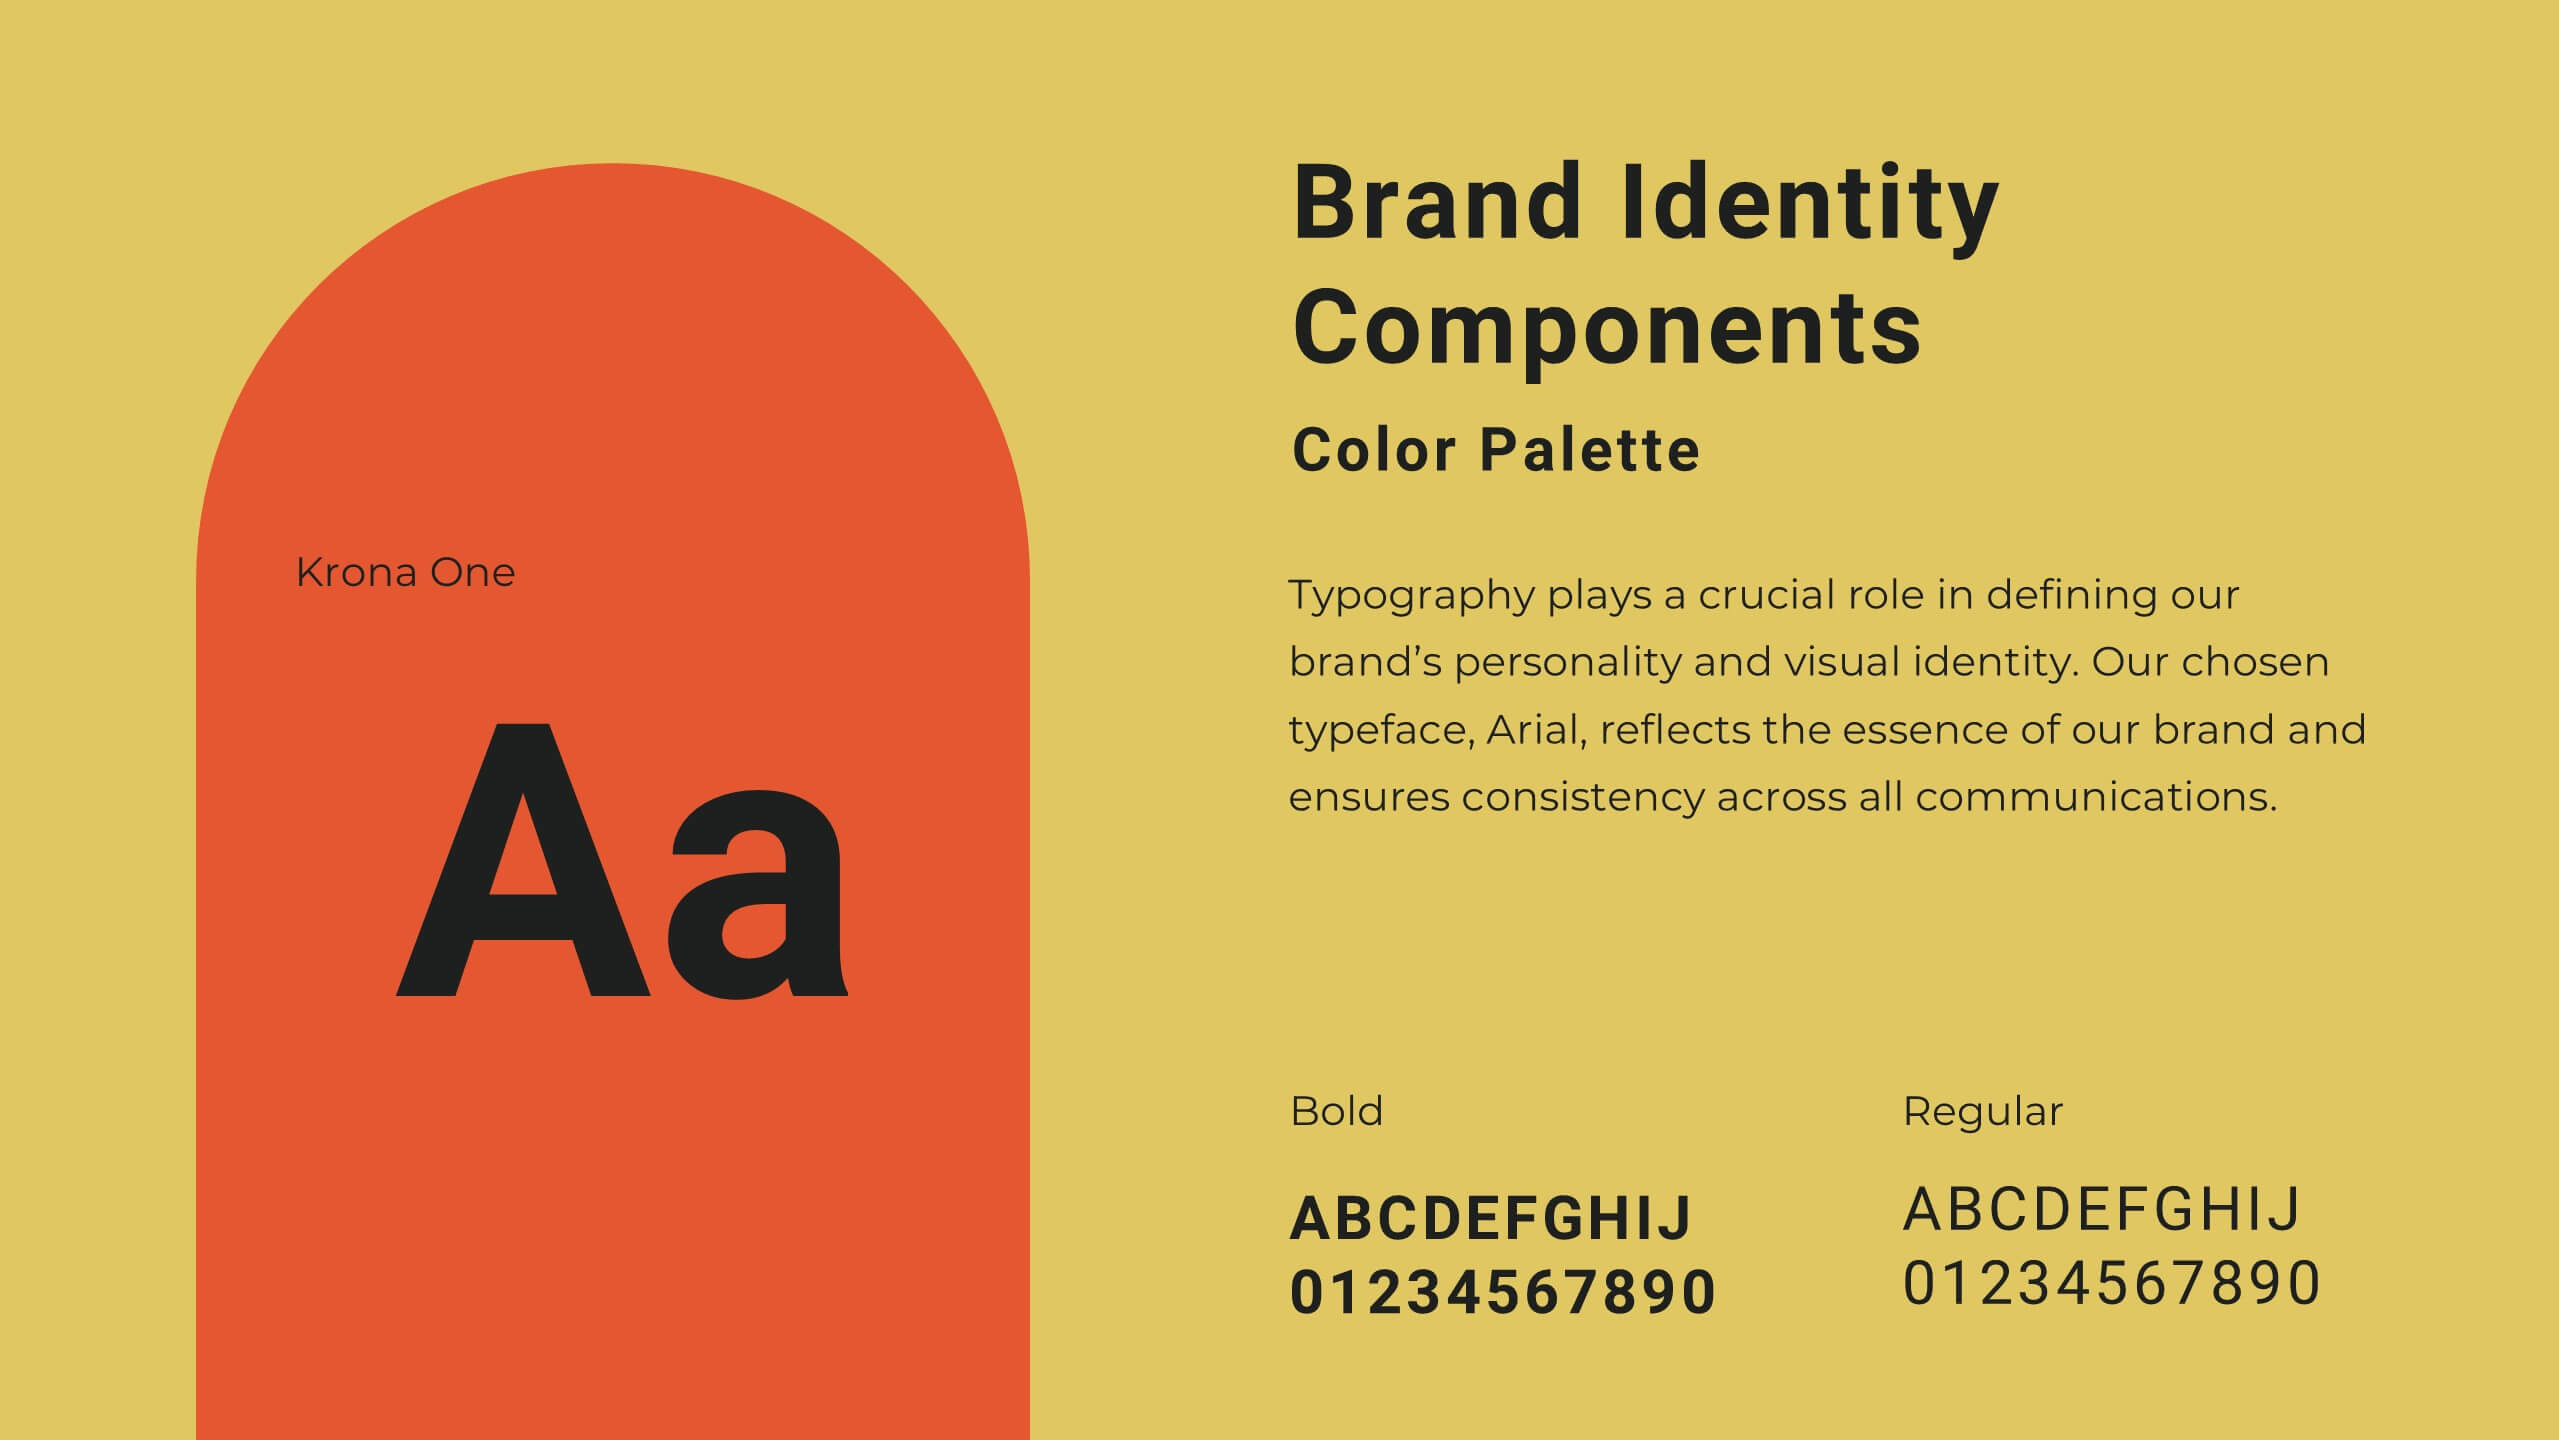
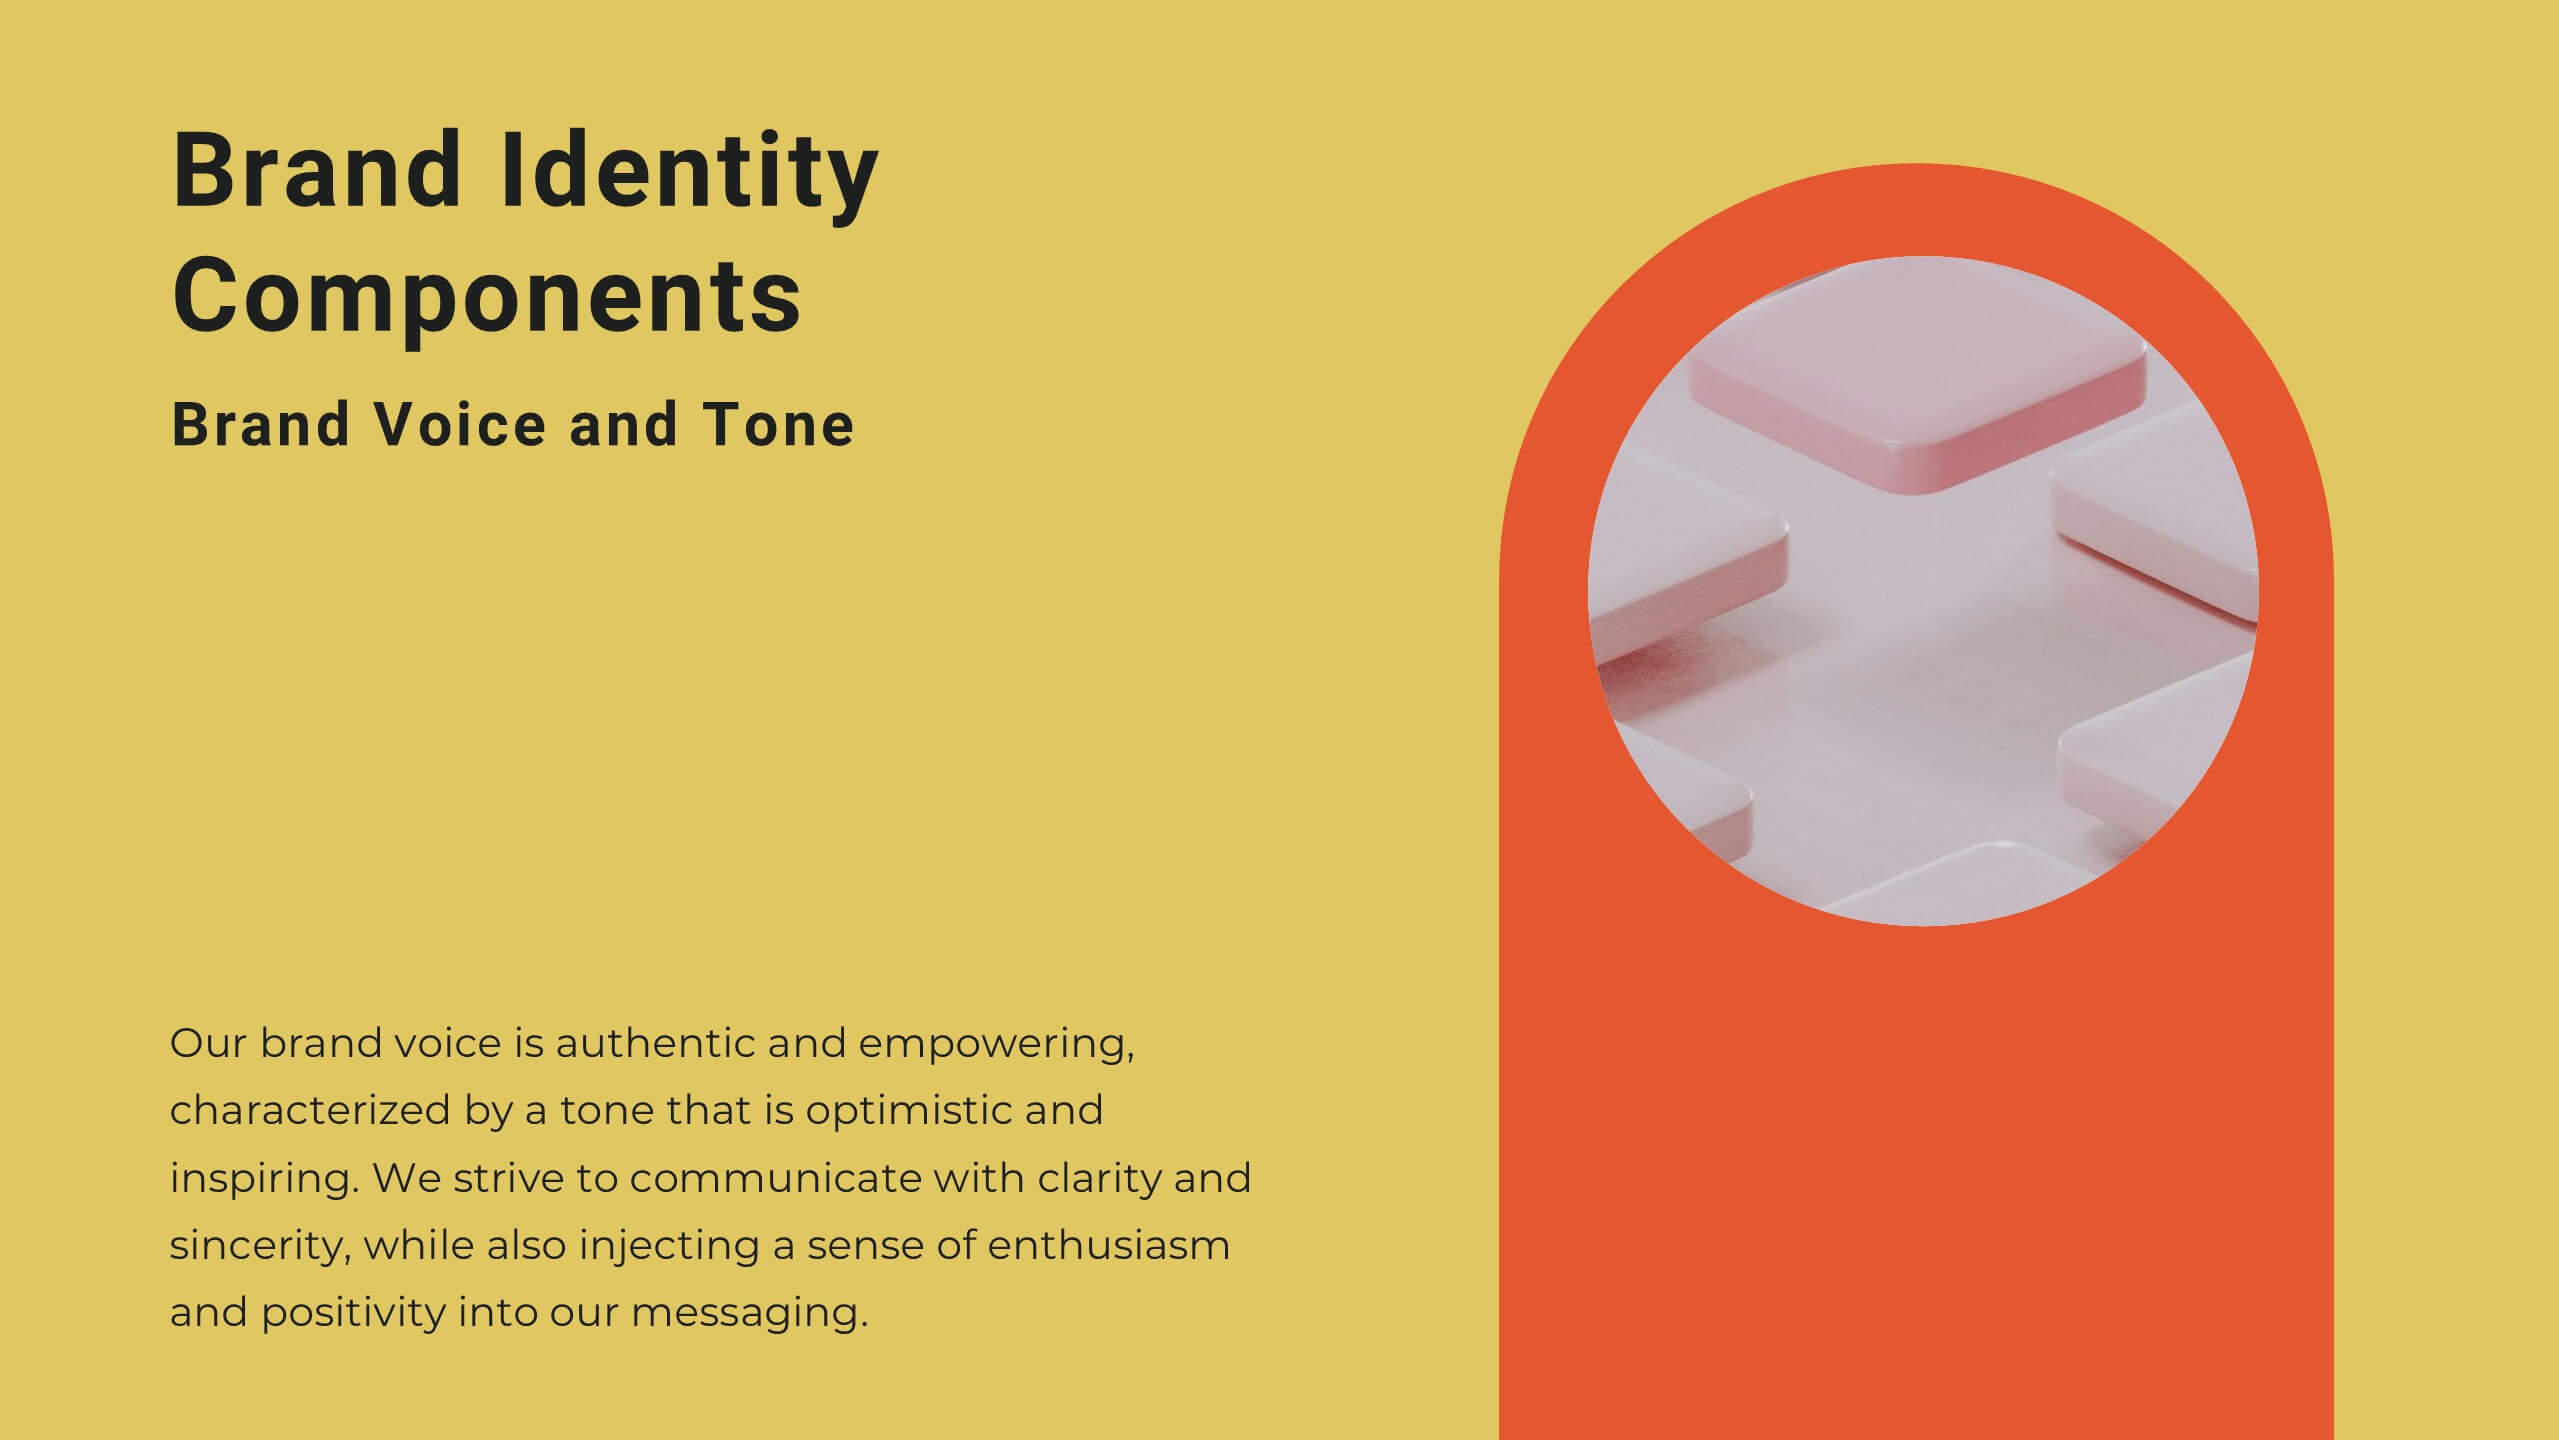
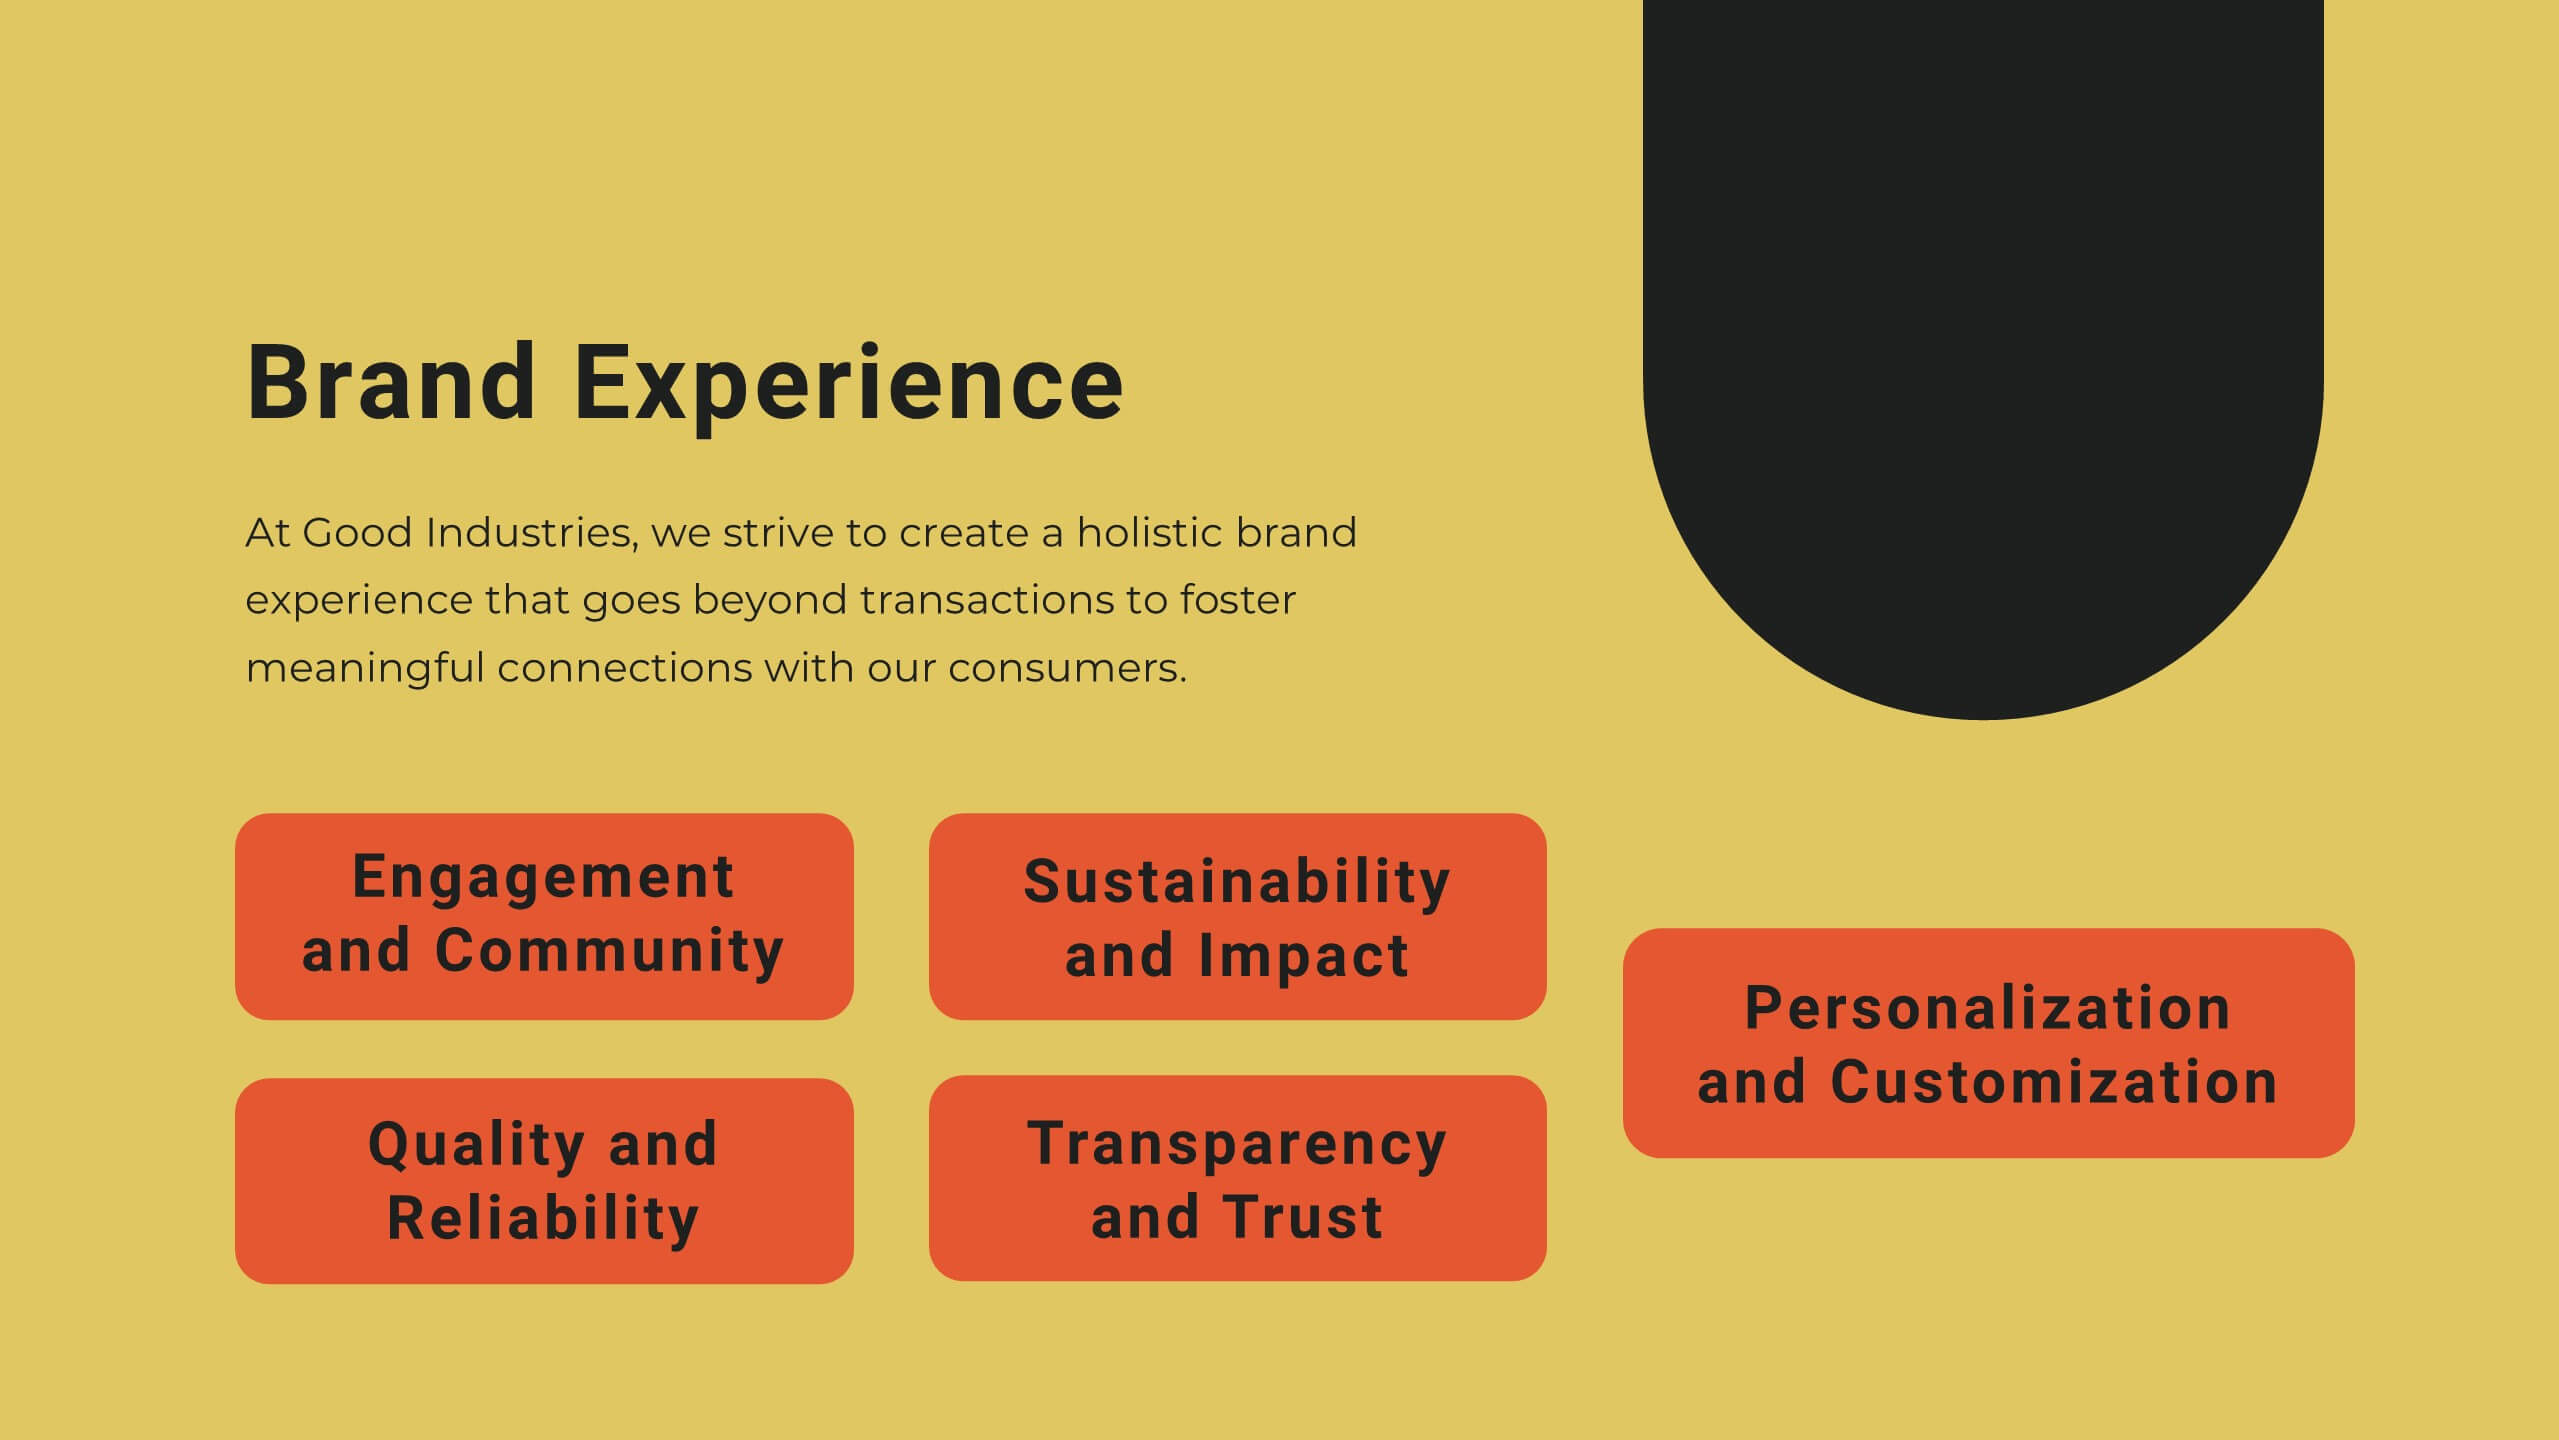
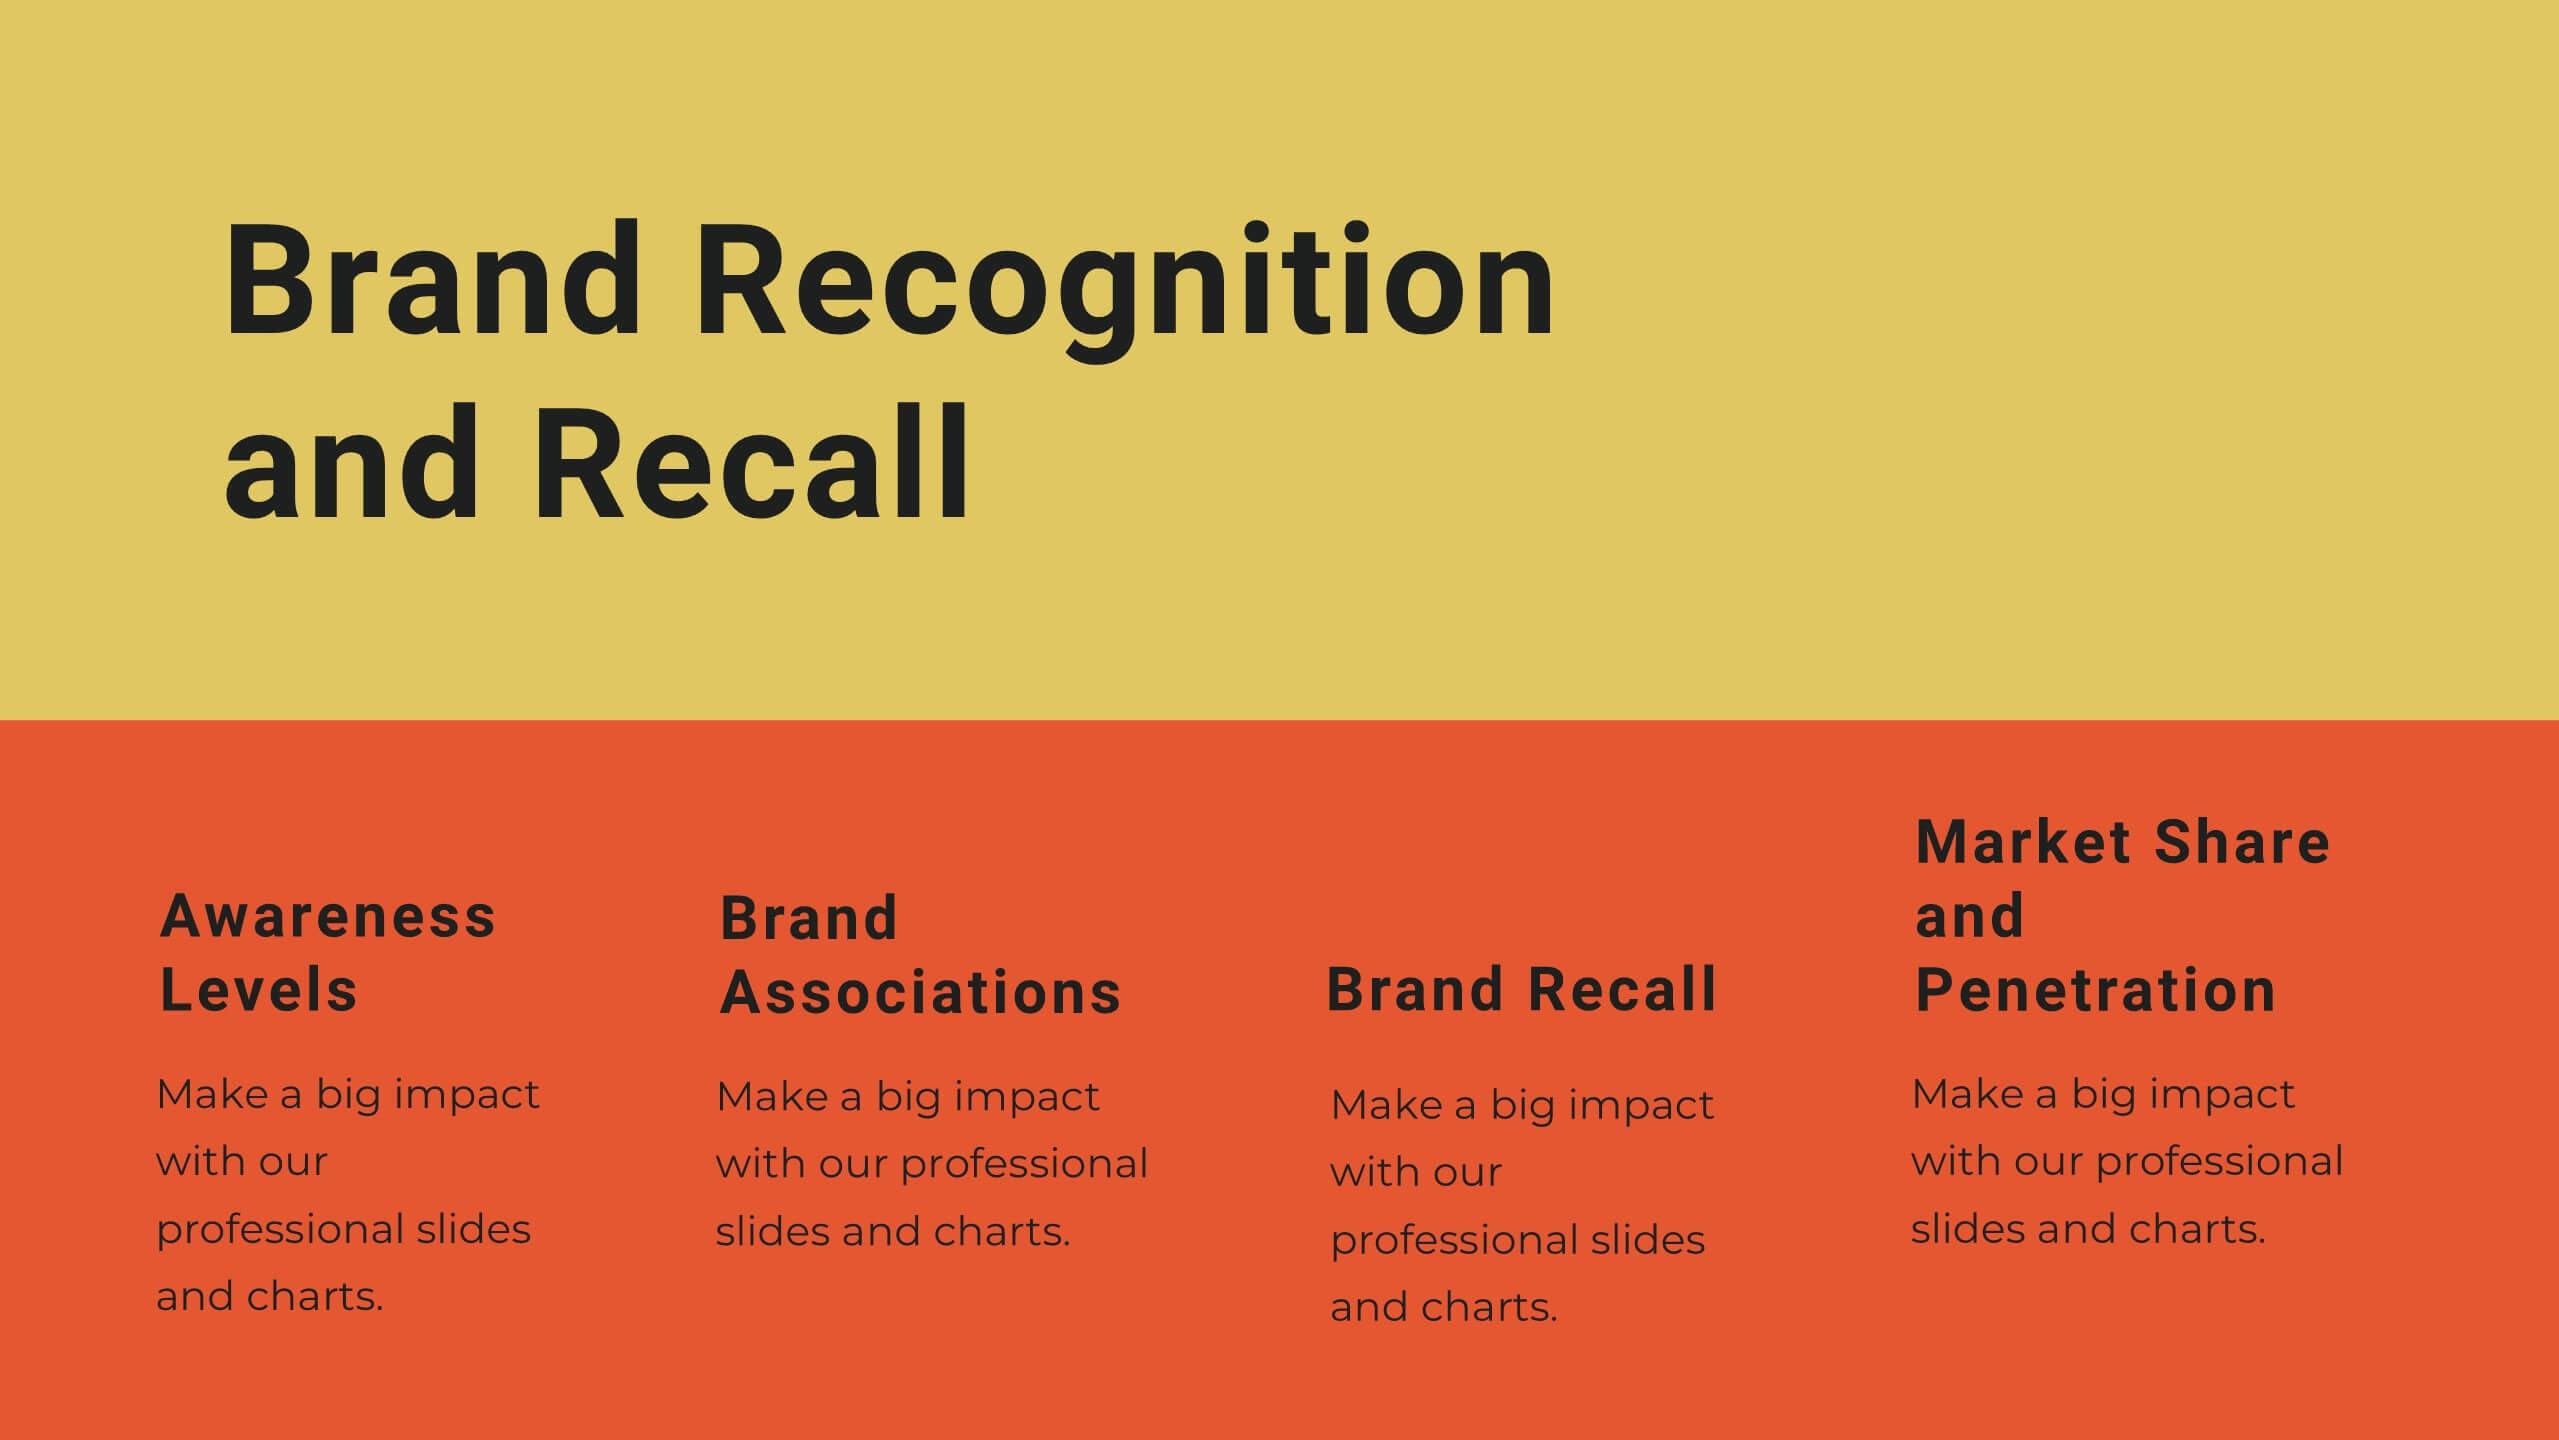
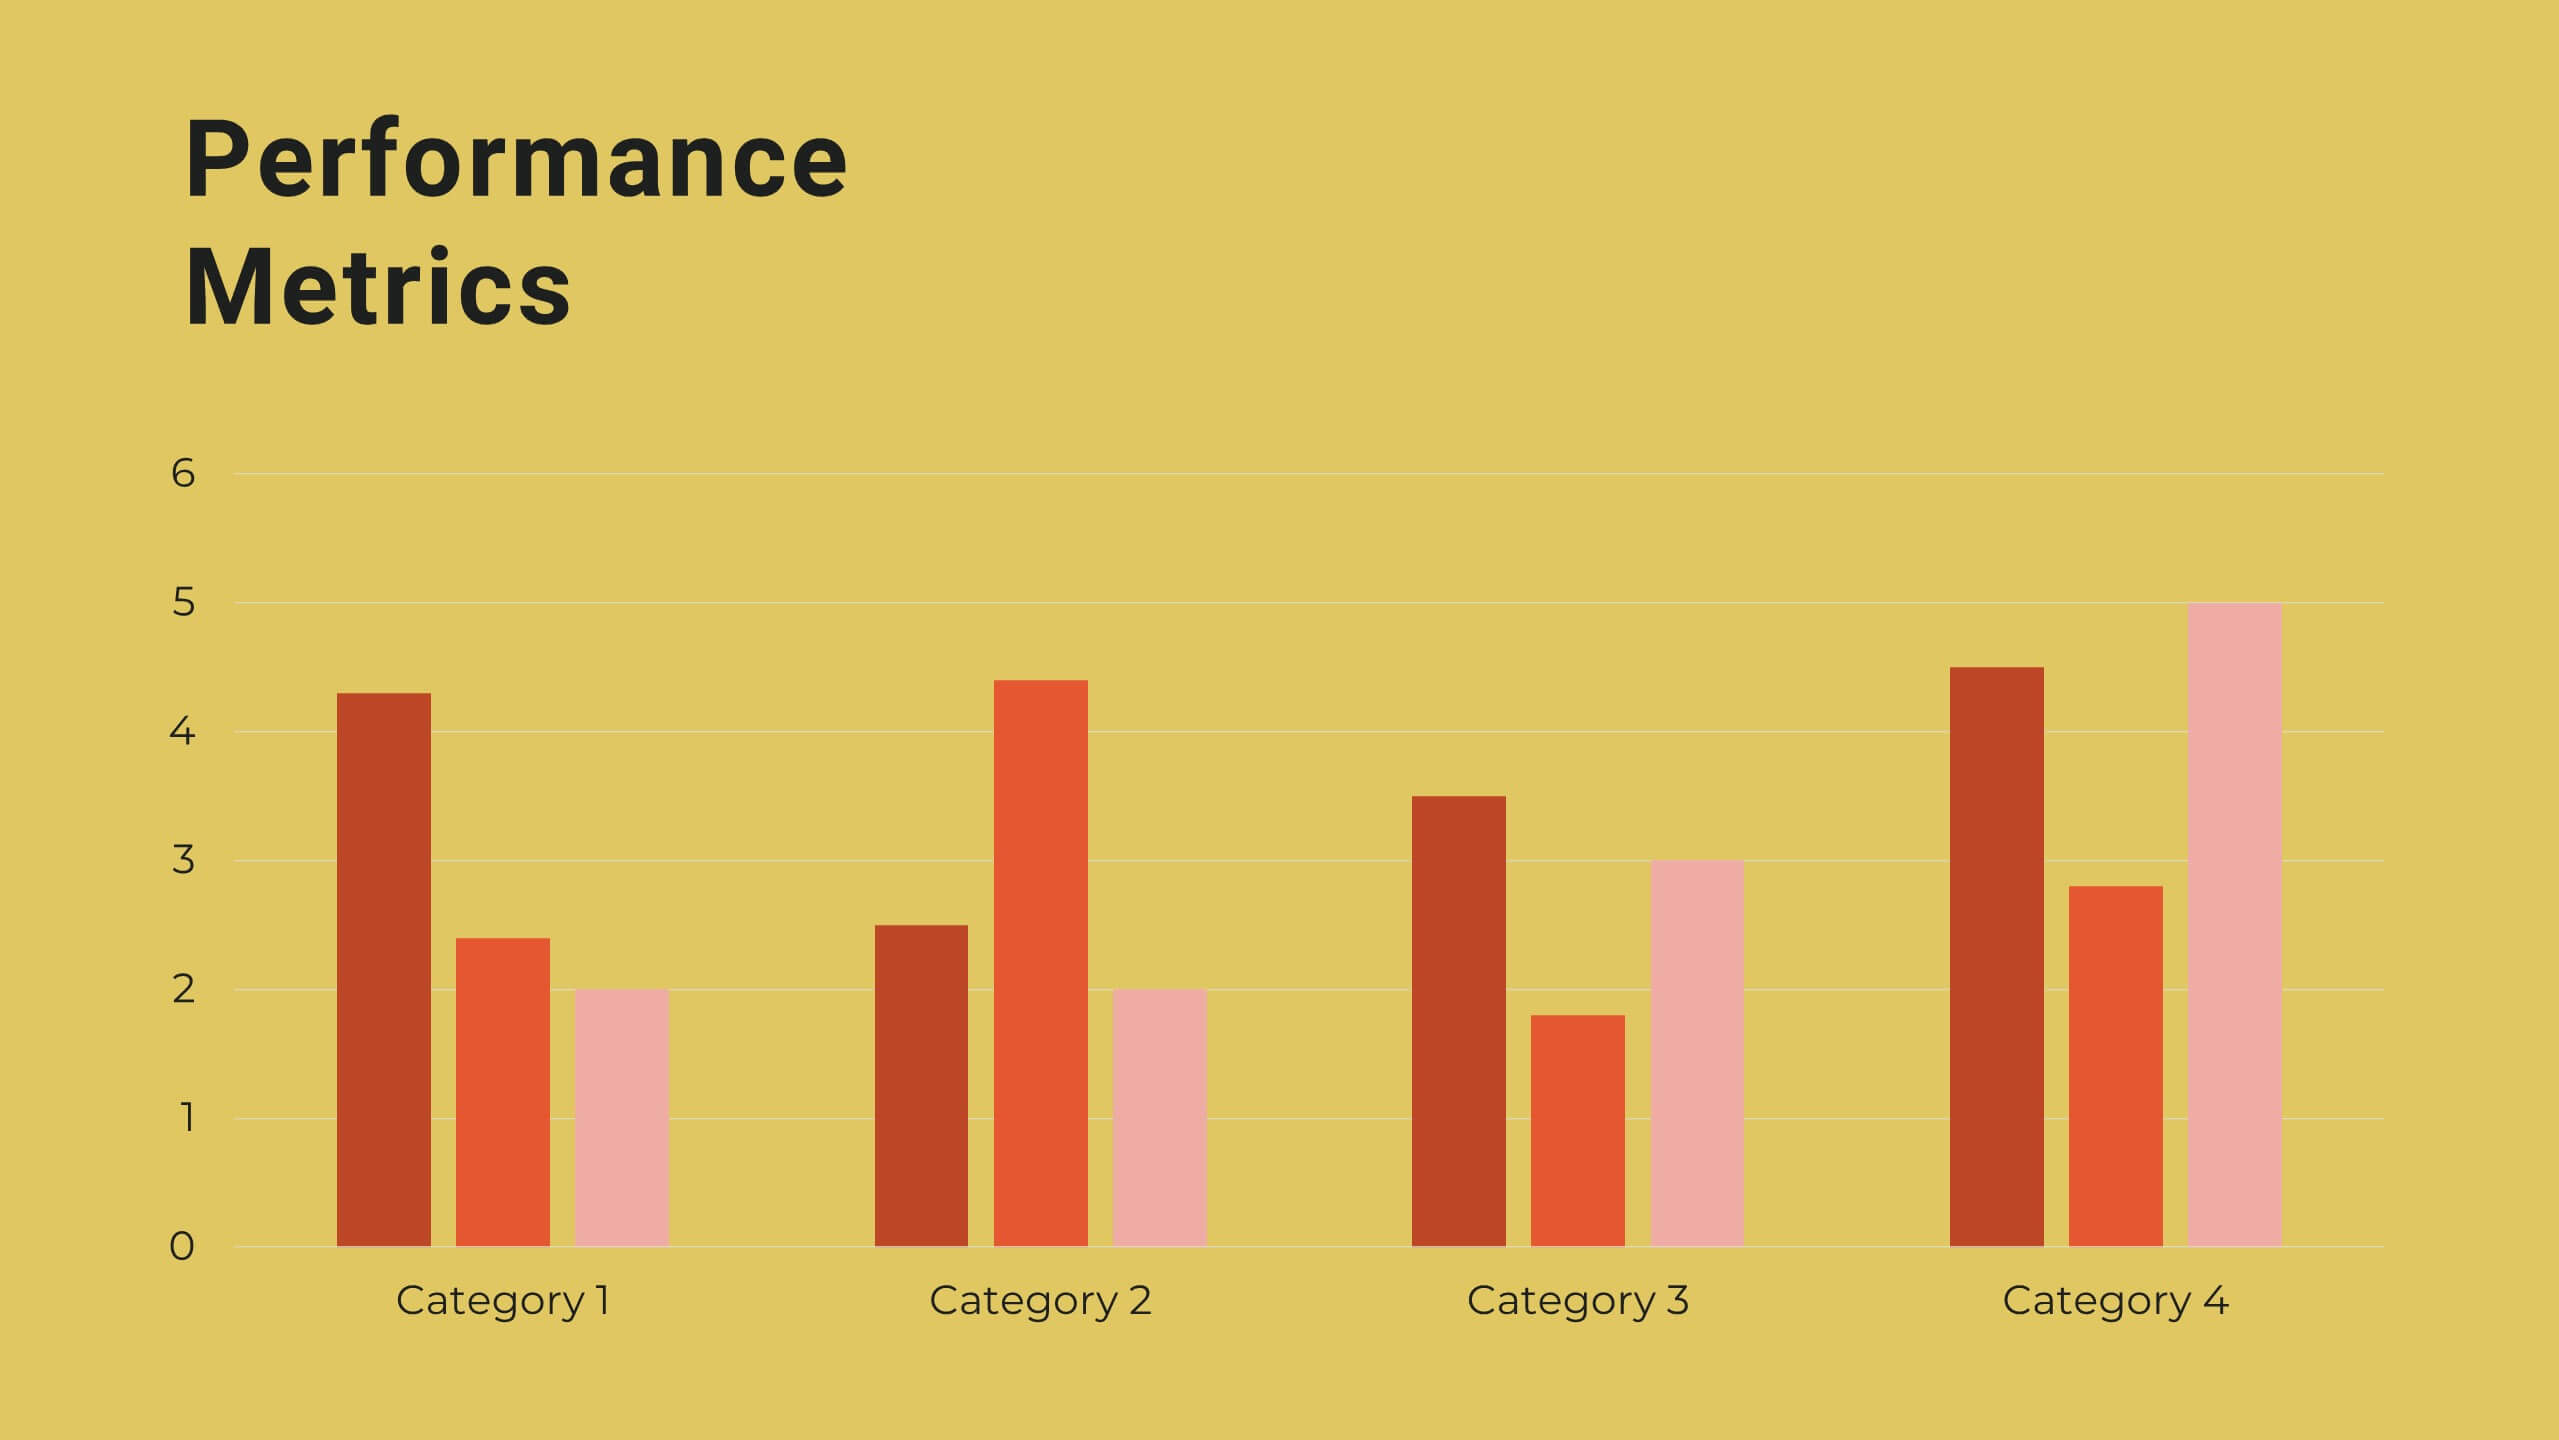
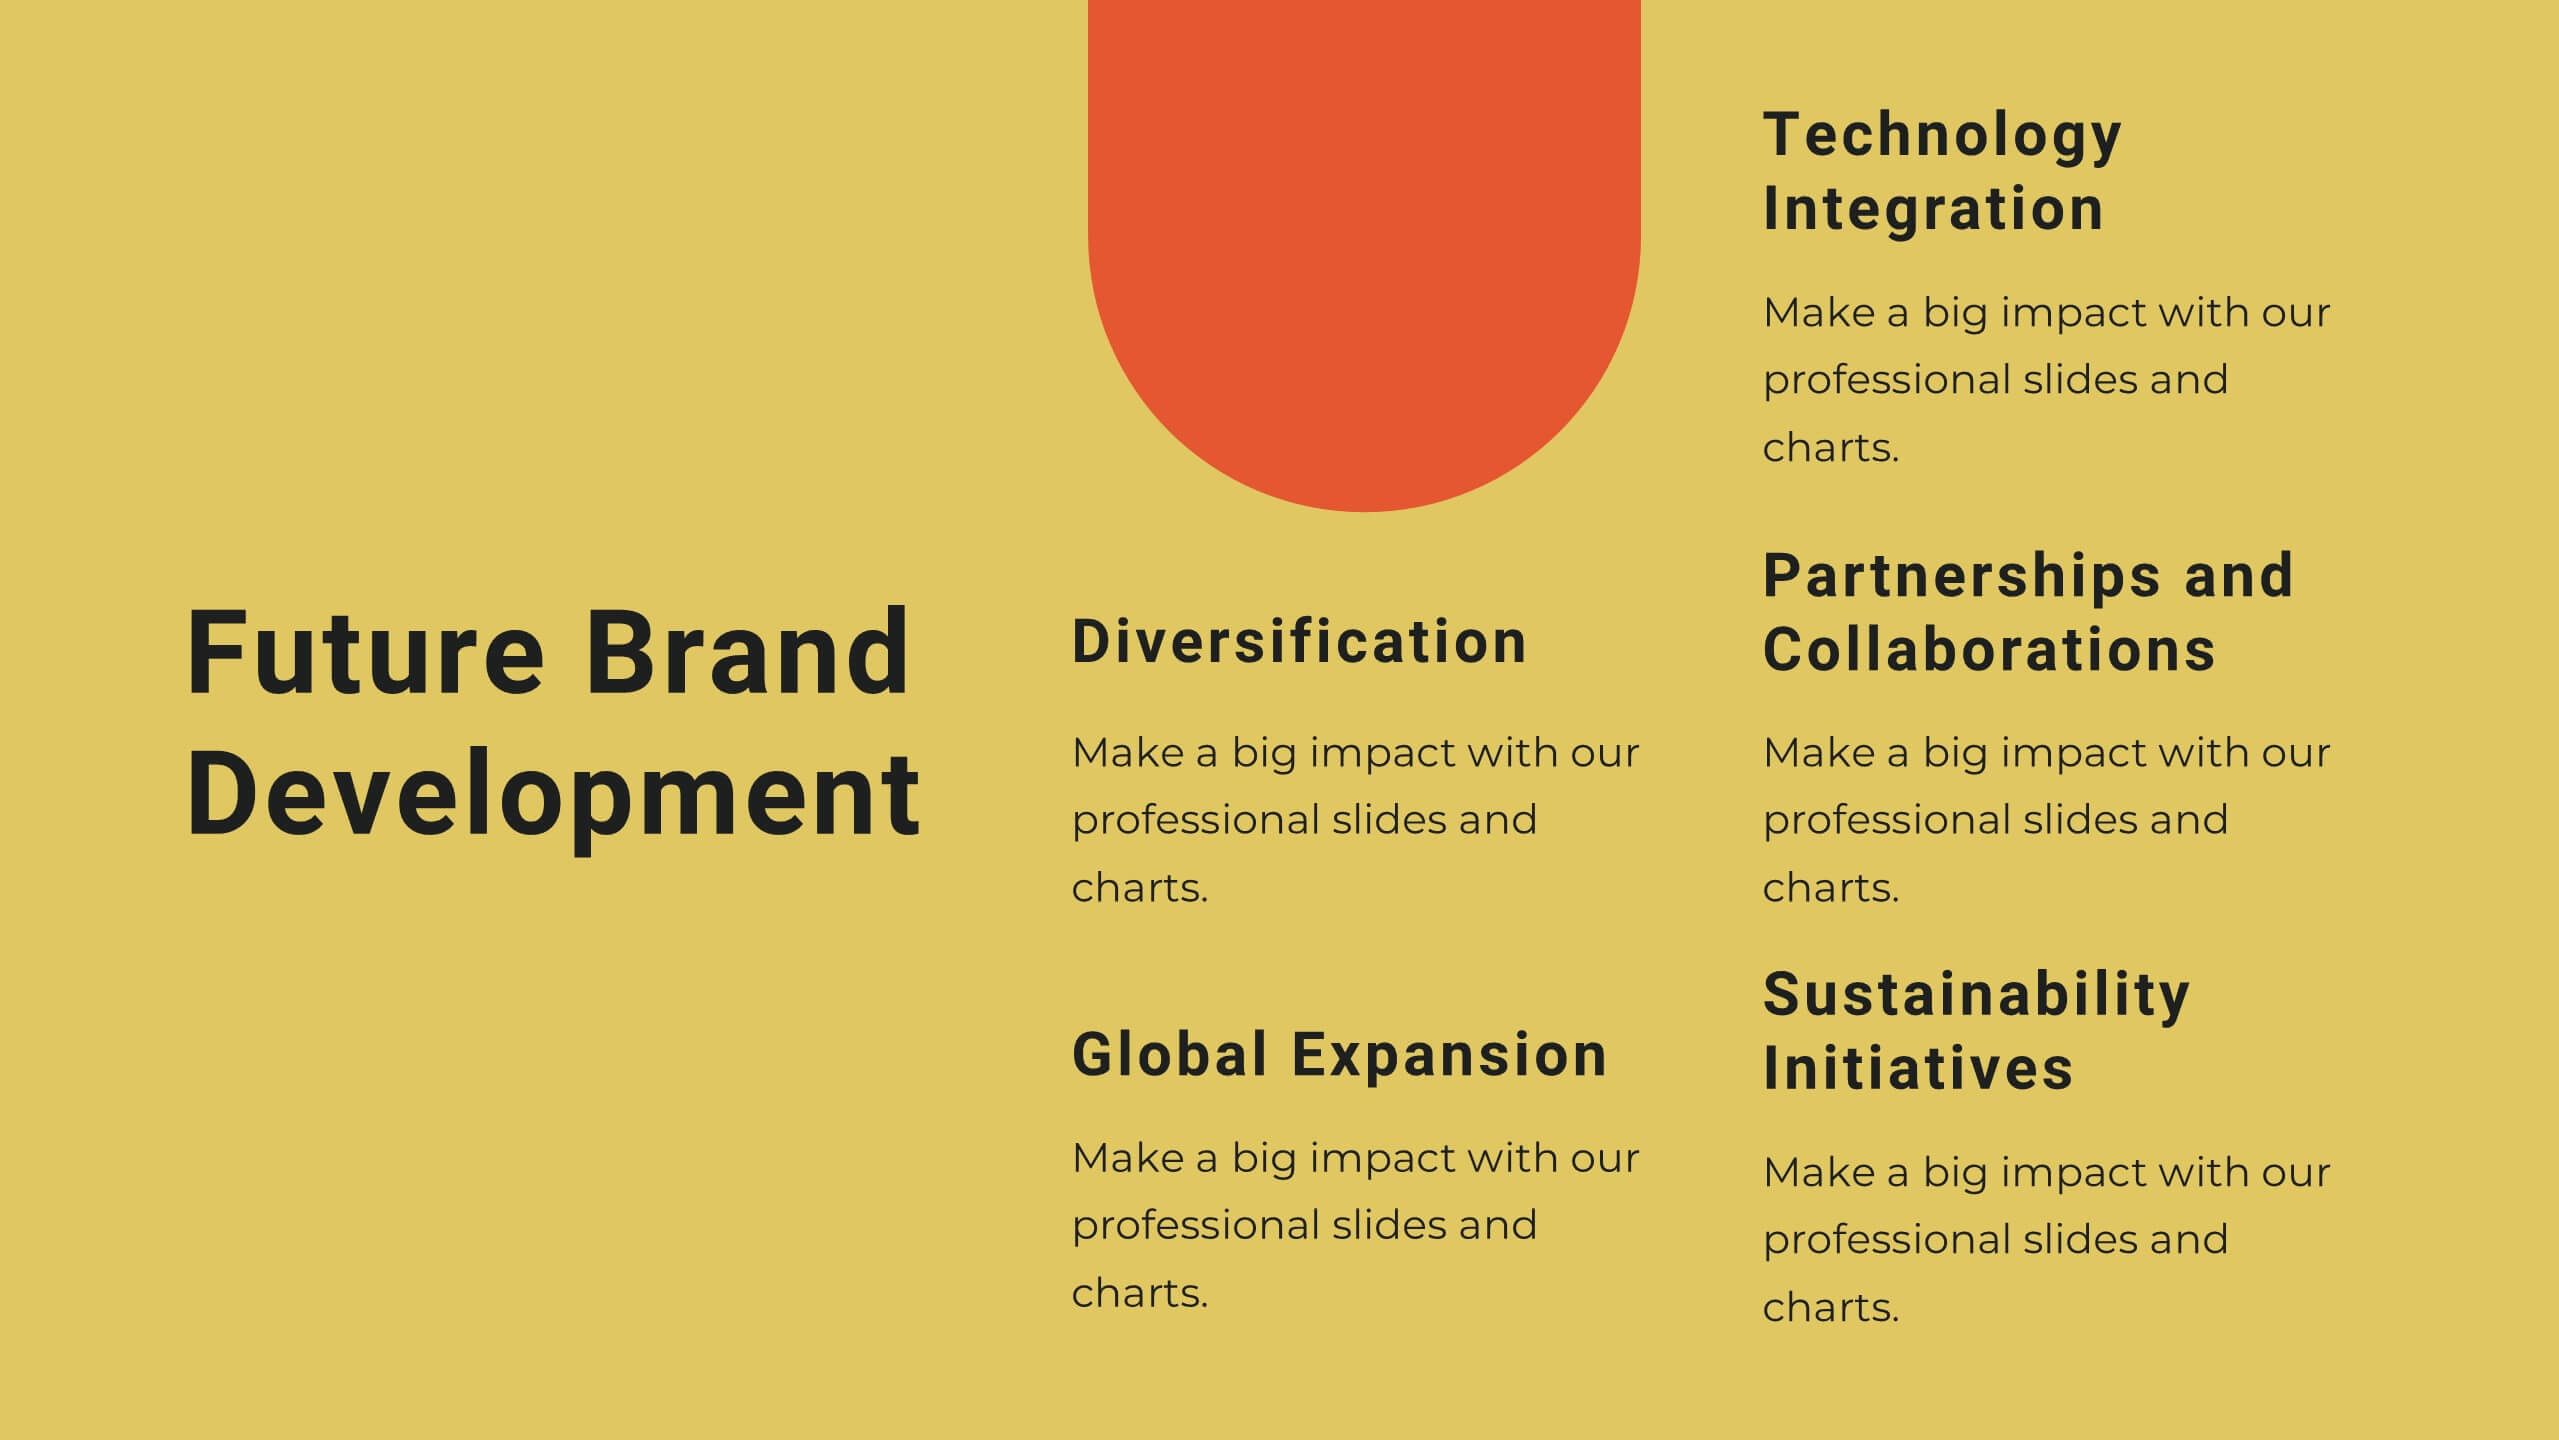
Legacy Brand Development Pitch Deck Presentation
Elevate your brand presentations with this sleek, modern template. Perfect for outlining brand identity, market analysis, and unique selling propositions, it features a stylish design with vibrant colors. Highlight your brand's voice, tone, and positioning to captivate your audience. Compatible with PowerPoint, Keynote, and Google Slides, it ensures seamless presentations on any platform.


7 diapositivas
Value Chain Business Infographic
The value chain is a concept used in business management to describe the full range of activities that businesses go through to bring a product or service from conception to delivery to customers. This infographic template is designed to showcase the various activities and processes that add value to your product or service, enlightening your audience about the holistic journey from start to finish. Compatible with Powerpoint, Keynote, and Google Slides. Present a visual representation of a value chain analysis, emphasizing the importance of evaluating each activity's contribution to the overall value.