


Características


¿Tienes alguna pregunta?
Recomendar


6 diapositivas
5G Network Infographic
5G, short for fifth-generation wireless technology, is the latest generation of mobile network technology designed to provide faster, more reliable, and higher capacity wireless communication. This infographic template is designed to educate viewers about the key features, benefits, and impact of 5G technology on various aspects of our lives. This template aims to provide a comprehensive and easy-to-understand overview of the transformative capabilities of 5G technology. It serves as a valuable resource for individuals, businesses, and organizations seeking to understand the potential impact and benefits of 5G on various aspects of our lives and the broader technological landscape.

20 diapositivas
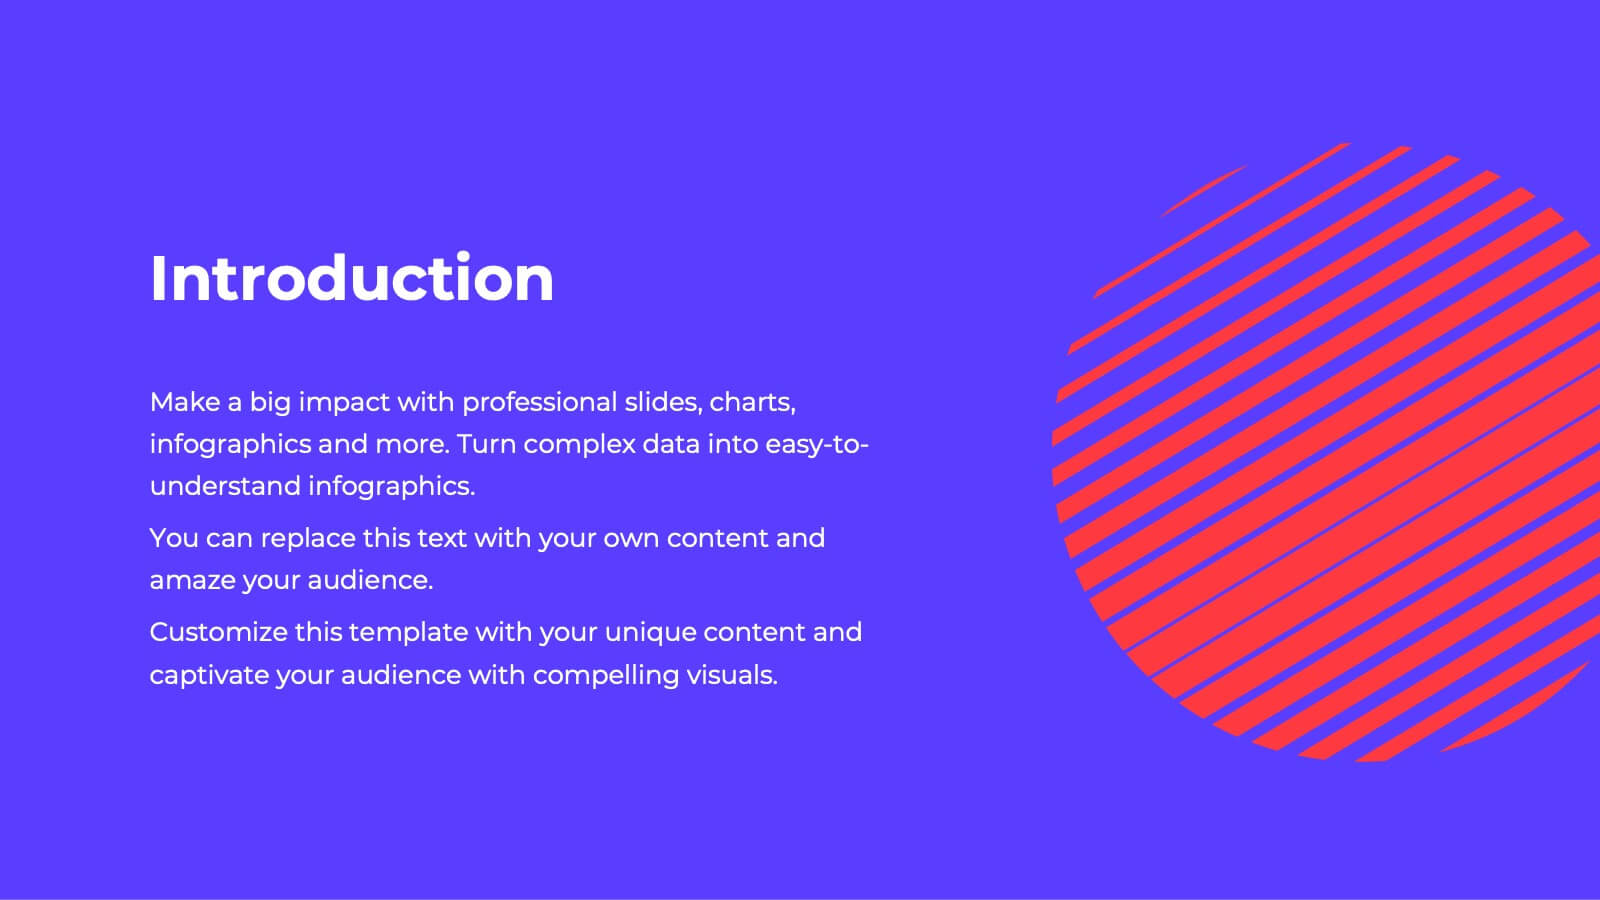
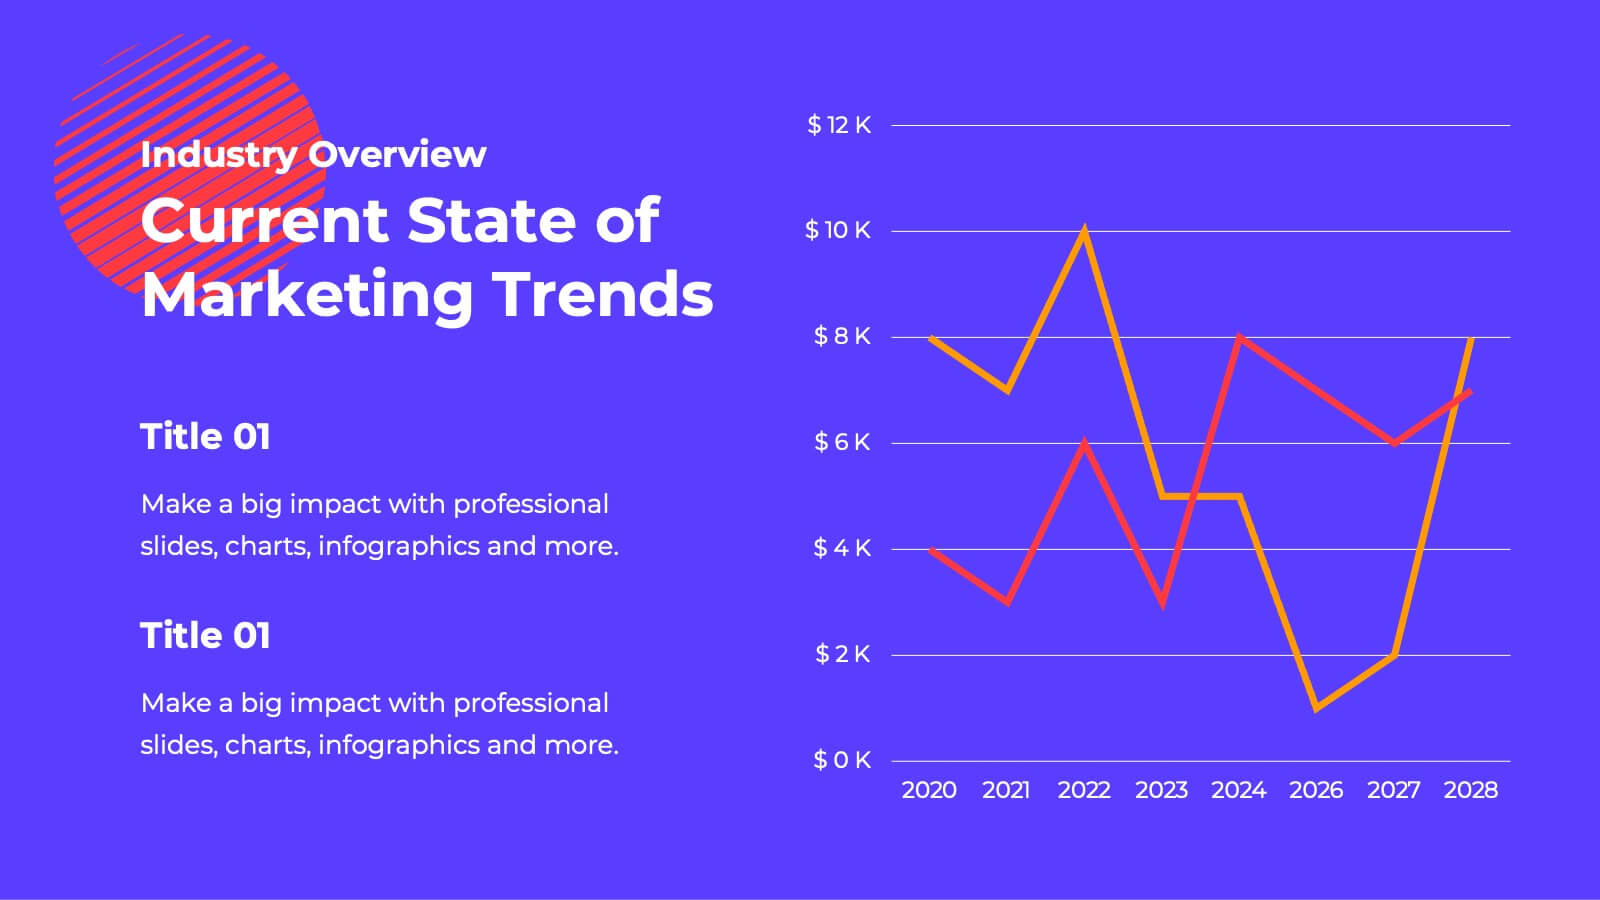
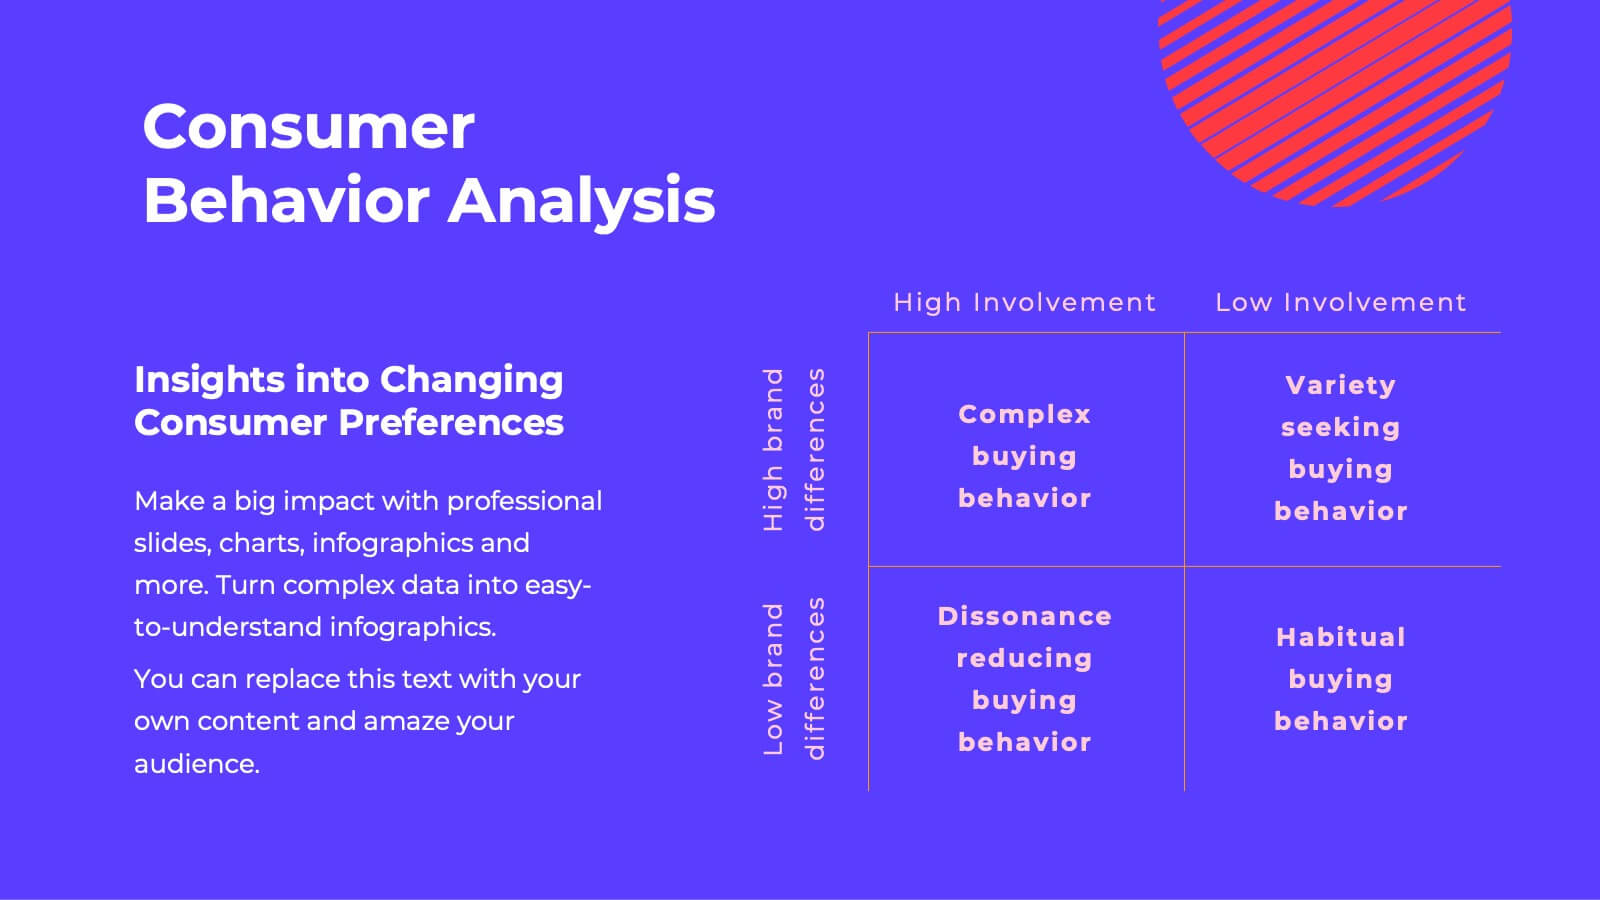
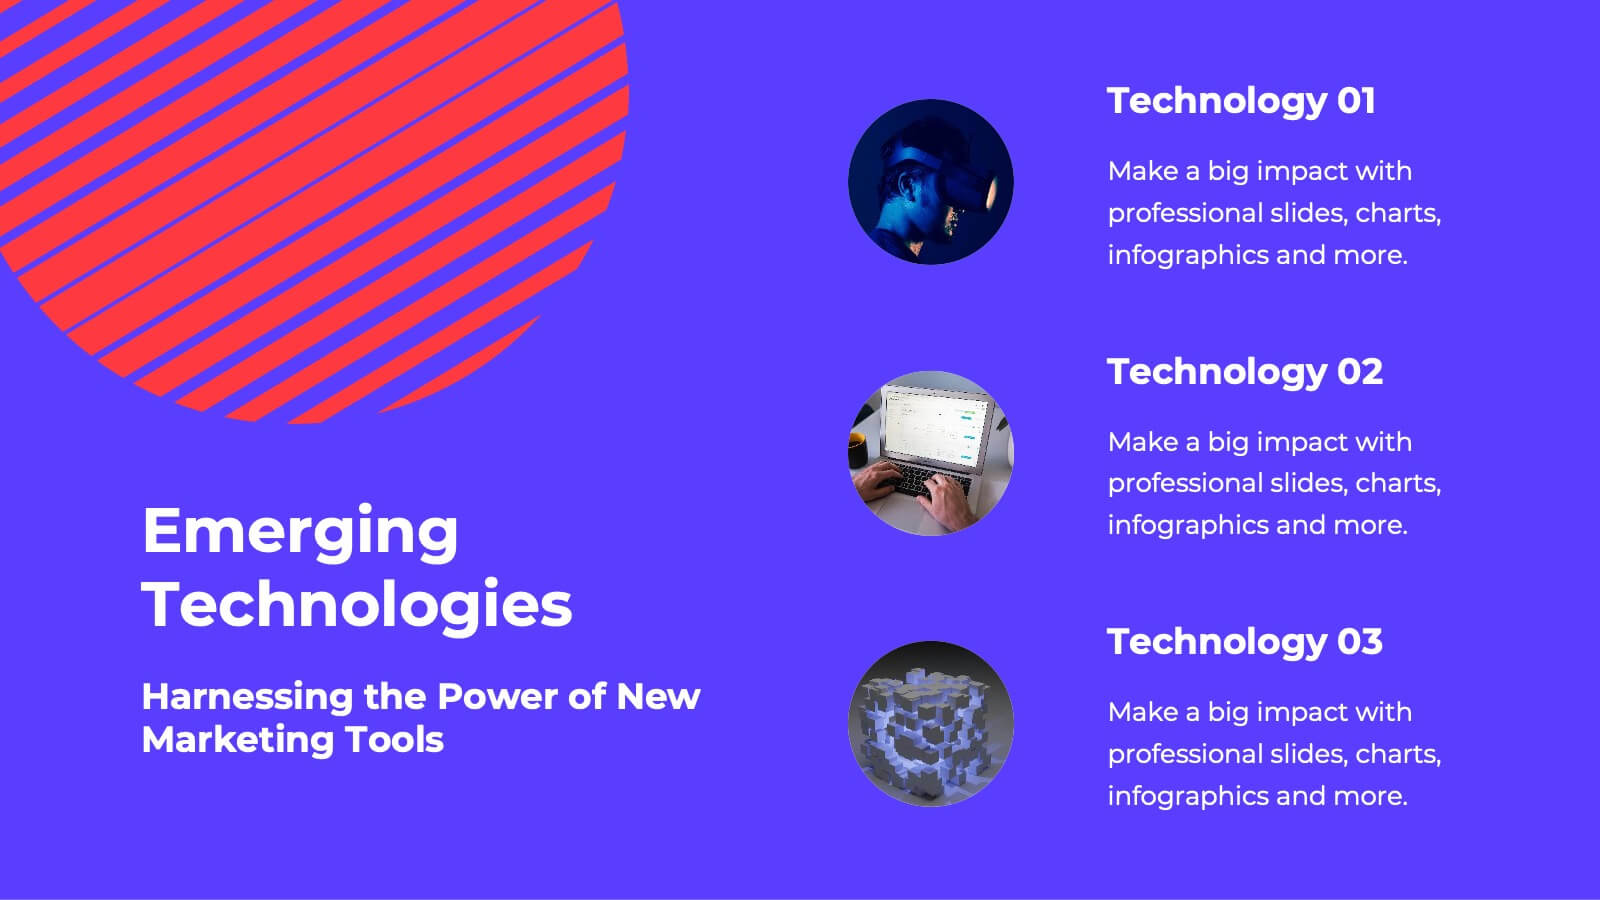
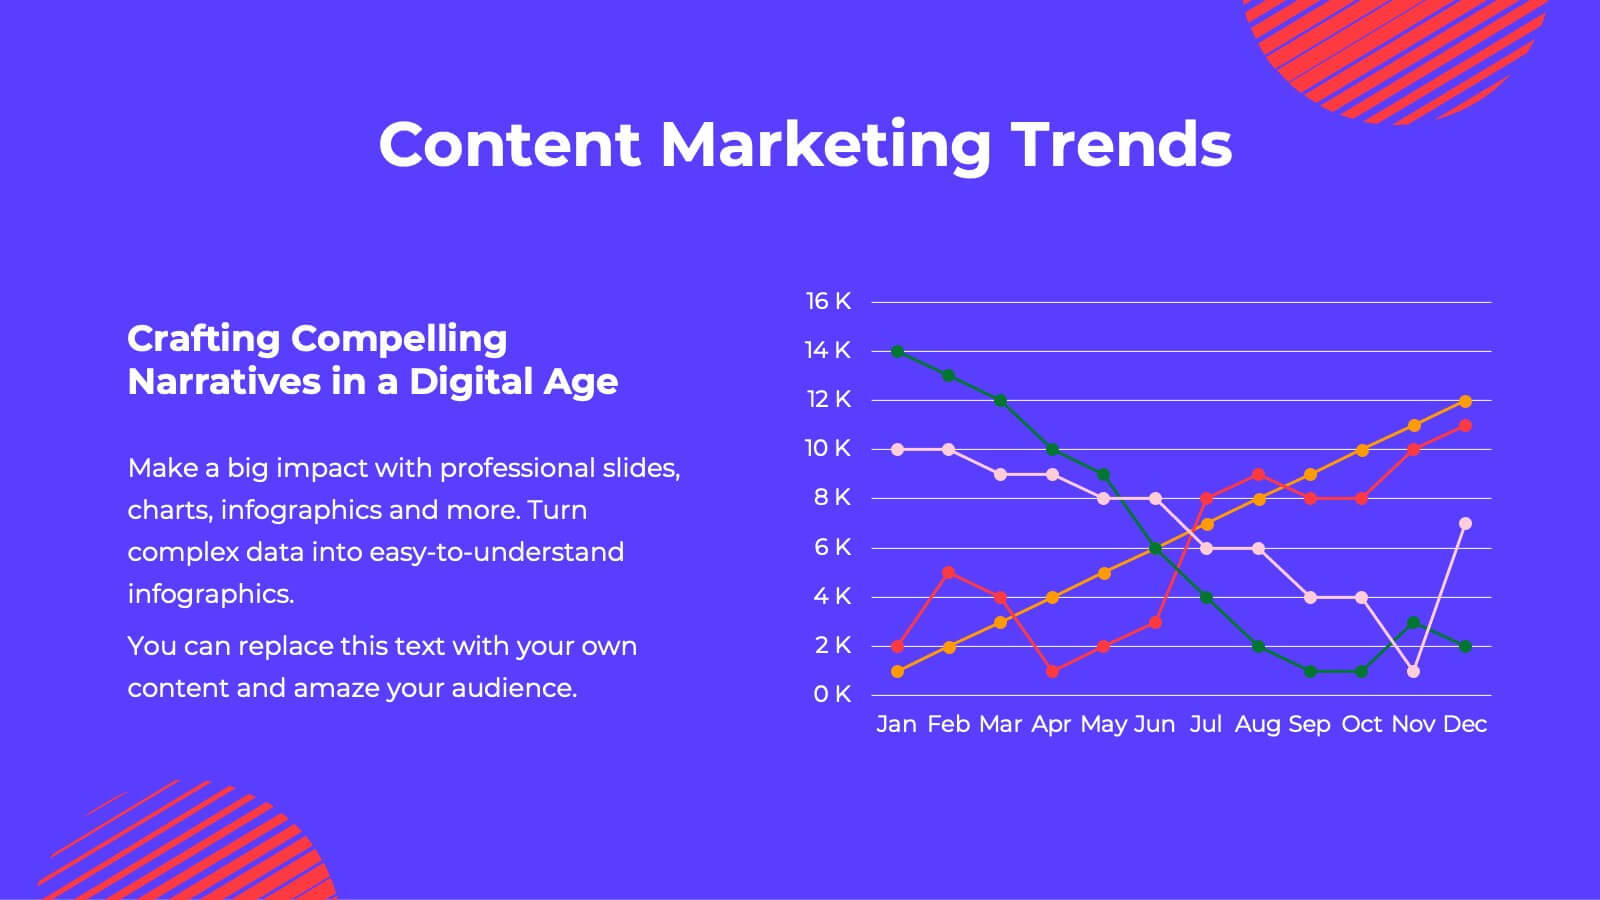
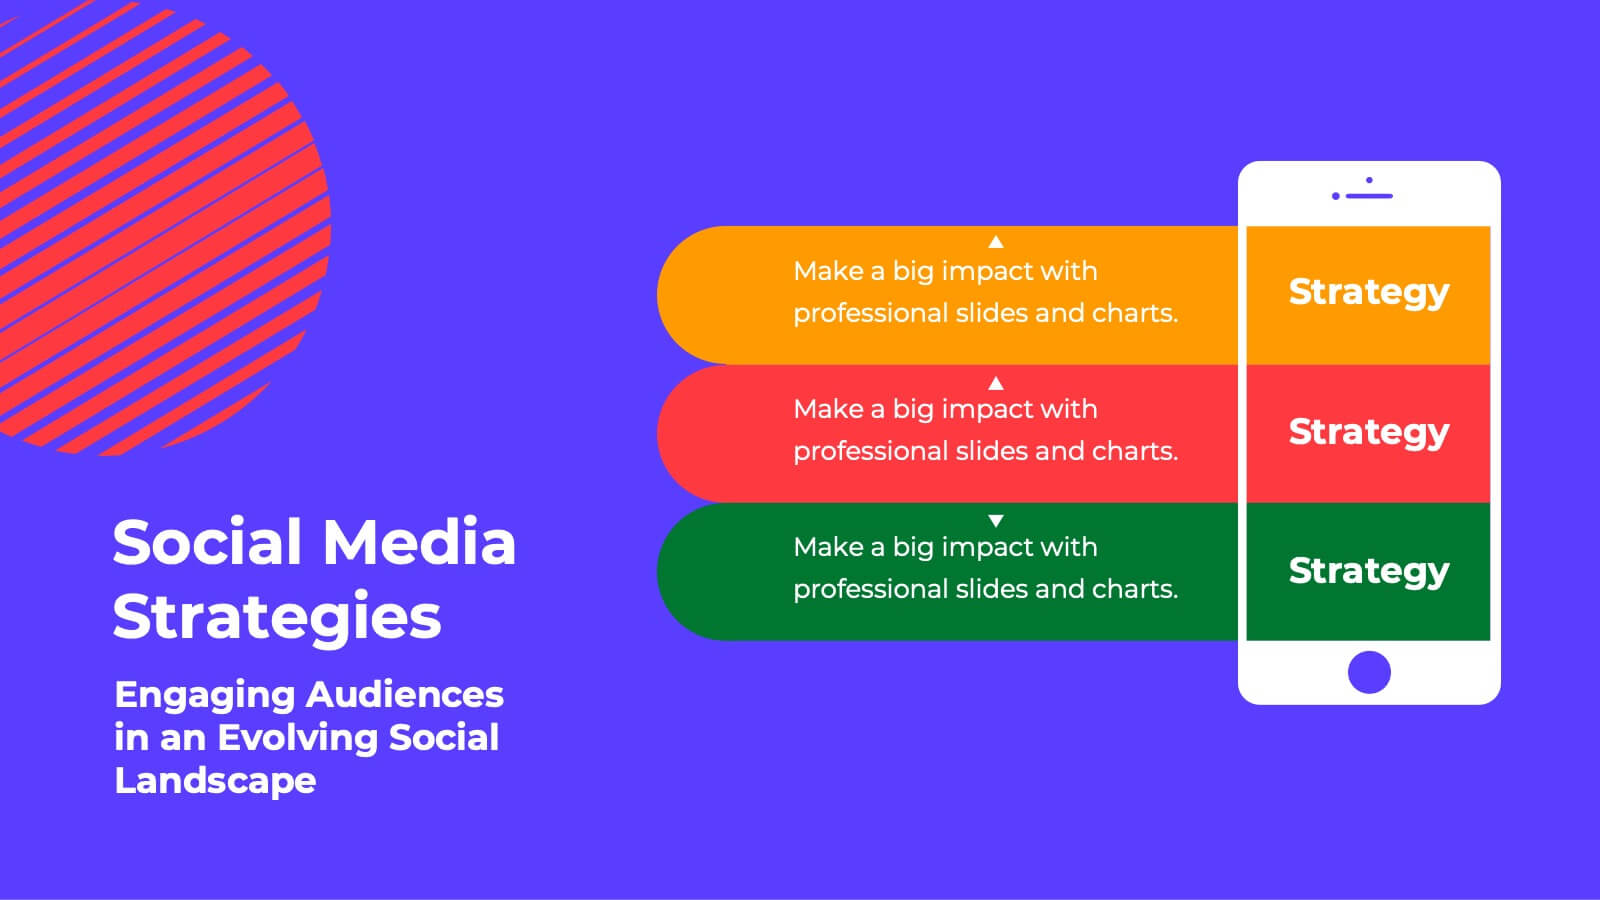
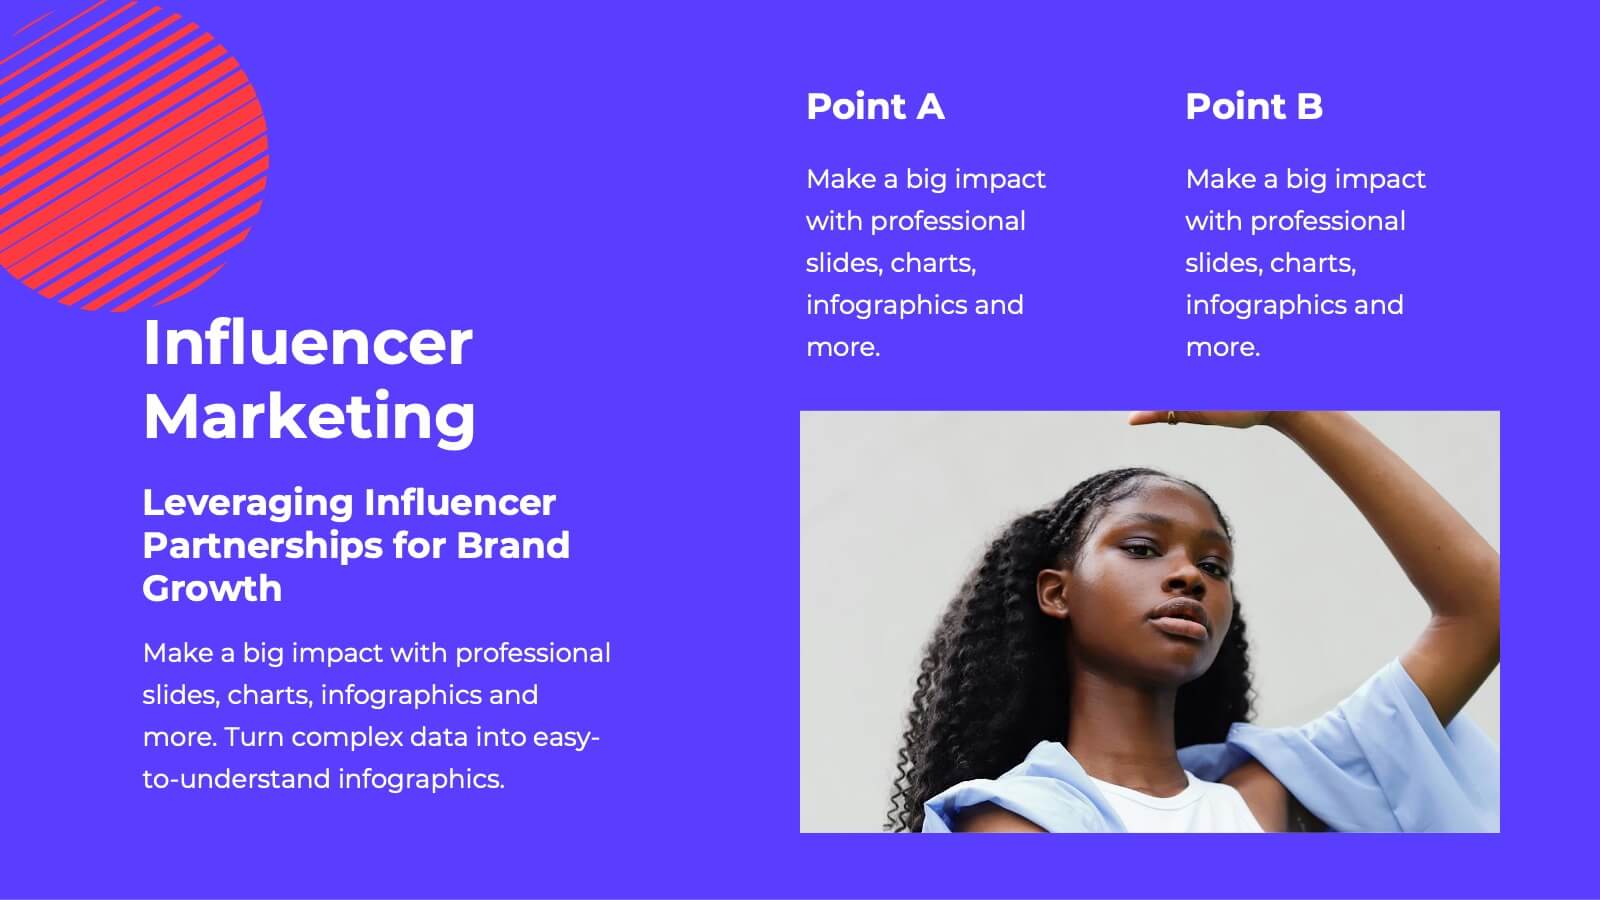
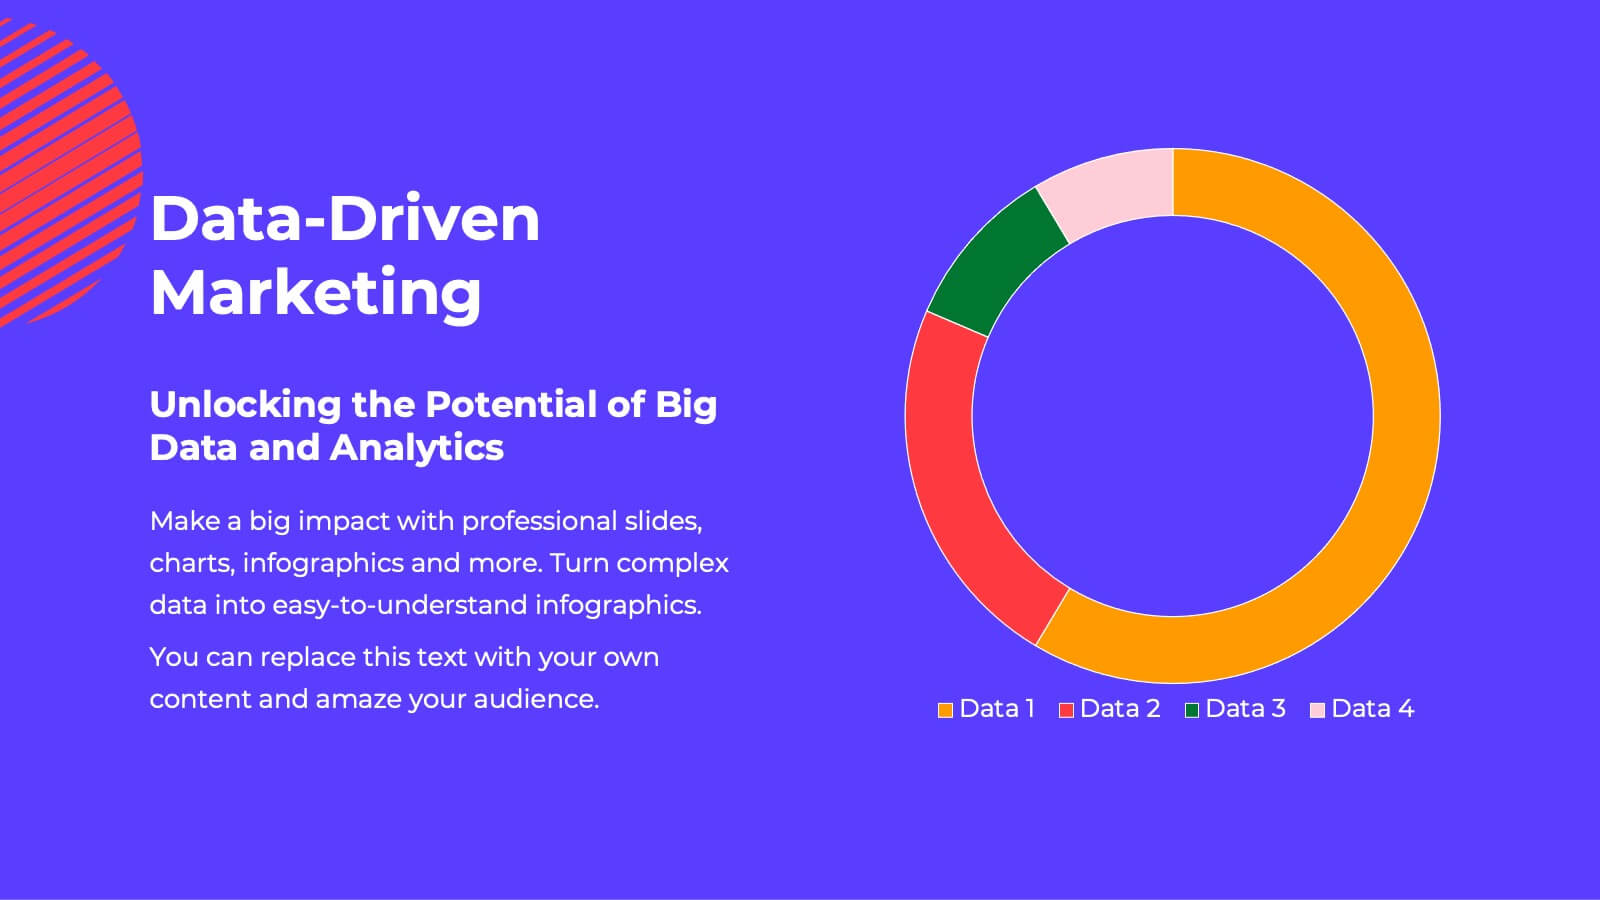
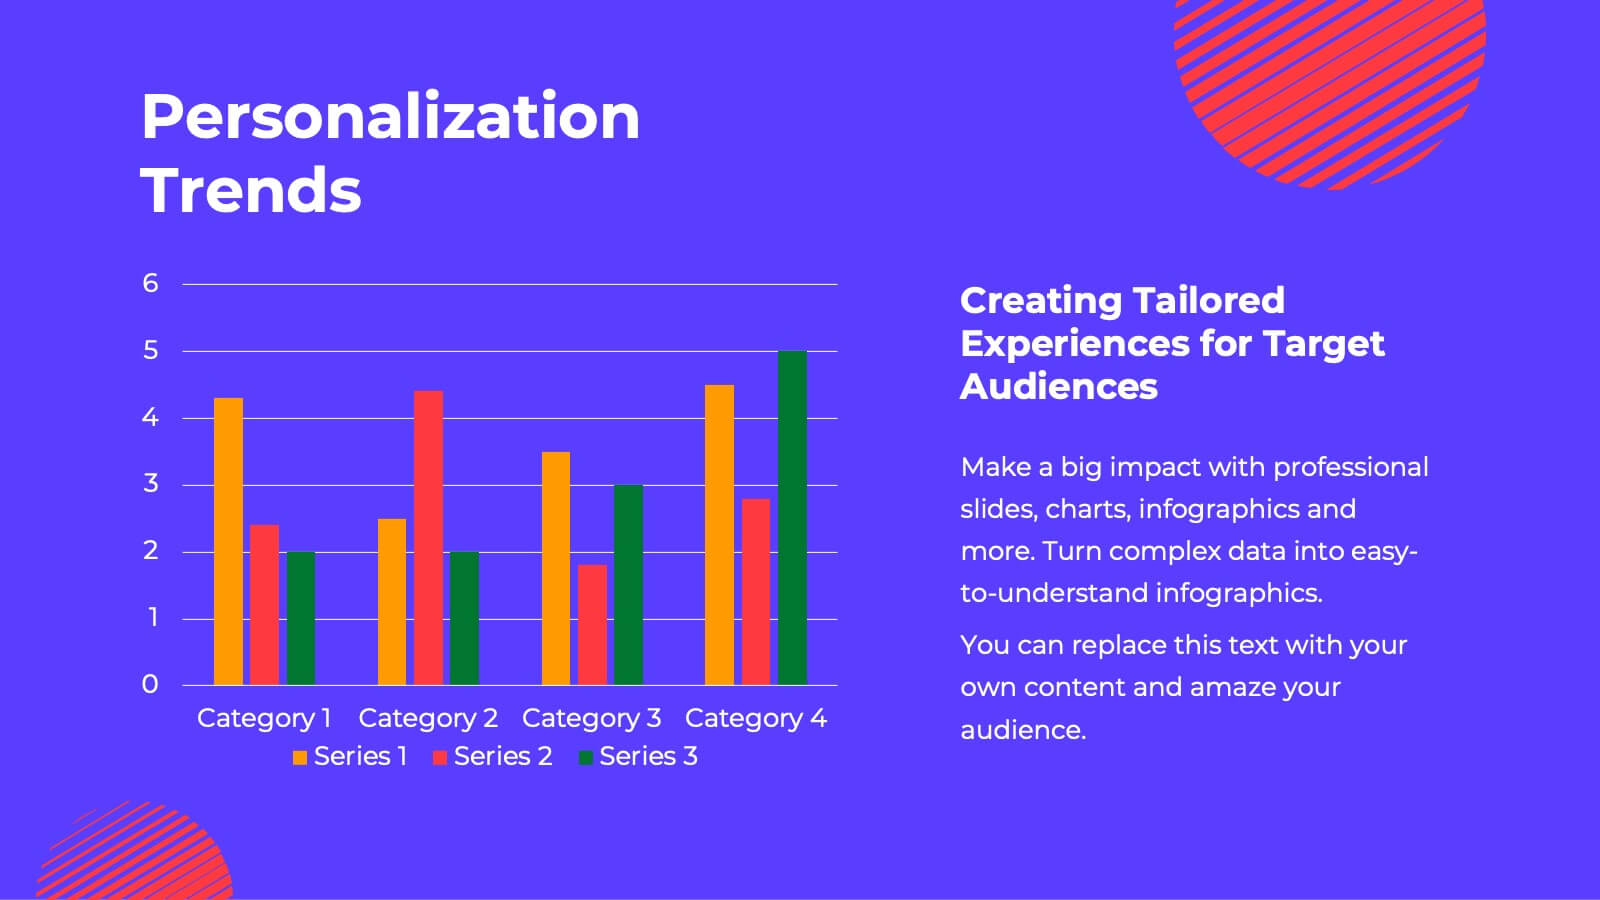
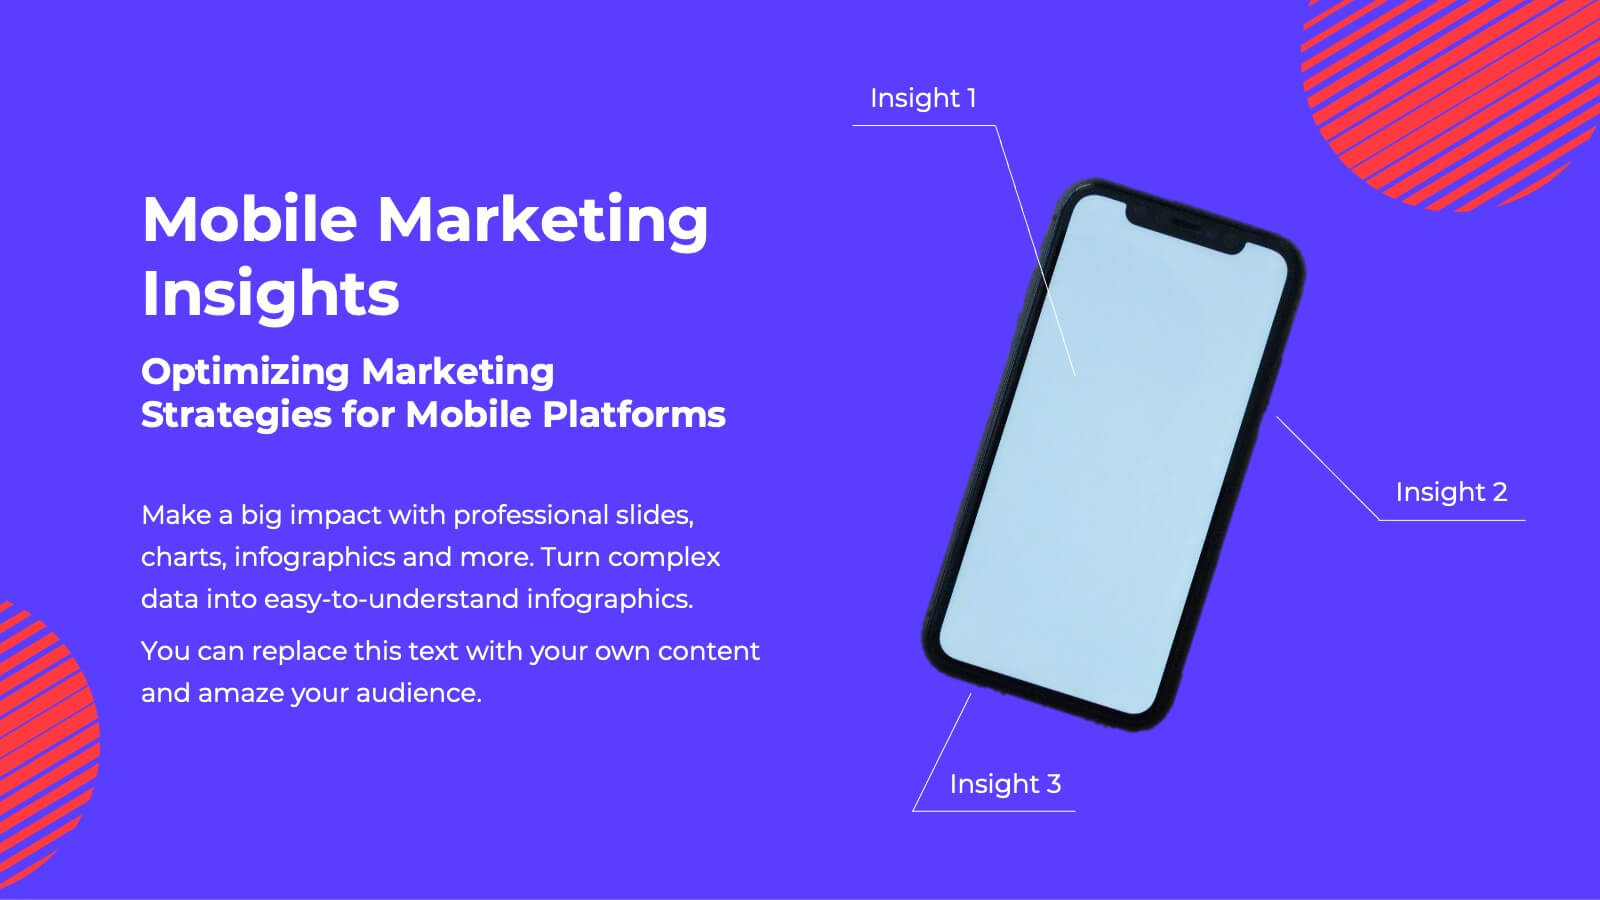
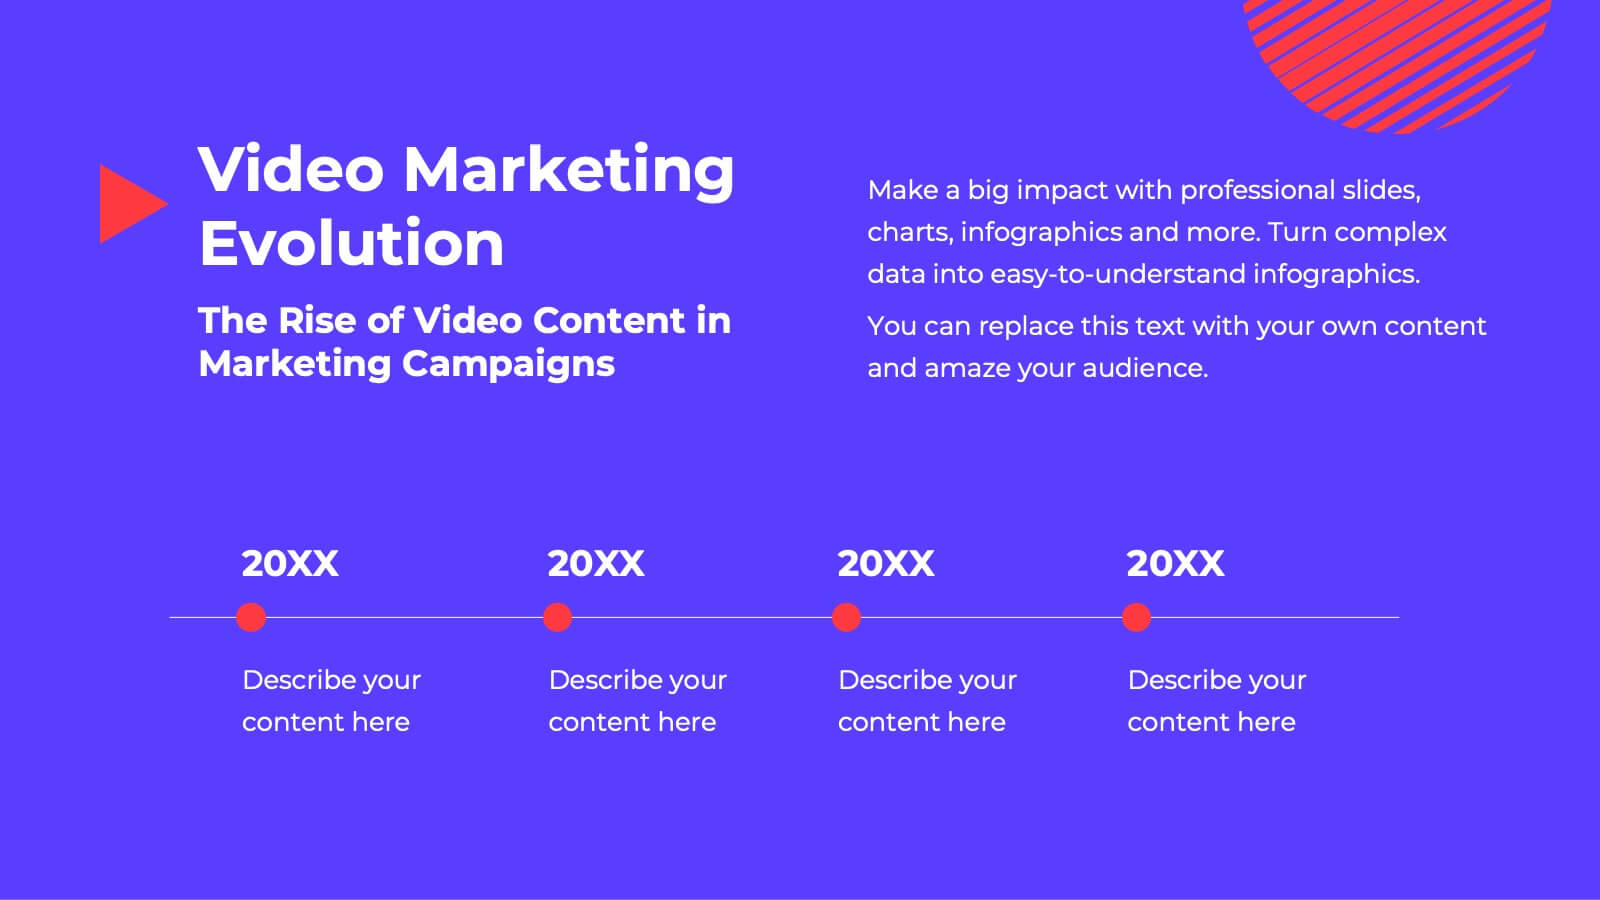
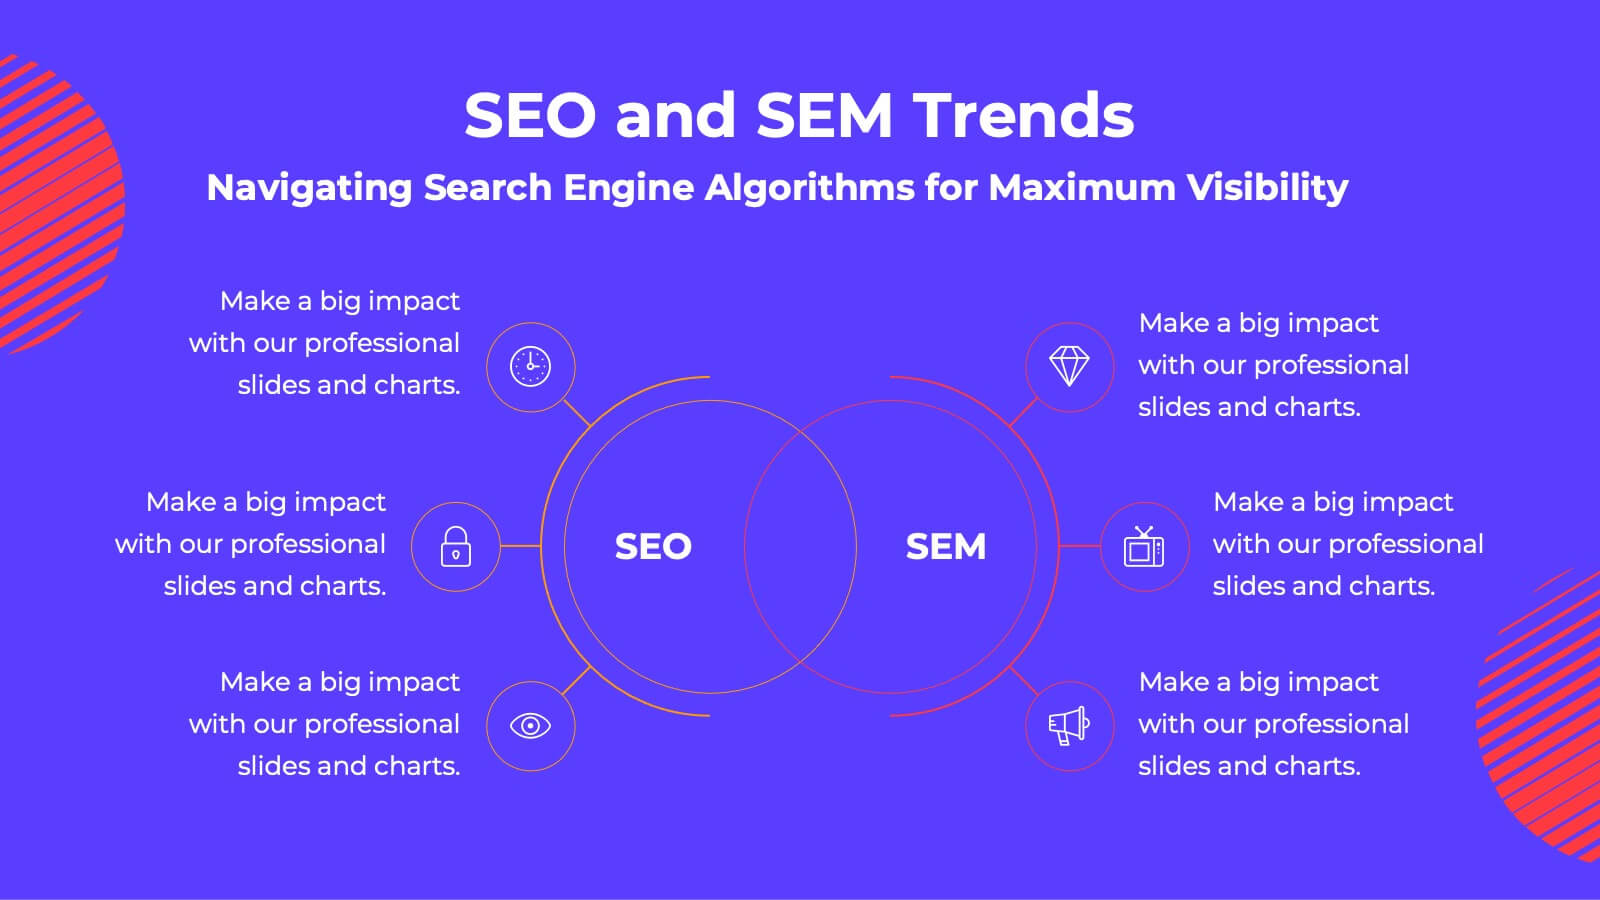
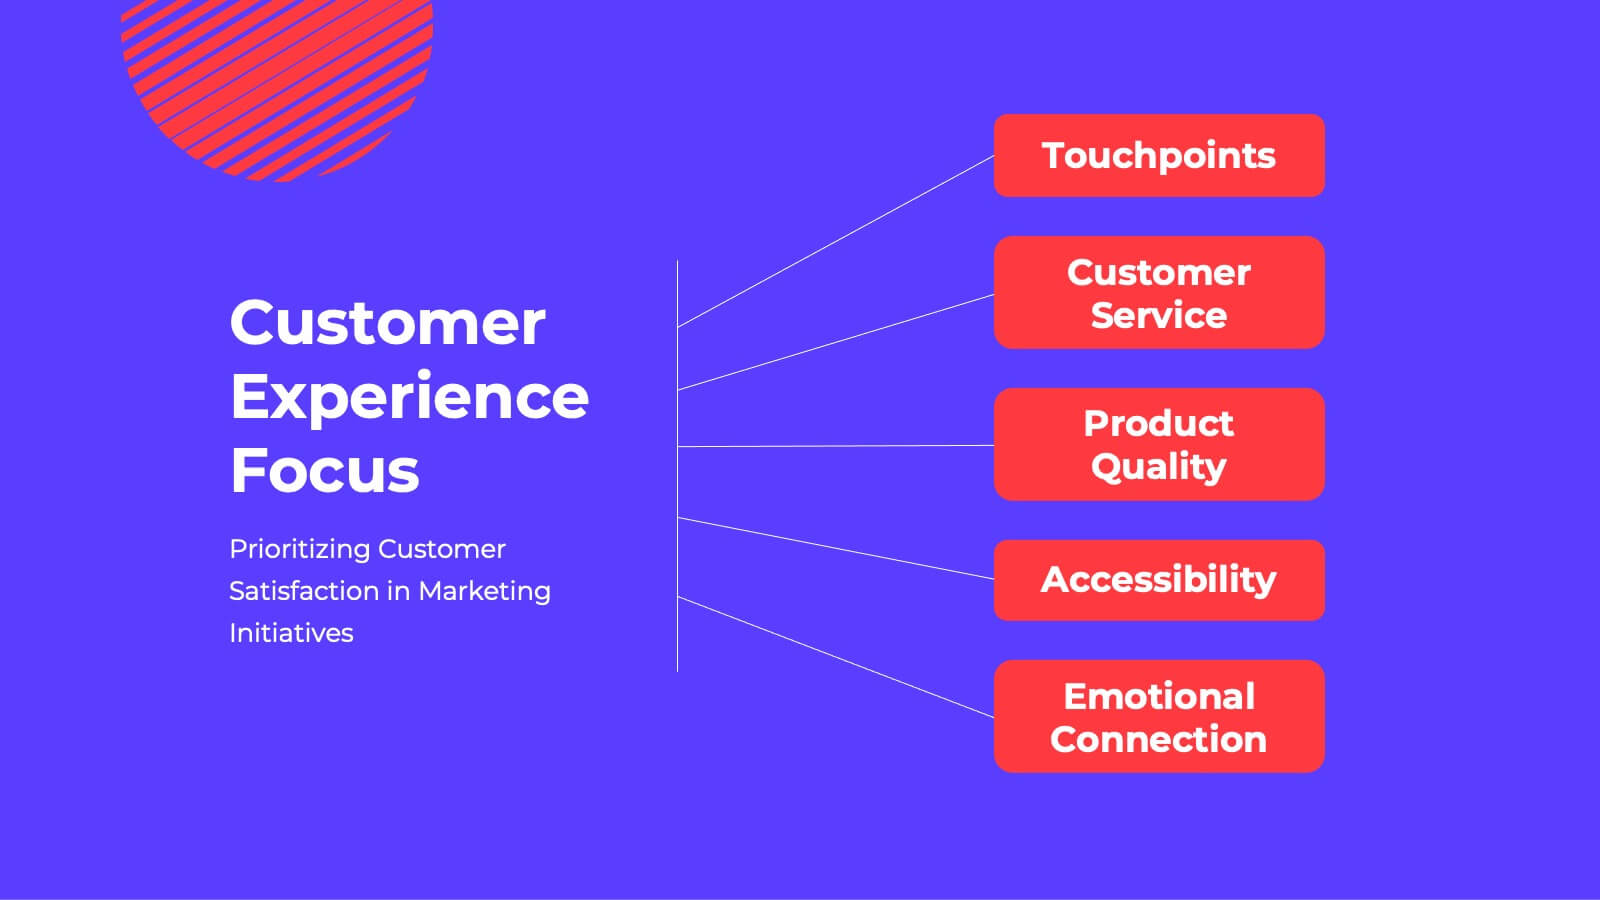
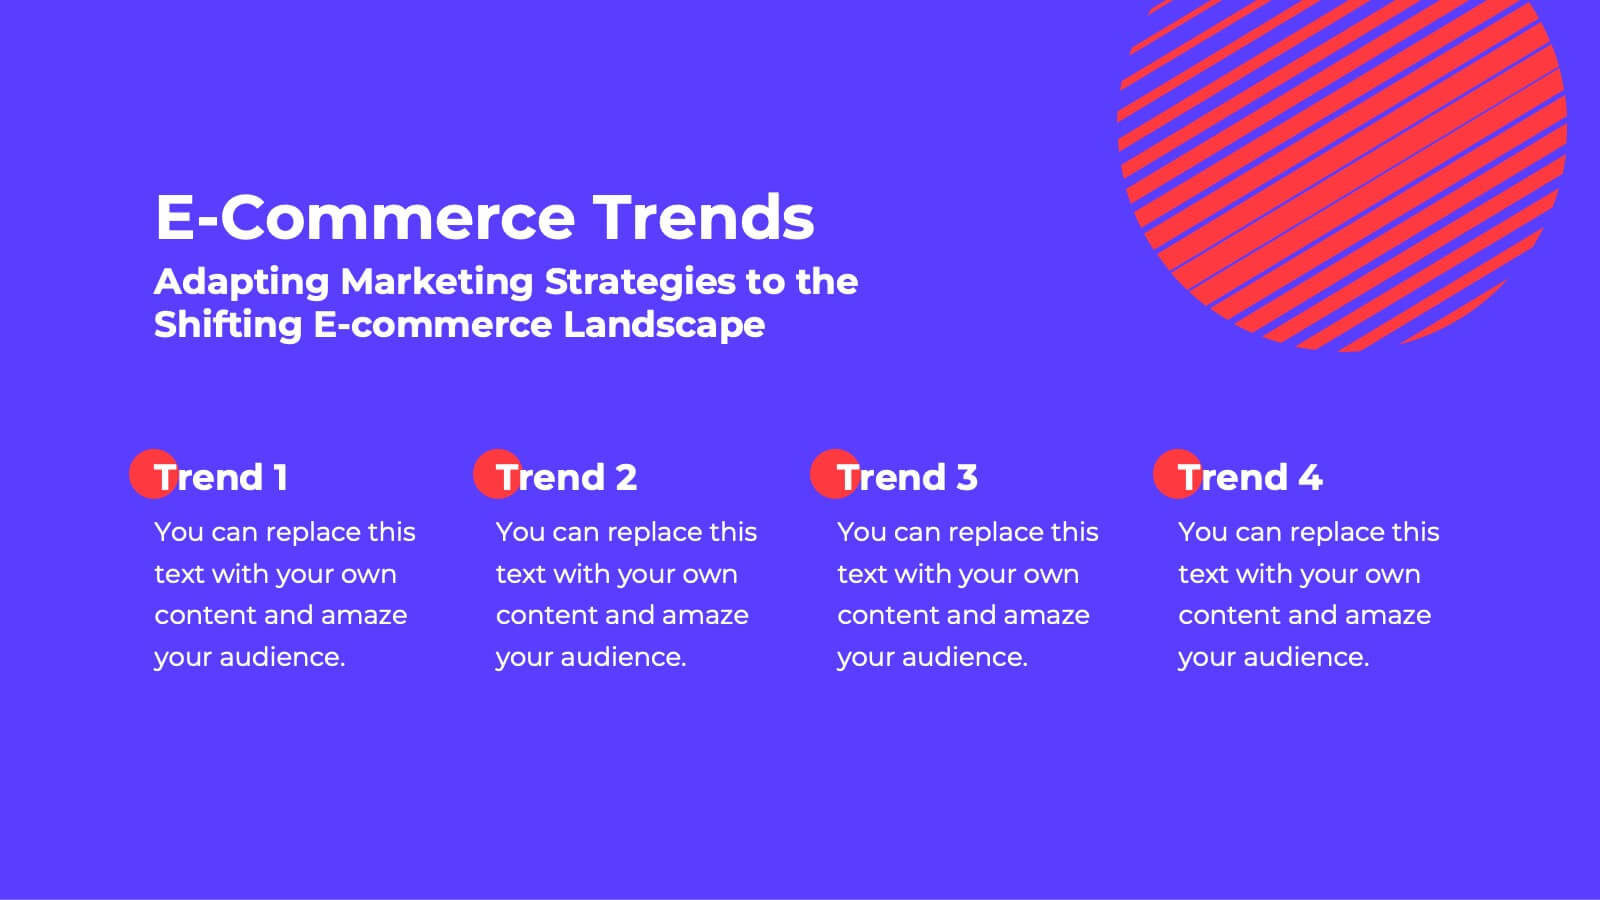
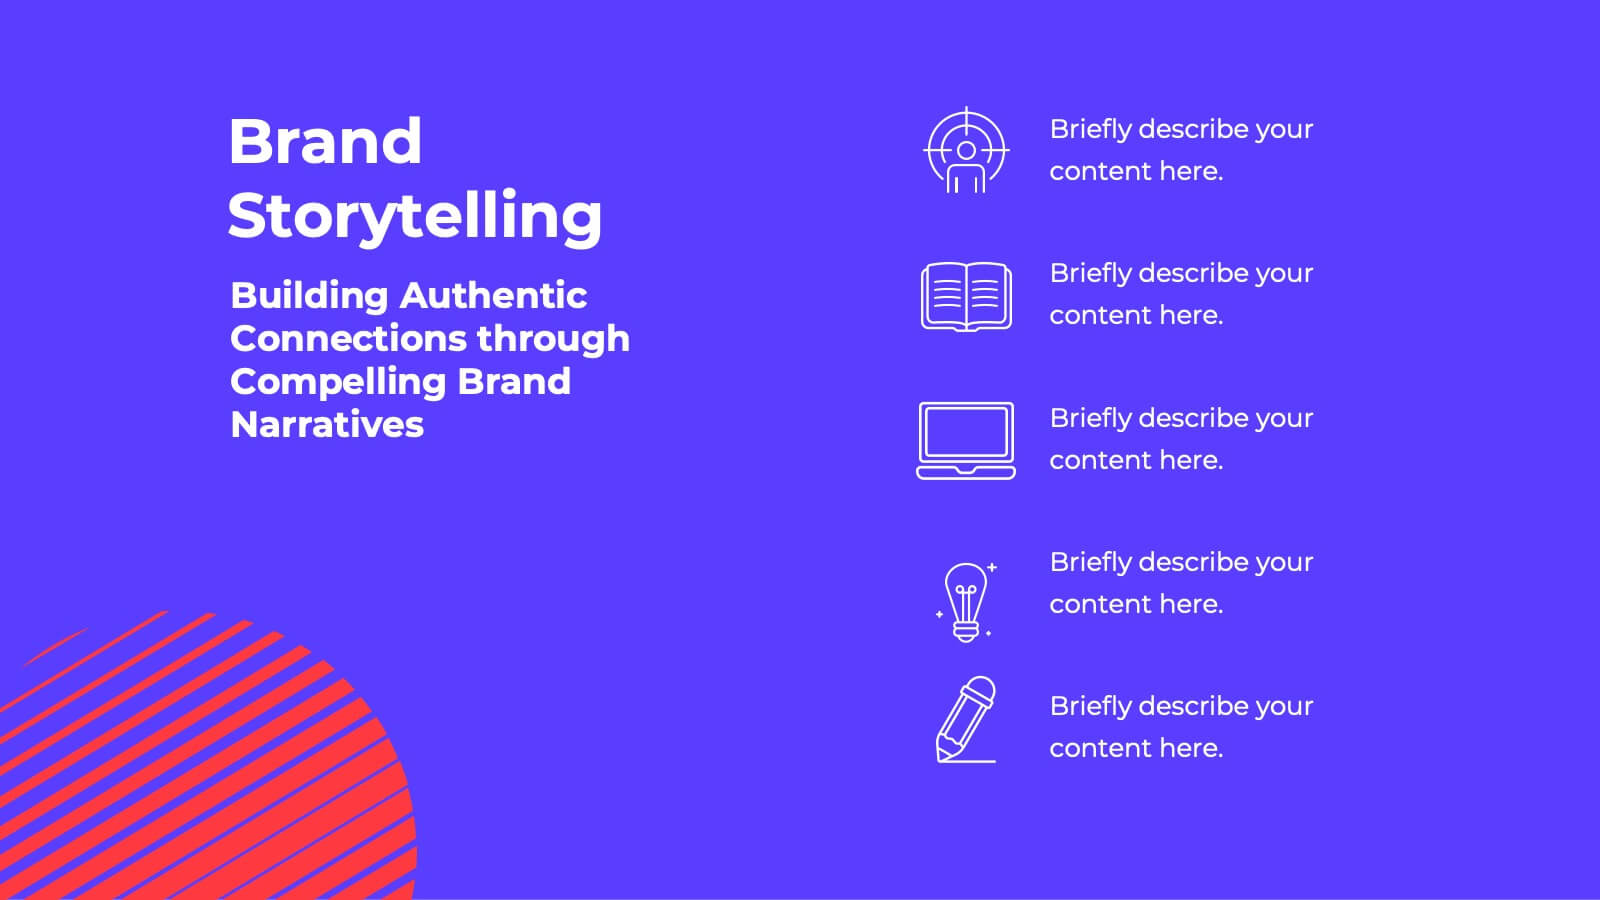
Fusion Marketing Campaign Presentation
Unleash the power of your marketing campaigns with this vibrant marketing campaign template! Dive into social media strategies, influencer marketing, data-driven insights, and more. Perfect for presenting to stakeholders and team members. Fully customizable and compatible with PowerPoint, Keynote, and Google Slides.


6 diapositivas
Real Estate and Building Development
Visualize the complete property development process with this modern, keyhole-inspired presentation design. Ideal for real estate developers, architects, and construction planners, this slide clearly outlines six project stages—from concept to completion—using bold icons and a radial layout. Editable in PowerPoint, Keynote, and Google Slides.


6 diapositivas
User Empathy Map Infographic
An Empathy Map is a visual tool used in design thinking and customer-centric approaches to understand the needs, thoughts, feelings, and behaviors of a specific target user or customer. This infographic template is a tool used in user-centered design and product development to better understand and empathize with the needs, thoughts, emotions, and experiences of the target users. It helps teams gain deeper insights into the users' perspectives and develop more user-focused solutions. The infographic consists of four quadrants, each representing different aspects of the user's experience. Compatible with Powerpoint, Keynote, and Google Slides.


4 diapositivas
Customer Feedback Report Presentation
Transform audience insights into actionable strategies with this clean, data-focused presentation. Designed to highlight customer satisfaction trends, improvement areas, and feedback analysis, it helps visualize complex information with clarity and flow. Fully customizable and compatible with PowerPoint, Keynote, and Google Slides for a polished, professional, and presentation-ready report.

22 diapositivas
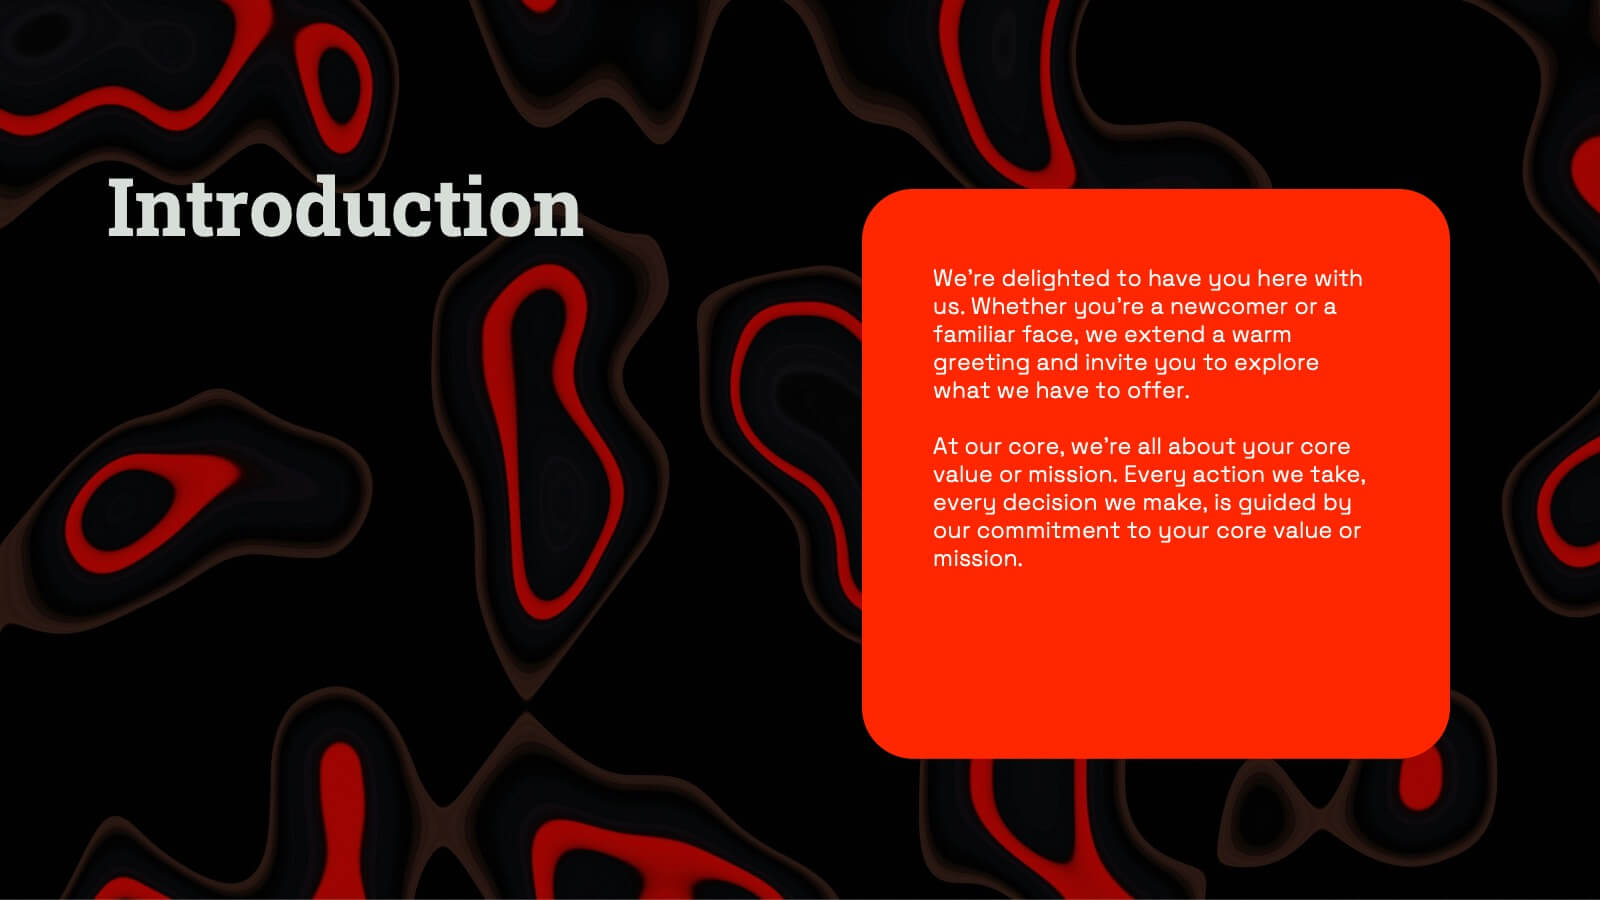
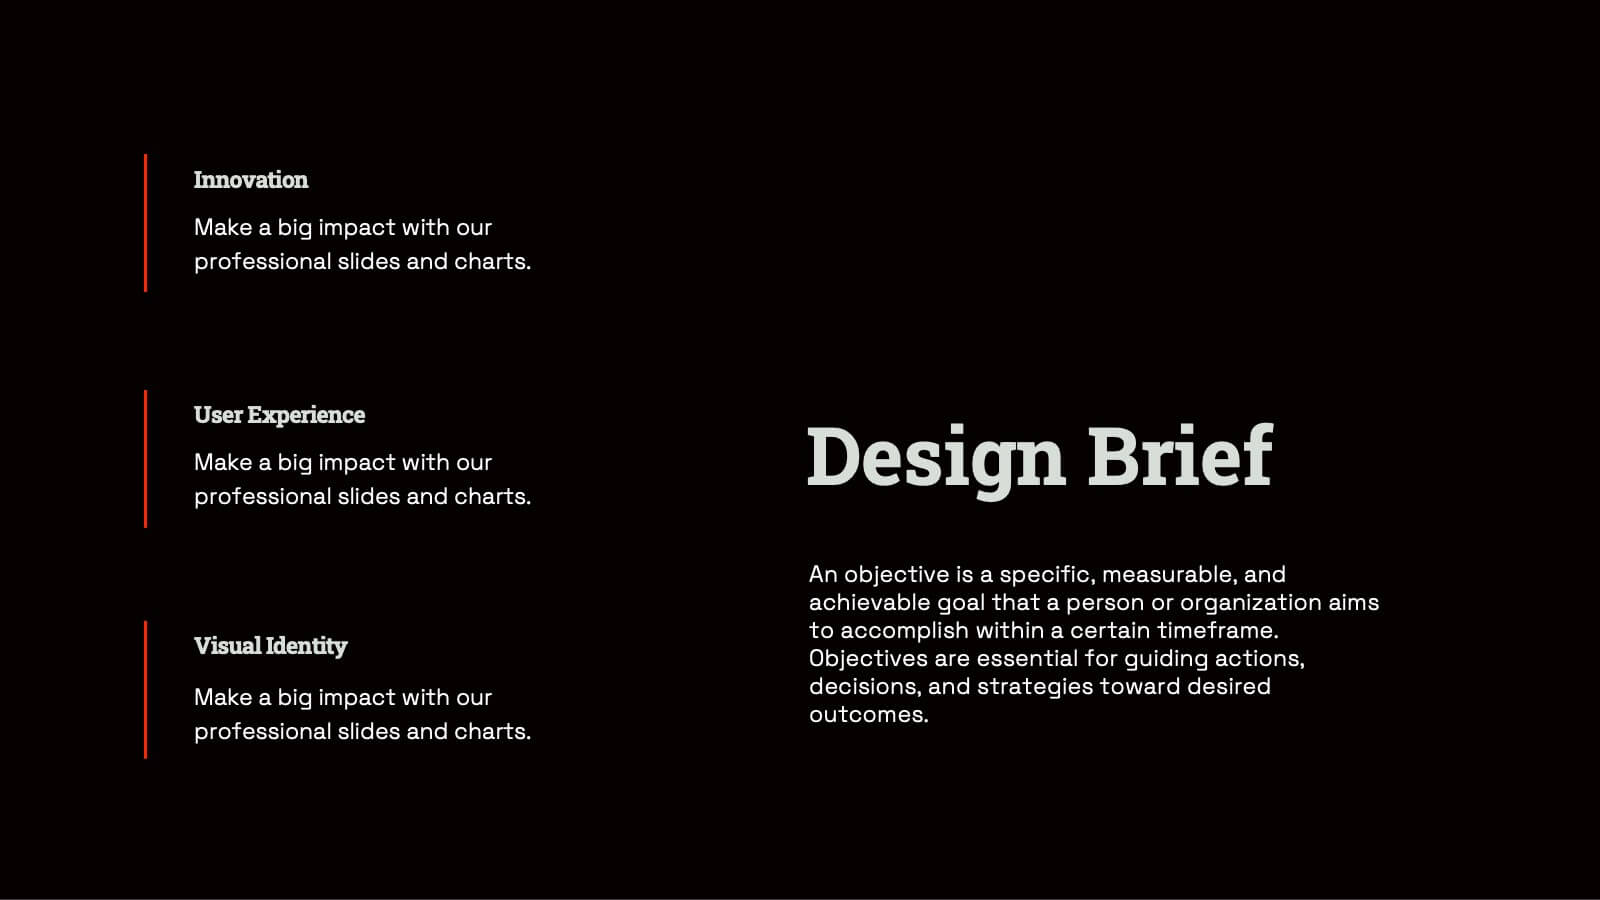
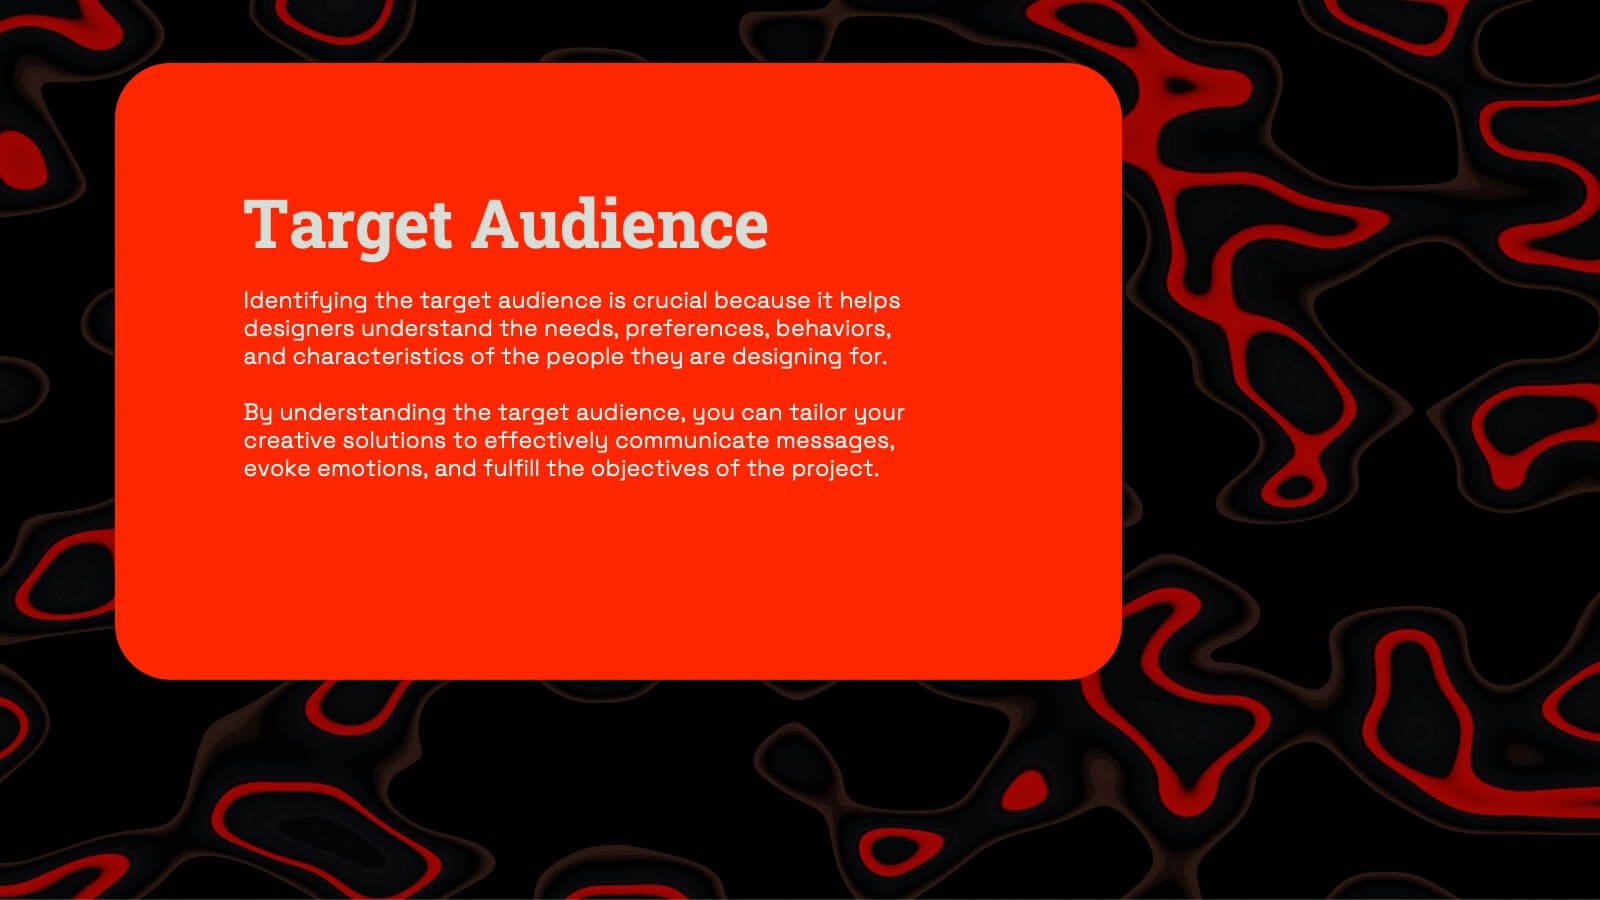
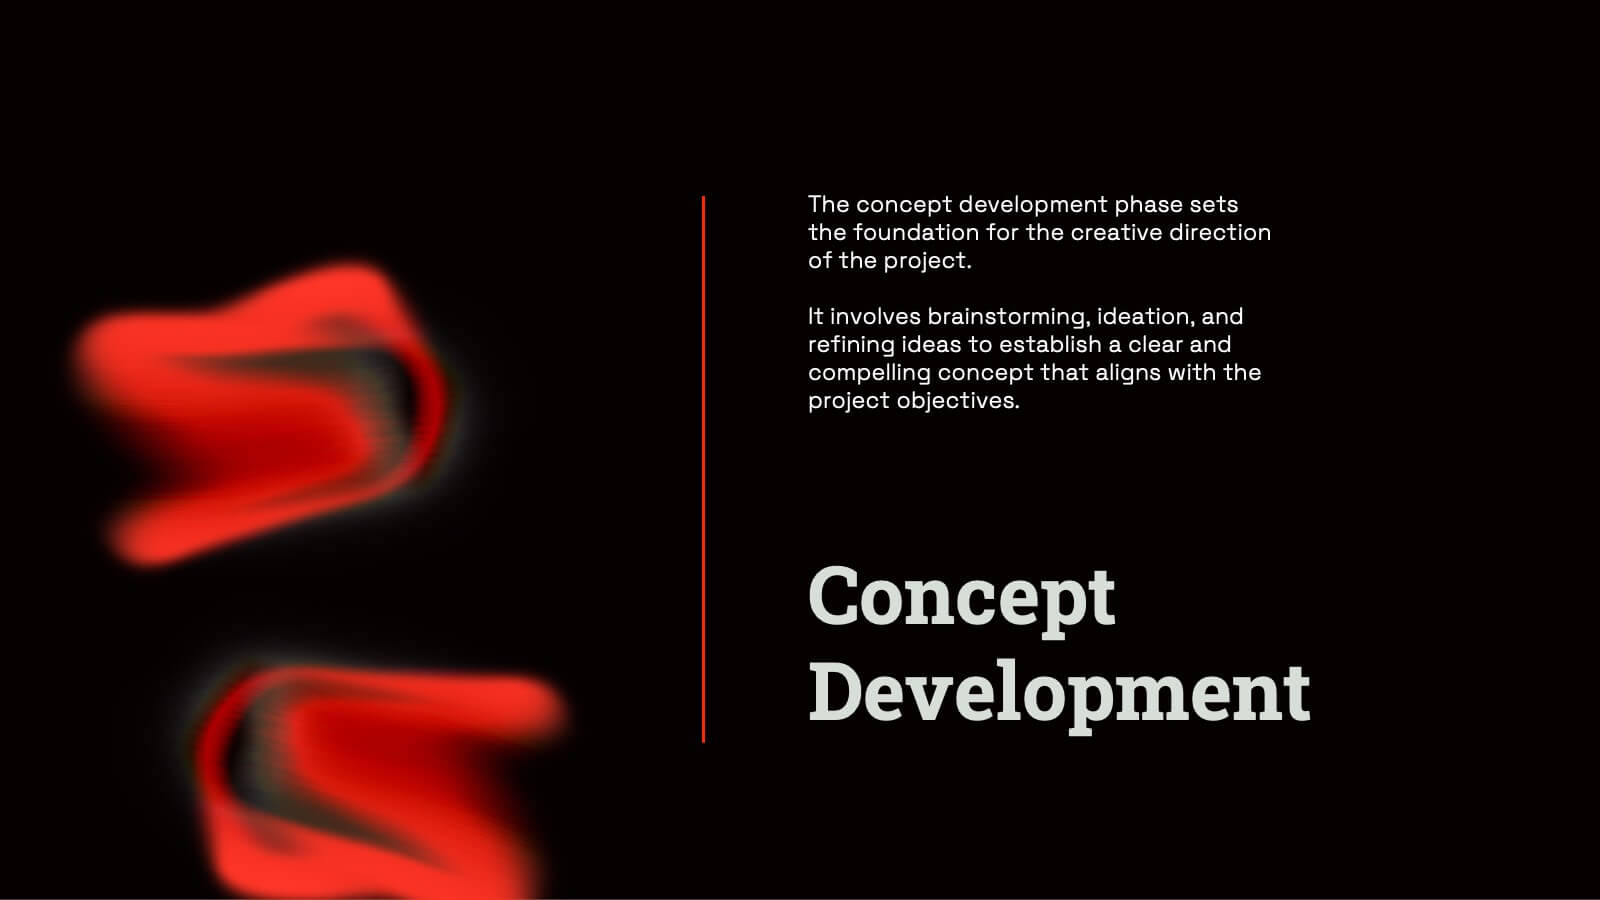
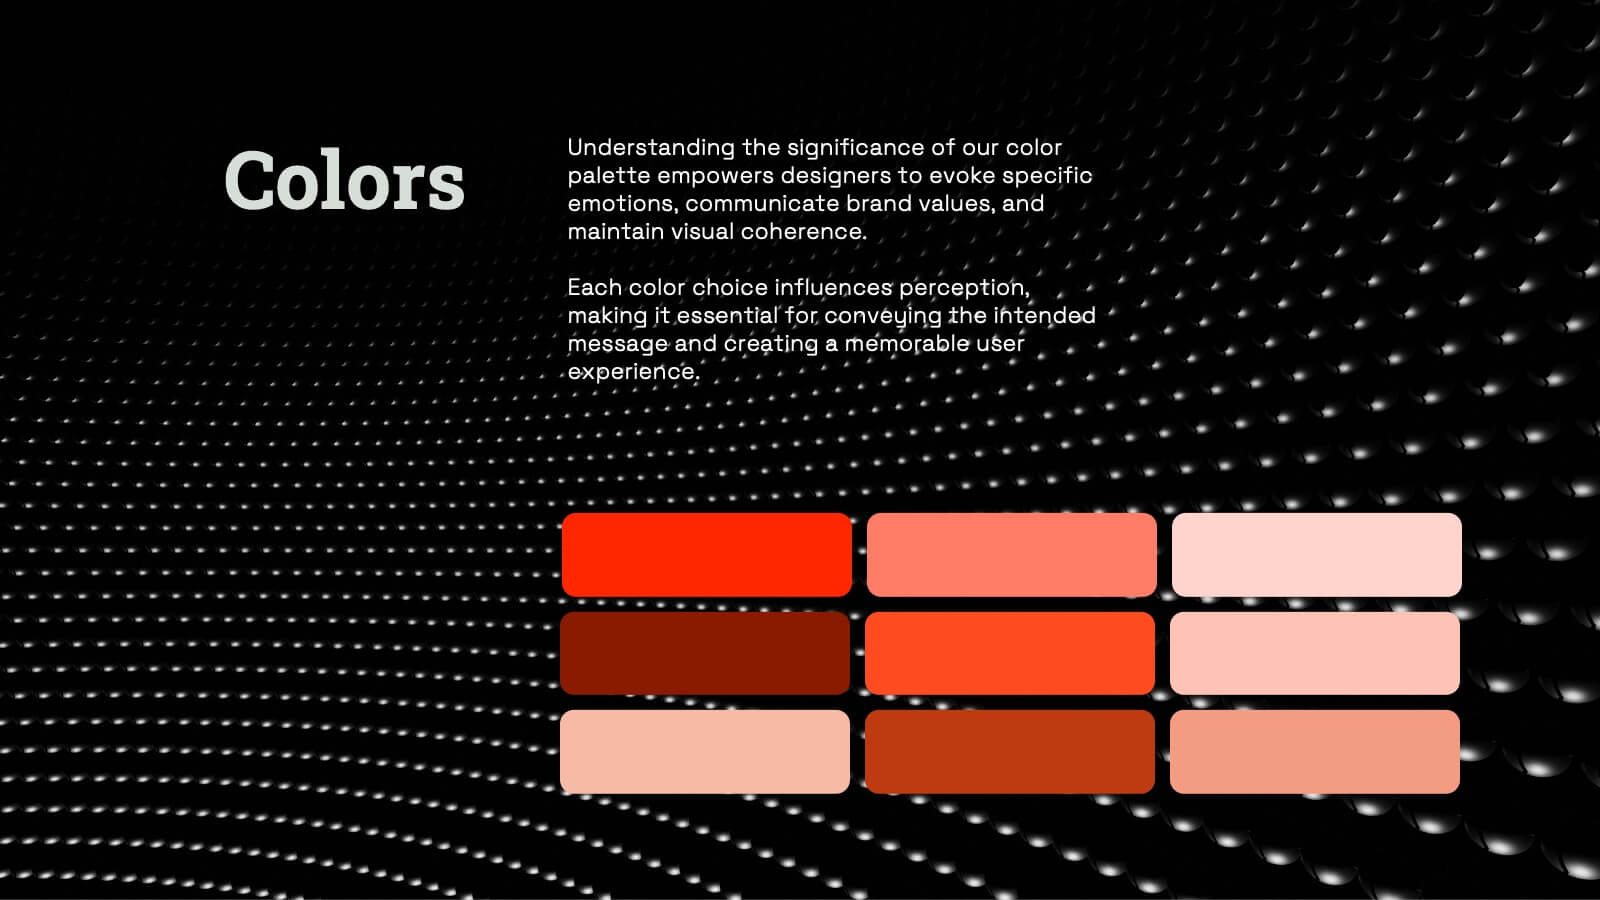
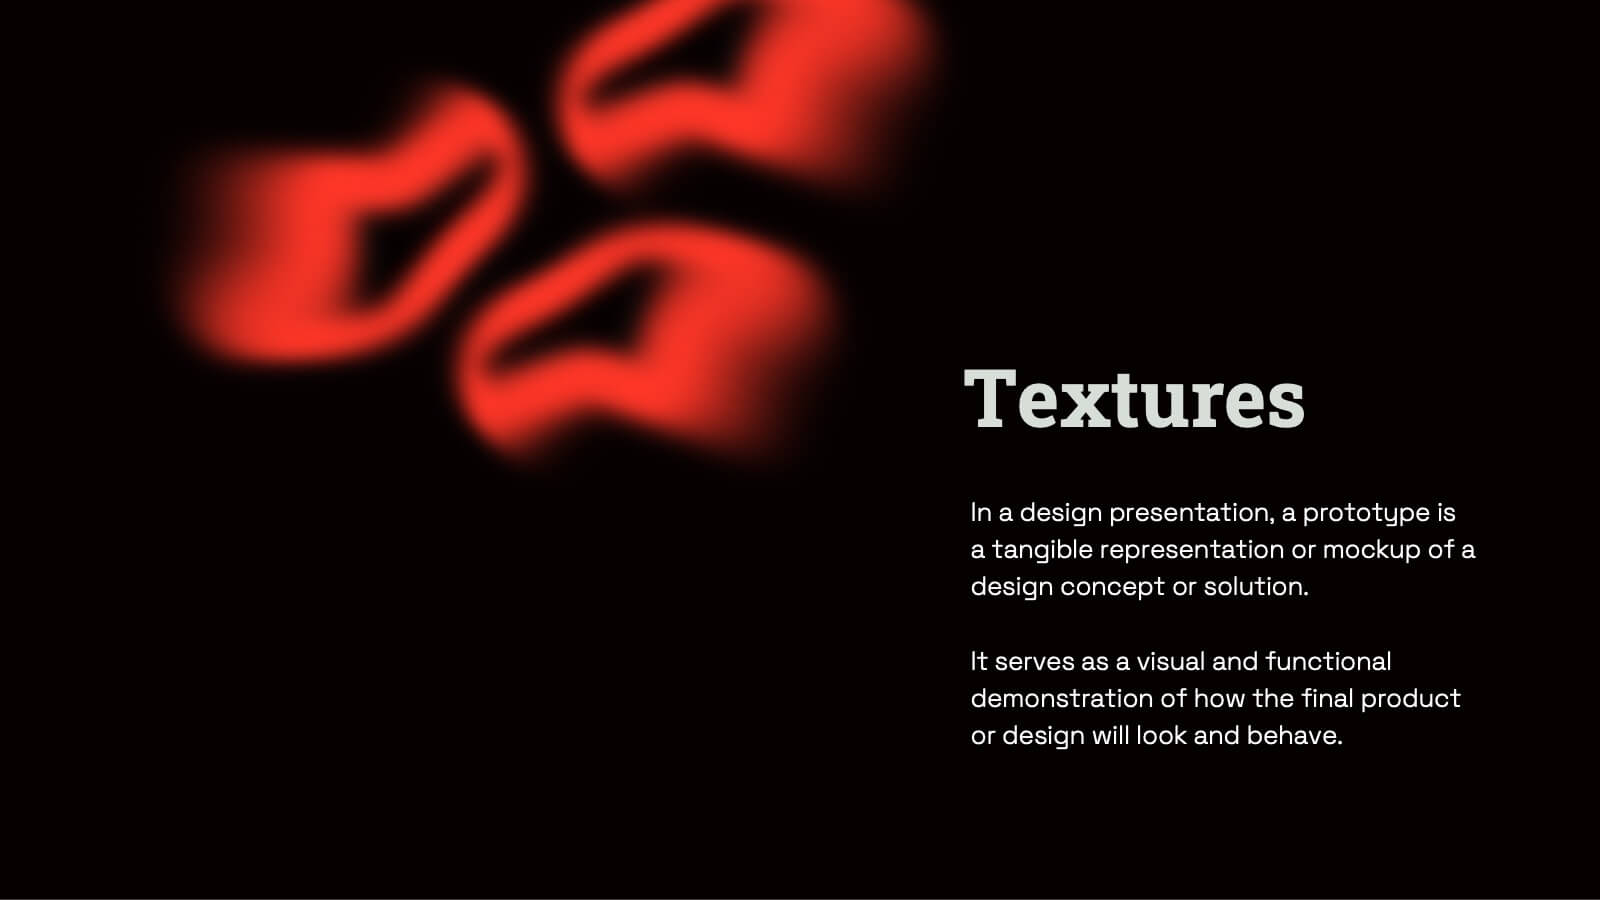
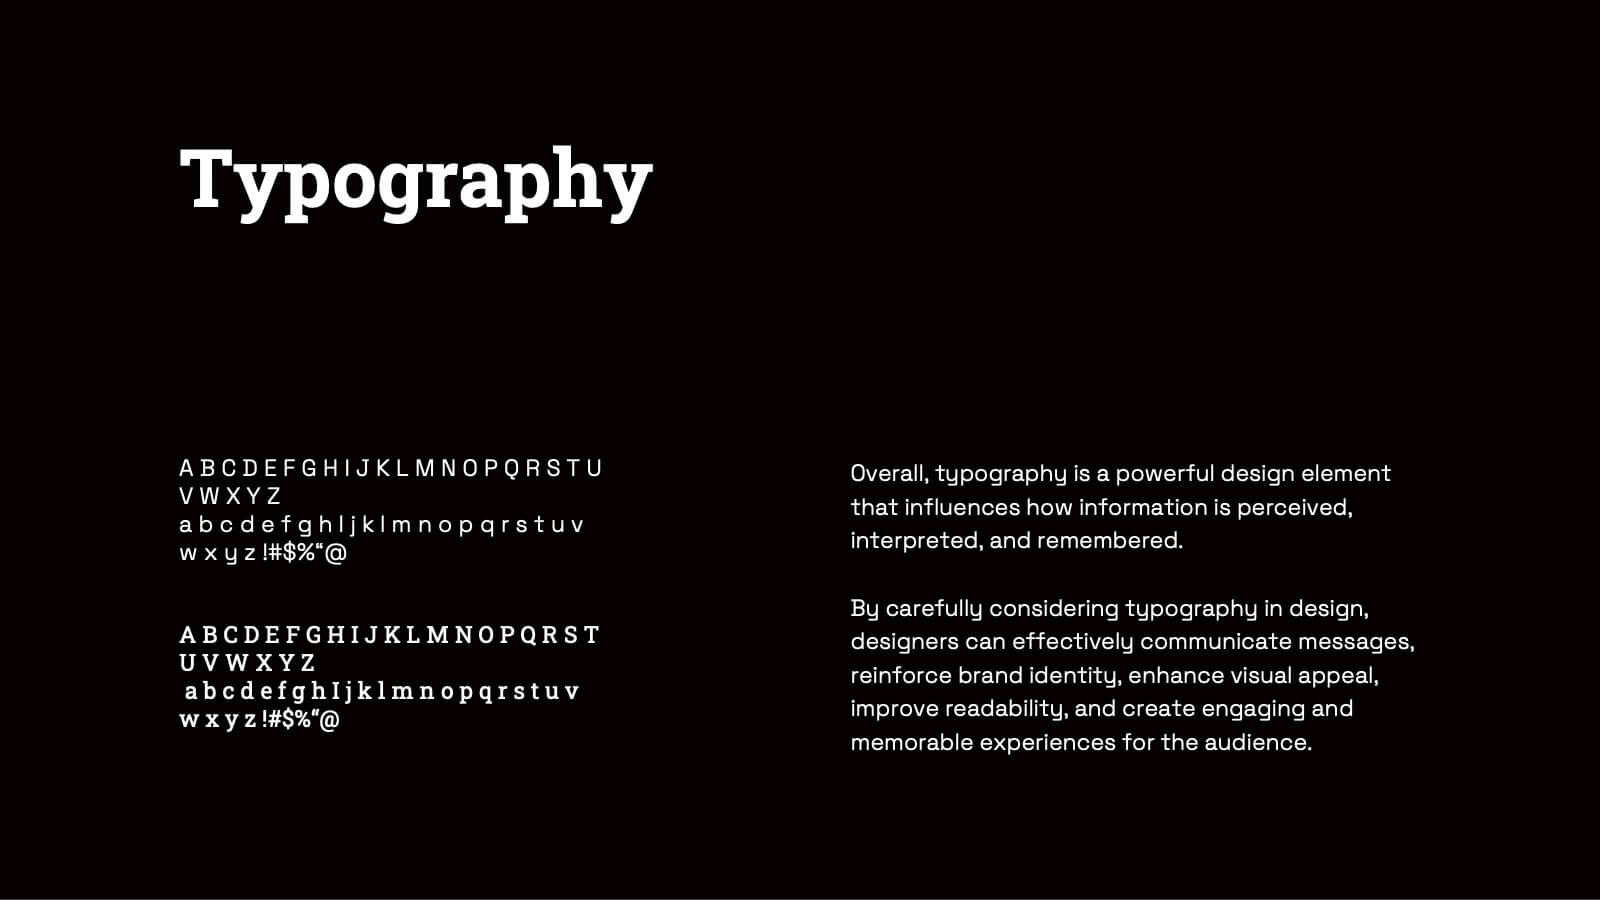
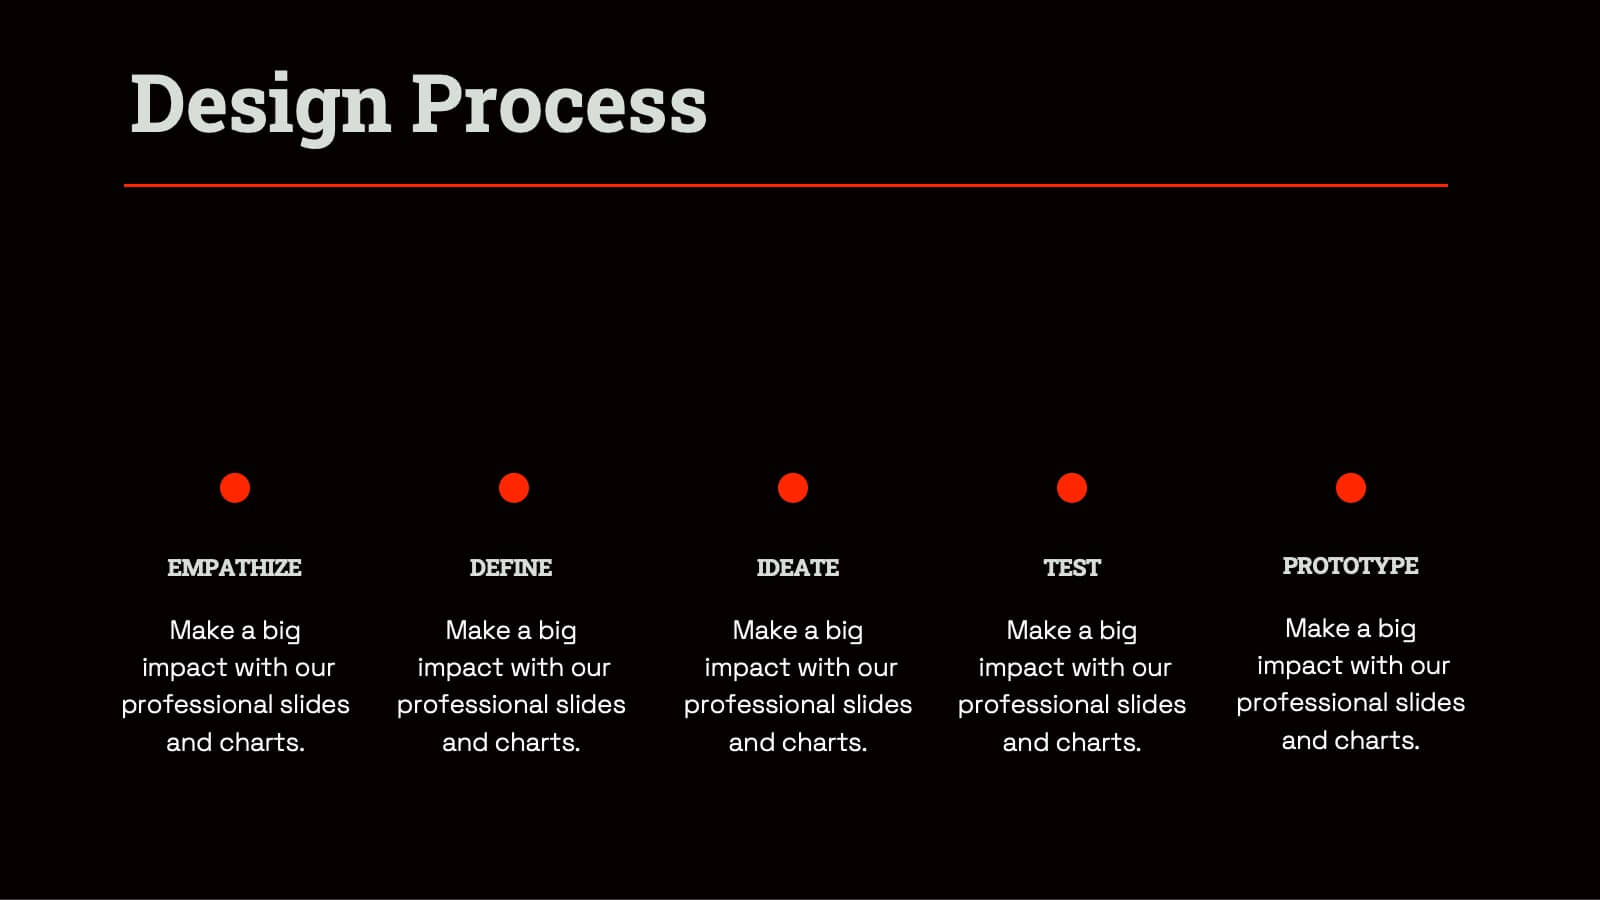
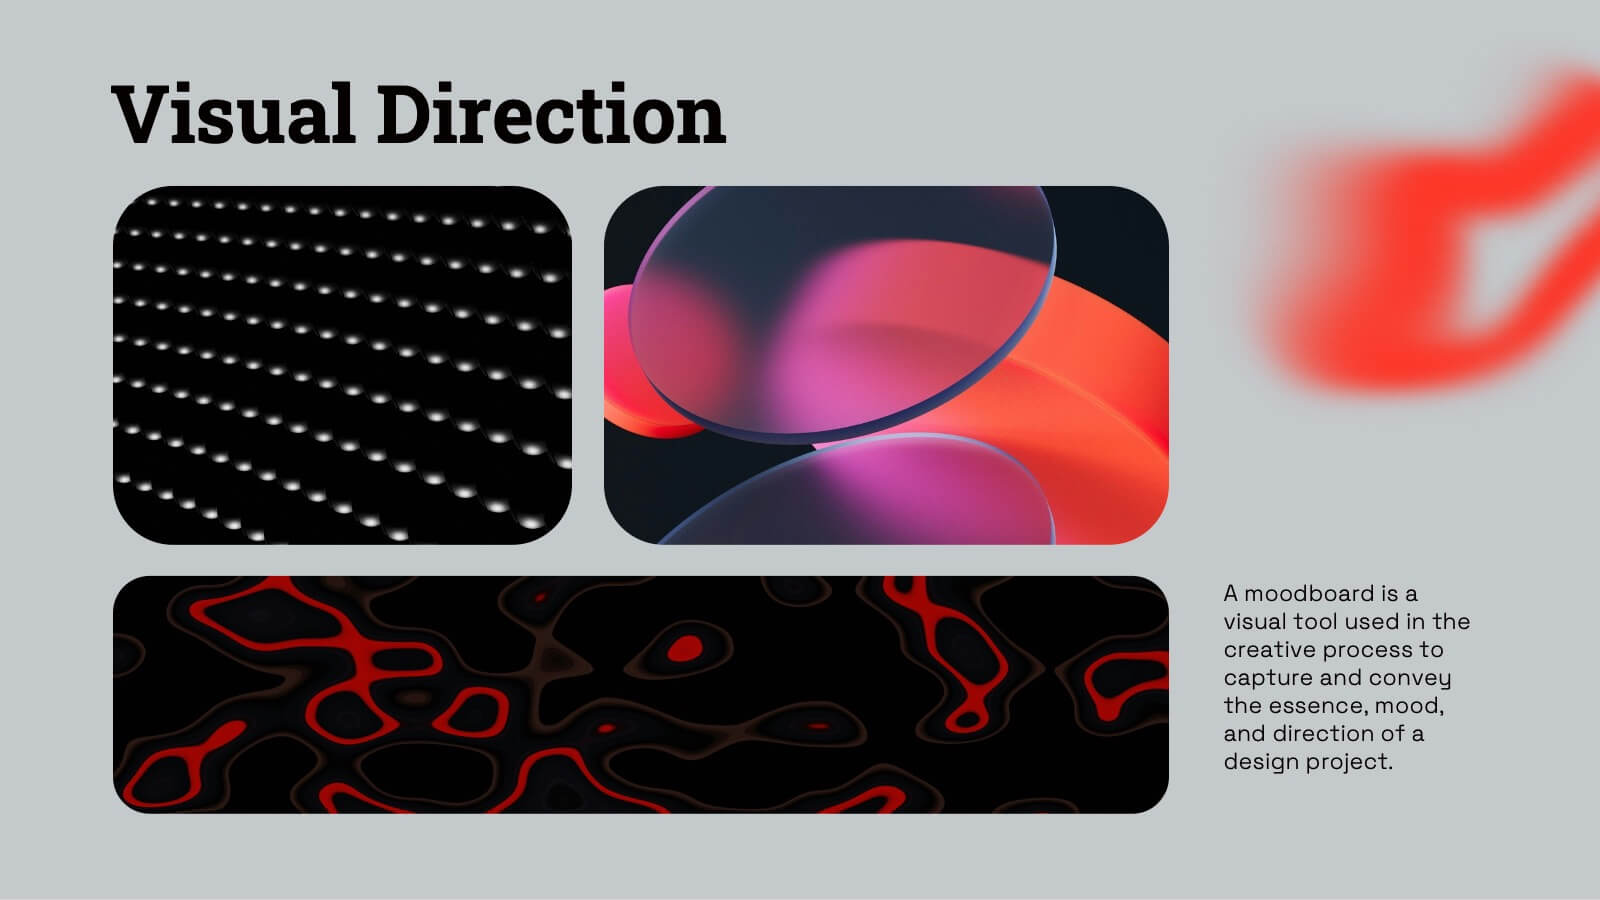
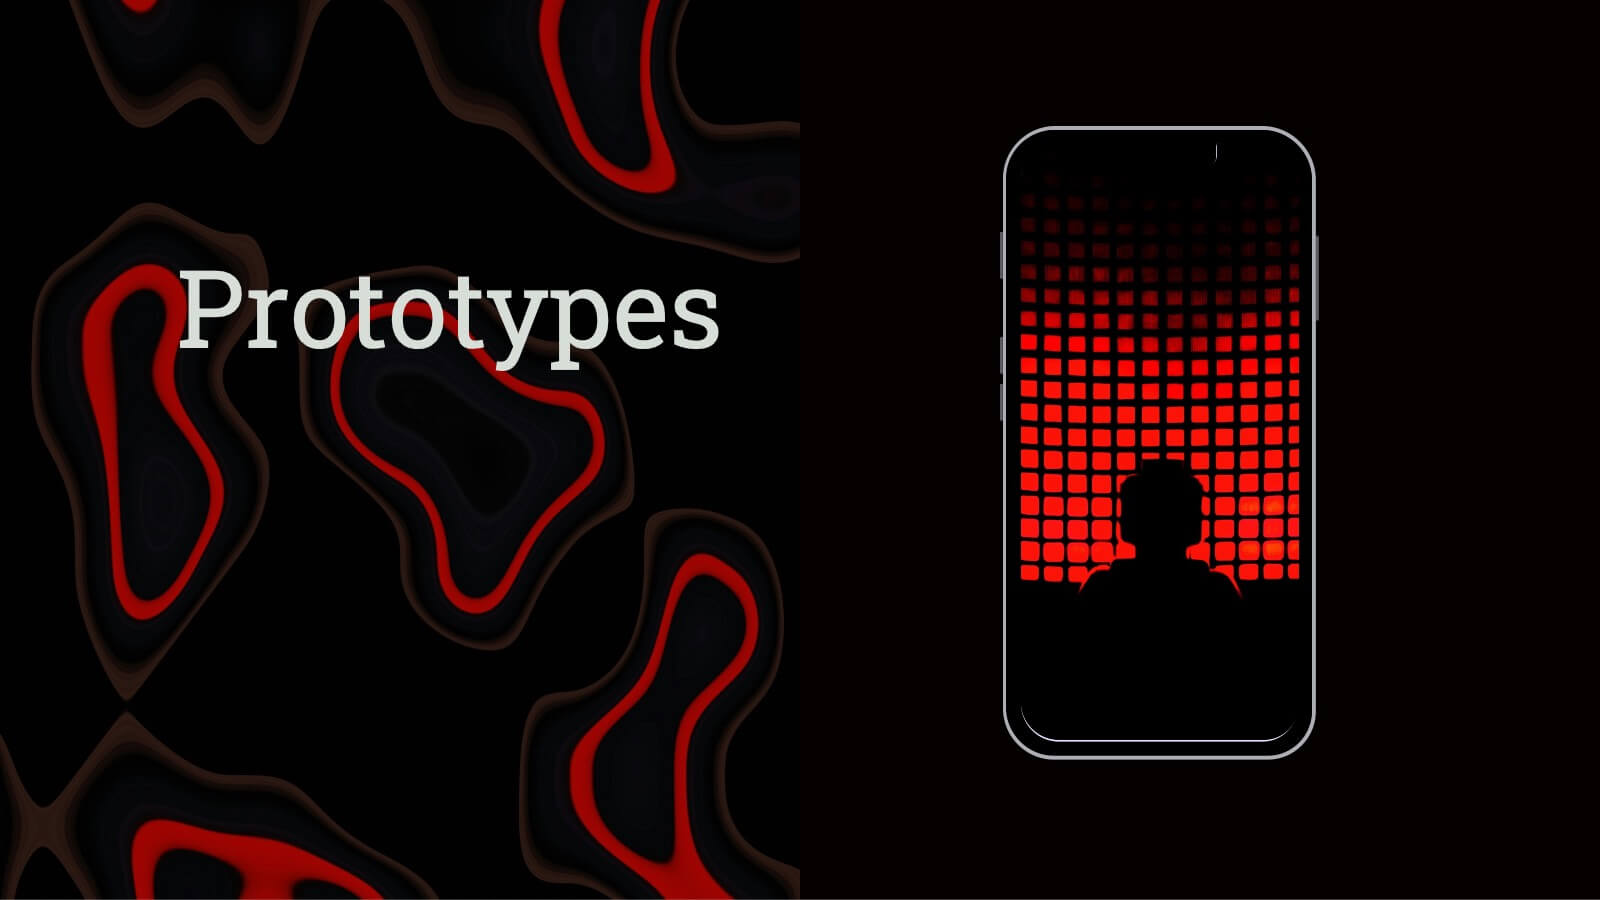
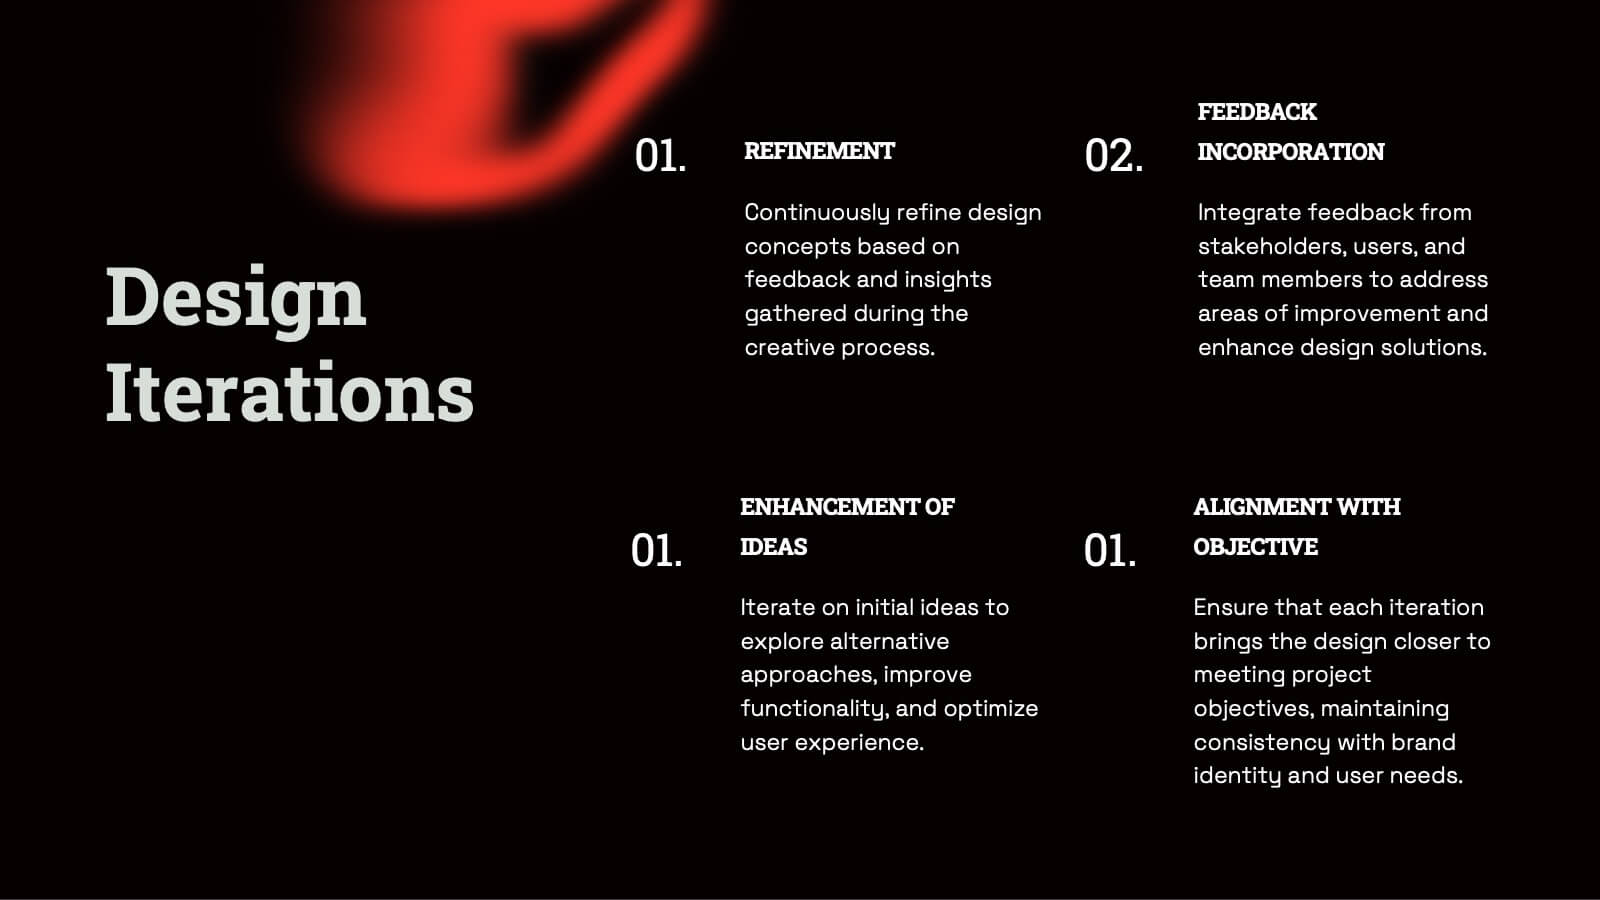
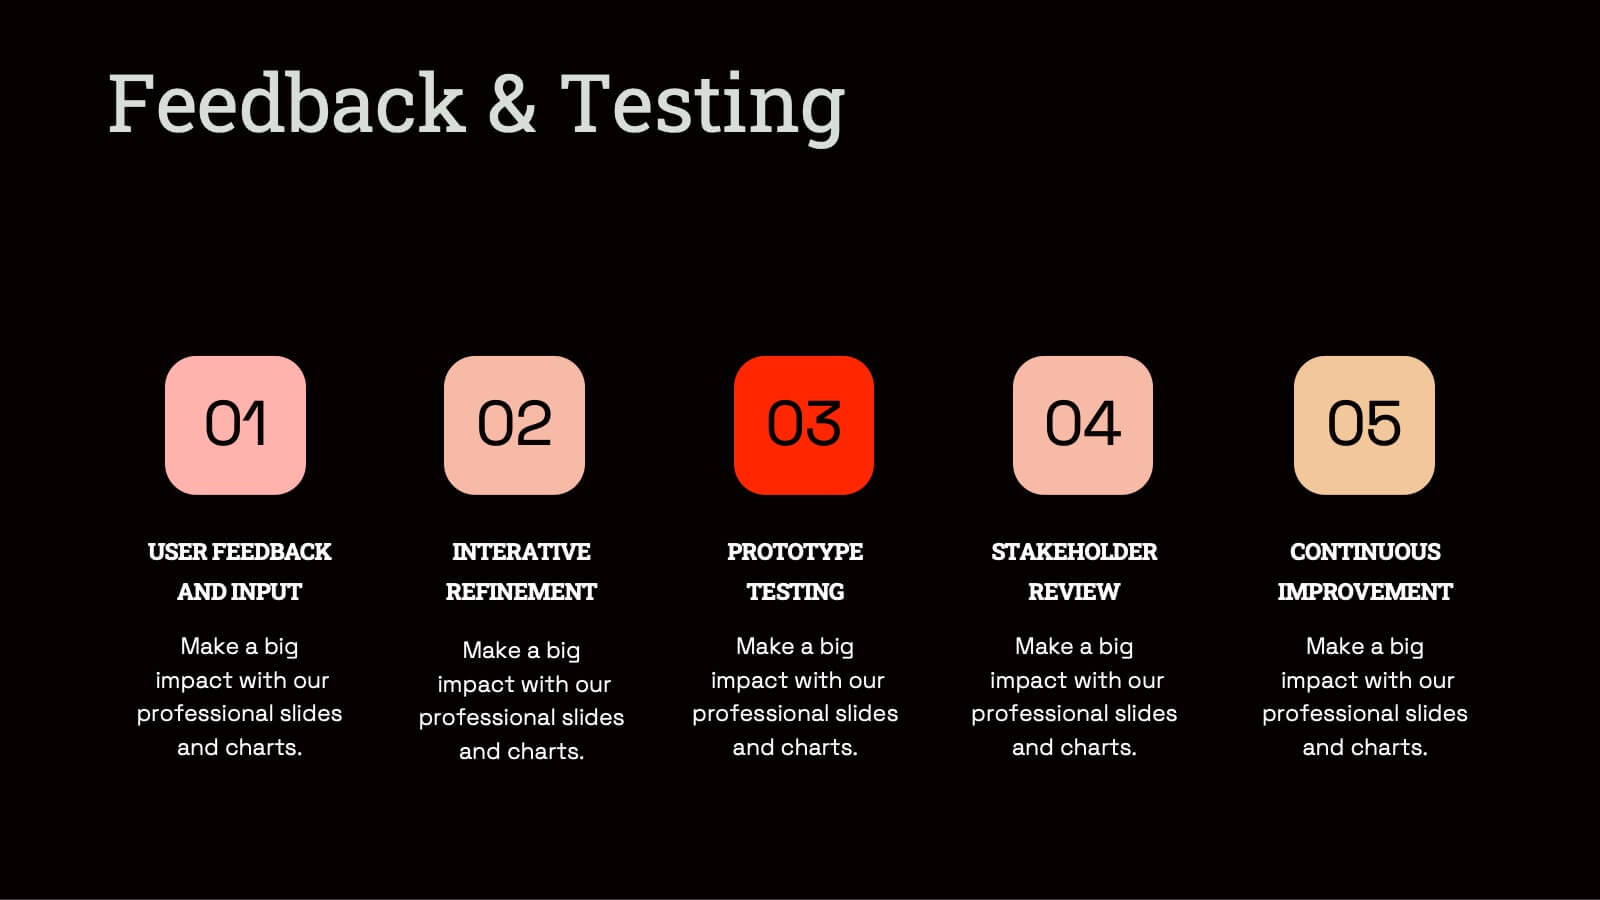
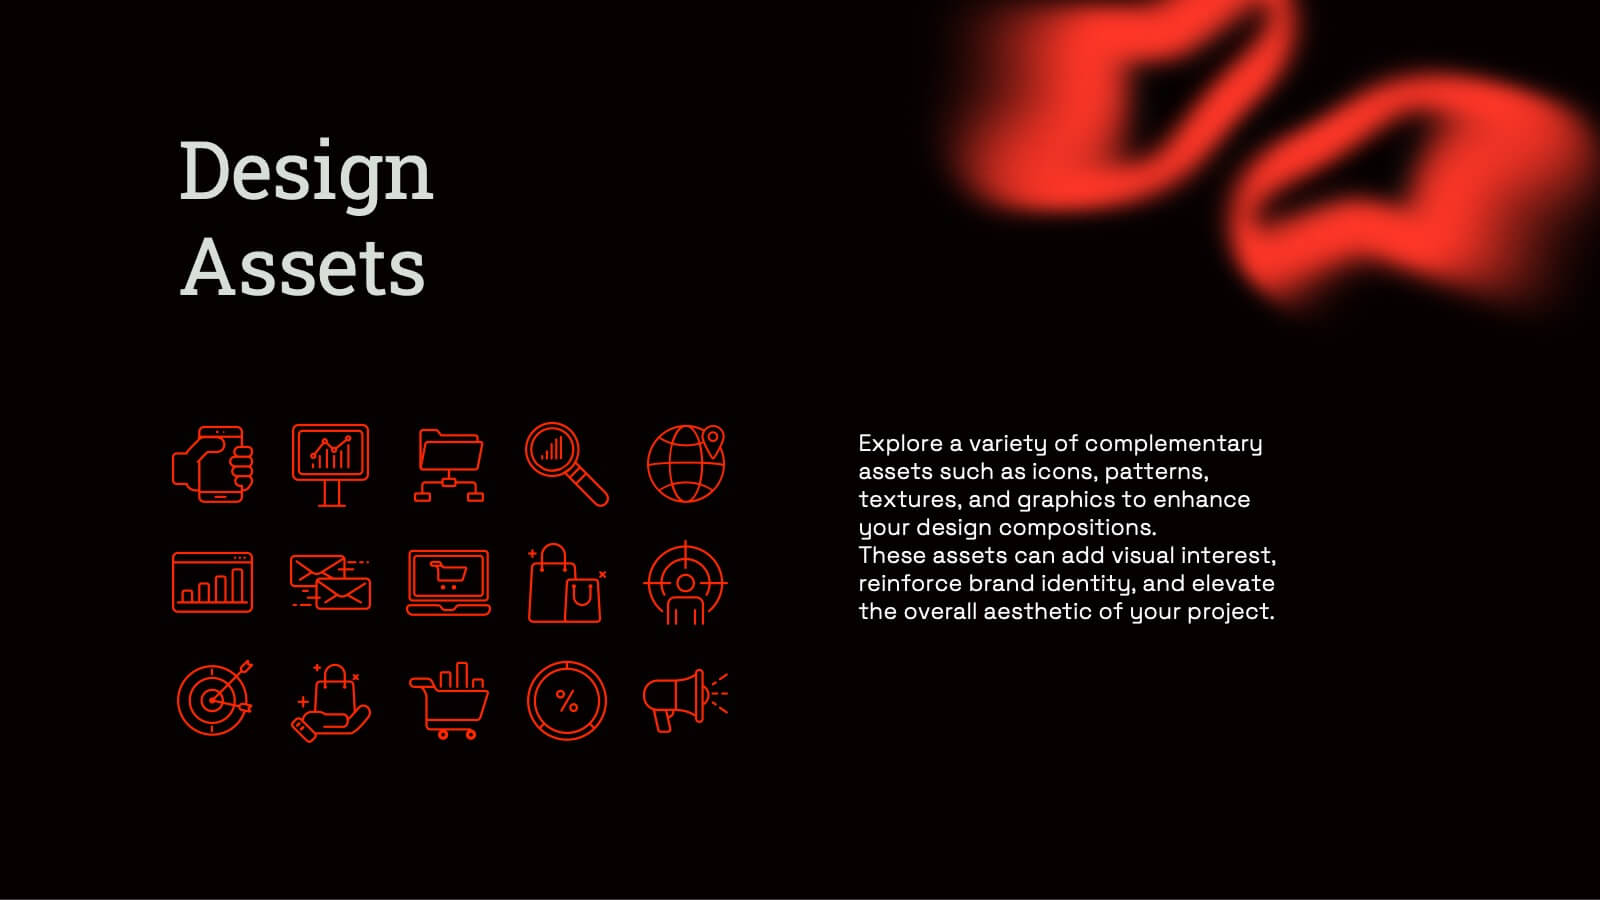
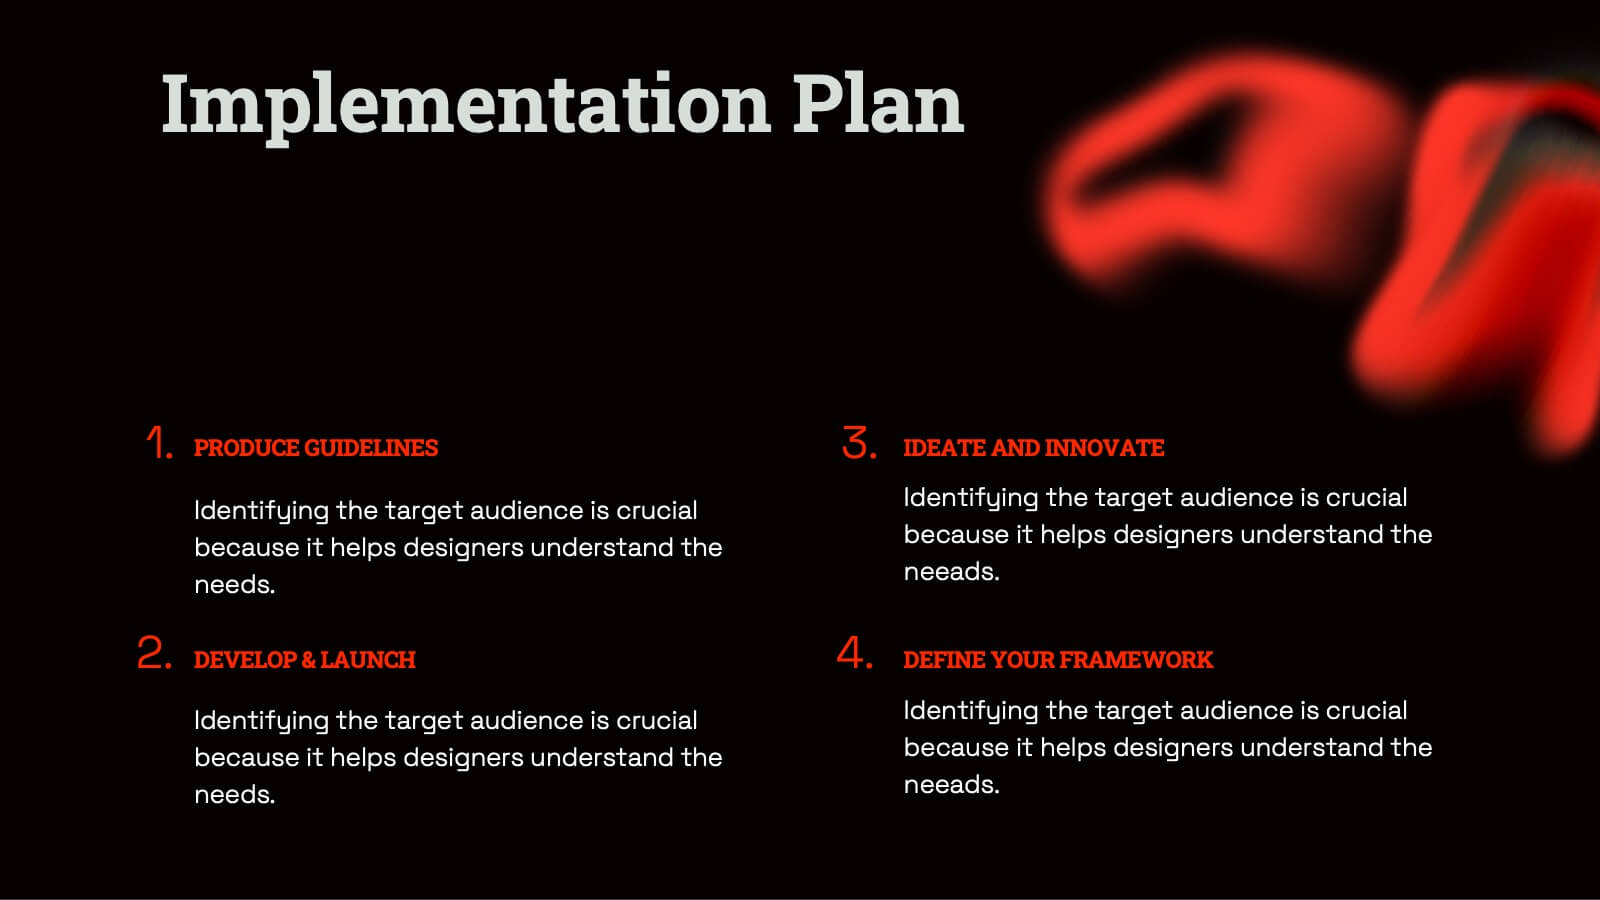
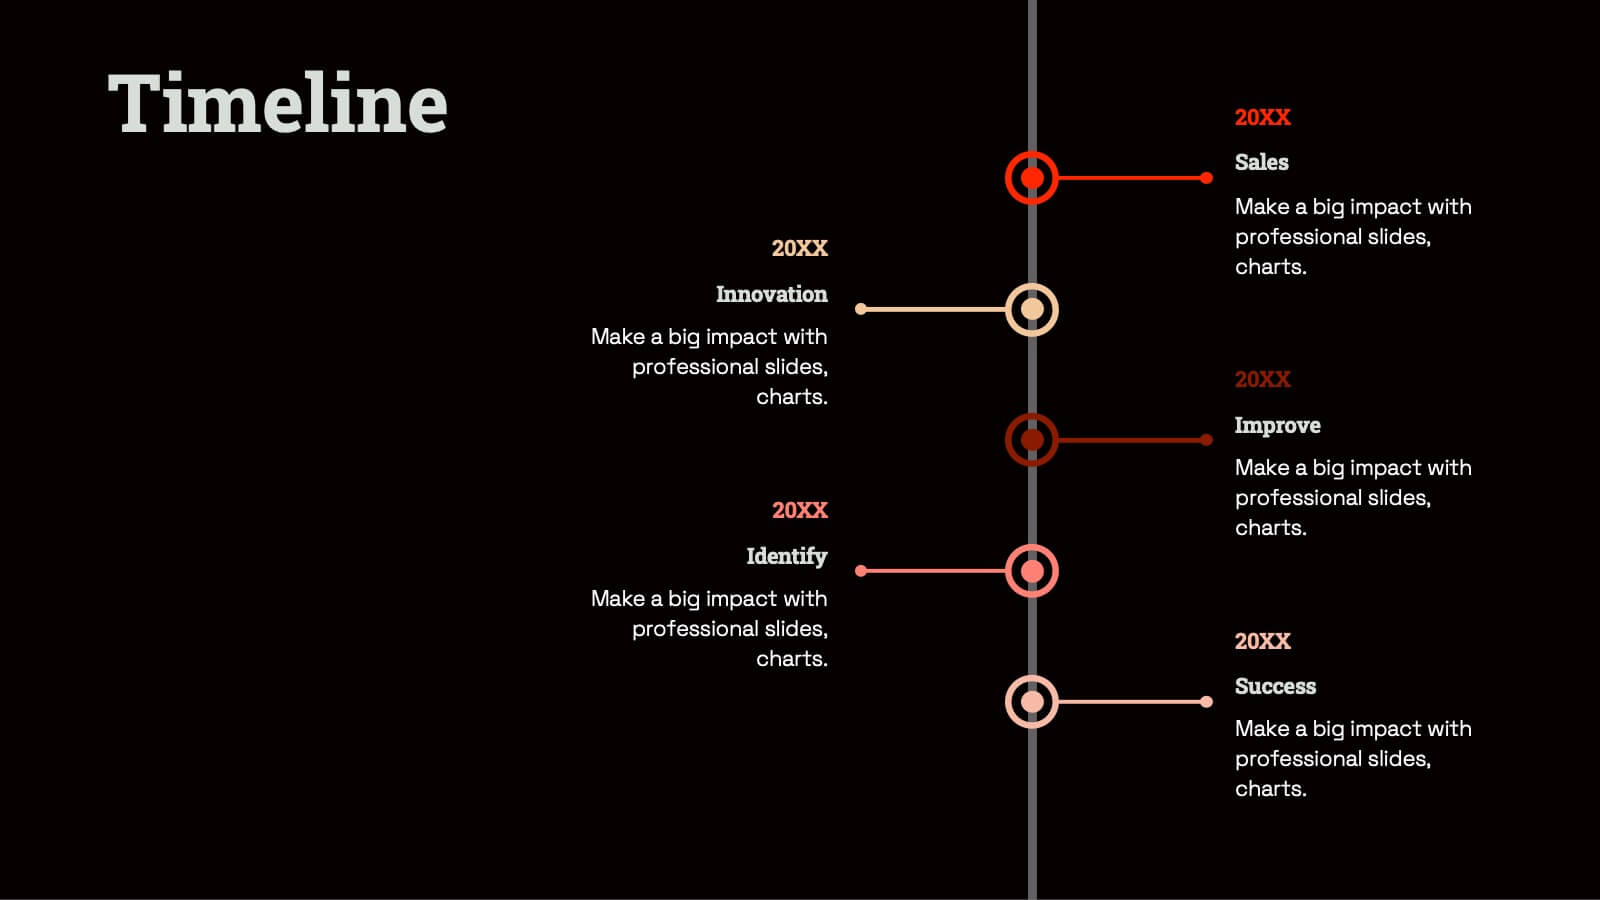
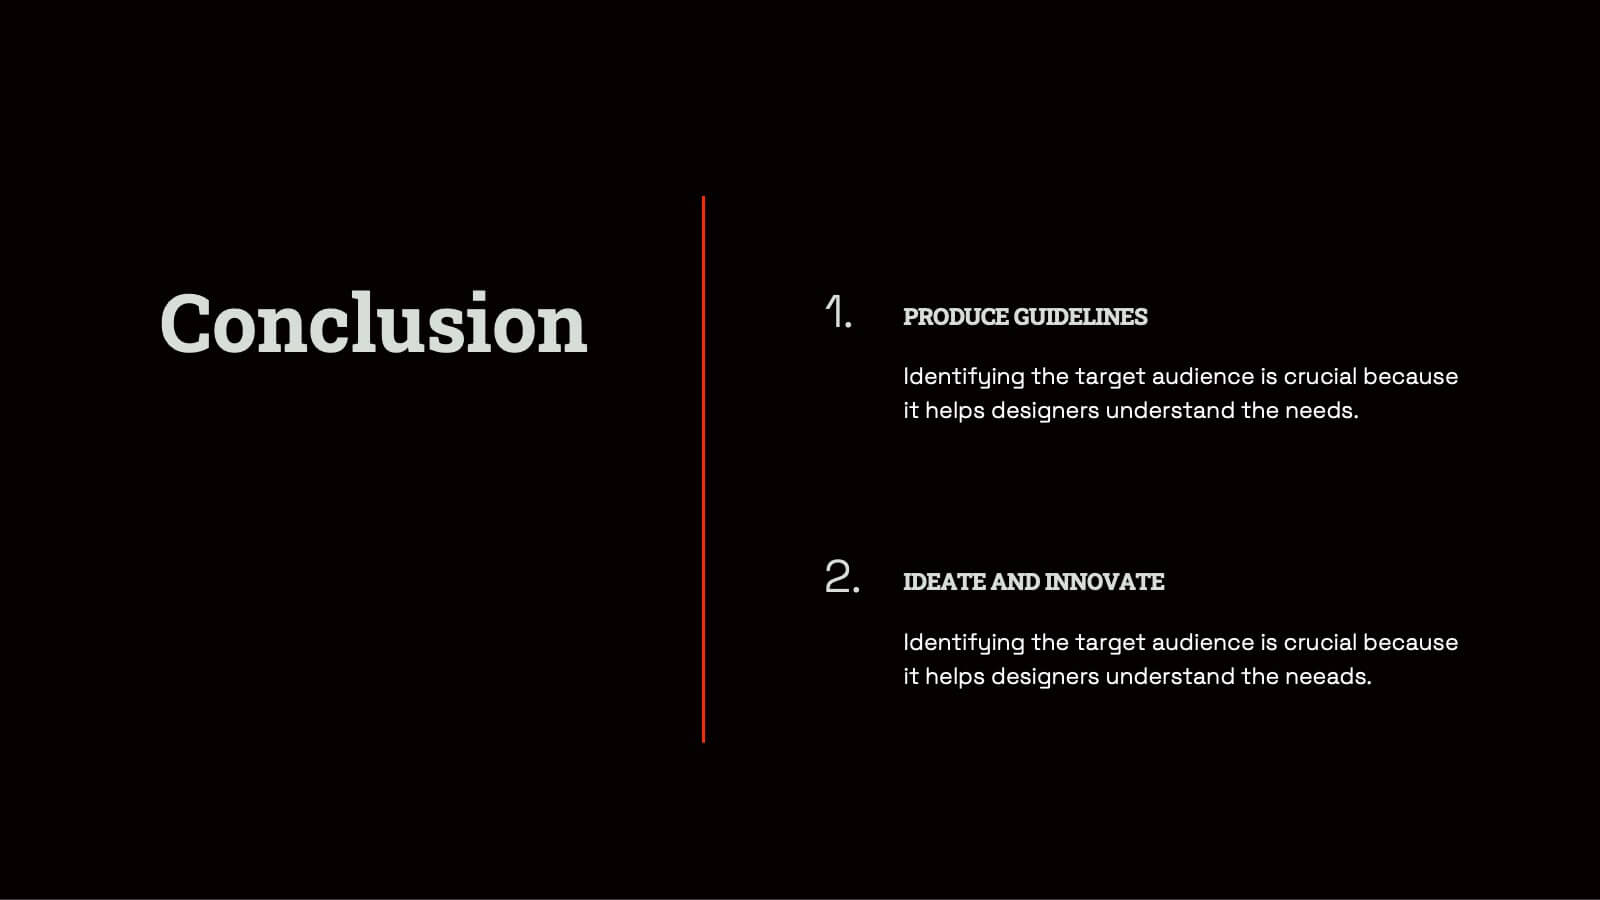
Radiant Graphic Design Project Plan Presentation
Unleash your creativity with this bold and dynamic graphic design project plan template! Perfect for showcasing design elements, textures, and typography, this template guides you through every phase, from concept development and prototyping to feedback and final presentations. Ideal for visual direction and design asset management, it’s fully compatible with PowerPoint, Keynote, and Google Slides for seamless use.


5 diapositivas
Mind and Brain Creativity Concept Diagram Presentation
Ignite fresh thinking with the Mind and Brain Creativity Concept Diagram Presentation—a smart and visually engaging template that maps out five core concepts around a central brain icon. Each idea is linked with intuitive visuals and labeled A through E, ideal for creative strategy, innovation pitches, or mental model breakdowns. Fully customizable in PowerPoint, Keynote, and Google Slides.


7 diapositivas
Growth Challenges Infographic
Navigating the path to success often involves understanding both growth and challenges. The growth challenge infographic, adorned in refreshing shades of green, white, and blue, provides an intuitive representation of these dual trajectories. Whether you're a startup striving for market traction or an established entity mapping out expansion strategies, this template crystallizes your journey. Business analysts, strategy consultants, and team leads will find this tool invaluable for driving insights and fostering discussions. Enhanced for compatibility with PowerPoint, Keynote, and Google Slides, this infographic is your visual ally in narrating business tales.


6 diapositivas
Business Logic Flow Chart
Streamline complex processes with the Business Logic Flow Chart Presentation. This modern, curved connector design helps you visually outline up to five sequential steps or logic paths, using colorful icons and editable text fields. Ideal for business workflows, strategic plans, or data flow maps. Fully compatible with PowerPoint, Keynote, and Google Slides.


6 diapositivas
Virtual Team Collaboration and Productivity Presentation
Boost team synergy and streamline communication with this Virtual Team Collaboration and Productivity presentation. Designed around a 6-step path, this visual layout helps illustrate key strategies for remote teamwork, digital workflows, and efficient task distribution. Each step is clearly labeled with space for your insights, making it ideal for team training, project kickoff meetings, or collaboration tool tutorials. Fully editable and compatible with PowerPoint, Keynote, and Google Slides.


7 diapositivas
Gantt Chart Management Infographic
Elevate your project planning with our gantt chart management infographic. Laid out on a pristine white backdrop and highlighted with the professional shades of blue, regal purple, energetic red, and growth-centric green, this template is the epitome of structured time management. Equipped with illustrative infographics, symbolic icons, and dedicated image placeholders, it breaks down project timelines and tasks with immaculate precision. Immaculately tailored for Powerpoint, Keynote, or Google Slides. An invaluable asset for project managers, team leaders, corporate trainers, or anyone aiming for meticulous time tracking and project progression.


8 diapositivas
Educational Lesson Plan Presentation
The "Educational Lesson Plan Presentation" template offers a vibrant and engaging method to display educational strategies and frameworks. This template uses a stacked blocks design that visually represents the hierarchical structure of lesson components. Each block is color-coded, facilitating easy distinction between different sections such as Title 01, Title 02, Title 03, and Title 04, which can be customized with specific educational goals or key points. This format is ideal for educators planning their lessons or for presentations at educational seminars, workshops, or teacher training sessions, where clarity and visual structure enhance communication and understanding.


4 diapositivas
Statistical Analysis Charts Presentation
Present your data with clarity using this Statistical Analysis Charts Presentation Template. Designed with overlapping bubble visuals and percentage indicators, it’s ideal for displaying survey results, statistical breakdowns, or demographic segments. Clean, modern, and fully editable in PowerPoint, Keynote, and Google Slides.


7 diapositivas
Health Center Infographic Presentation
Health is an essential aspect of human life and is crucial for individuals to lead a happy, productive, and fulfilling life. This template can help you visualize almost any kind of health information and make it easy to understand. You can add images and text to explain different aspects, and easily edit the content to dive right into presenting your information. This template has background images, graphs, charts and other elements to transform your infographic. This template is professionally designed and illustrated to be downloaded in PowerPoint, Keynote and Google Slides.


3 diapositivas
Introduction to Cryptocurrency Presentation
Step into the future of finance with this sleek, modern template designed to explain digital currencies in a simple, engaging way. Perfect for educators, startups, and analysts, it transforms complex ideas into clear visuals. Fully compatible with PowerPoint, Keynote, and Google Slides for effortless editing and professional presentations.


7 diapositivas
Spider Diagram Mind Map Presentation
Turn scattered ideas into structured brilliance with a clean, visual layout that connects every concept effortlessly. This presentation helps you organize thoughts, brainstorm strategies, or map out projects with clarity and flow. Fully editable and compatible with PowerPoint, Keynote, and Google Slides for easy customization and collaboration.


10 diapositivas
Strategic Idea Clustering Bubble Map
Visualize and organize your concepts with the Strategic Idea Clustering Bubble Map Presentation. This dynamic bubble diagram is ideal for brainstorming sessions, strategic planning, and idea grouping. Each node highlights key points around a central concept. Fully customizable in PowerPoint, Keynote, and Google Slides—perfect for teams, consultants, and innovators.