


Características


¿Tienes alguna pregunta?
Recomendar


7 diapositivas
Advanced Education Infographics
The "Advanced Education" infographic template is a sophisticated and visually engaging resource, designed meticulously for PowerPoint, Keynote, and Google Slides. This template is an invaluable tool for educators, administrators, and policy makers aiming to present complex educational frameworks, advanced curriculum details, and innovative learning methodologies. The template expertly encapsulates the essence of advanced education, highlighting specialized programs, cutting-edge research opportunities, and pathways for academic excellence. It's organized to showcase the breadth and depth of advanced educational offerings, making it perfect for academic conferences, institutional presentations, or educational policy discussions. The design is as intellectually stimulating as the content it represents, with a color scheme that is both elegant and conducive to a learning environment. This not only enhances the visual appeal of the presentation but also aligns with the advanced and scholarly nature of the content. Whether used in a university setting, a professional development seminar, or a policy briefing, this template ensures that the value and intricacies of "Advanced Education" are communicated with sophistication, clarity, and visual impact.


4 diapositivas
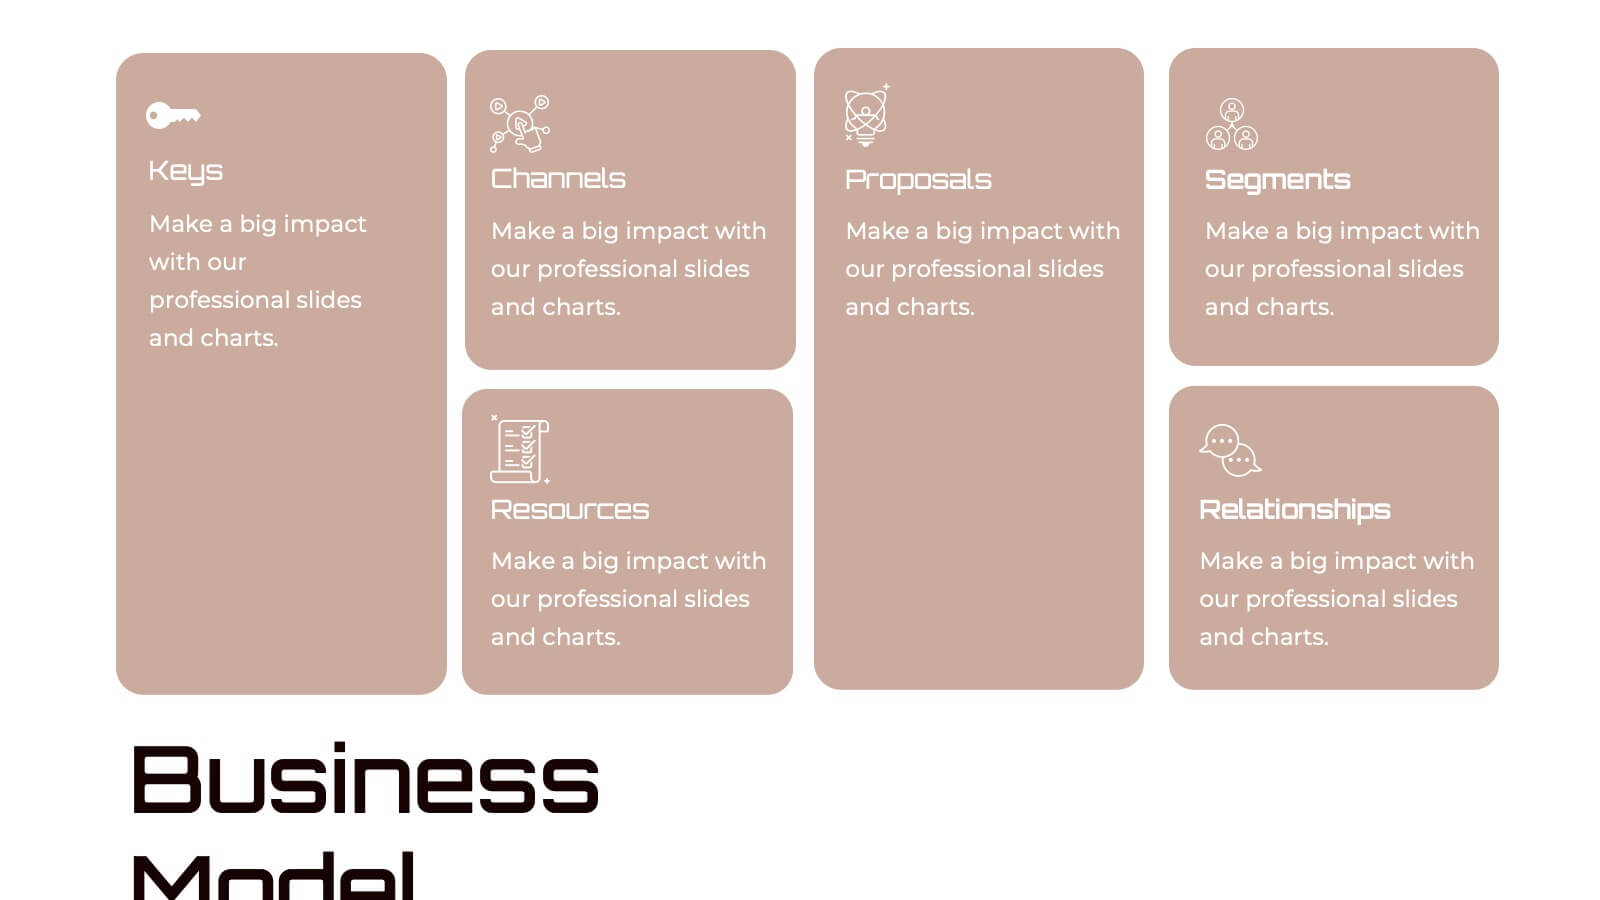
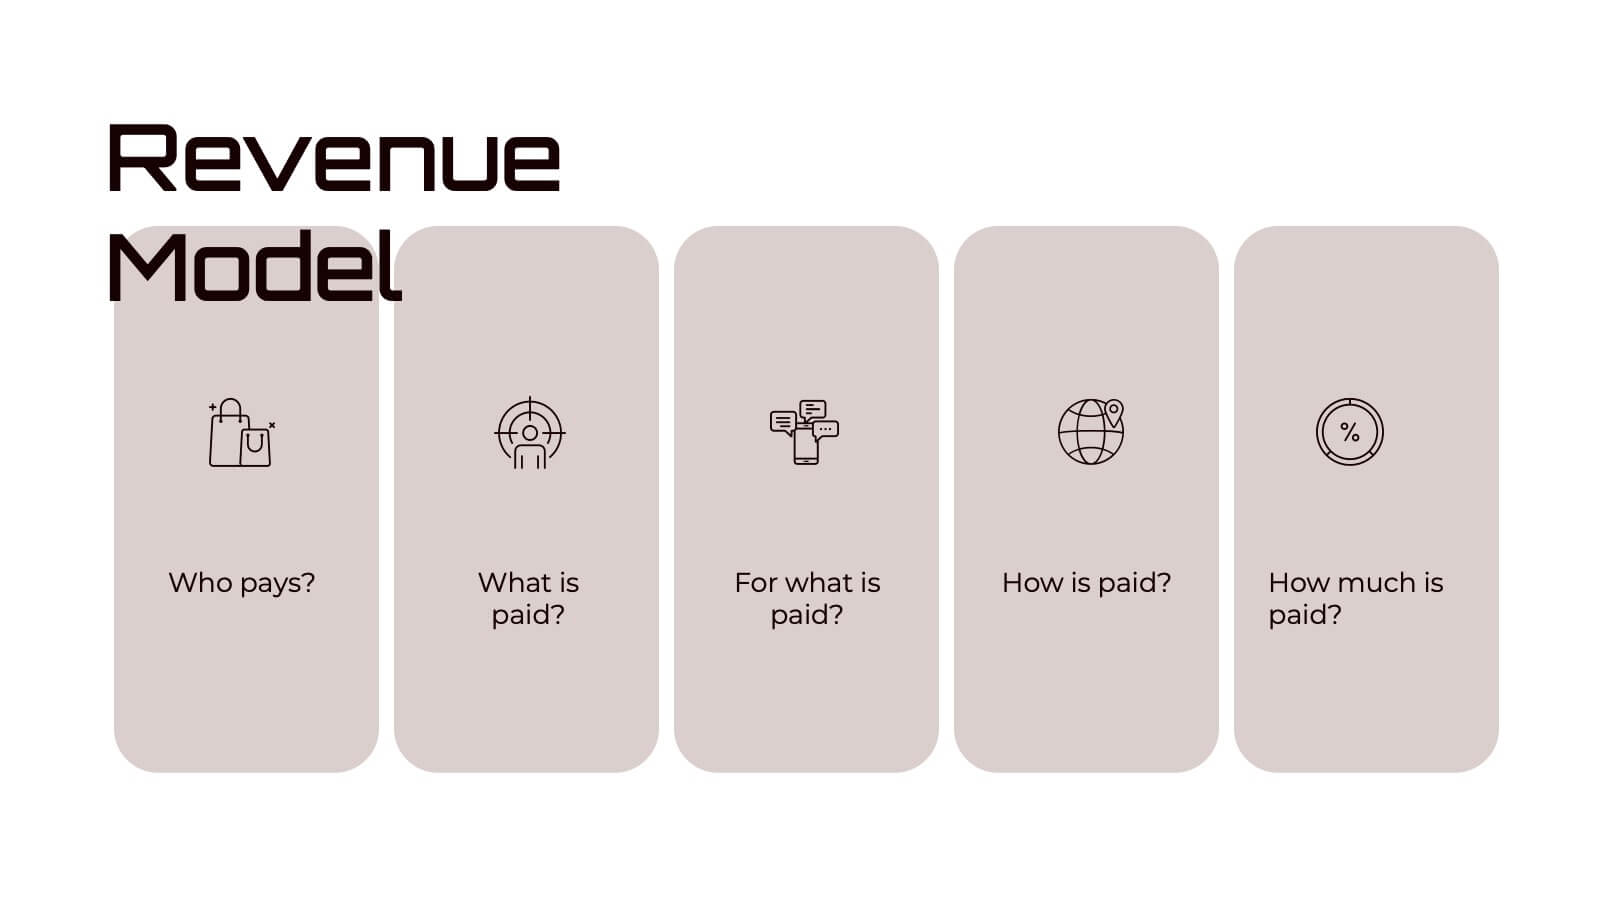
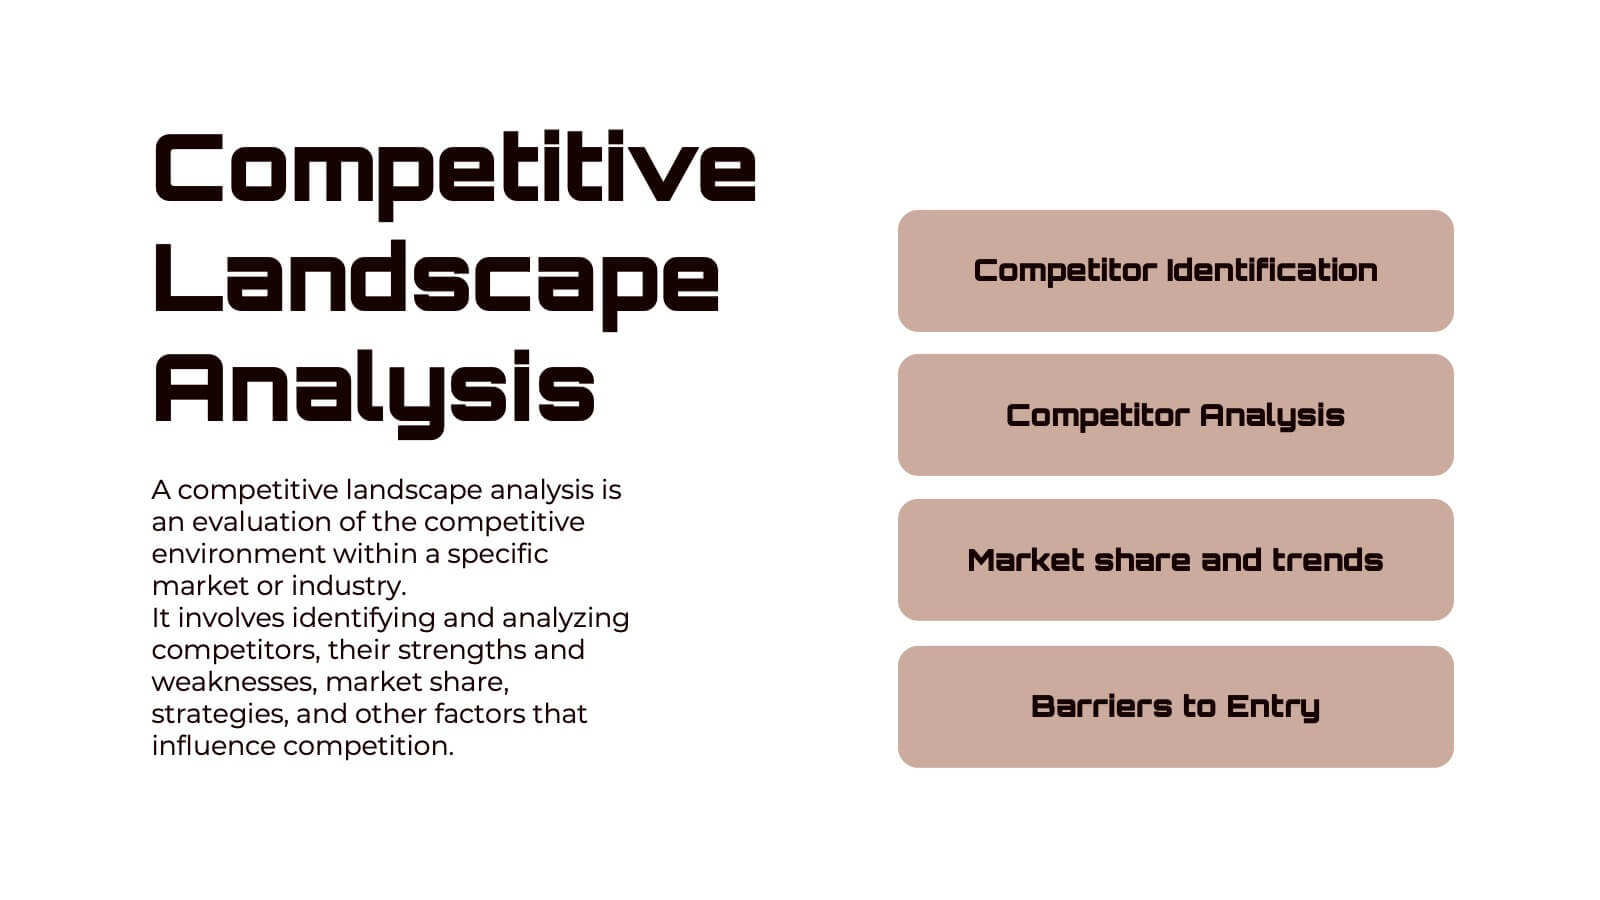
Key Performance Indicators Presentation
Hit every target with a bold, visual layout that helps you present performance insights with clarity and impact. This presentation makes it easy to highlight goals, measure progress, and showcase meaningful data in a clean, modern design. Fully editable and compatible with PowerPoint, Keynote, and Google Slides.


5 diapositivas
Construction Sector and Careers Infographics
Construction Infographics provide information and data related to the construction industry. This template is a visually appealing and informative design that allows you to present key information about the construction industry and various career opportunities within it. This template provides a comprehensive platform to showcase the different aspects of the industry and the diverse career paths available. Compatible with Powerpoint, Keynote, and Google Slides, ensuring easy customization and flexibility. The infographics feature construction-themed illustrations and icons, to captures the attention of your audience and add visual interest.


7 diapositivas
Money Value Infographic
The value of money refers to its purchasing power or what it can buy in goods, services, or investments. Creating an infographic about the value of money can help people understand various aspects of finance, investment, and wealth. This template is compatible with Powerpoint, Keynote, and Google Slides. Customize the content, design, and visuals to create an engaging and informative infographic that helps people better understand the value of money and how to manage it wisely. Financial literacy is a valuable skill, and your infographic can empower individuals to make sound financial decisions.


6 diapositivas
Quality Control Six Sigma Process Presentation
Bring clarity and energy to your workflow with this clean visual guide that outlines each phase of a structured improvement cycle. It helps communicate steps, responsibilities, and progress in a polished, professional way your audience can follow instantly. Fully compatible with PowerPoint, Keynote, and Google Slides.


22 diapositivas
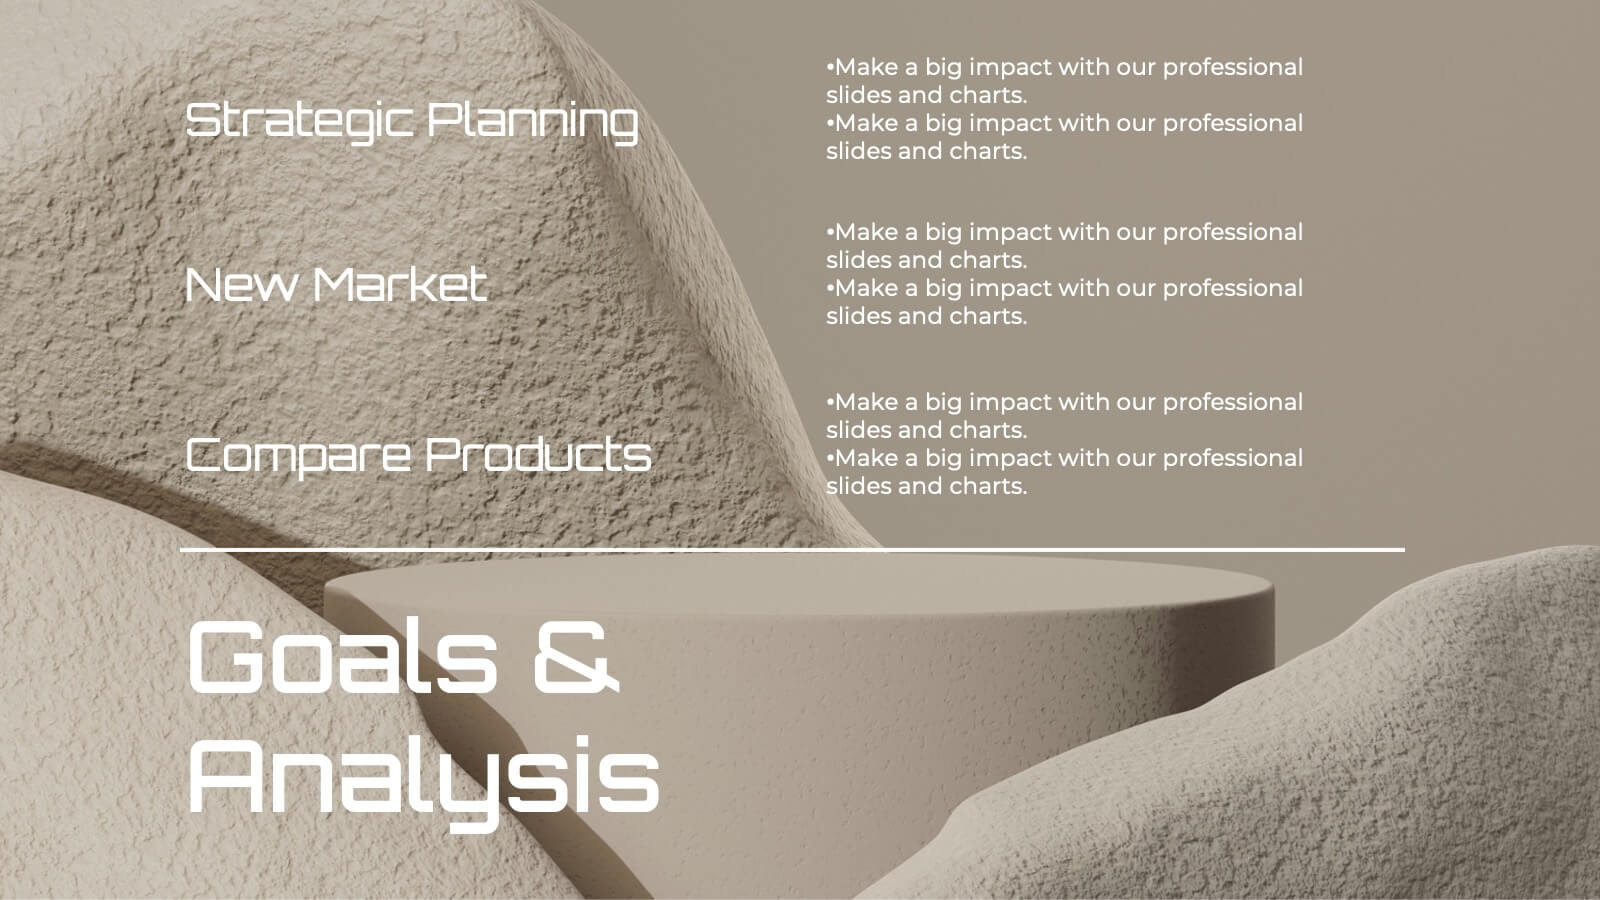
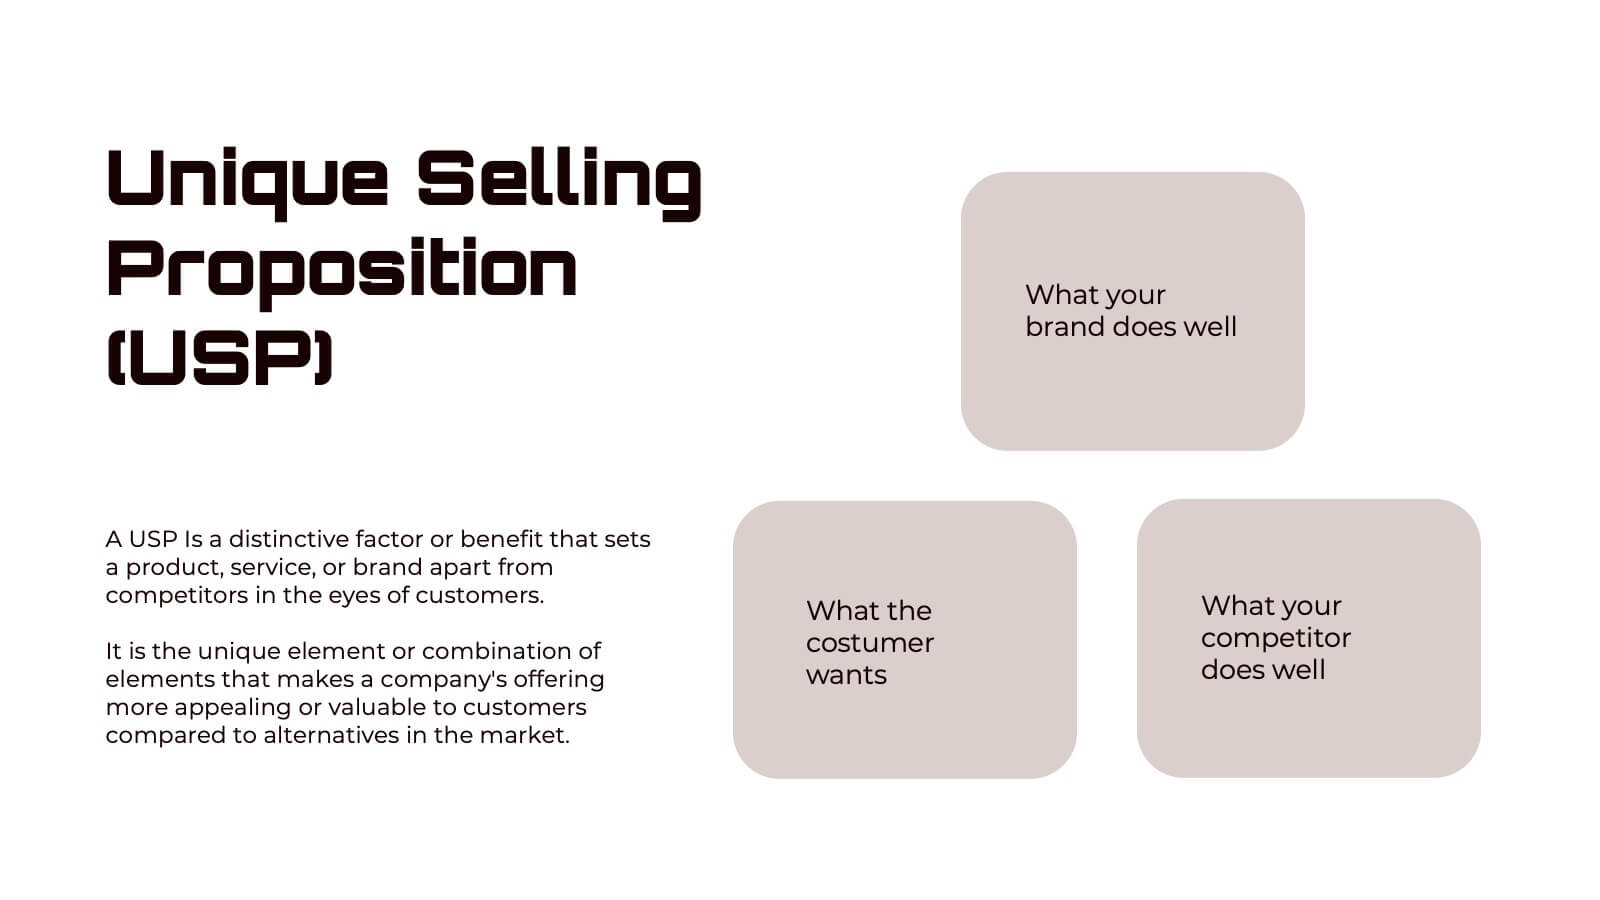
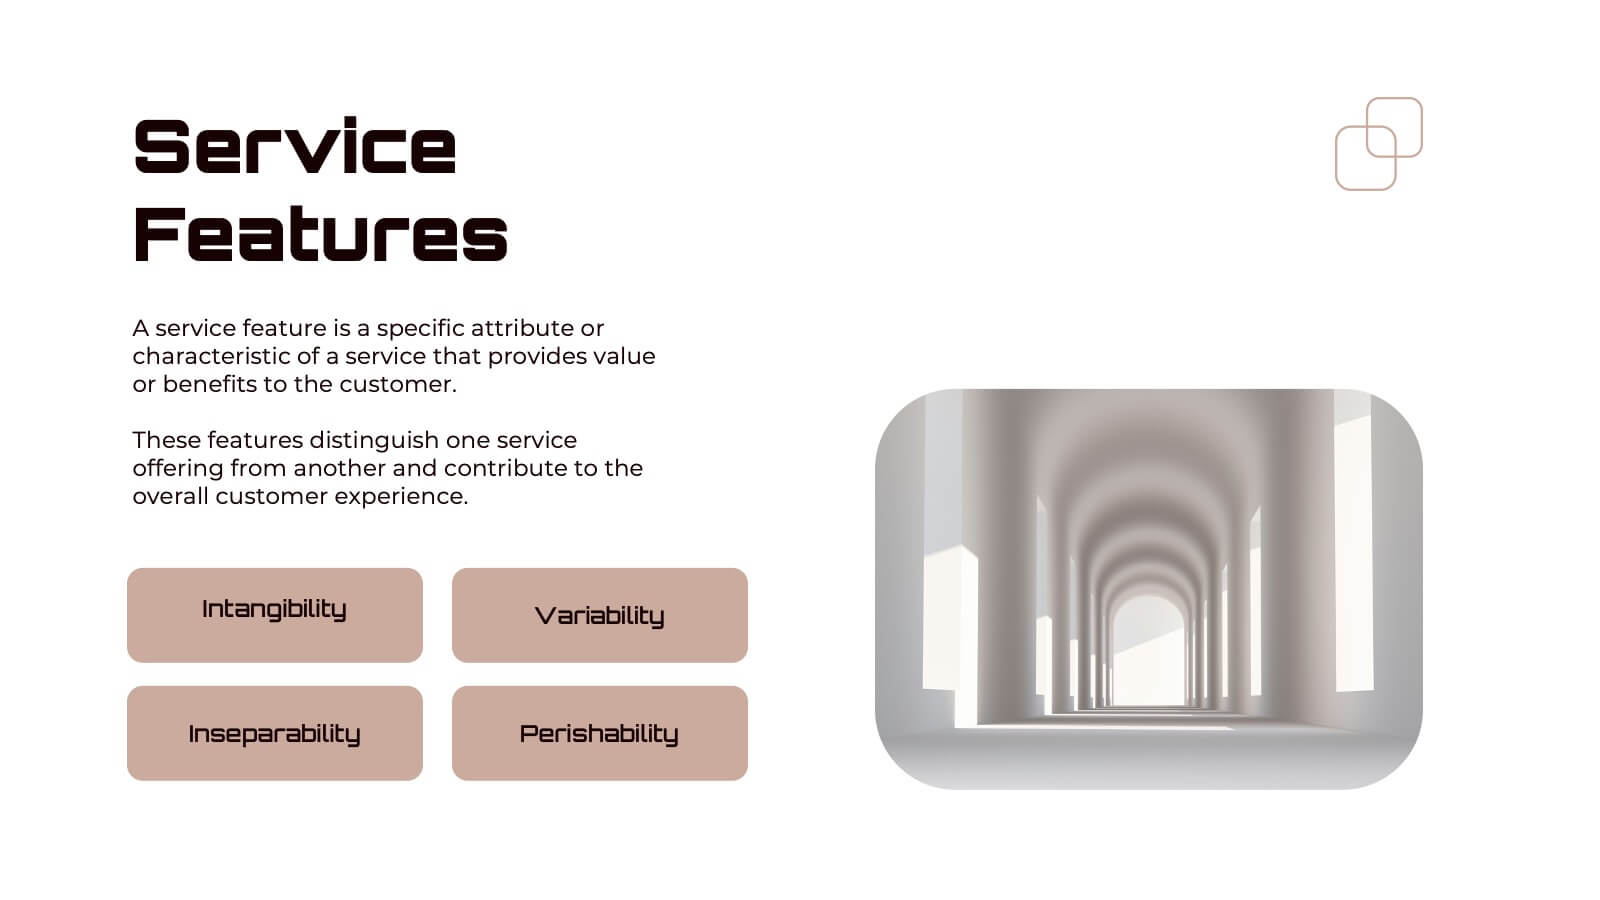
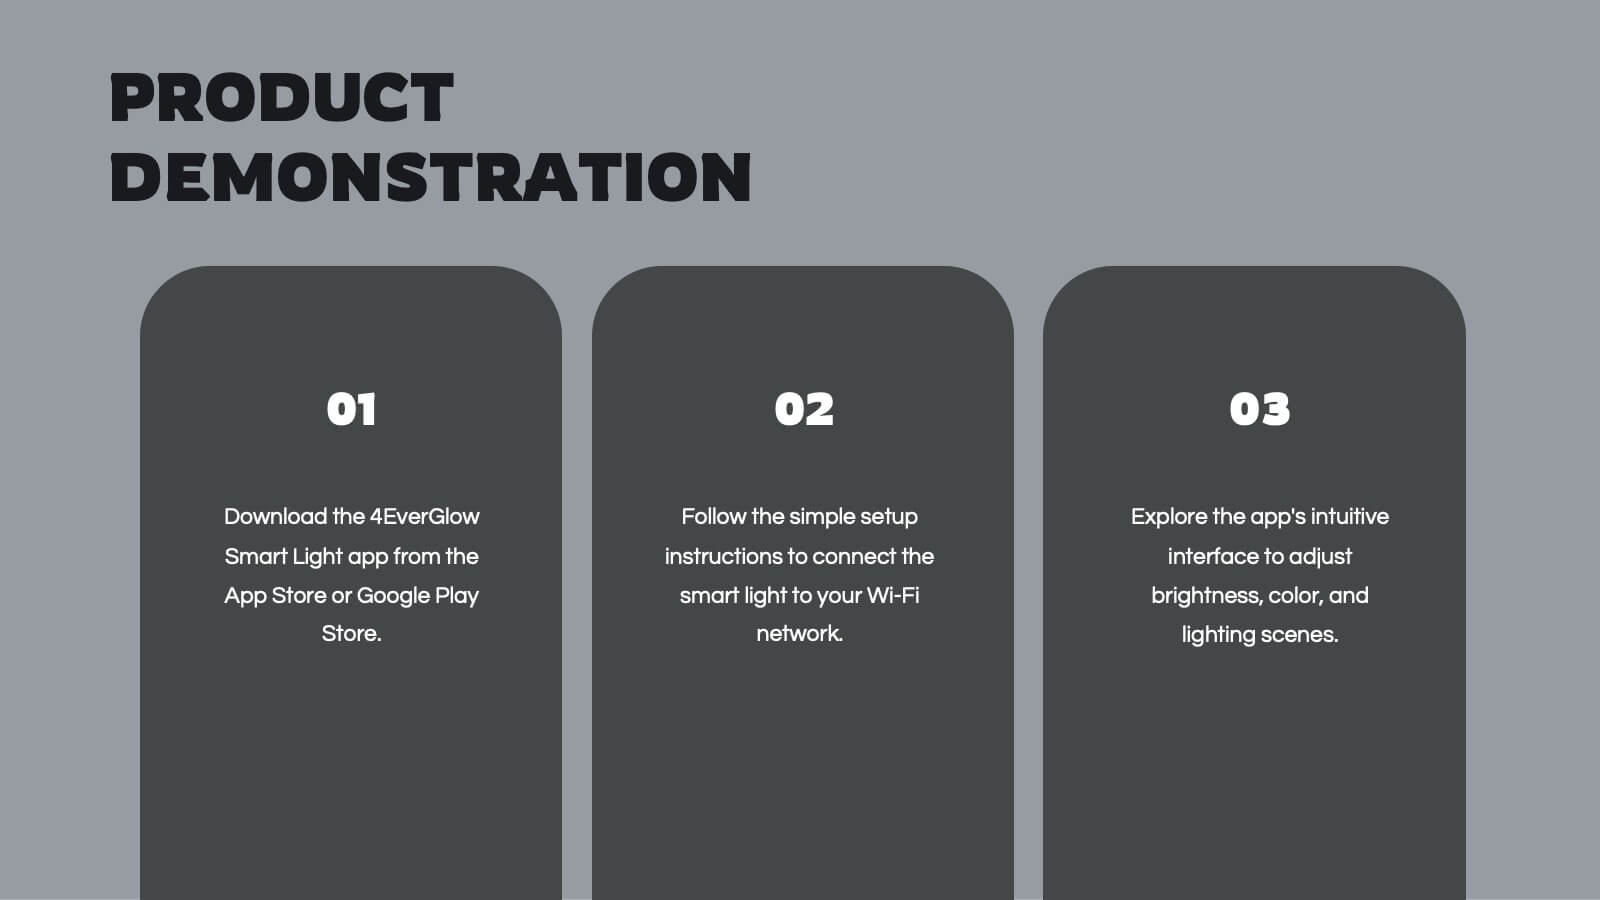
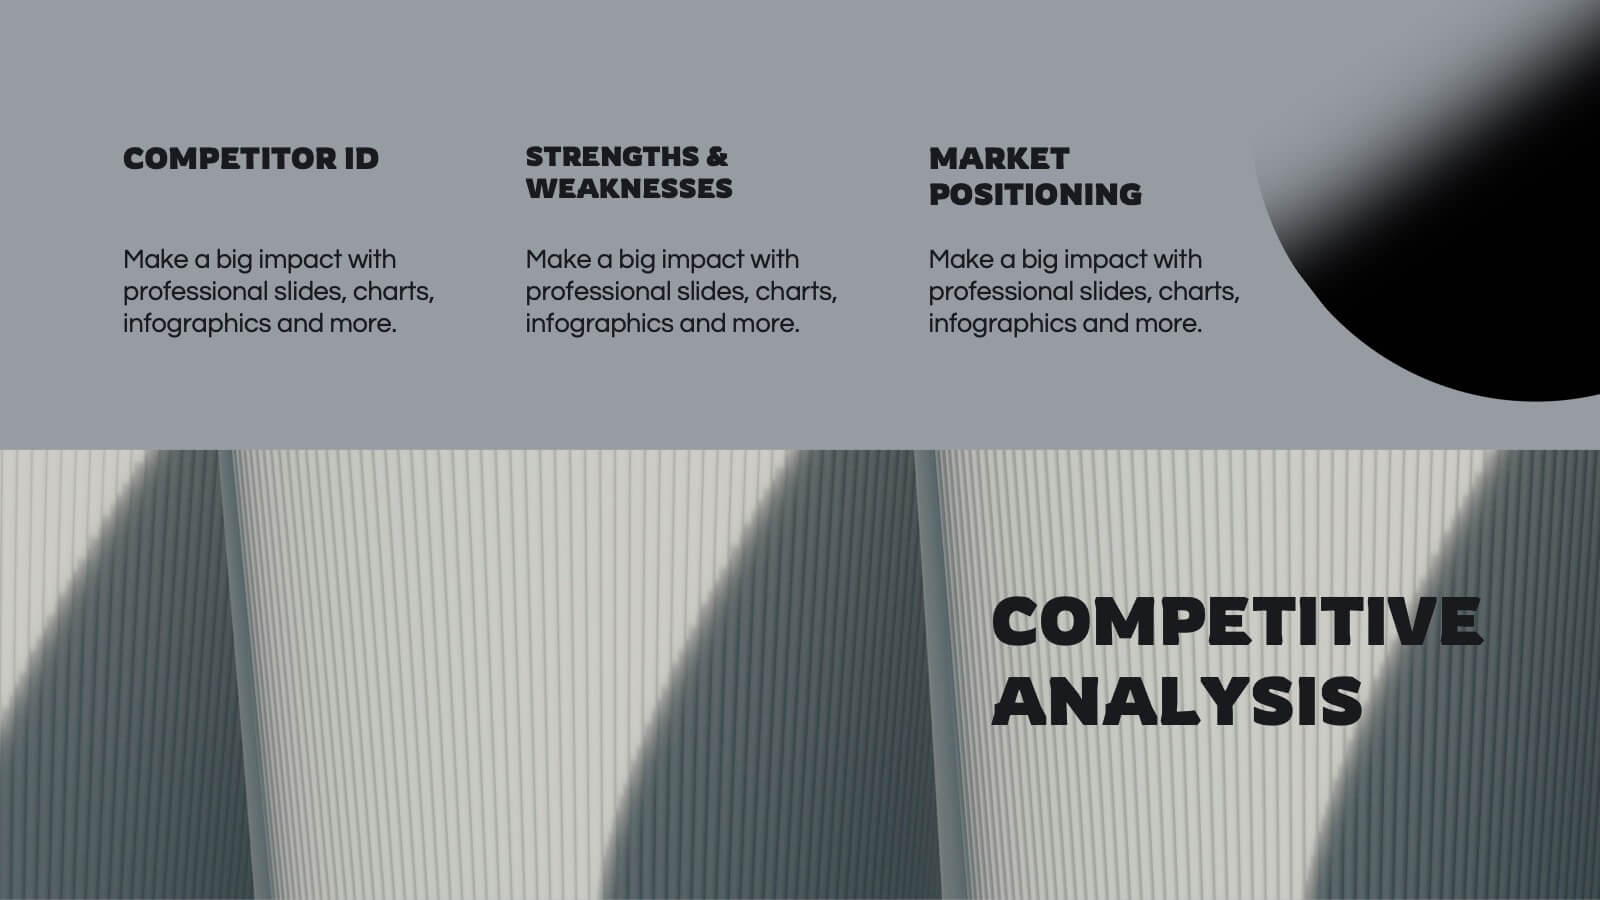
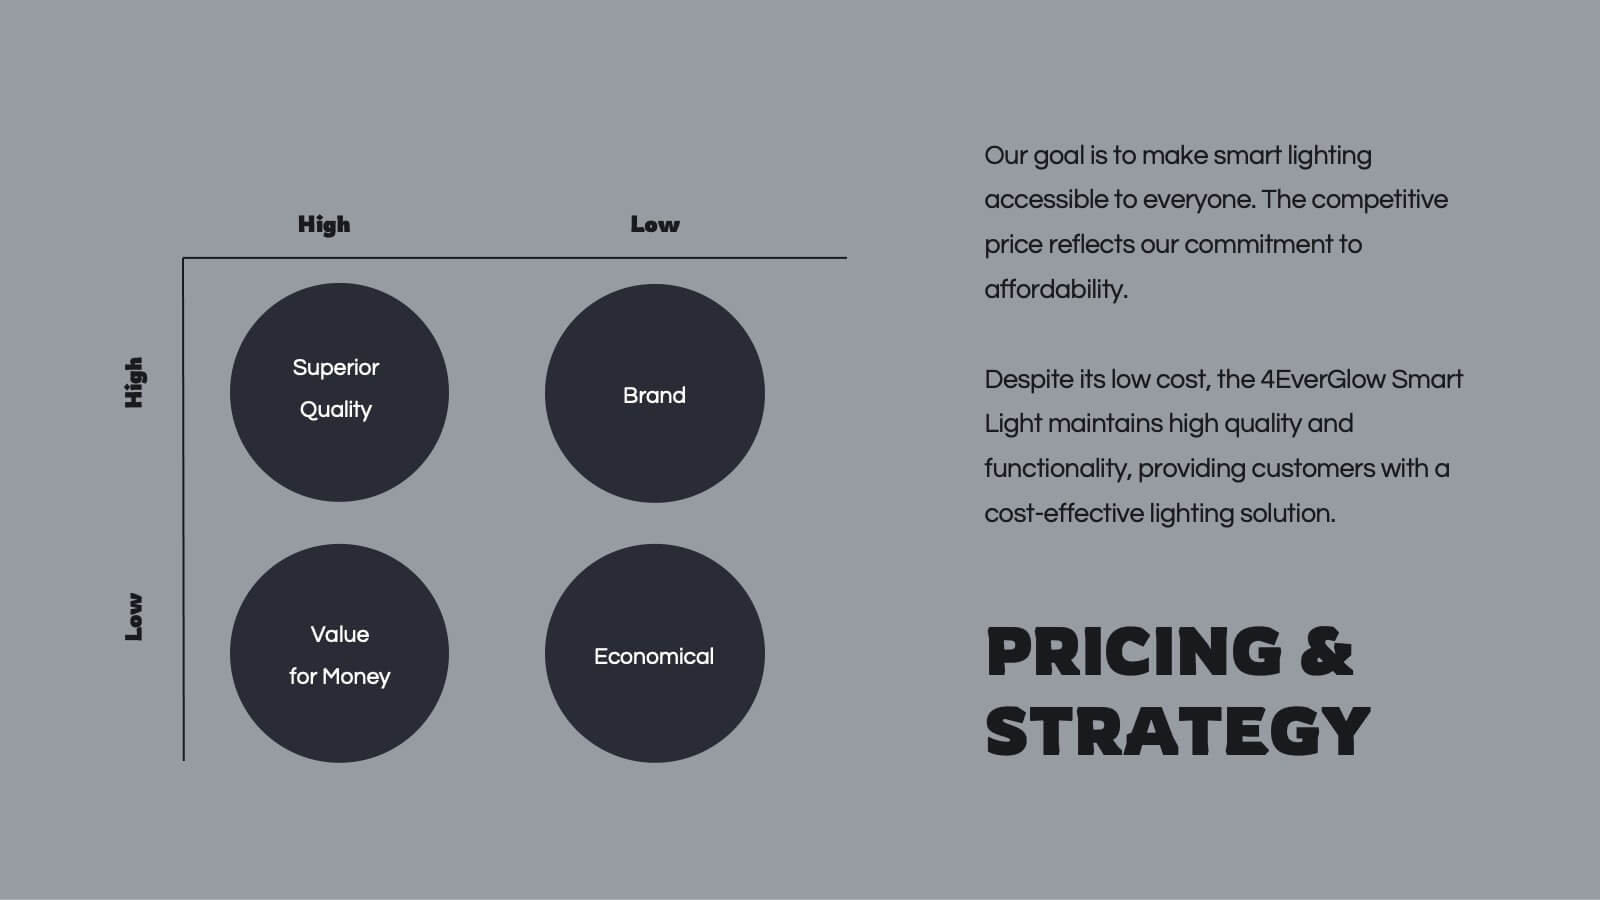
Pearl Product Launch Pitch Deck Presentation
Make your product launch shine with this sleek, pearl-inspired presentation! Perfect for pitching your product’s unique value, market positioning, and growth potential, this template is designed to captivate investors and stakeholders. Its elegant, minimalist layout keeps your message front and center. Compatible with PowerPoint, Keynote, and Google Slides.


2 diapositivas
Professional Cover Slide Design Presentation
Make a bold first impression with this clean and modern cover slide layout. Featuring a split design with customizable photo space and a vibrant call-to-action label, this slide balances professionalism with creativity. Perfect for proposals, company overviews, or keynote introductions. Easily personalize the title, color palette, and image. Fully compatible with PowerPoint, Keynote, and Google Slides.
7 diapositivas
Arrow Functions Infographic
Illuminate the nuances of arrow functions with our arrow functions infographic. Displayed on a sleek white backdrop, enhanced with purposeful green, analytical blue, and definitive black, our template articulates the mechanics and applications of arrow functions with utmost clarity. Fitted with lucid infographics, representative icons, and flexible image placeholders, it breaks down the technicalities into digestible insights. Immaculately adapted for Powerpoint, Keynote, or Google Slides. A quintessential tool for software developers, coding instructors, students, or any tech-savvy individual keen on deepening their understanding.


10 diapositivas
Aviation Industry Market Analysis Presentation
Leverage key insights into the aviation sector with the "Aviation Industry Market Analysis" presentation template. This design allows professionals in the aviation industry to effectively communicate market trends and forecasts. Its compatibility with PowerPoint, Keynote, and Google Slides ensures a versatile use across different platforms, making it ideal for industry analyses, investor meetings, or internal strategy discussions.


8 diapositivas
Puzzle Piece Strategy Connection Presentation
Align your ideas with clarity using the Puzzle Piece Strategy Connection Presentation. This vertical puzzle layout visually connects four key steps, making it perfect for illustrating strategy alignment, workflow processes, or integrated systems. Easily editable in PowerPoint, Canva, or Google Slides—ideal for team briefings or strategic roadmaps.


8 diapositivas
Business Data Analytics Dashboard
Monitor performance with clarity using this Business Data Analytics Dashboard. Featuring data bars, numeric highlights, and color-coded insights, this slide is perfect for quarterly updates, data reviews, or executive summaries. Clean and professional, it's fully editable in PowerPoint, Keynote, and Google Slides.


26 diapositivas
Premium Finance for Daily Life Presentation
Introducing our Premium Finance for Daily Life Presentation template this is a comprehensive and informative tool to educate individuals about the concept of premium finance and its relevance in everyday life. This presentation aims to provide valuable insights on how premium finance can be utilized to manage and optimize personal finances. The slides are fully customizable and compatible with PowerPoint, Keynote, and Google Slides. It features a professional design with clean layouts, visually appealing graphics, and icons related to finance and daily life activities. The presentation can cover various topics related to premium finance.


5 diapositivas
Construction Equipment Infographics
Dive into the industrial world with our construction equipment infographics template. This collection, rich with vivid reds, greens, and purples, breaks down intricate machinery details into digestible visual content, perfect for professionals in the construction industry, equipment manufacturers, and trade school educators. Compatible with Powerpoint, Keynote, and Google Slides. The creative, vertical style packed with high-quality graphics and icons, facilitates the easy assembly of data and processes, enhancing presentations, or educational content. Equip yourself to convey the dynamism of construction equipment through this visually compelling tool.


6 diapositivas
Project Scope and Deliverables Overview Presentation
Make your project presentations flow effortlessly with a clear, structured layout that highlights goals, milestones, and deliverables. Ideal for tracking progress and aligning teams, this professional design balances clarity and style. Fully compatible with PowerPoint, Keynote, and Google Slides for smooth editing and presentation flexibility.


21 diapositivas
Spinel Product Strategy Report Presentation
Take your product strategy to the next level with this polished, spinel-inspired presentation! Designed to effectively communicate your product's goals, market analysis, and strategy roadmap, this template is both visually striking and easy to navigate. Its sharp design ensures a professional touch. Compatible with PowerPoint, Keynote, and Google Slides.


20 diapositivas
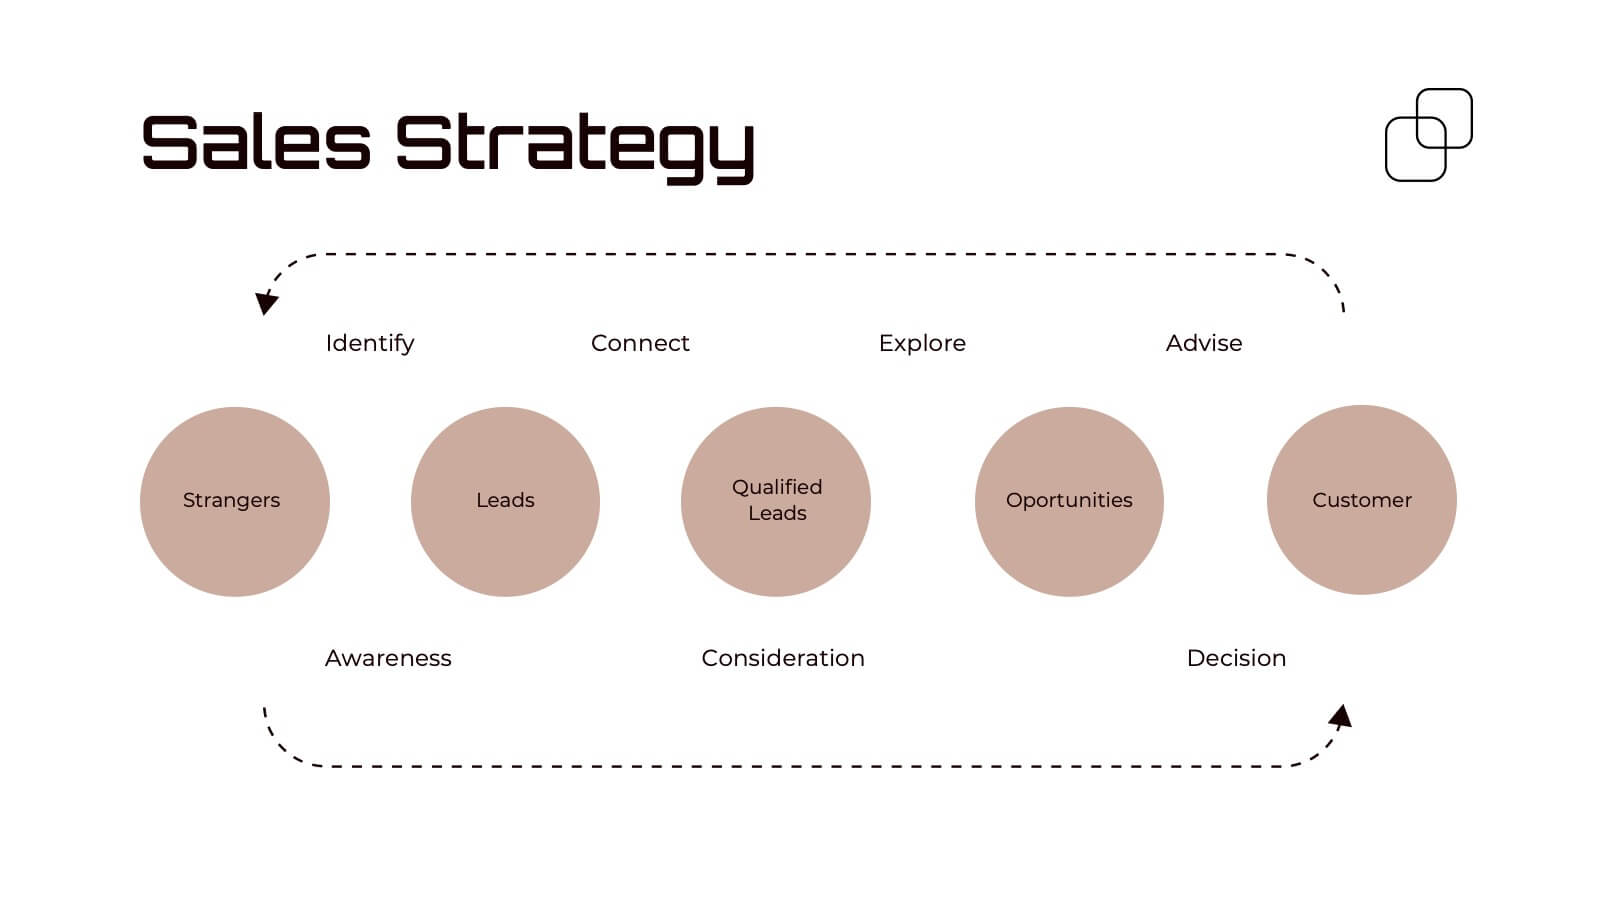
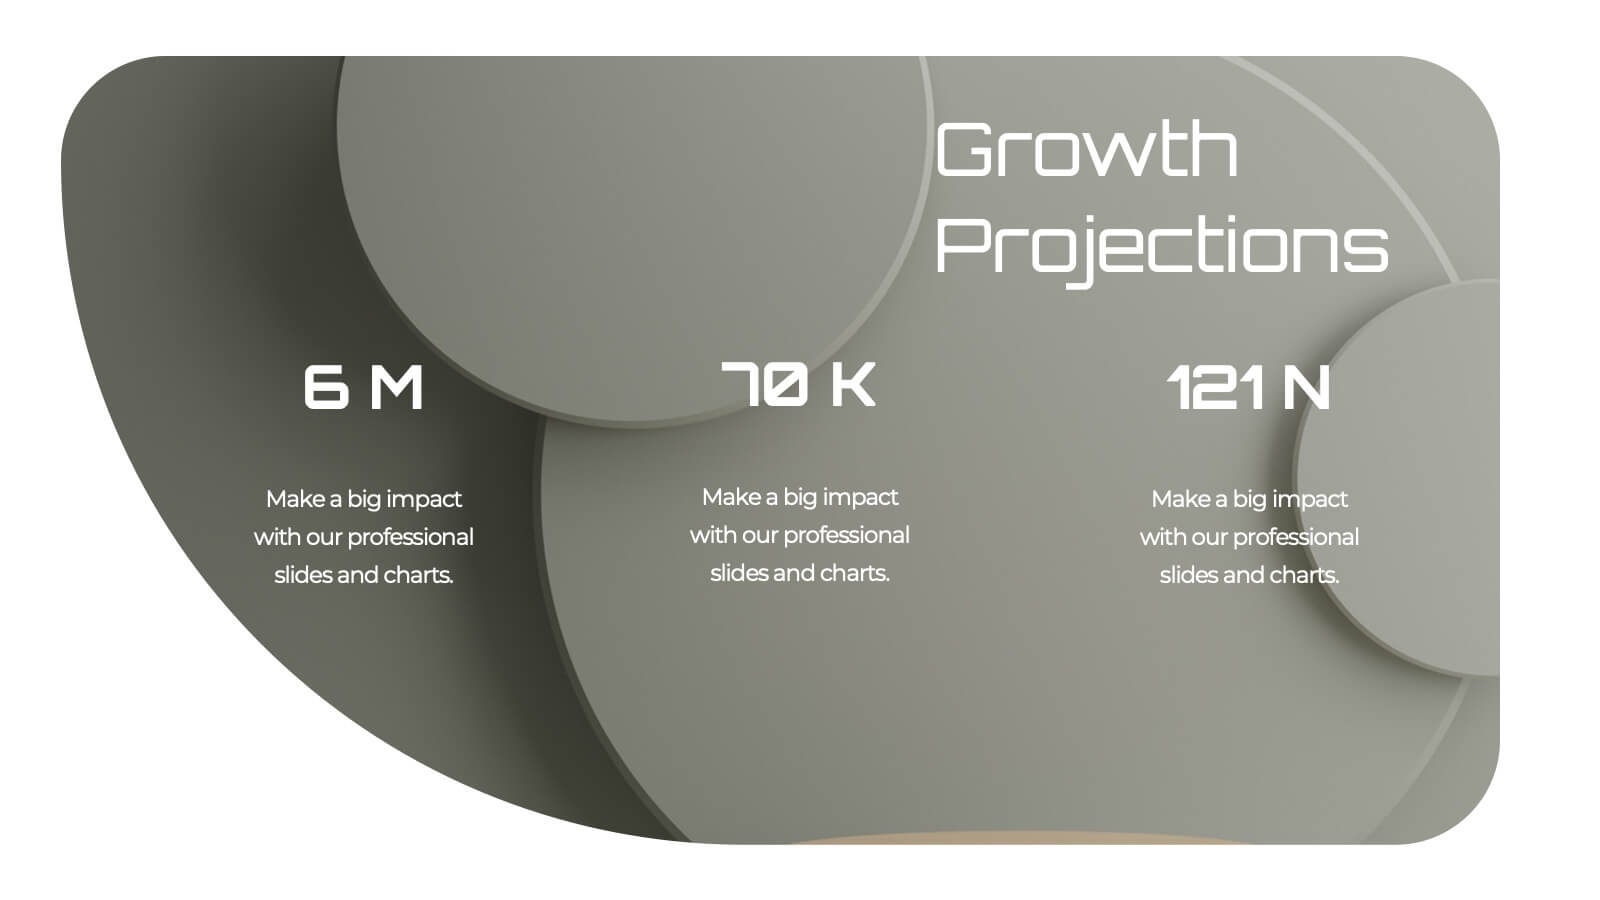
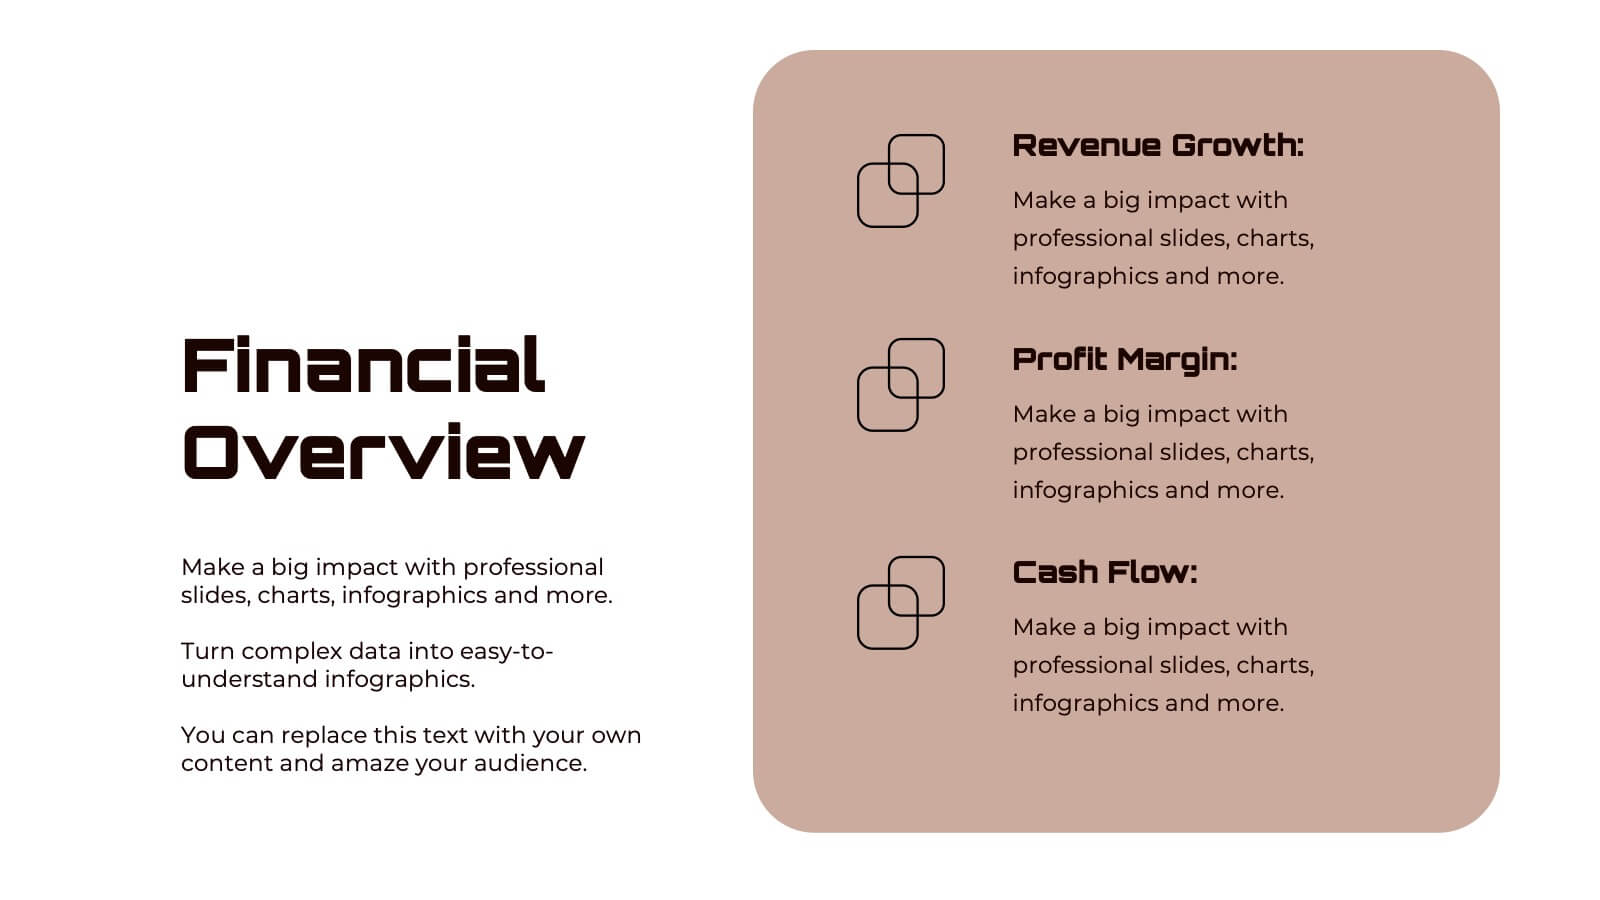
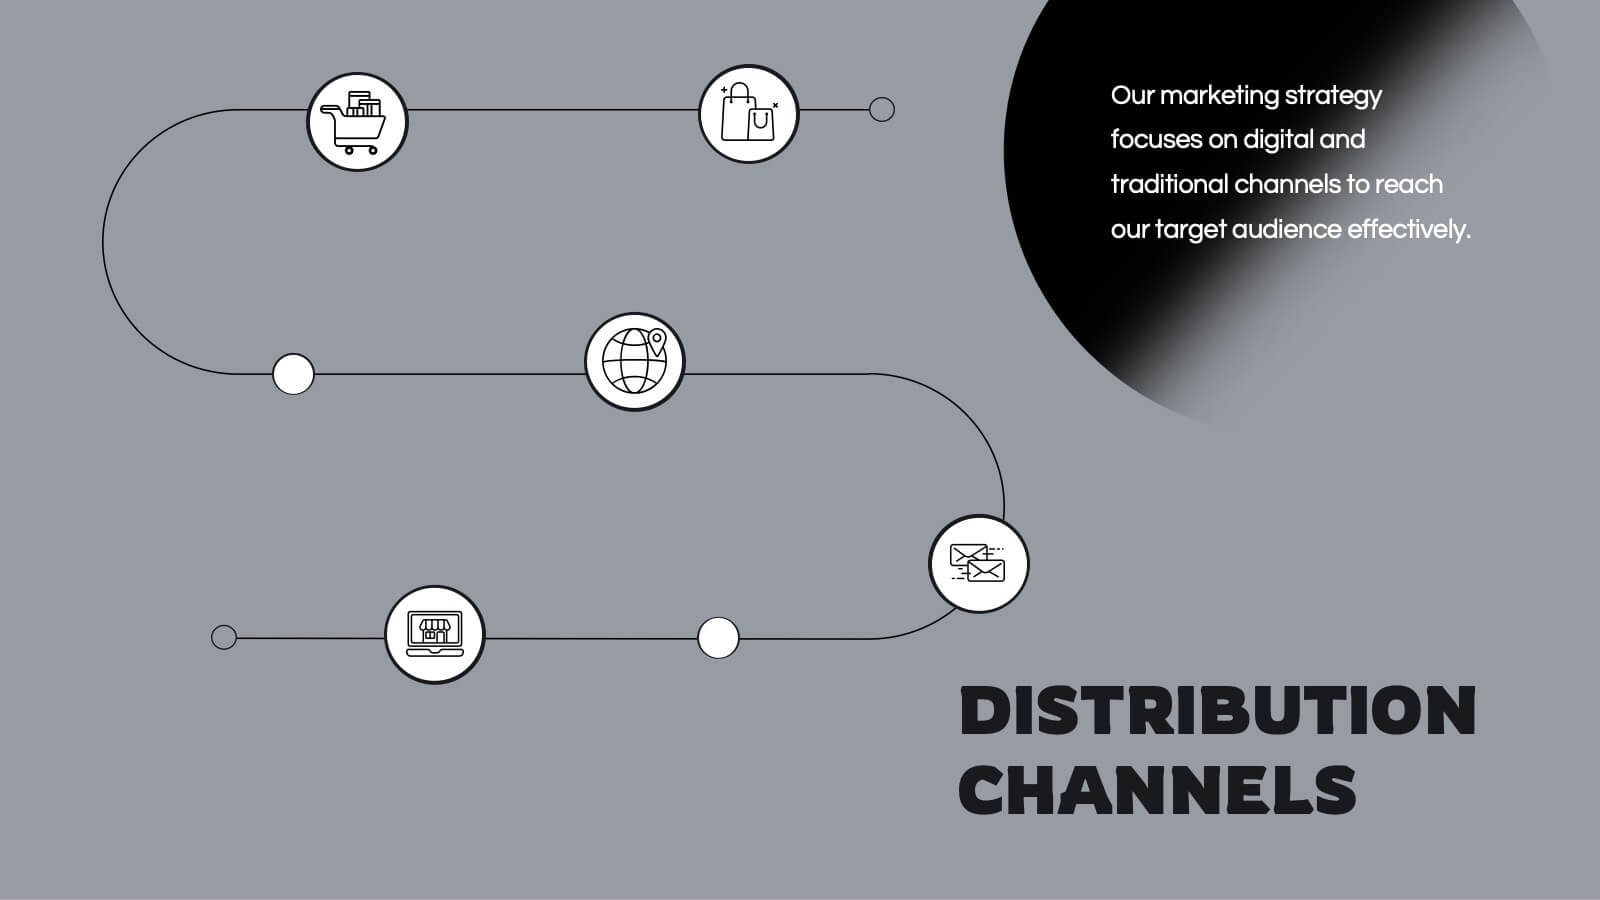
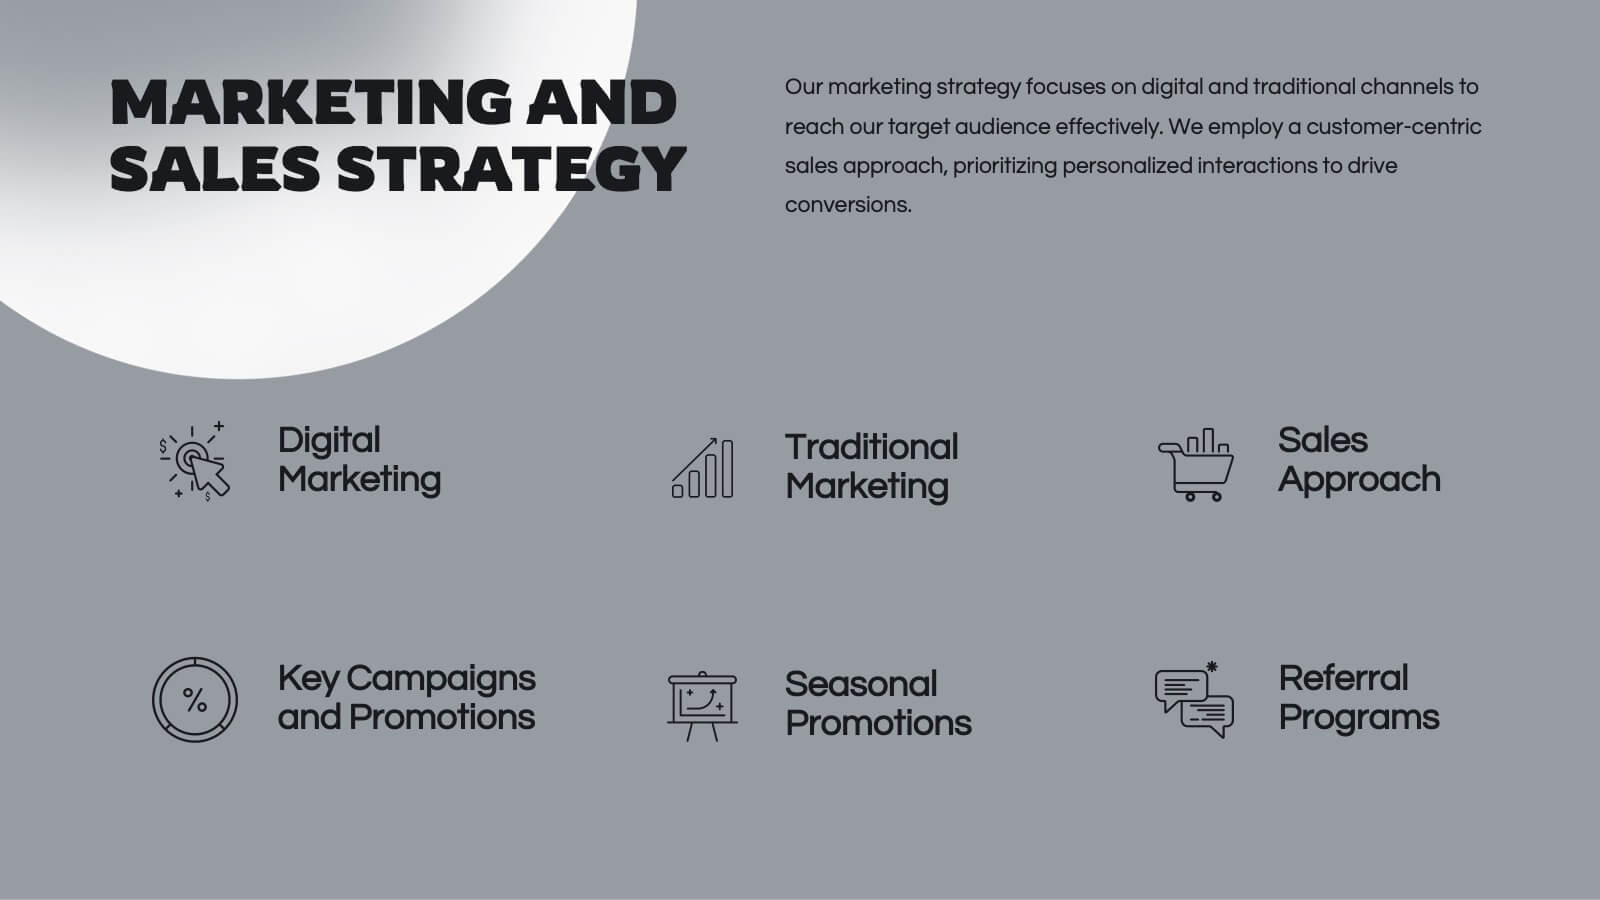
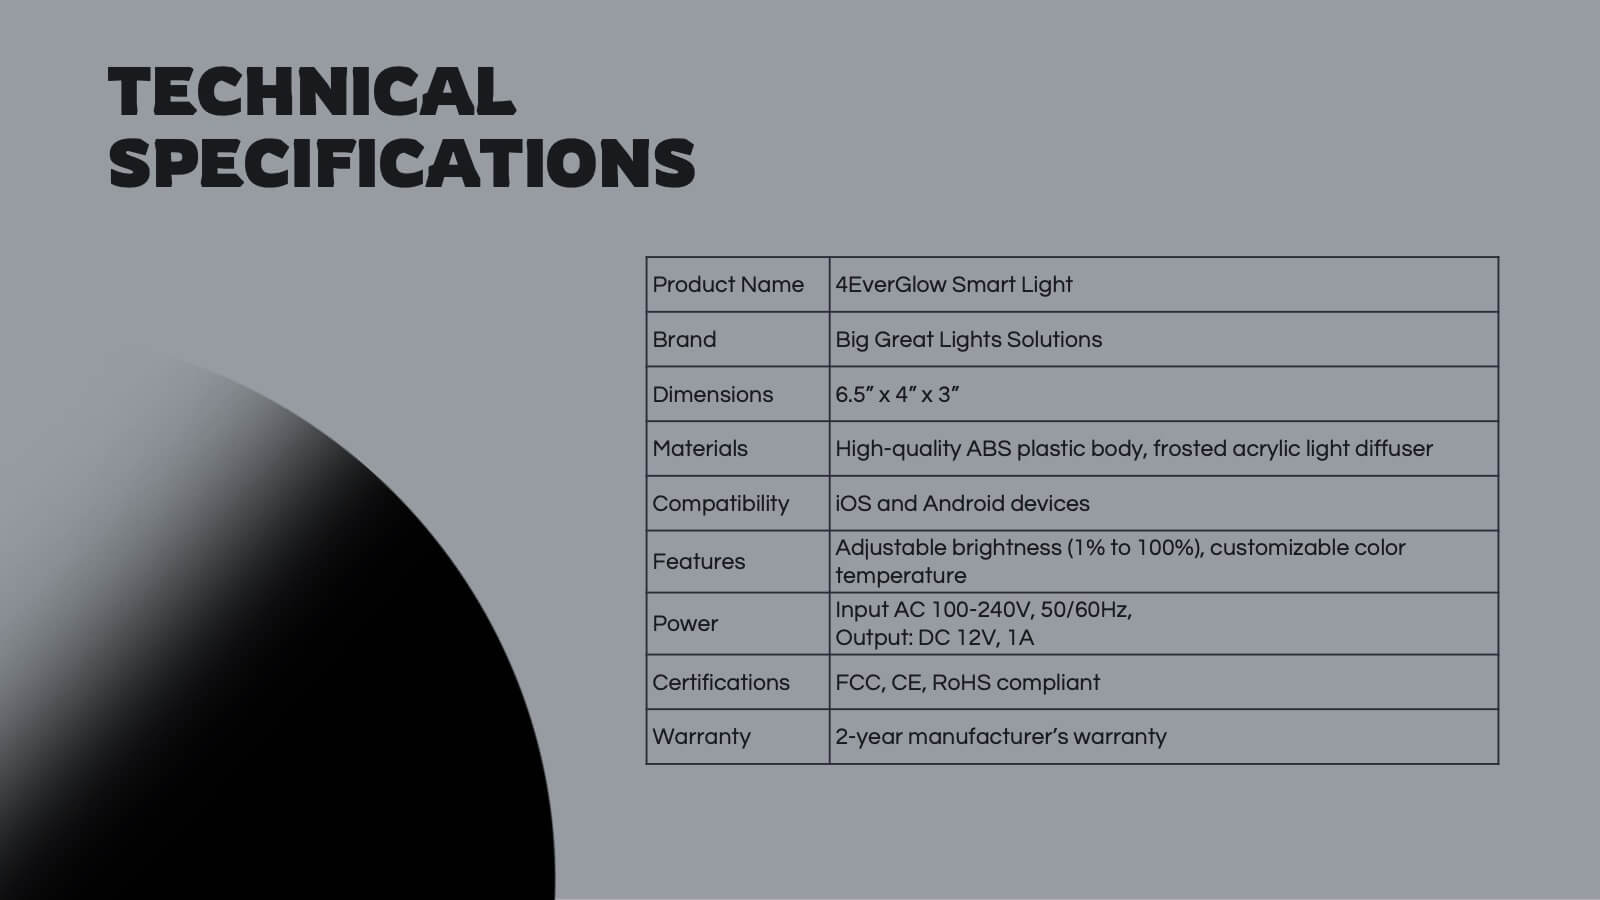
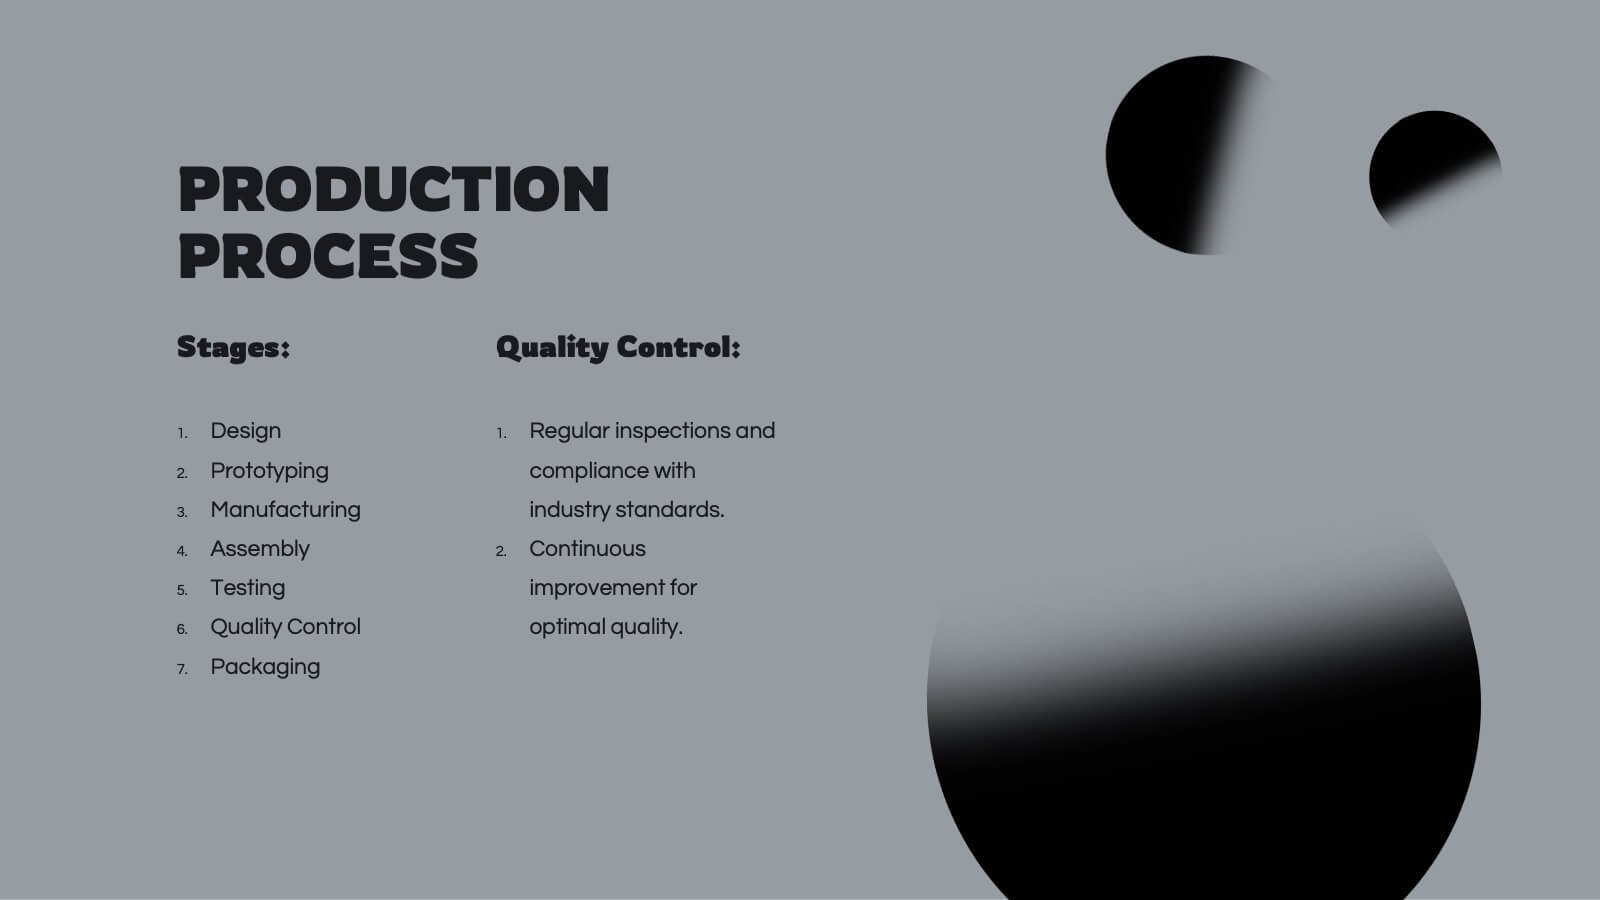
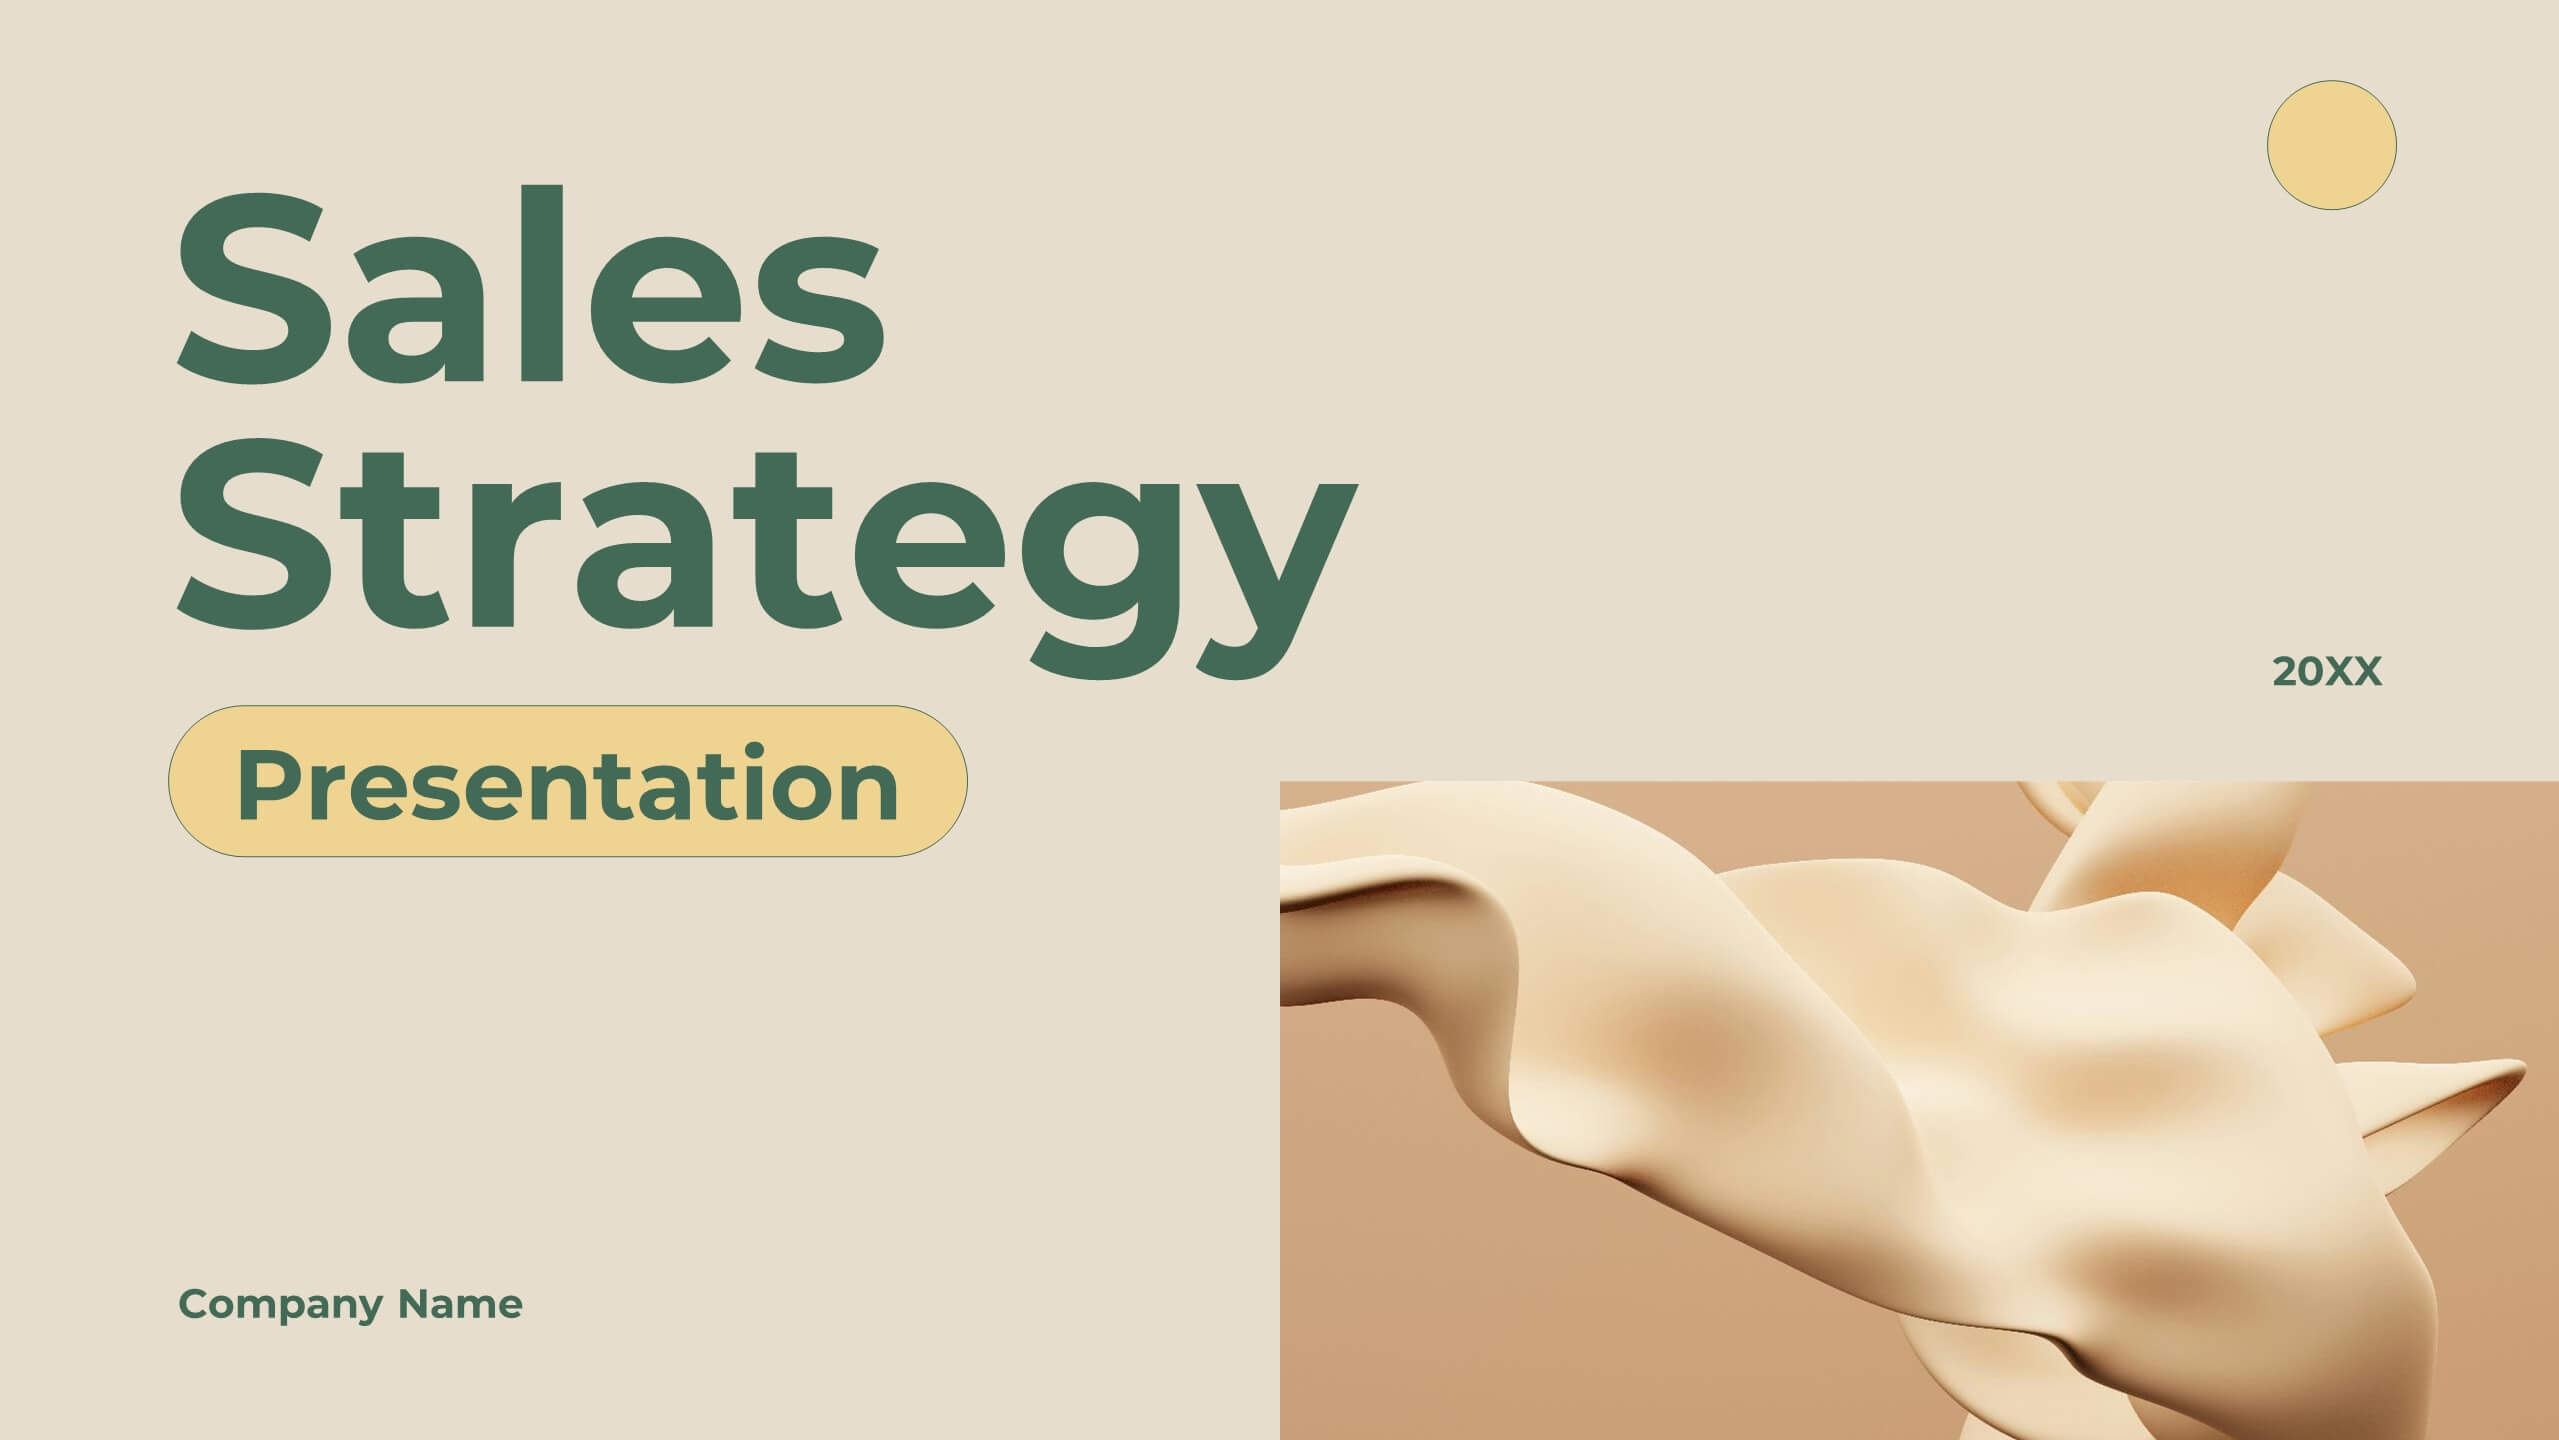
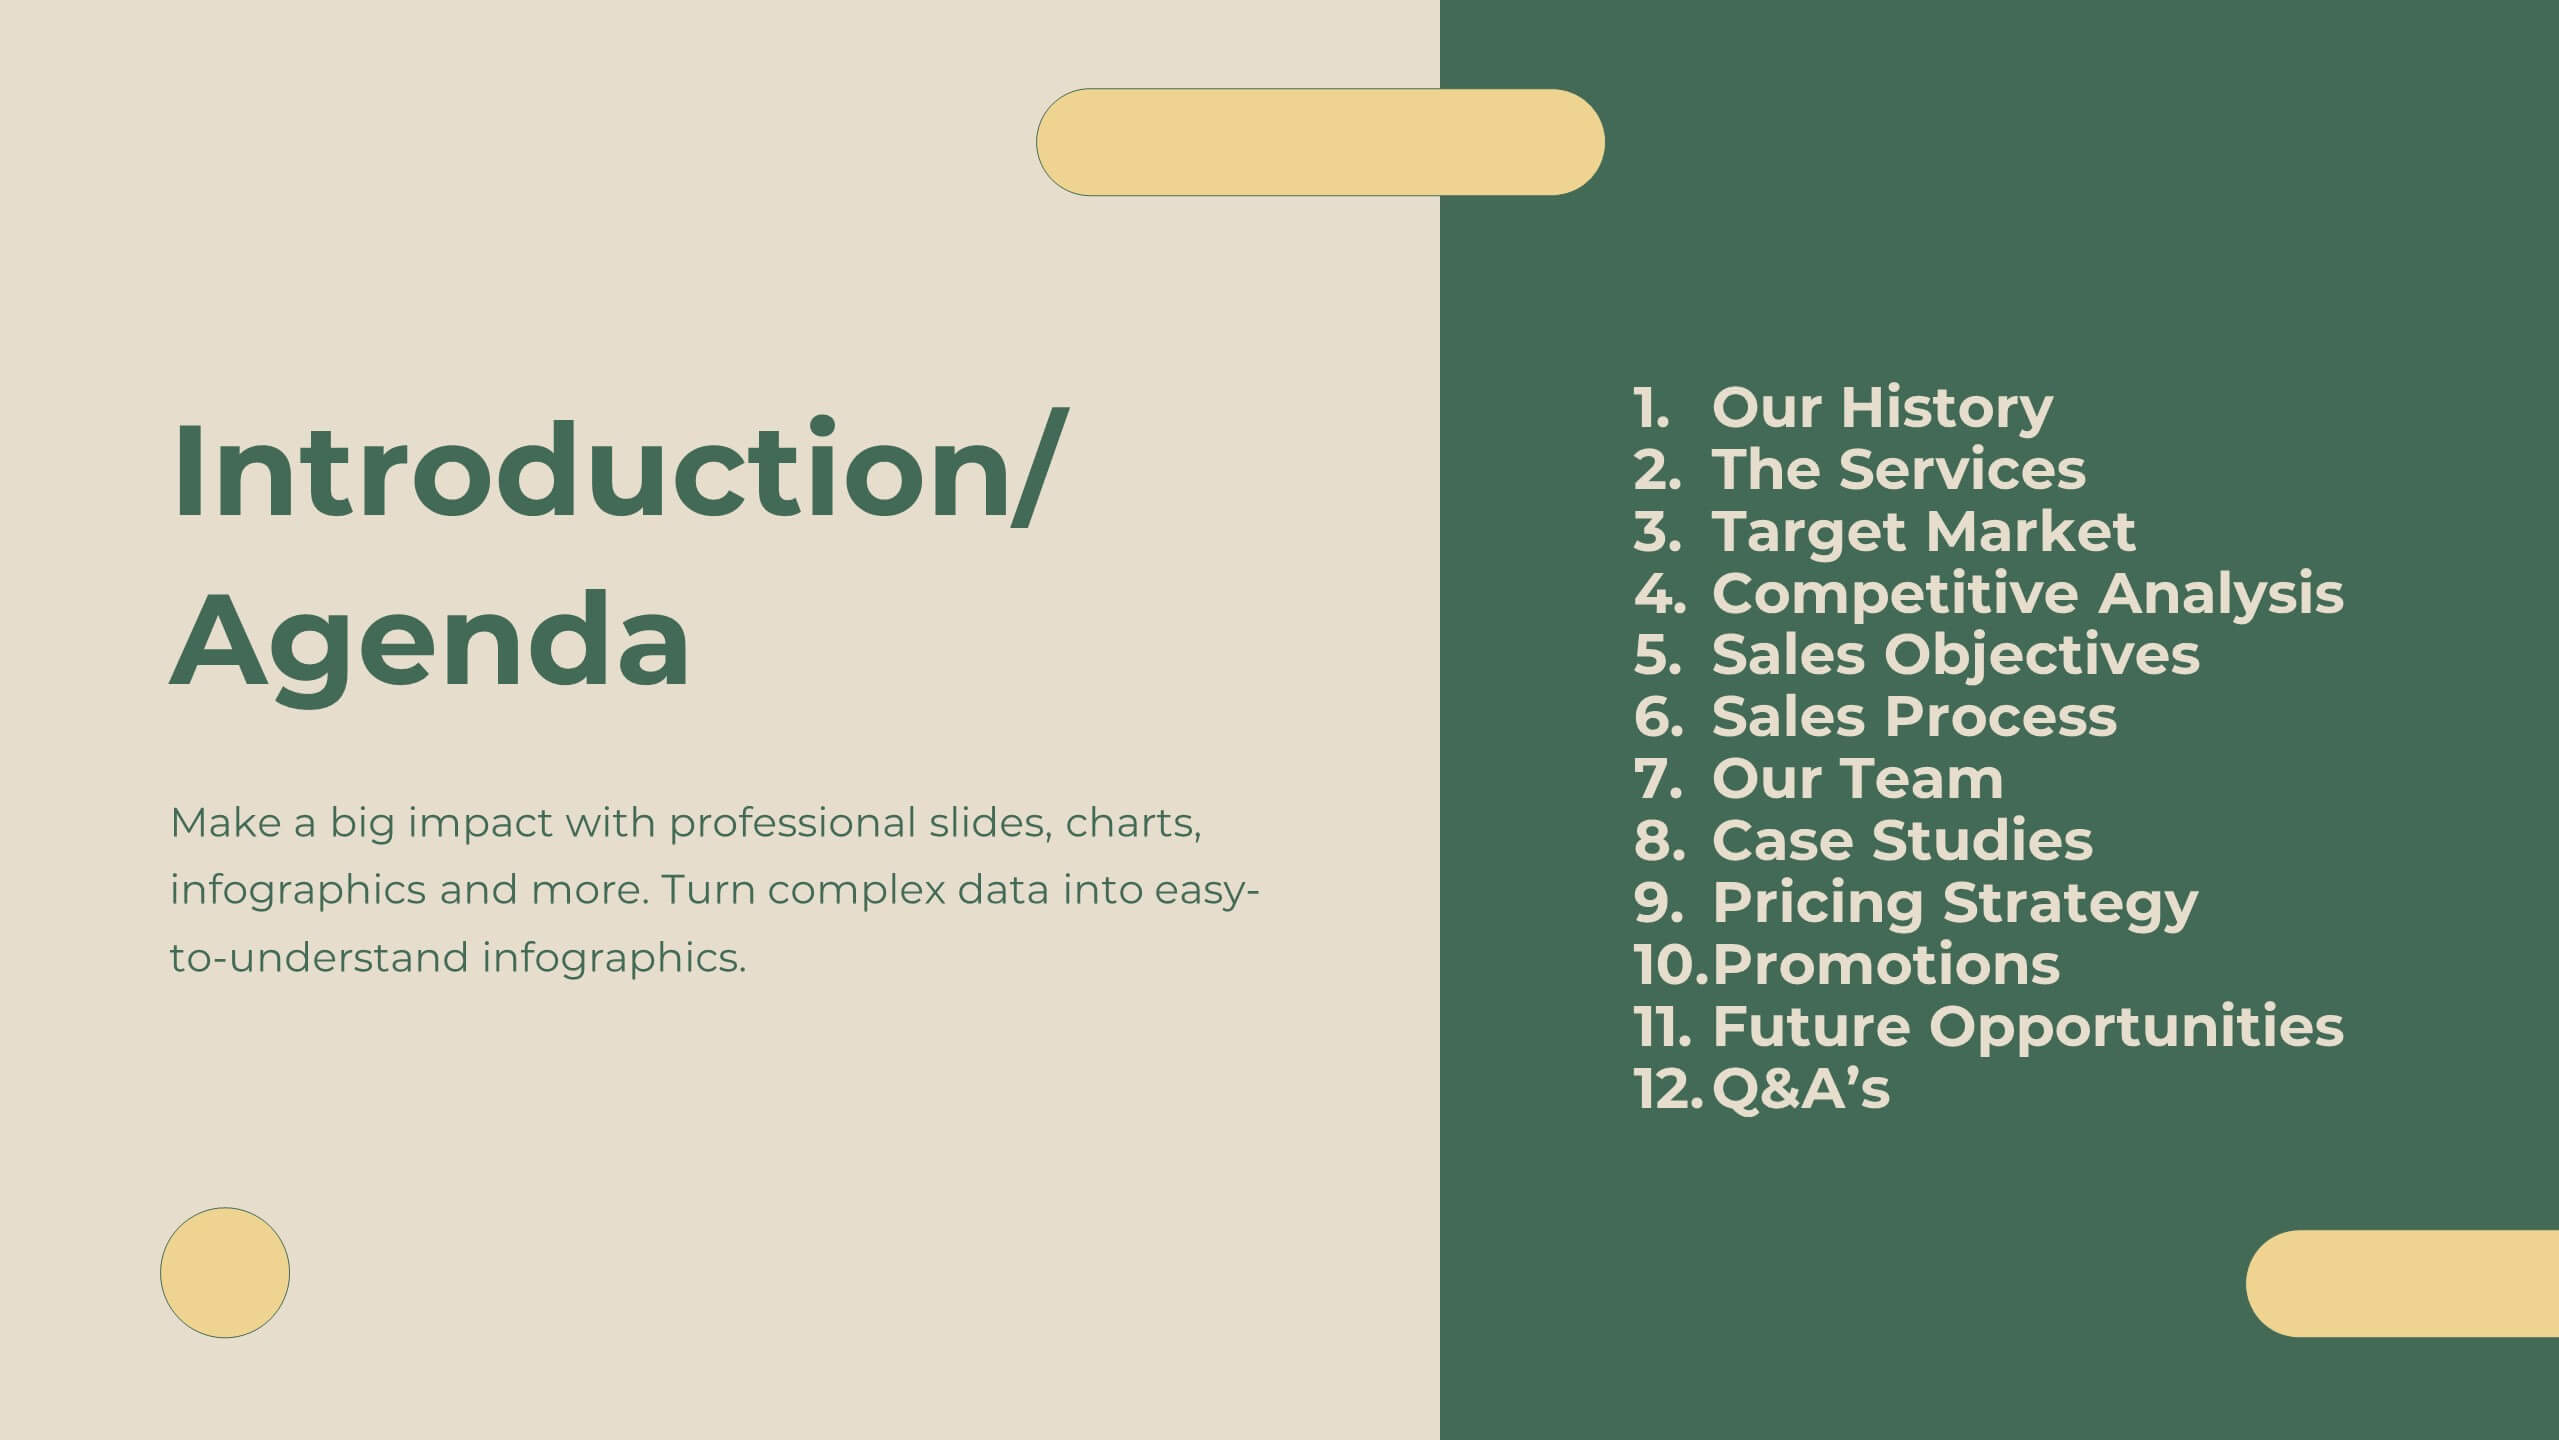
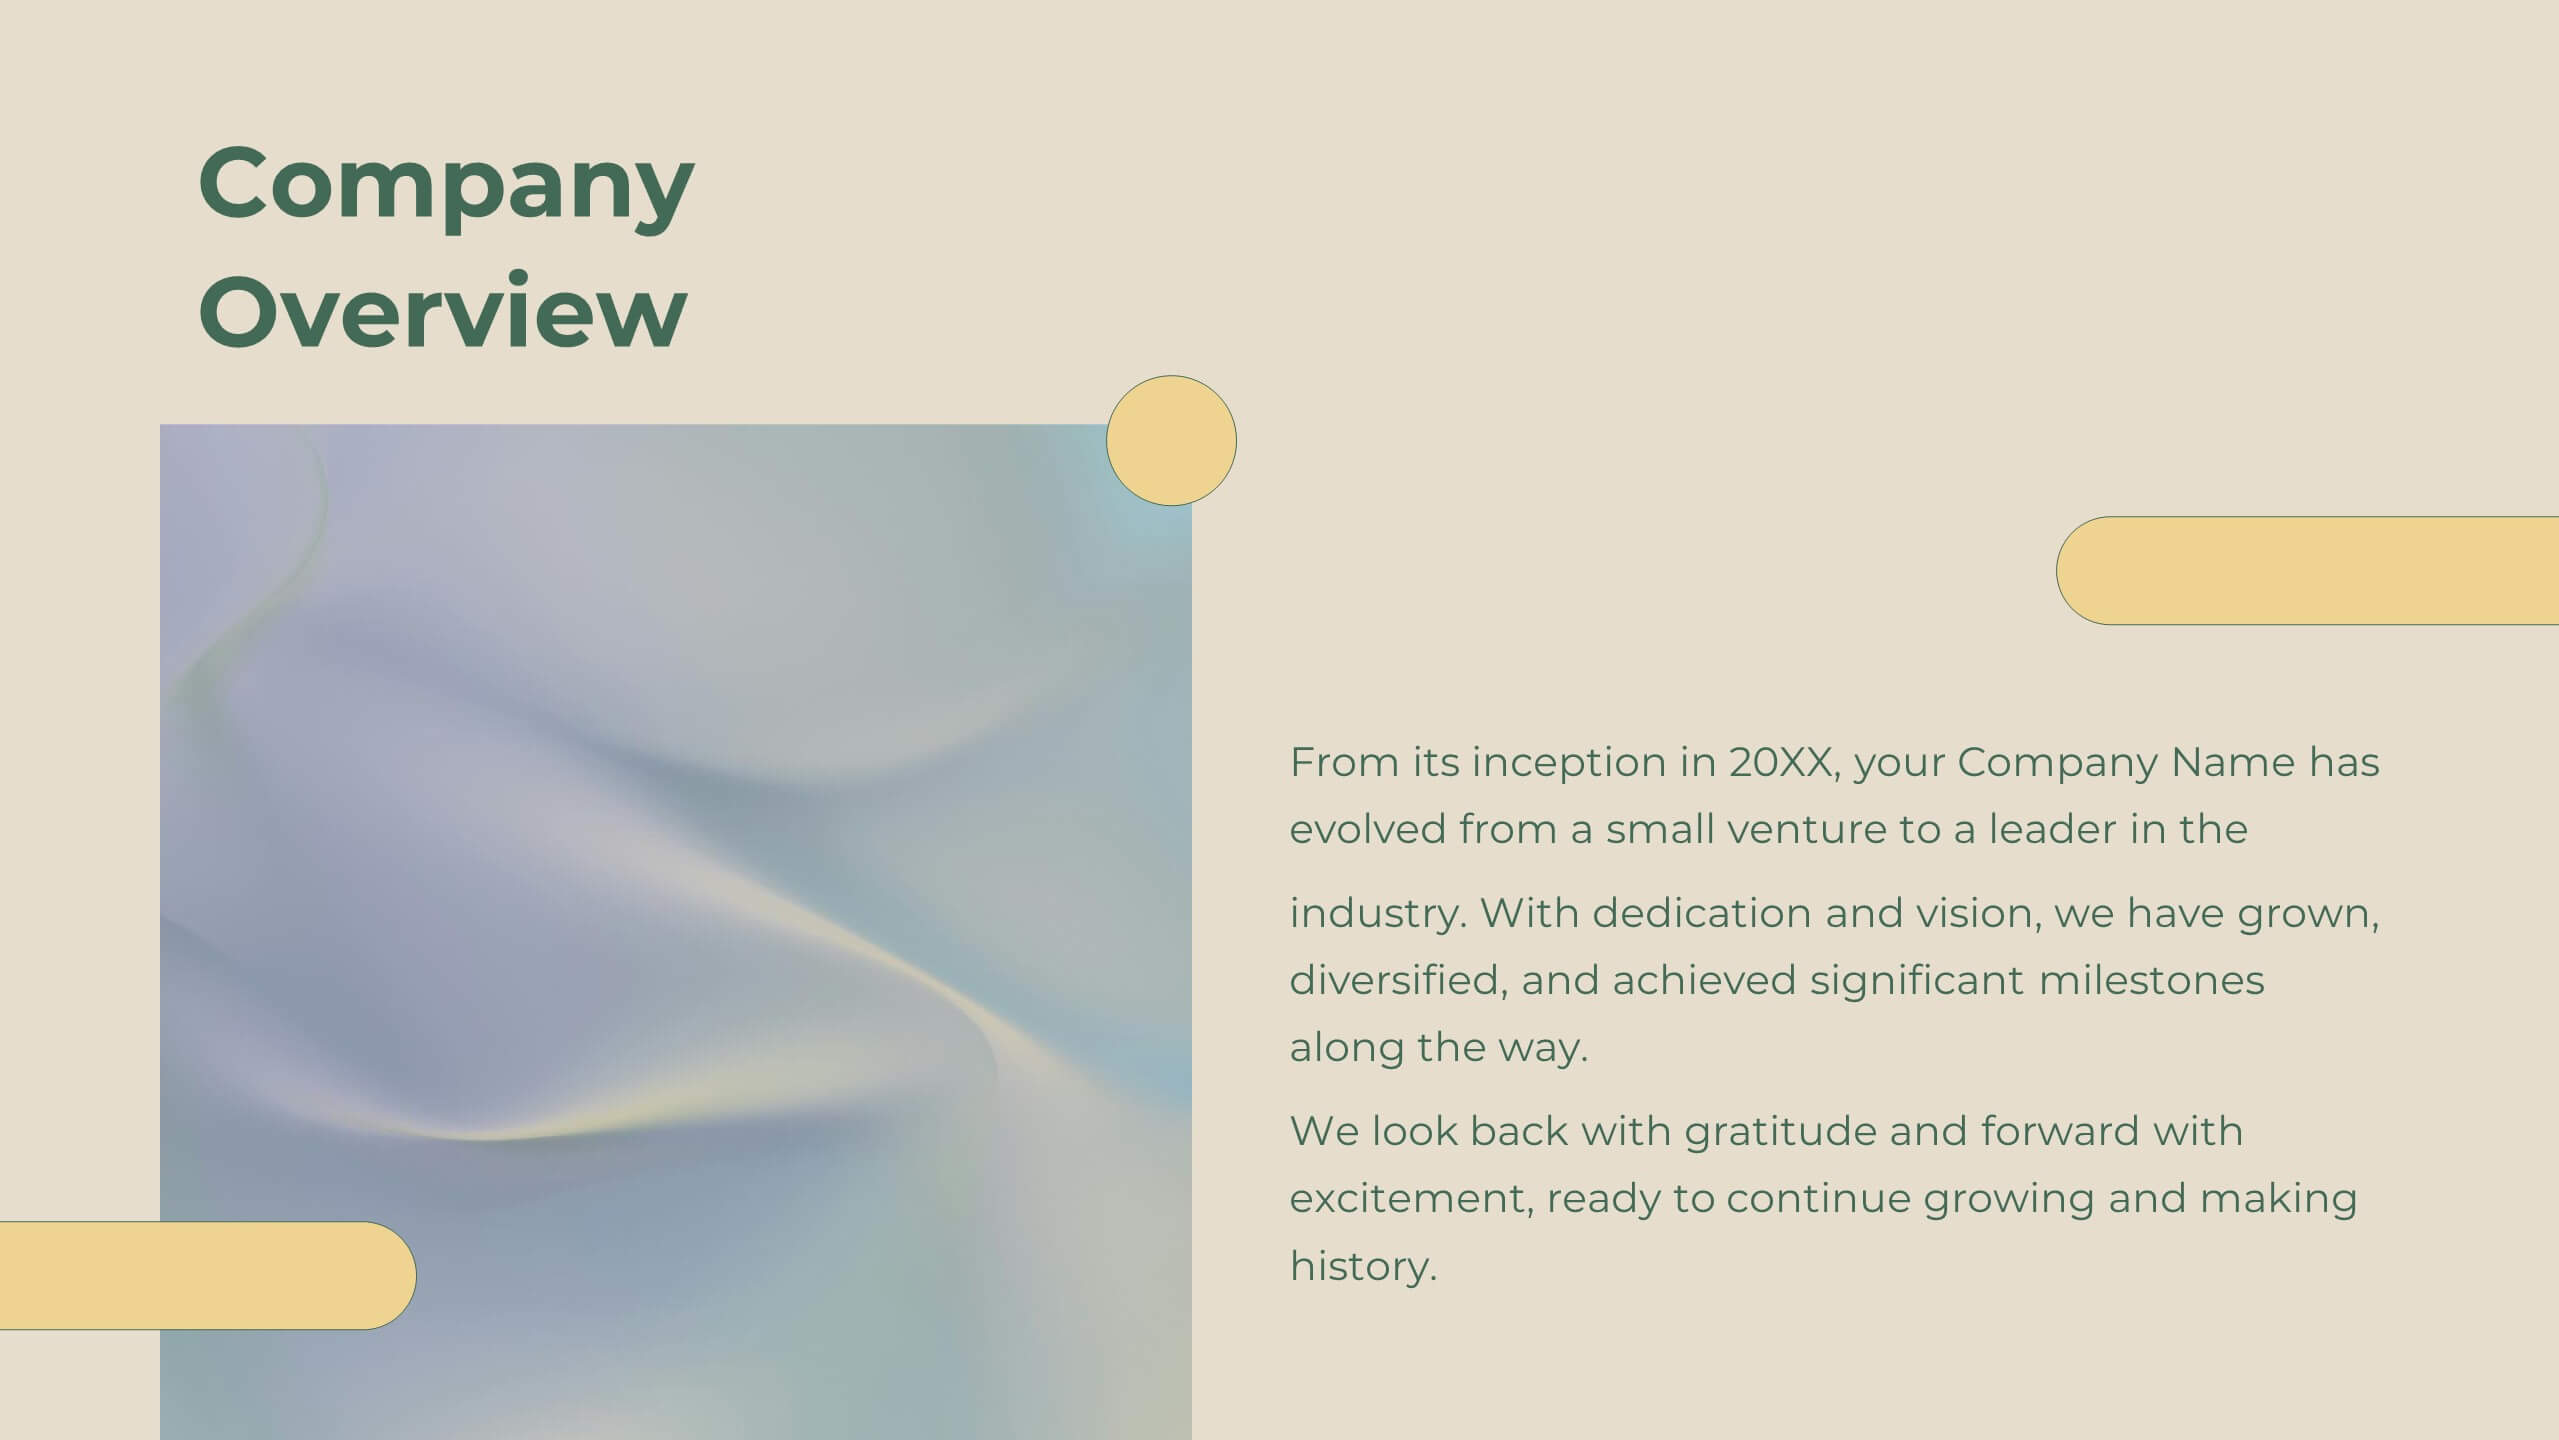
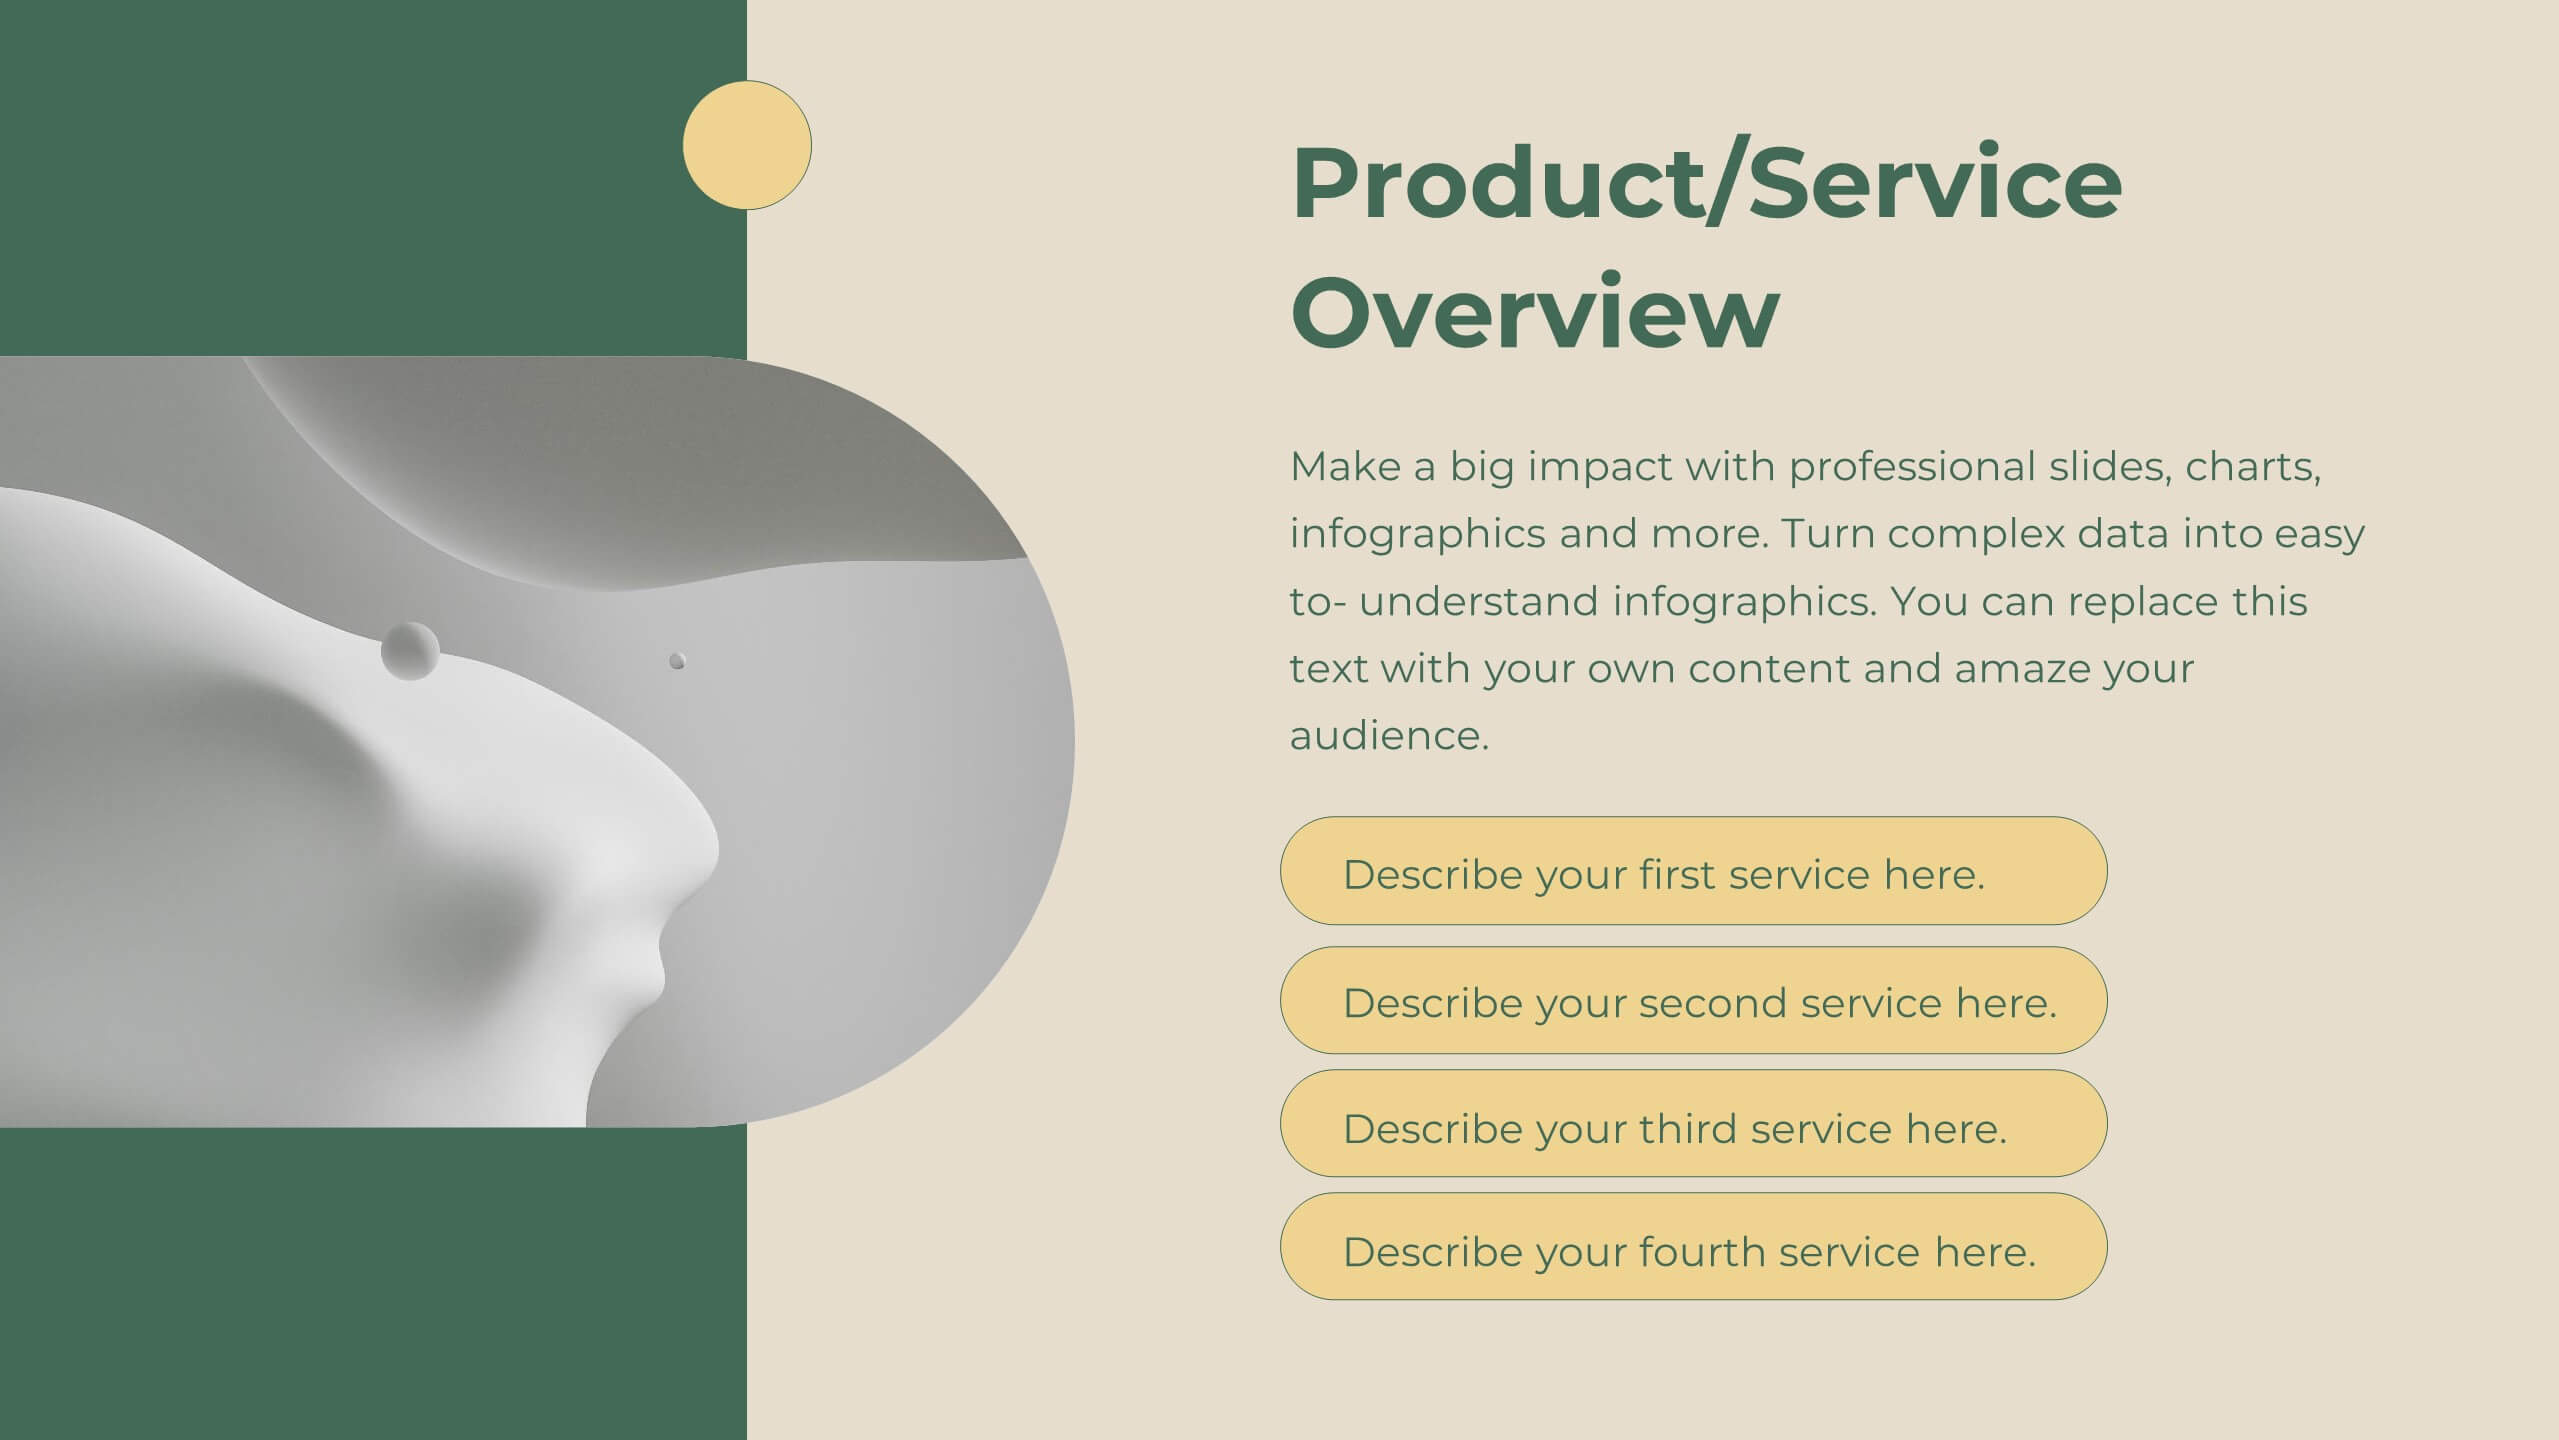
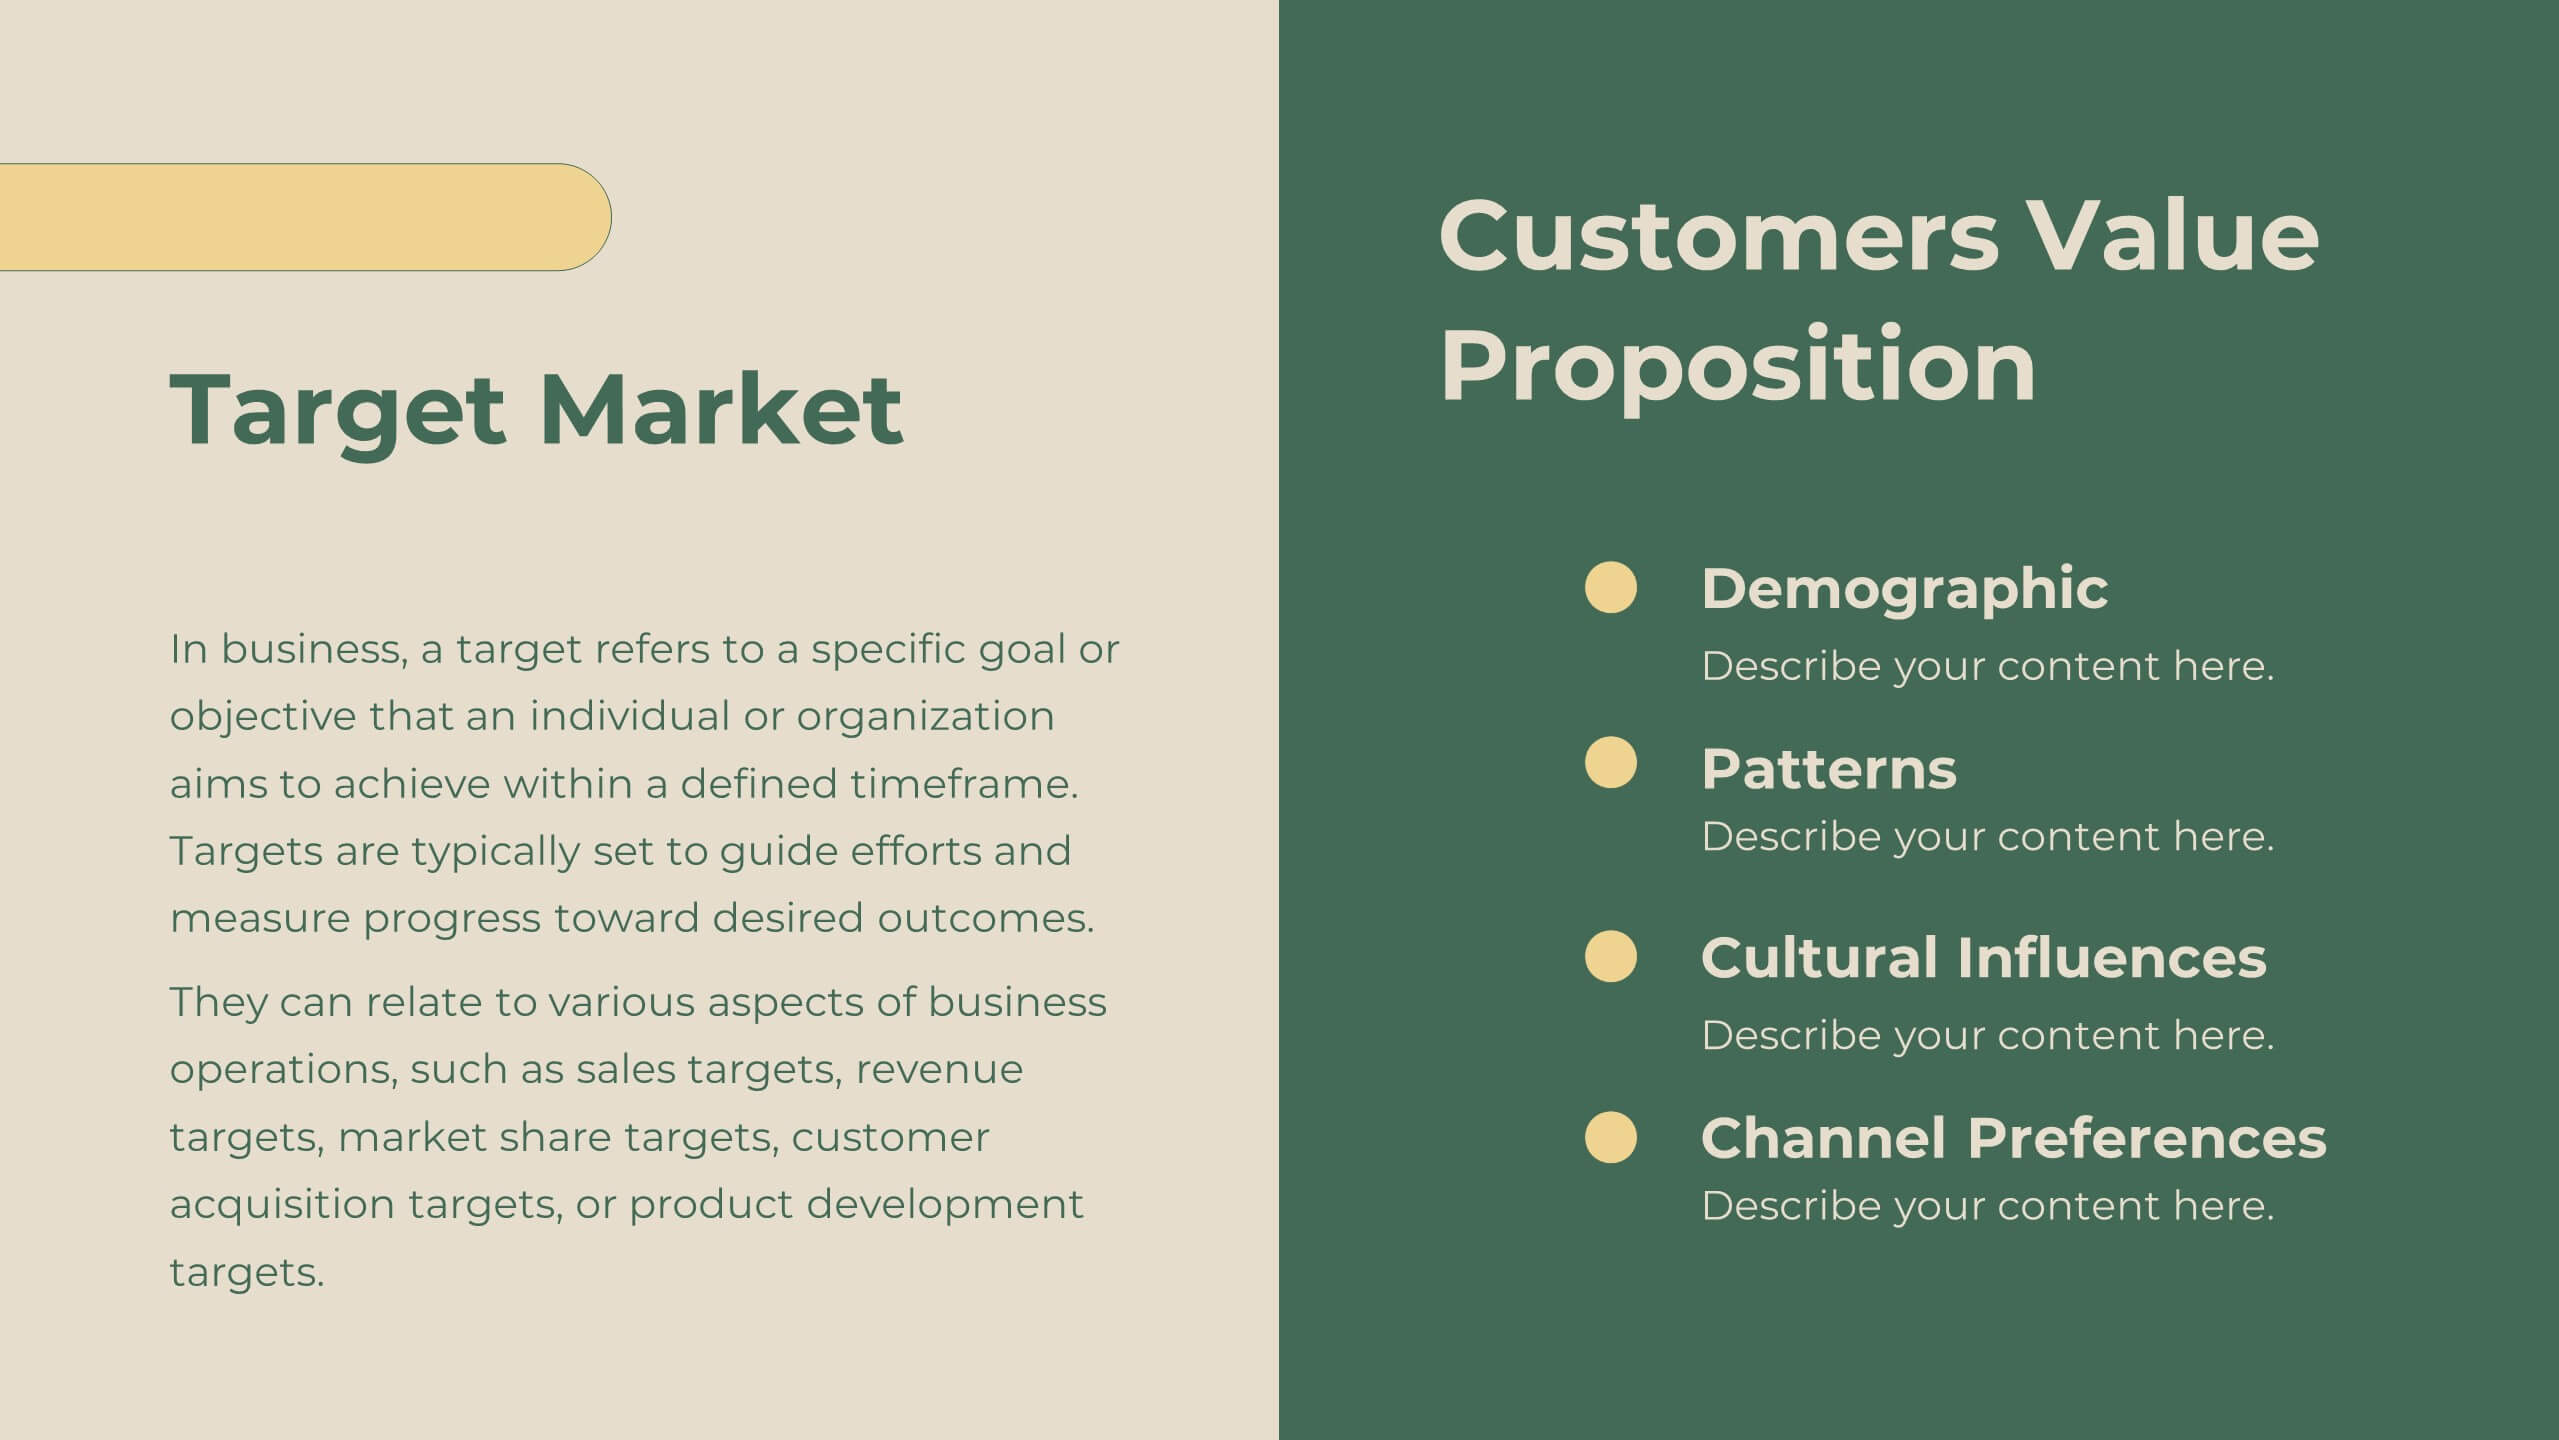
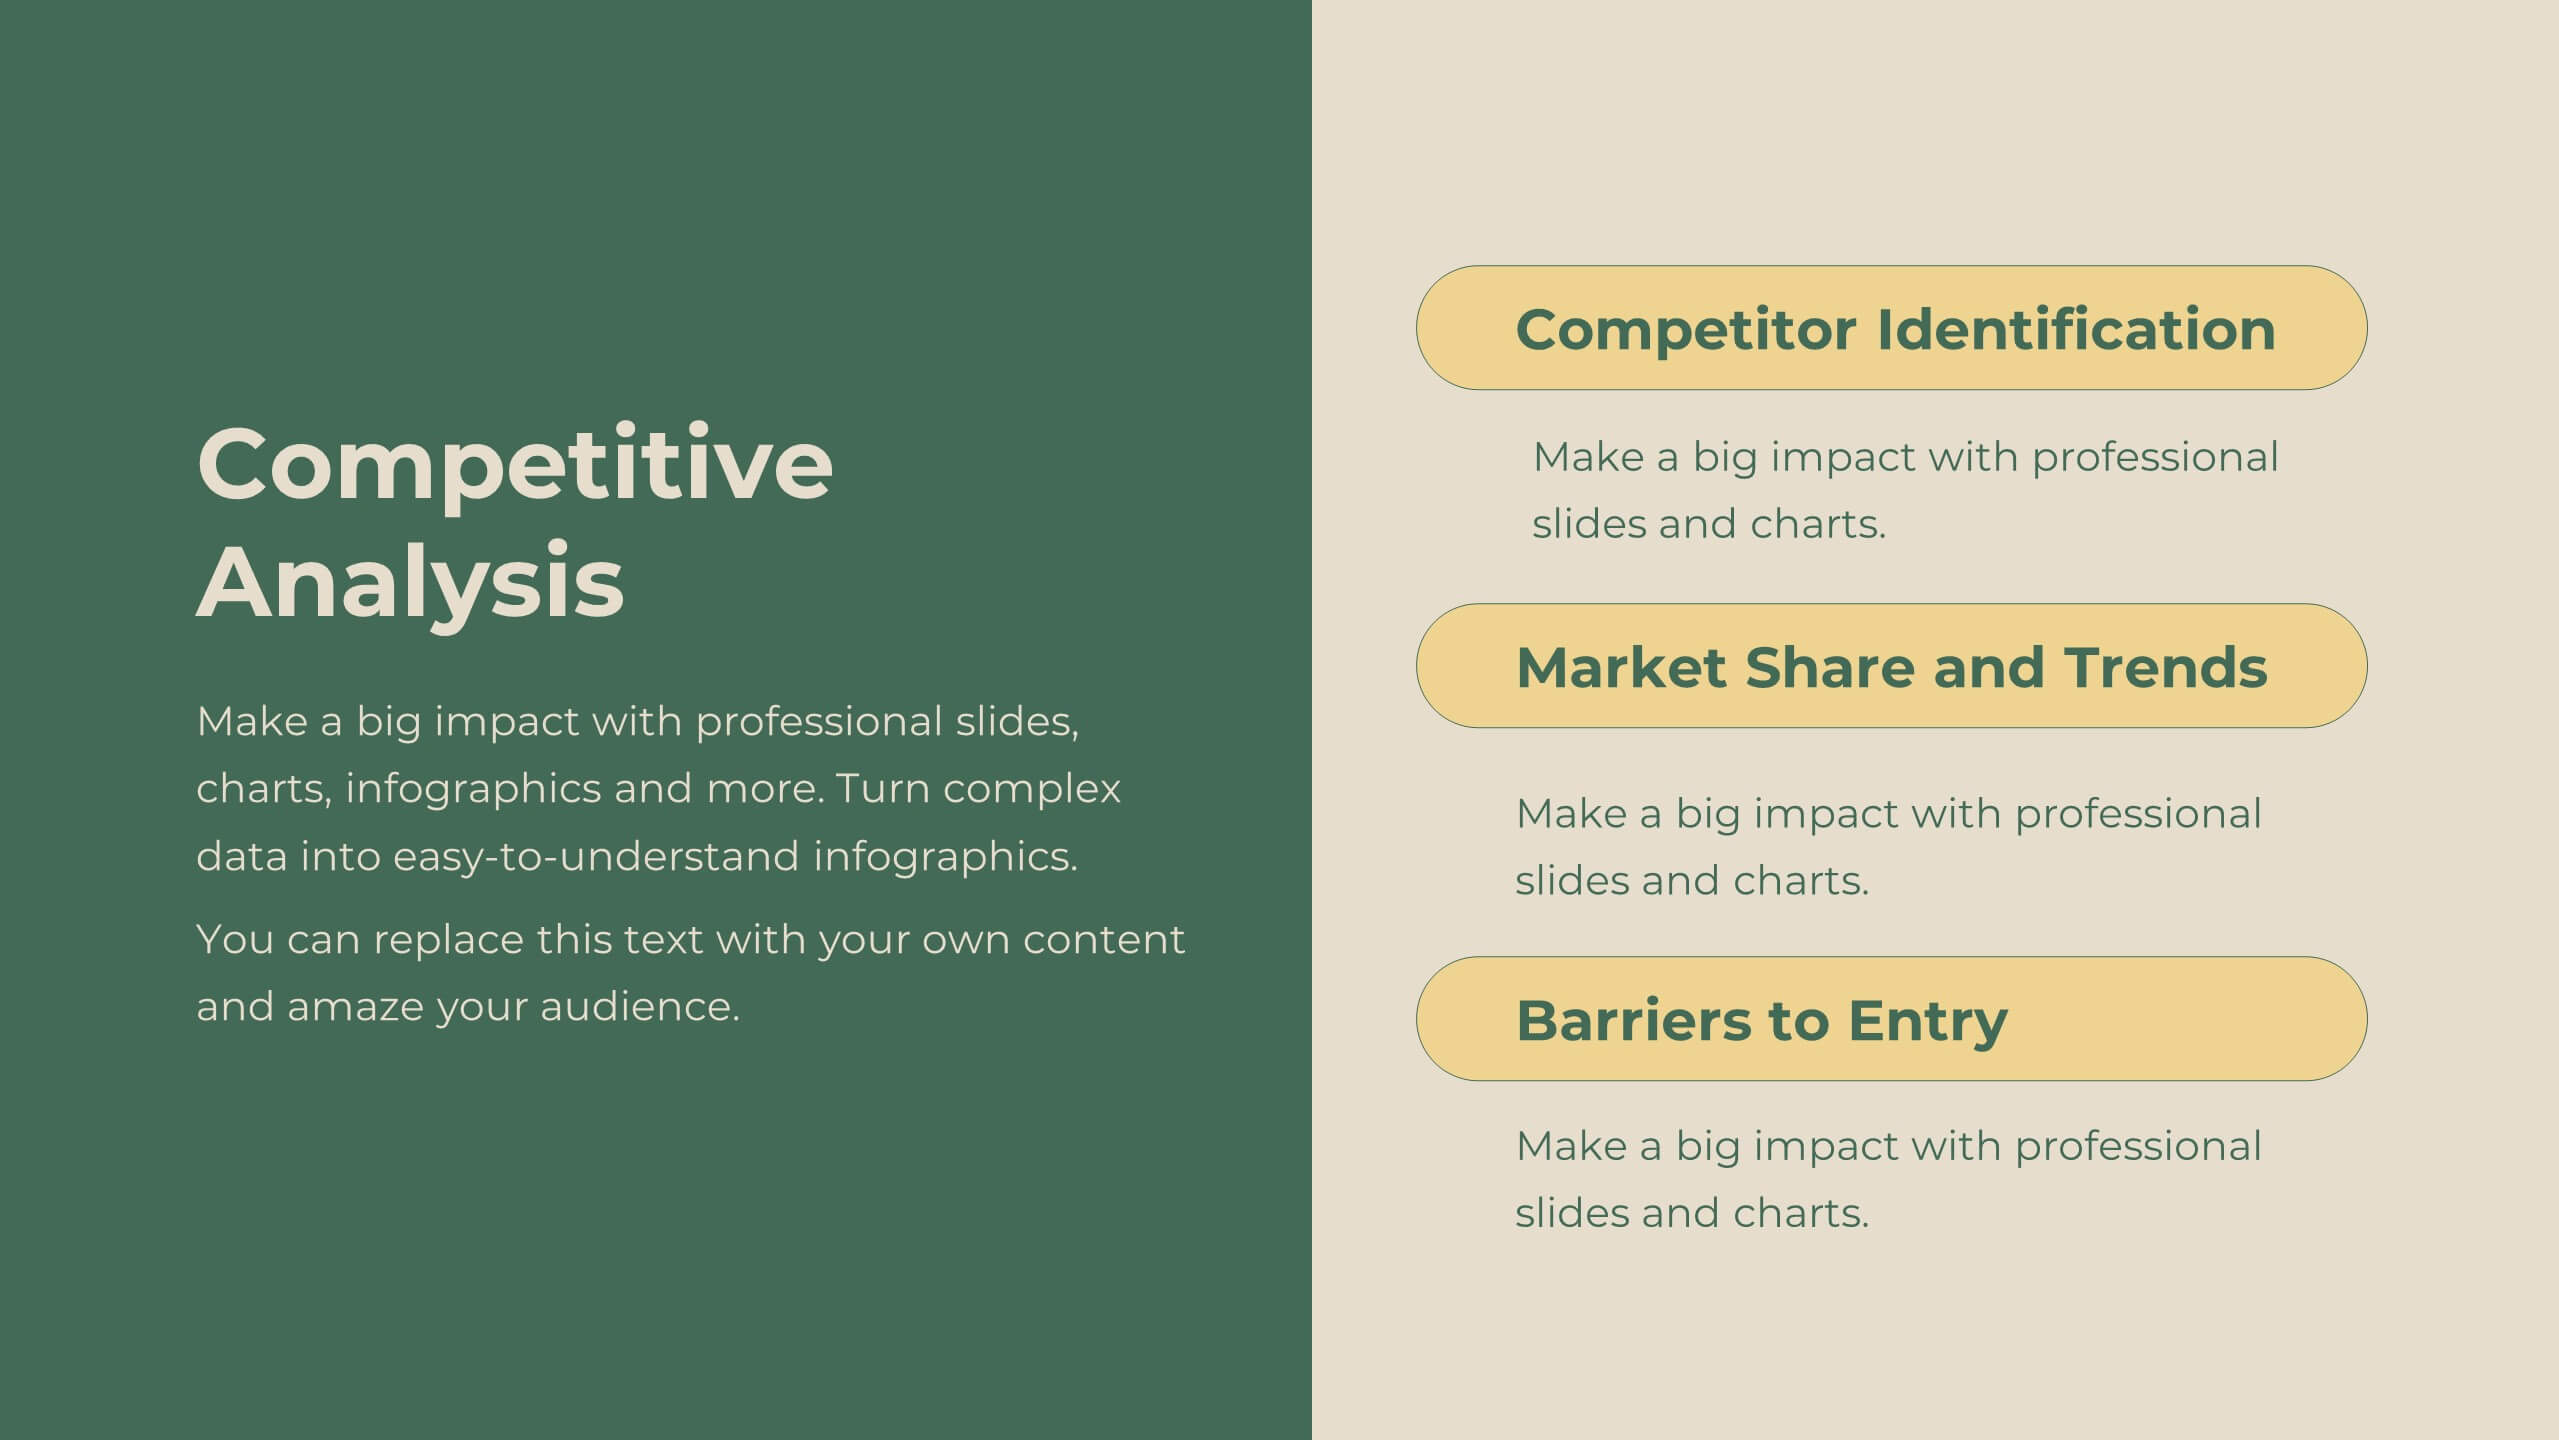
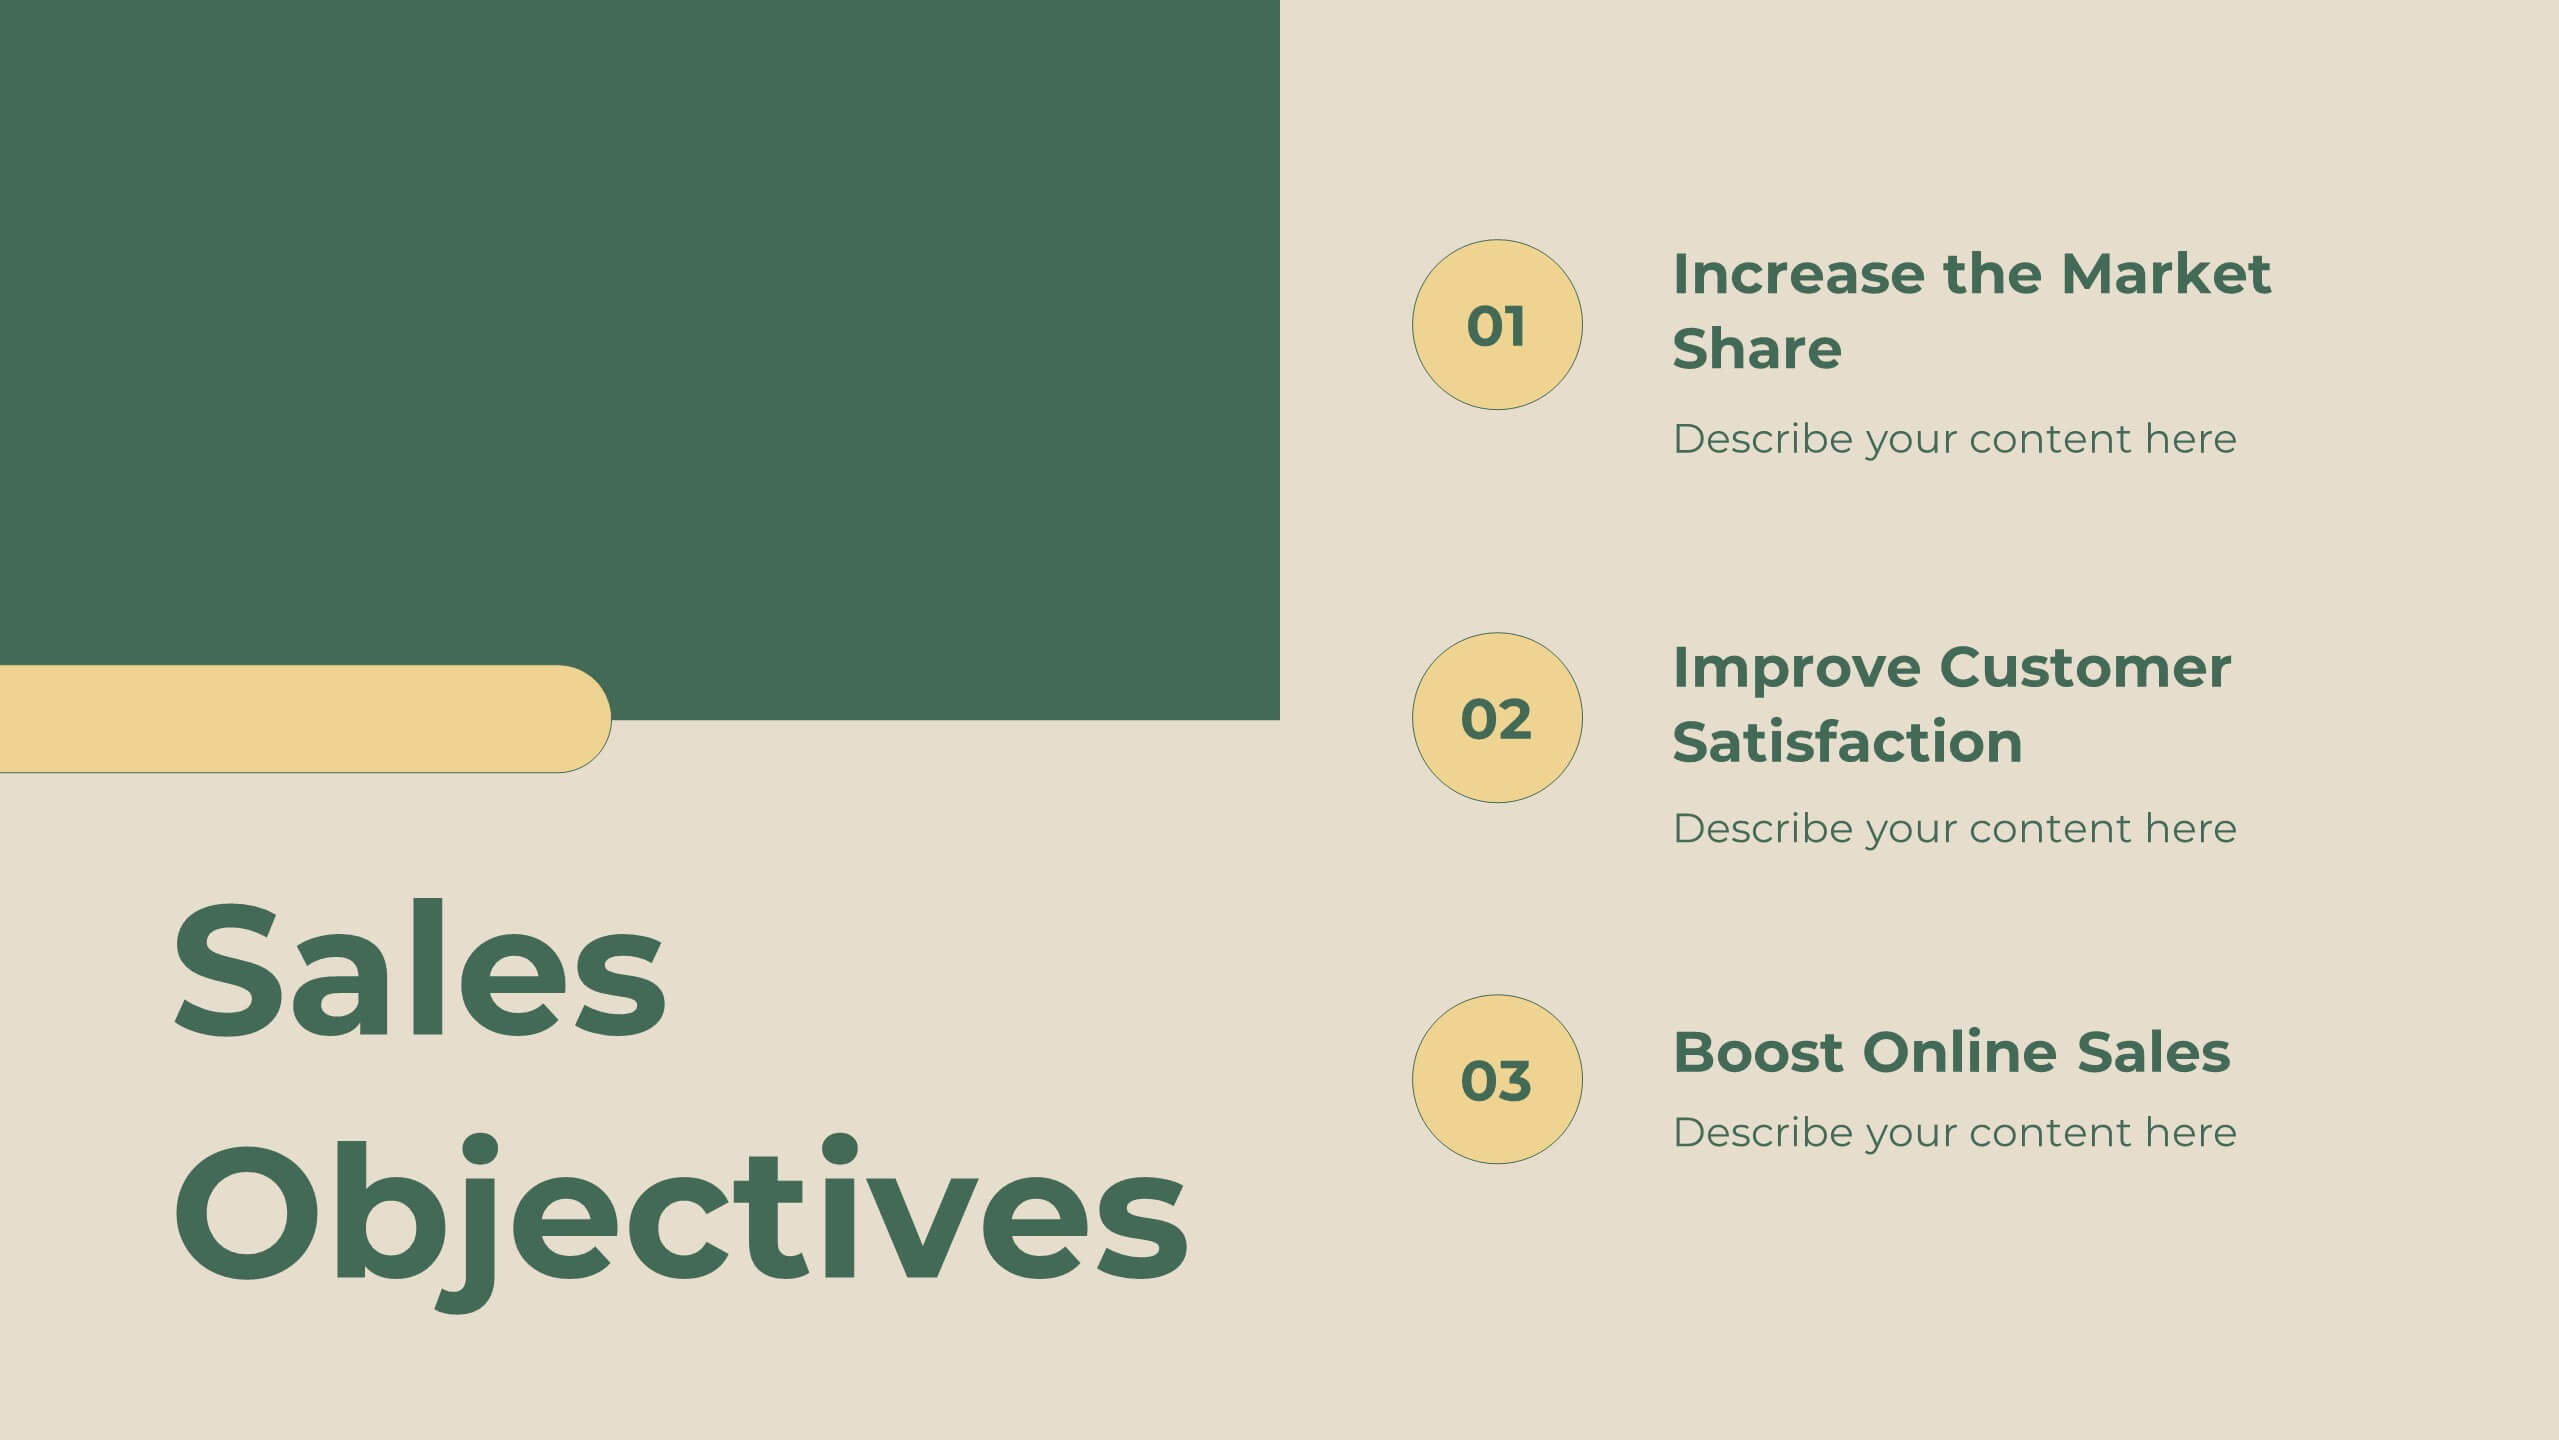
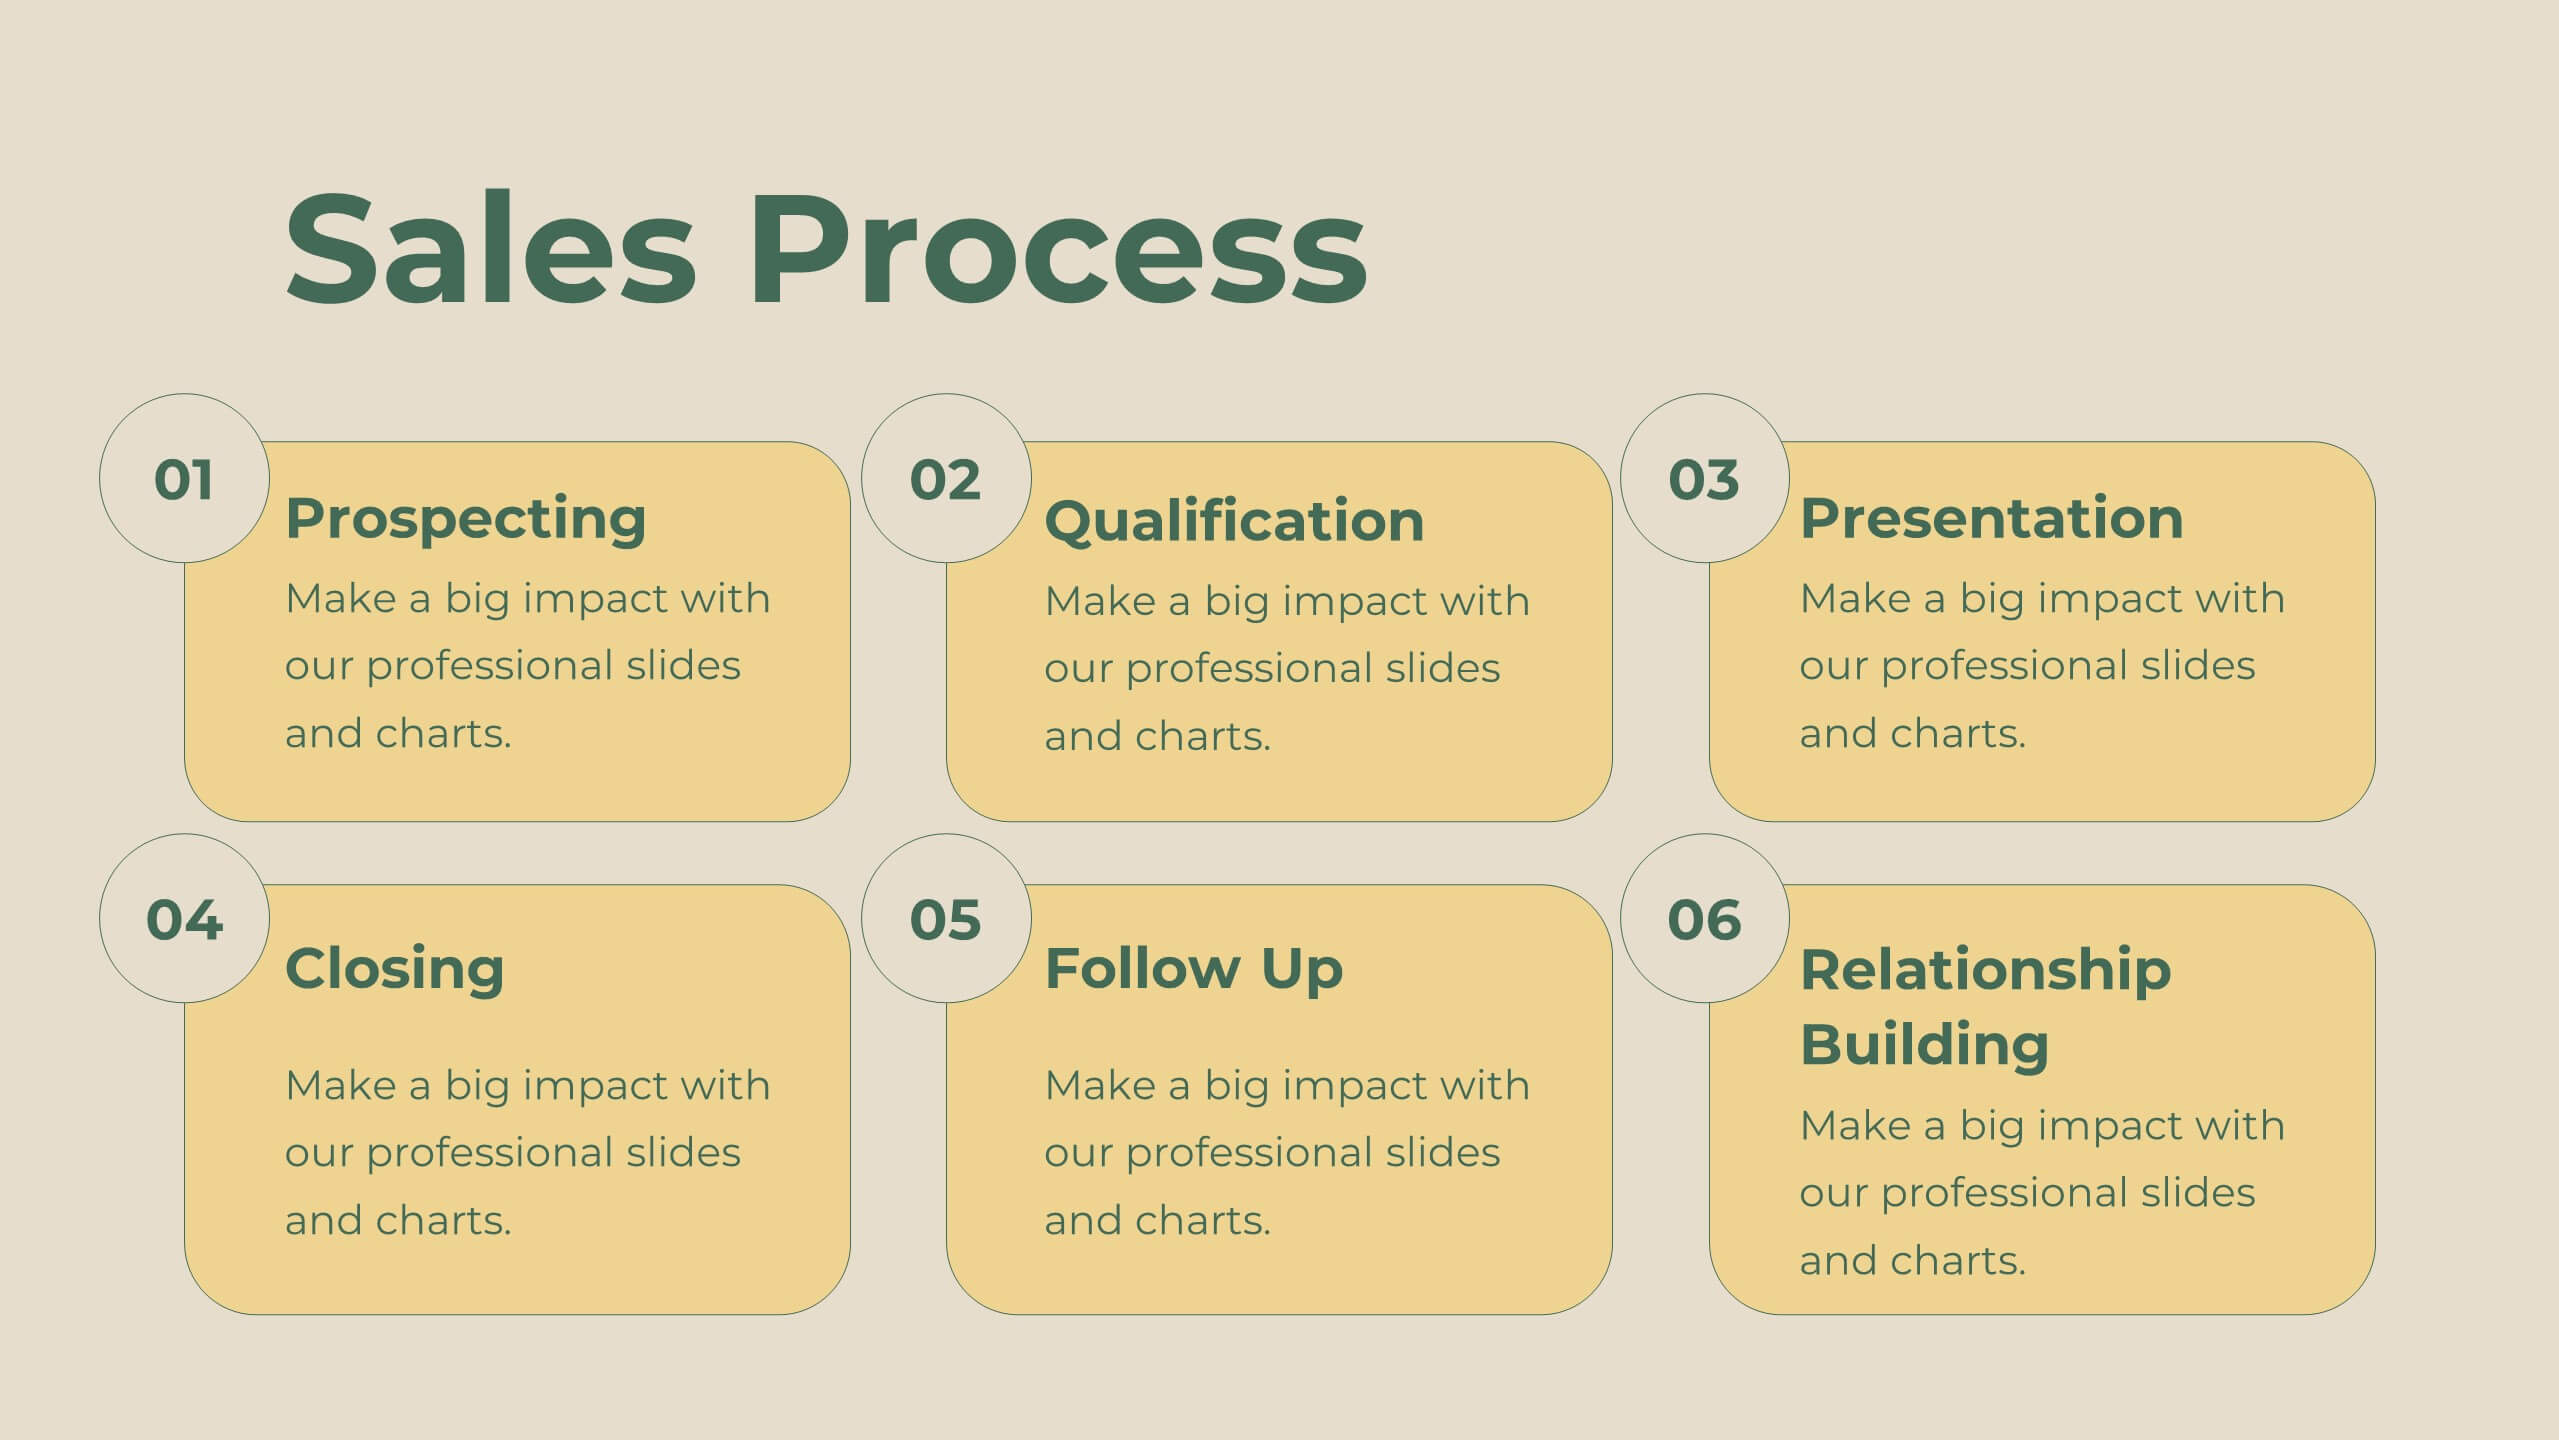
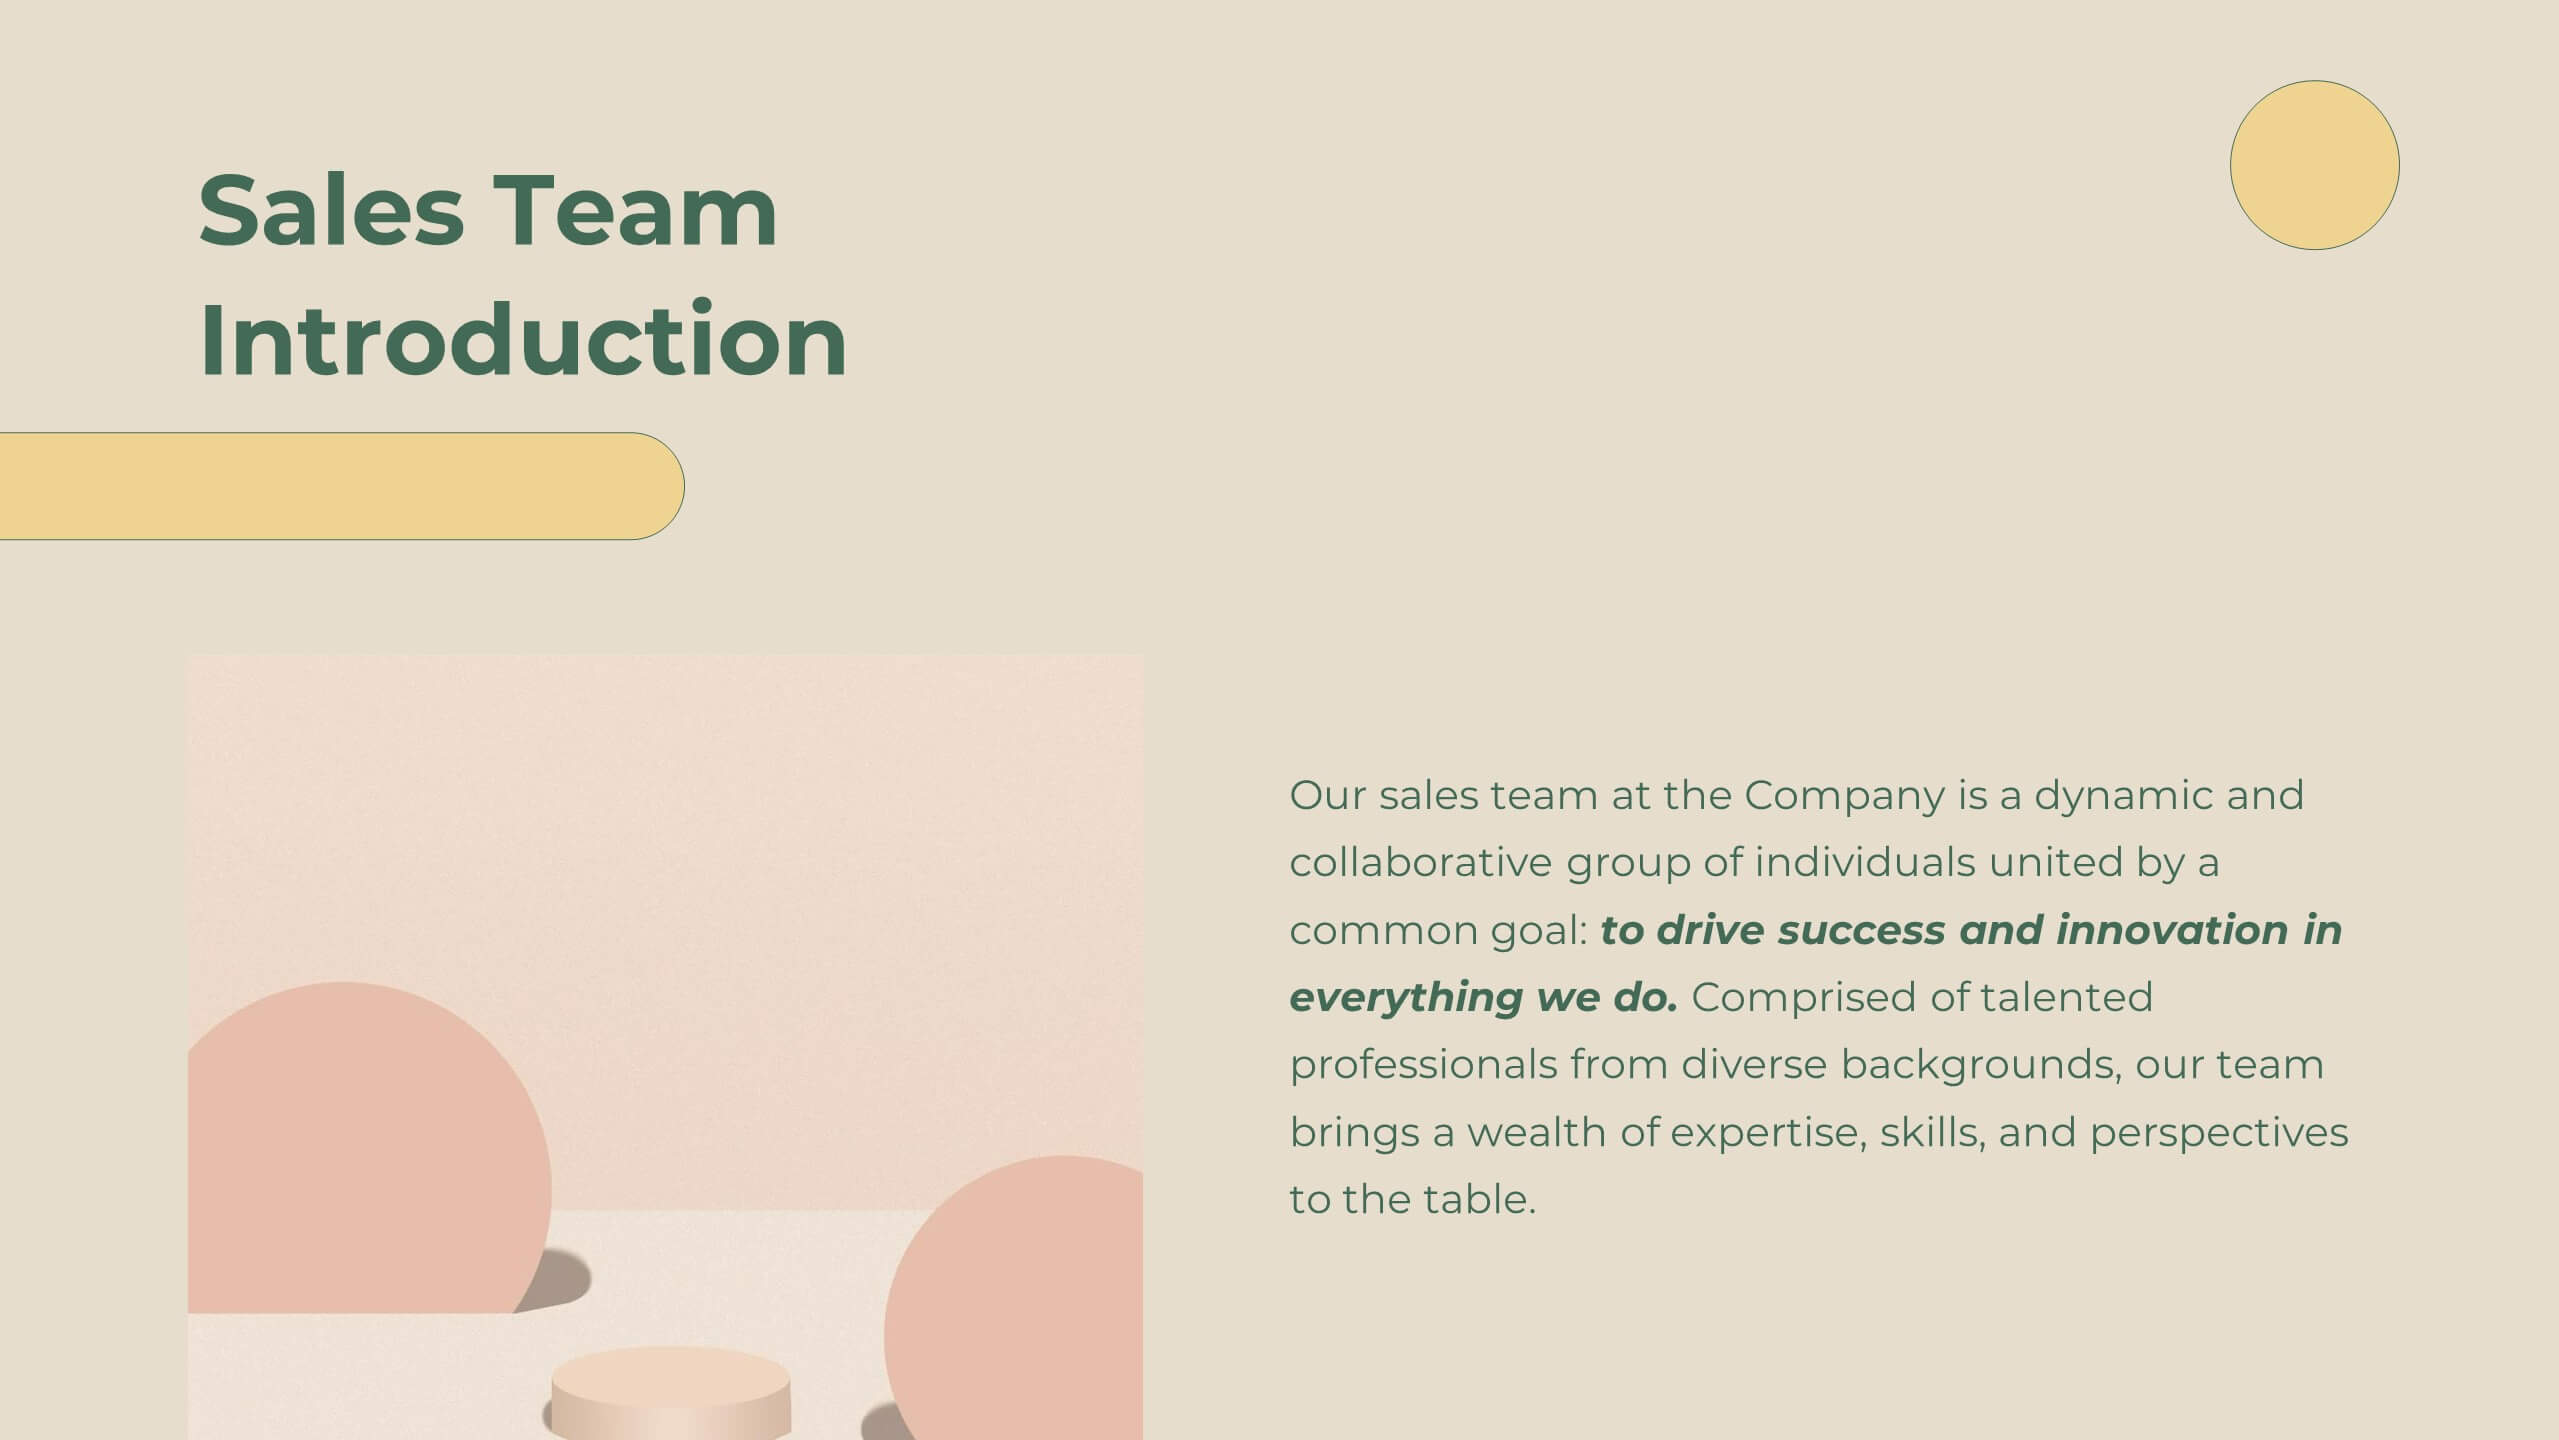
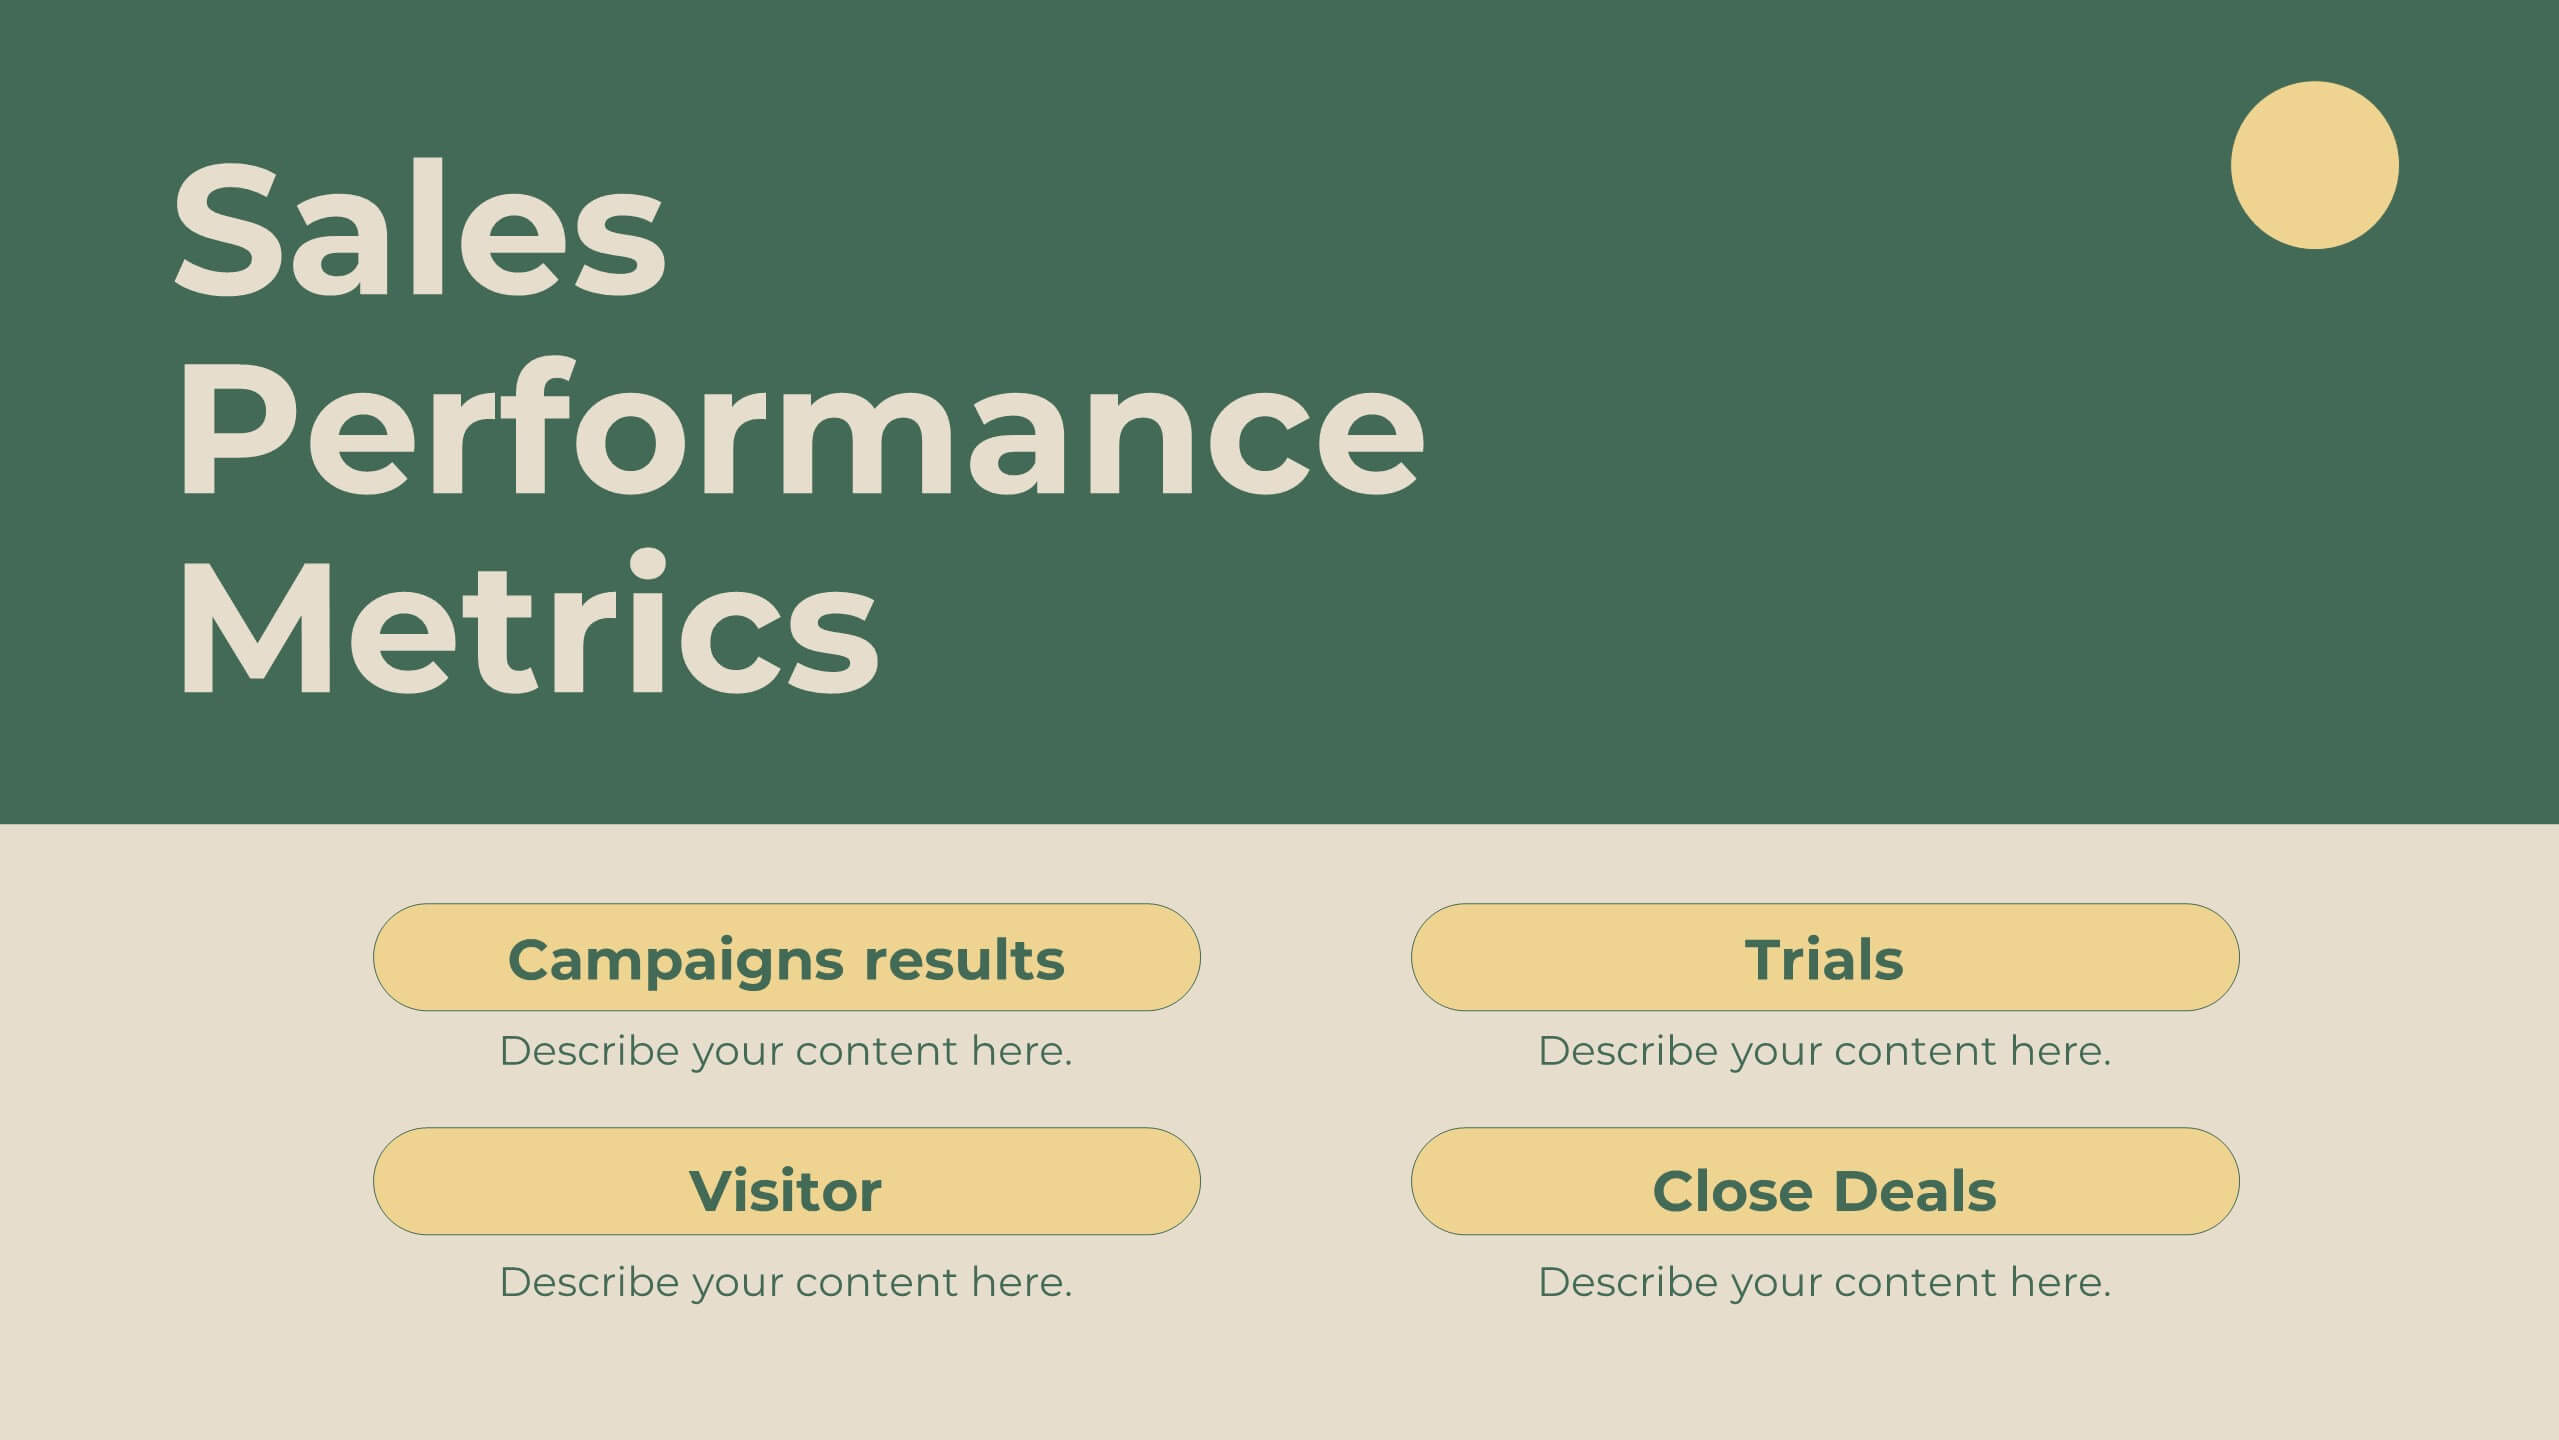
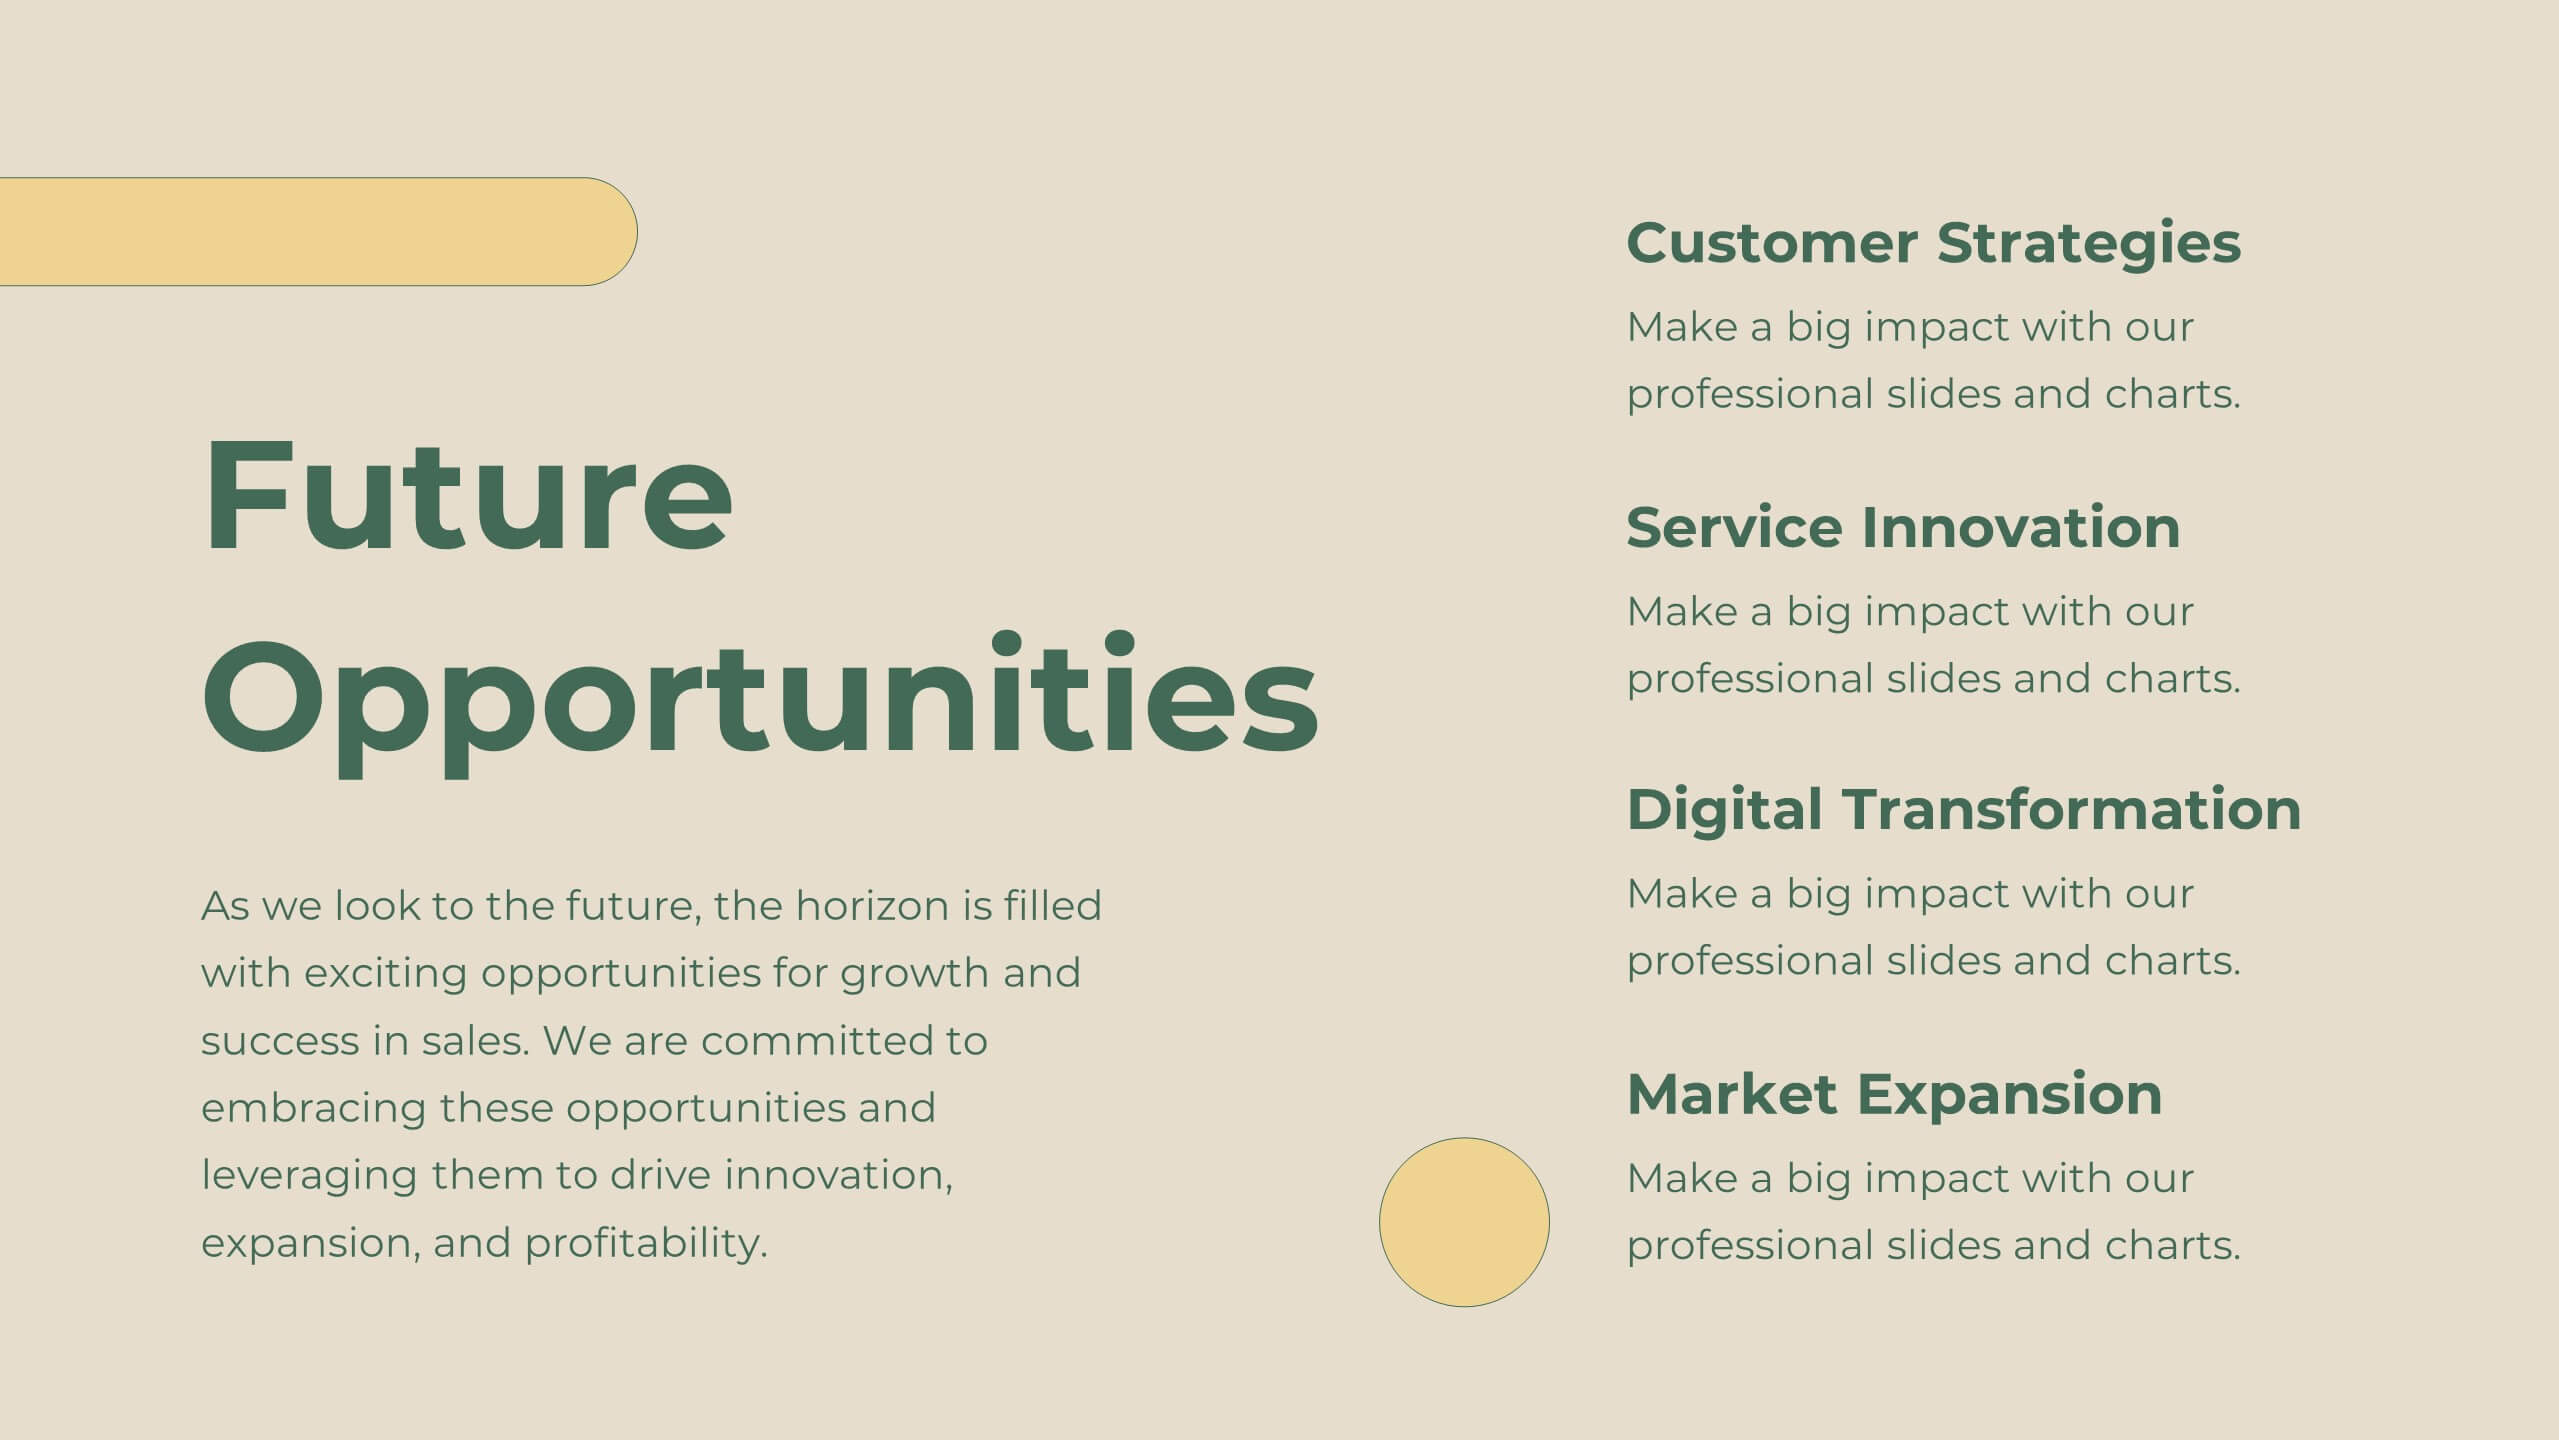
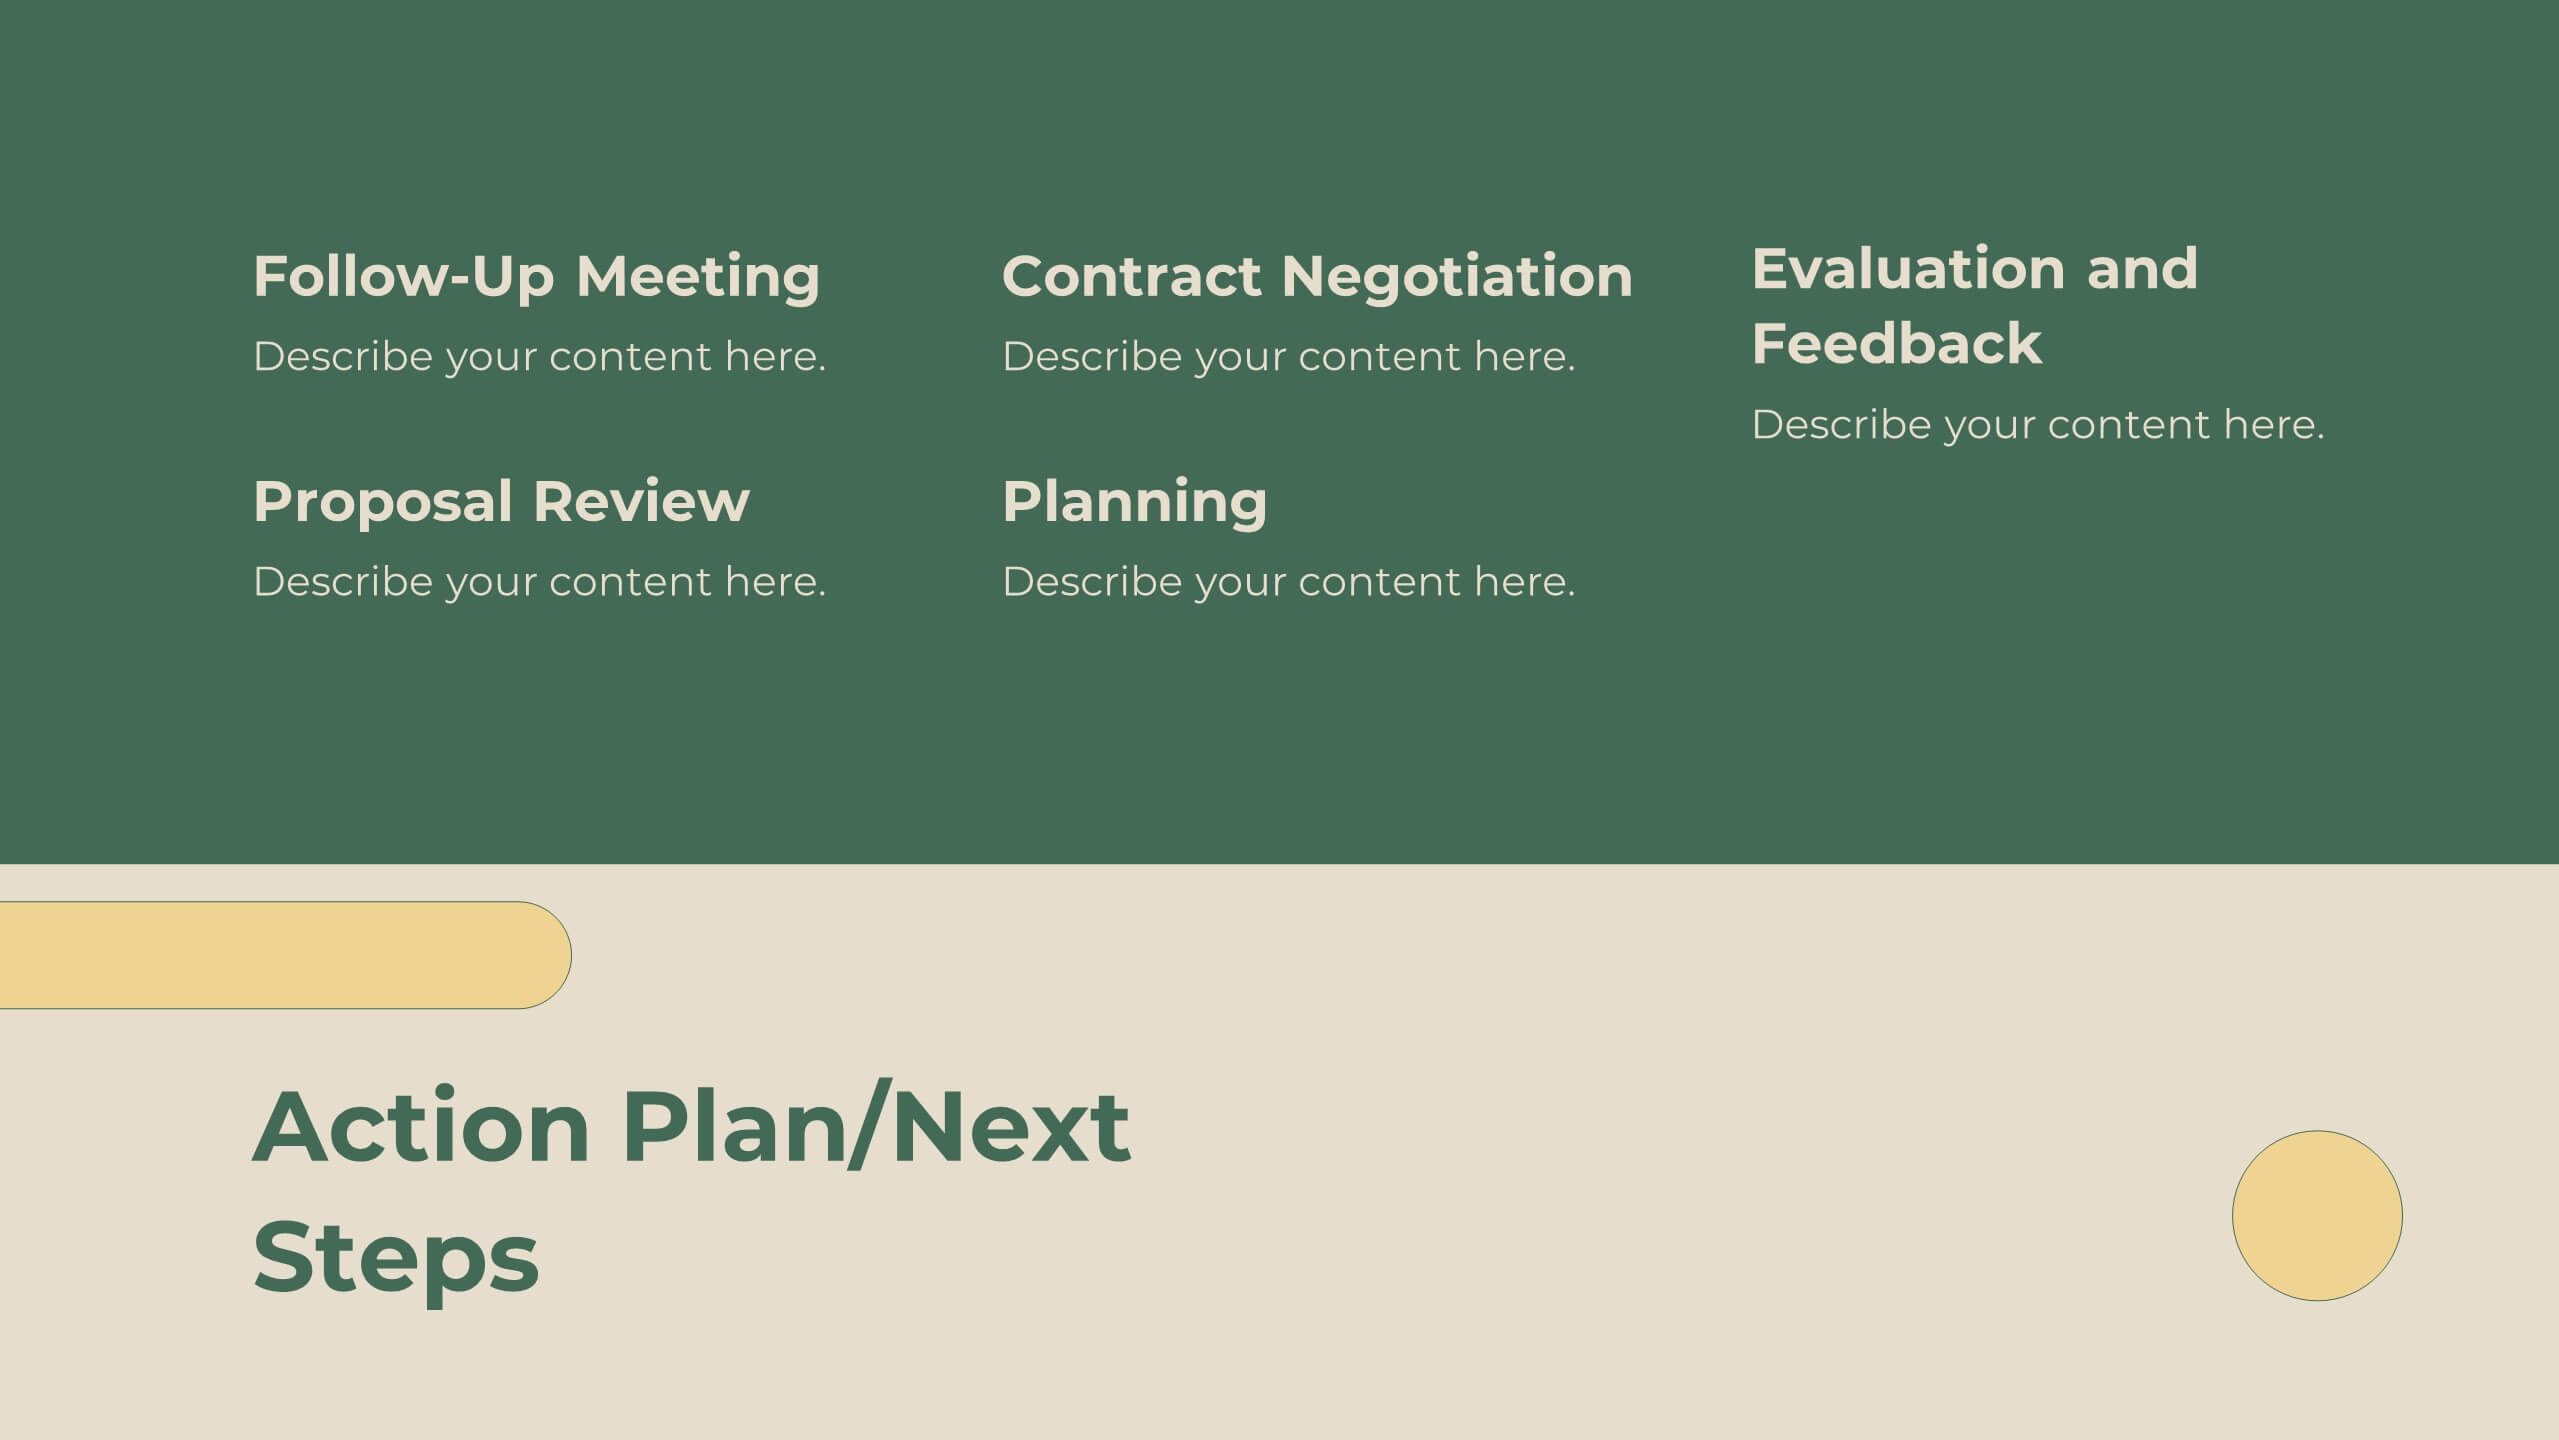
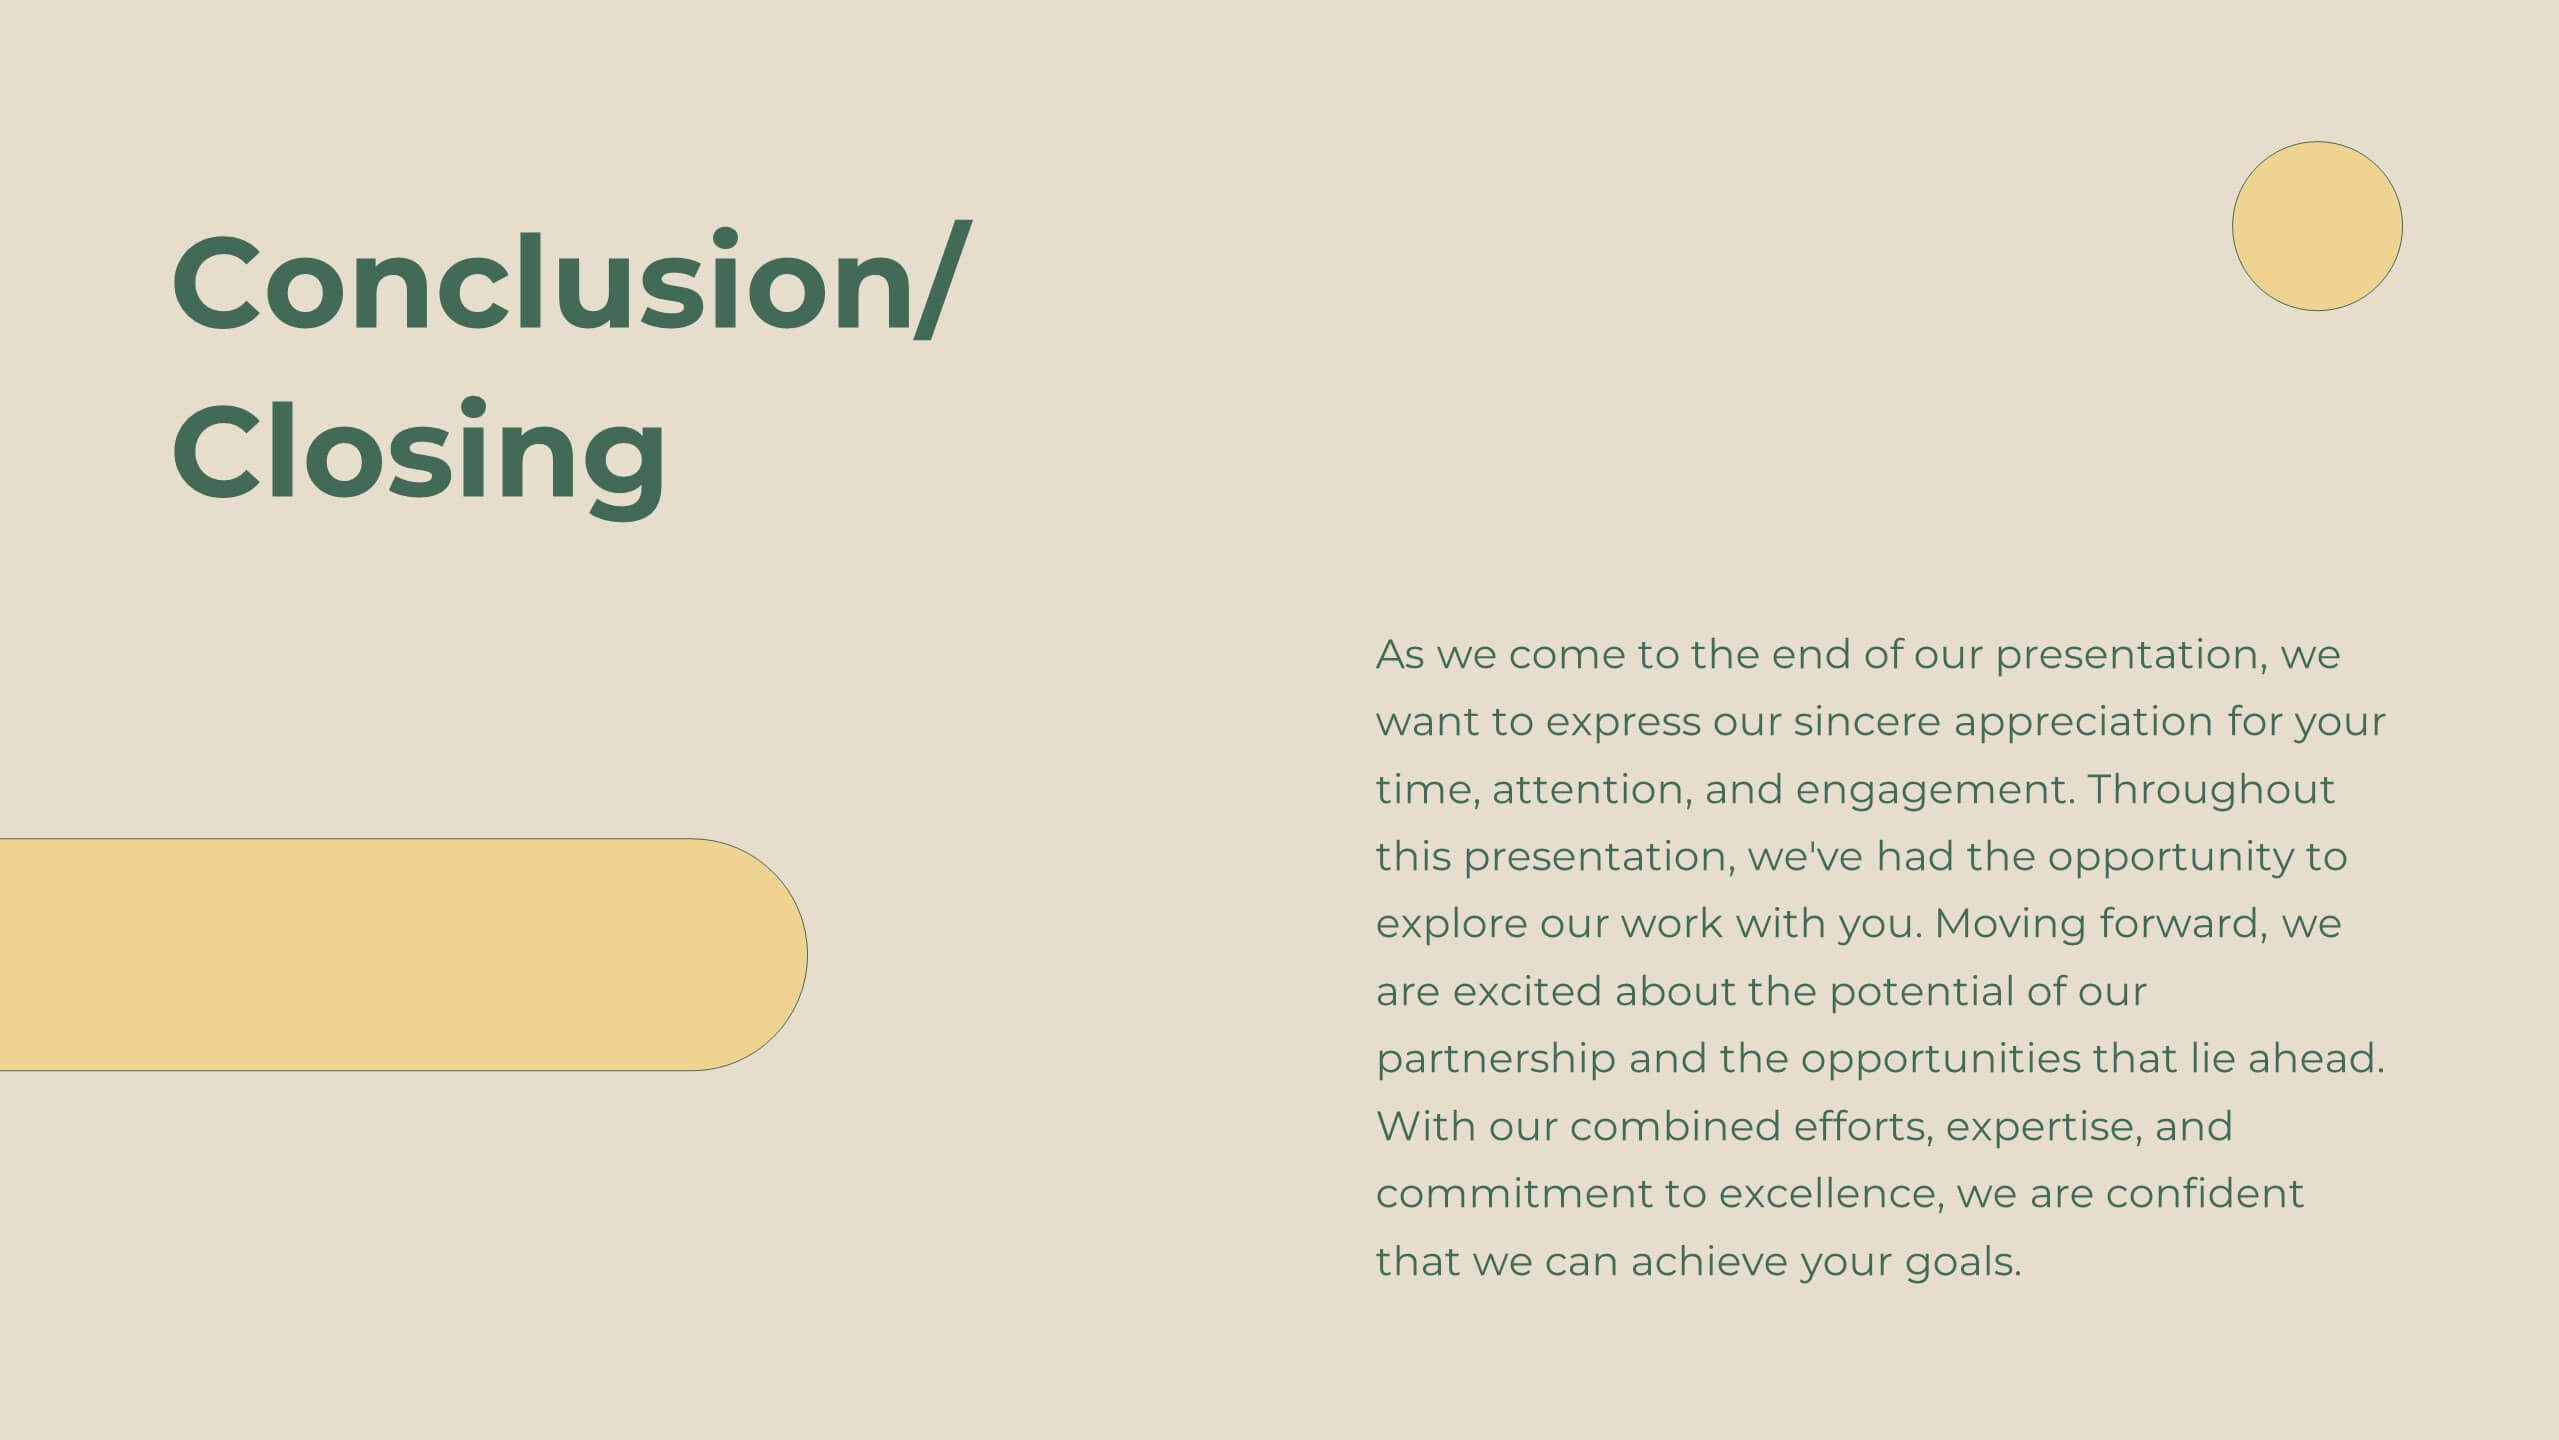
Legacy Sales Strategy Presentation
Boost your sales presentations with this modern template! It features sections for objectives, process, team introduction, customer testimonials, and performance metrics. Ideal for outlining strategies, opportunities, and pricing. Engage your audience with a professional, clean design. Compatible with PowerPoint, Keynote, and Google Slides for seamless integration. Make your sales strategy stand out!


5 diapositivas
Real Estate Portfolio Template Presentation
Present your property portfolio with clarity and elegance. This slide highlights four key listings or projects using modern icons and a clean layout, complemented by a real estate photo background. Fully editable in Canva, PowerPoint, and Google Slides—perfect for agents, brokers, or developers showcasing residential or commercial properties.