


Características


¿Tienes alguna pregunta?
Recomendar


7 diapositivas
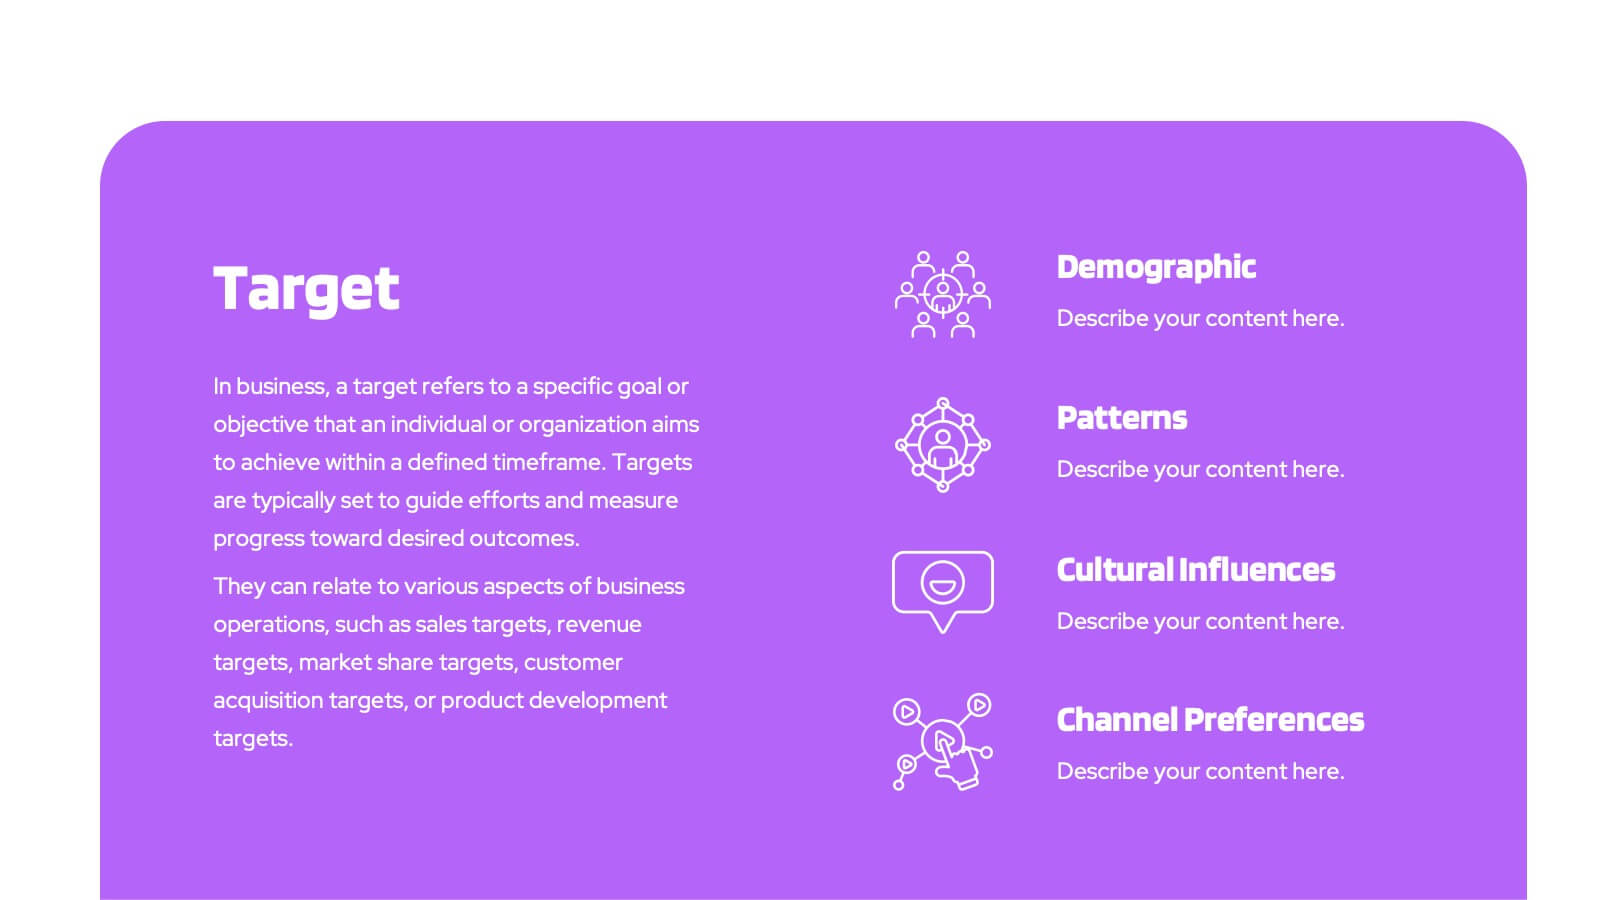
Target Market Profiles Infographic
A Target Market Profile, also known as a customer profile or buyer persona, is a detailed description of a specific segment of a broader market that a business aims to target with its products or services. This infographic is a vibrant and insightful template designed to help you understand your audience better and enhance your marketing strategies. Explore the essence of audience segmentation and empower your marketing endeavors with a clear understanding of your target market. Compatible with Powerpoint, Keynote, and Google Slides. This infographic explores the world of targeted marketing and revolutionize your strategies.


6 diapositivas
Business Sustainability Performance Report Presentation
Showcase your company’s sustainability efforts with this modern infinity-loop infographic. Perfect for environmental reports, CSR metrics, or circular economy overviews. Highlight key percentages and goals across three impact areas. Fully editable and compatible with PowerPoint, Keynote, and Google Slides—ideal for presenting performance results in a clear, engaging, and professional format.


4 diapositivas
Health and Safety Measures Presentation
Bring awareness and clarity to your audience with this bold, safety-inspired presentation layout. Designed to help communicate workplace protocols, risk prevention, and emergency measures effectively, it uses clean visuals and strong icons to capture attention. Fully editable and compatible with PowerPoint, Keynote, and Google Slides for seamless customization.


7 diapositivas
Matrix System Diagram Infographic
A matrix diagram is a visual representation of data in a matrix format, commonly used to analyze the relationships between two or more sets of items. This infographic template is a valuable tool in various fields including business, project management, quality management, and decision-making processes. Compatible with Powerpoint, Keynote, and Google Slides. This is designed to help you present intricate relationships, structures, and data in a clear and visually engaging way. Whether you're illustrating business strategies, decision matrices, or organizational hierarchies, this template simplifies complexity.


5 diapositivas
RACI Role Assignment Matrix Overview Presentation
Clarify team responsibilities with the RACI Role Assignment Matrix Overview Presentation. This professional template helps define who is Responsible, Accountable, Consulted, and Informed across key project tasks. Perfect for streamlining communication, reducing overlap, and improving accountability. Fully editable in PowerPoint, Canva, and Google Slides.


7 diapositivas
Matrix Sales Infographic
Steer through the intricacies of sales data with our matrix sales infographic. Set upon a pristine white backdrop, the design pulses with the analytical depth of blue, the urgency of red, and the vibrancy of orange. With meticulously crafted infographics, relevant icons, and adaptable image placeholders, this template delivers a systematic representation of the sales matrix, from product positioning to market segmentation. Exquisitely designed for Powerpoint, Keynote, or Google Slides. A pivotal tool for sales managers, market analysts, strategists, or any business professional aiming to dissect sales data and drive decisions.


7 diapositivas
Supply Chain Logistic Infographics
Streamline your logistics insights with our Supply Chain Logistics Infographic, tailored for logistics managers, supply chain analysts, and operations directors. This infographic provides a visual tool to depict the intricacies and flow of your supply chain from procurement to distribution. Our infographic offers a comprehensive layout to map out each step of the supply chain, highlighting key processes such as supplier selection, manufacturing, inventory management, and logistics. It's designed to facilitate a better understanding of each segment's role in the overall efficiency and effectiveness of the supply chain. Customize this infographic with specific data points, such as lead times, turnover rates, and transportation modes, to provide a detailed view of your logistics operations. This SEO-optimized infographic is crafted to make your supply chain data accessible and actionable. Implement our infographic to communicate the complexities of supply chain logistics succinctly, ensuring that stakeholders grasp the full scope of your supply chain dynamics.


4 diapositivas
Blockchain and Cryptocurrency Market Analysis Presentation
Present complex blockchain structures and crypto market layers with clarity using the Blockchain and Cryptocurrency Market Analysis presentation template. Featuring a stacked cylinder diagram with four interactive data points, this layout is ideal for breaking down transaction flows, network layers, or decentralized finance (DeFi) ecosystems. Each title block offers space for concise key insights. Best suited for blockchain consultants, fintech startups, and crypto analysts. Fully compatible with PowerPoint, Keynote, and Google Slides.


4 diapositivas
Breast Cancer Research and Support
Shine a light on women's health initiatives with this impactful “Breast Cancer Research and Support” infographic slide. Featuring a symbolic visual shaped like a heart and ribbon, this layout is ideal for showcasing comparative stats, awareness milestones, or key messages about prevention and treatment. Use it to advocate, inform, or inspire—perfect for awareness campaigns, nonprofit reports, or healthcare presentations. Fully customizable in PowerPoint, Keynote, and Google Slides.


5 diapositivas
Strategic Growth Next Steps
Highlight your business roadmap with this rocket-themed infographic tailored for strategic growth. Ideal for showcasing step-by-step initiatives or departmental alignment, it features five labeled stages with ample space for insights and icons. Fully editable in PowerPoint, Keynote, and Google Slides—perfect for growth strategy, planning, or vision-setting decks.


8 diapositivas
Business Growth Strategies Presentation
Take your vision from concept to expansion with a sleek, modern presentation designed to highlight progress and future potential. Ideal for showcasing goals, performance metrics, and market strategies, it keeps your ideas structured and engaging. Fully compatible with PowerPoint, Keynote, and Google Slides for effortless customization and presentation delivery.


20 diapositivas
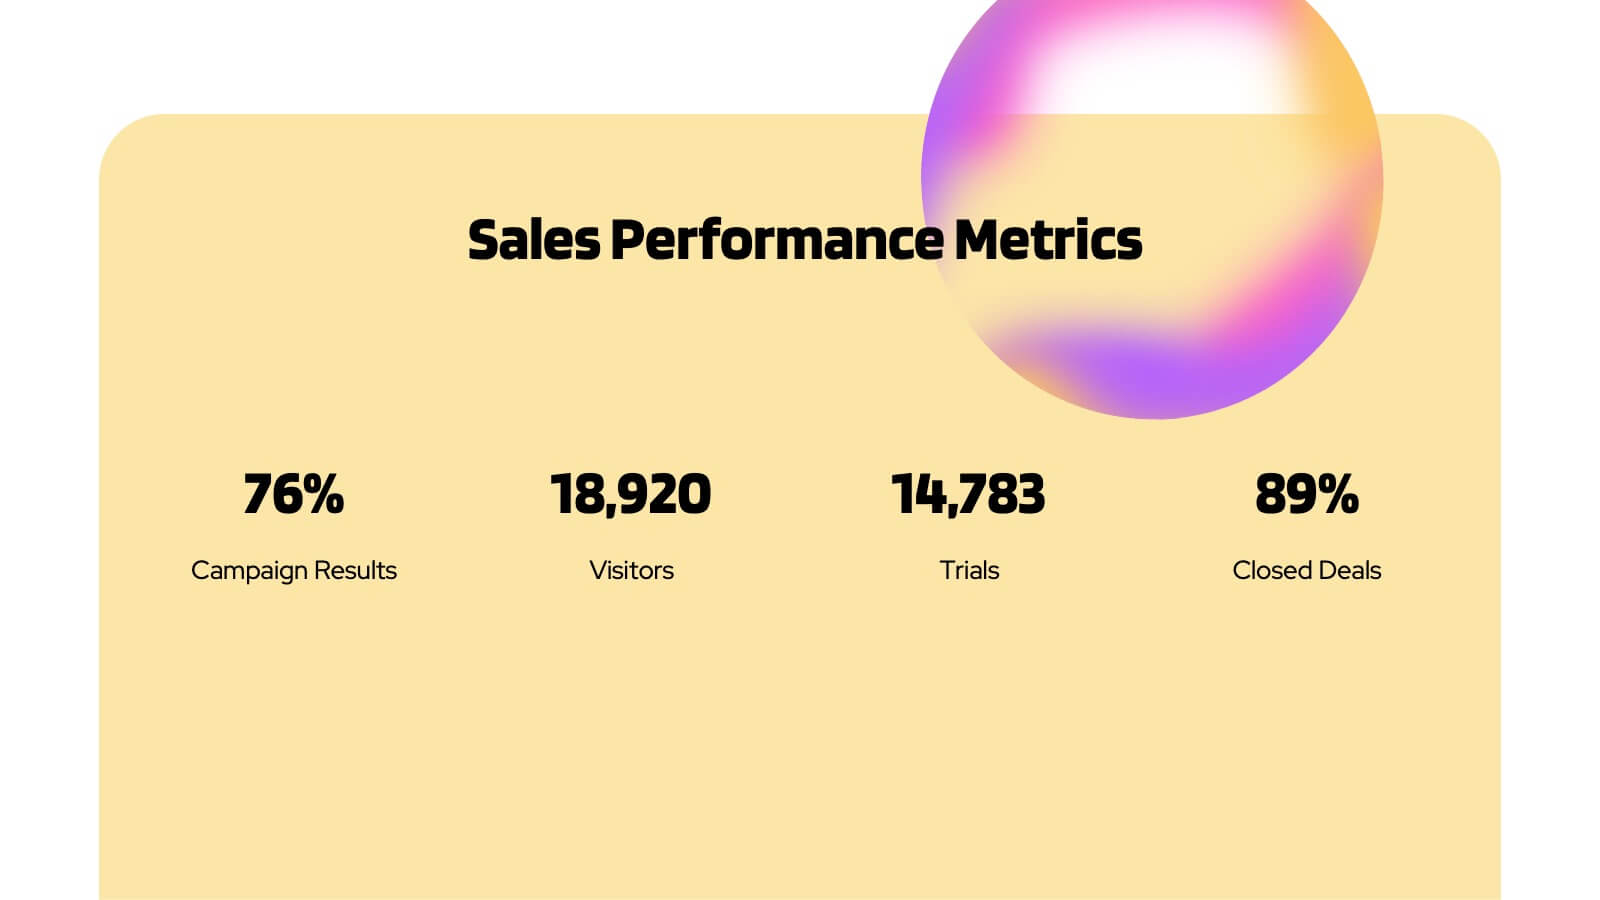
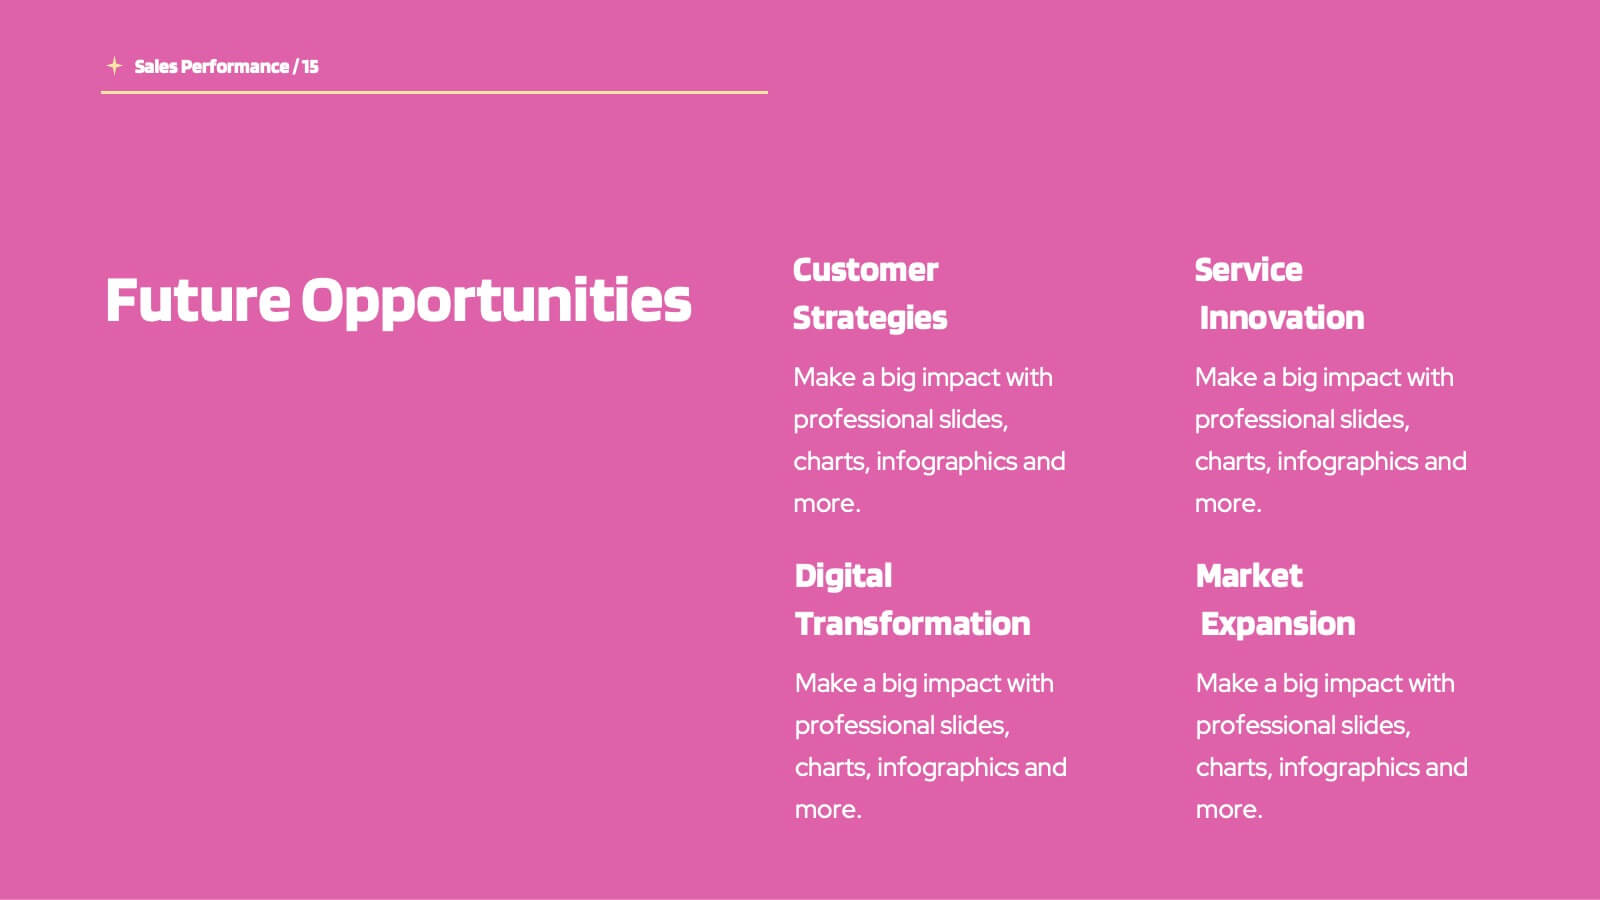
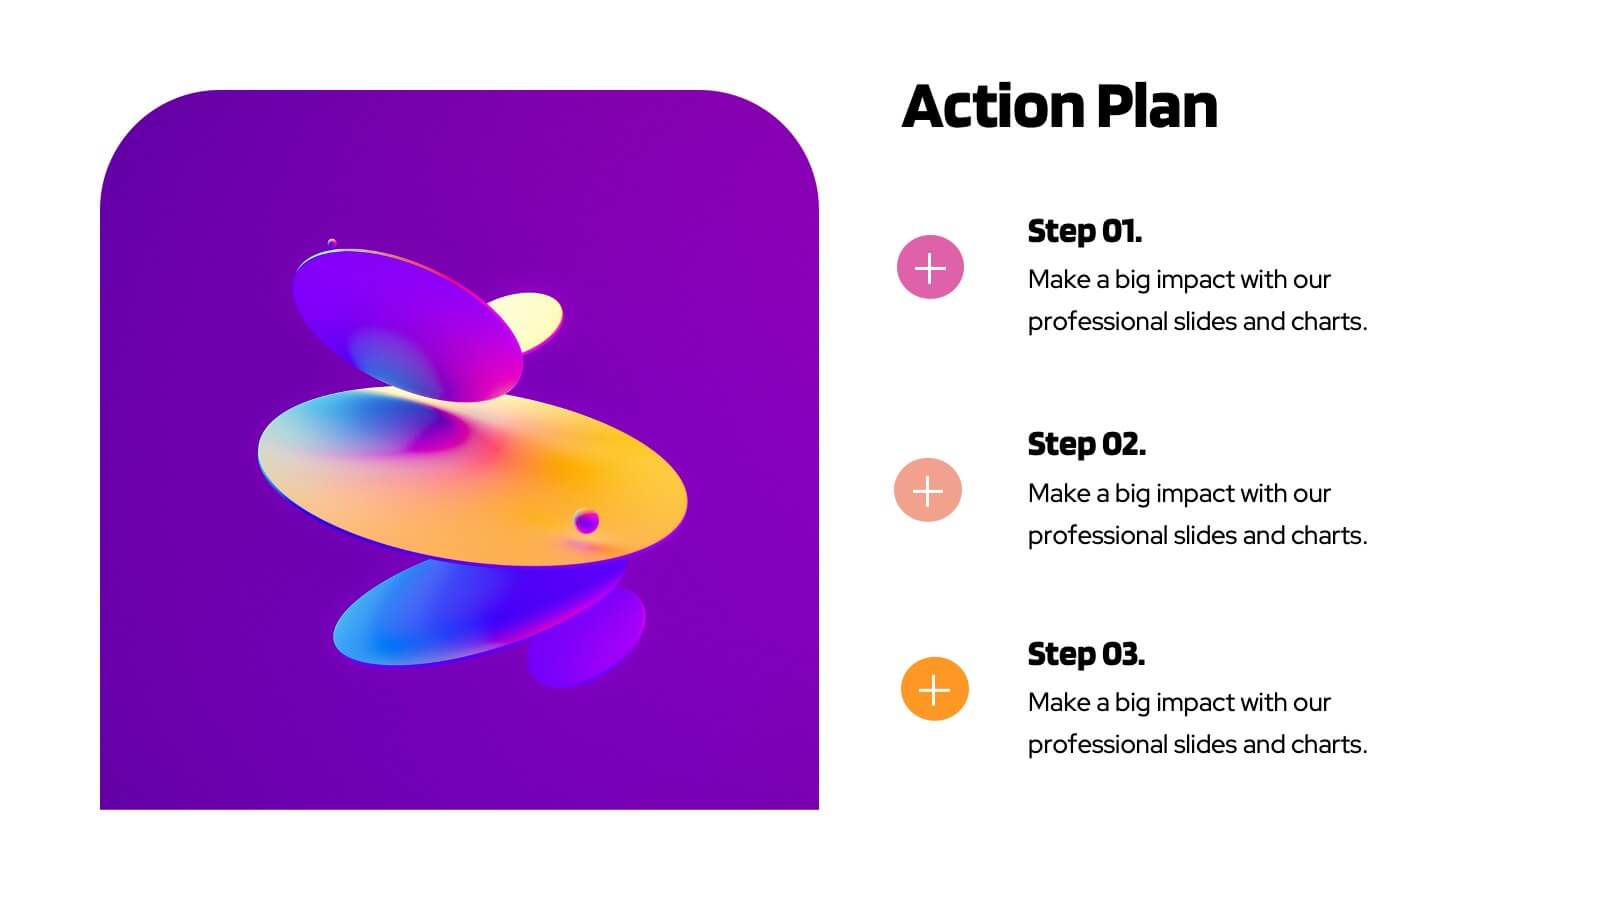
Planetary Sales Performance Report Presentation
Energize your sales efforts with this vivid sales performance presentation template. It includes sections for company overview, detailed sales metrics, and future goals, perfect for showcasing achievements. Compatible with PowerPoint, Google Slides, and Keynote, it’s designed to inform and motivate sales teams effectively.


4 diapositivas
Data Breach Prevention Planning Deck Presentation
Stop breaches before they start with this clean, visual data protection slide. Designed to help teams outline risks, access controls, and mitigation steps, this template makes complex security workflows easy to present. A great fit for compliance reviews or cybersecurity briefings. Compatible with PowerPoint, Keynote, and Google Slides.


4 diapositivas
Lab Research Data Analysis Layout Presentation
Present your scientific findings with clarity using this Lab Research Data Analysis Layout Template. Featuring molecular, lab flask, and data icons in a connected node design, it's ideal for researchers and analysts. Fully editable in PowerPoint, Keynote, and Google Slides, this clean layout ensures your data is both visual and professional.


5 diapositivas
AIDA Model Marketing Infographics
The AIDA model is a marketing and advertising framework that outlines the stages a consumer goes through during the decision-making process.This AIDA model is a widely used marketing framework that outlines the stages a customer goes through in the buying process: Attention, Interest, Desire, and Action. These infographic templates are effective tools for explaining and illustrating the AIDA model in marketing presentations, training sessions, or educational materials. These infographics will enable your audience to apply the AIDA model in their marketing strategies, campaigns, and customer engagement efforts.


5 diapositivas
Cyber Security Best Practices Infographics
Navigate the digital landscape safely with our cyber security best practices infographics. Crafted in a striking combination of black with colorful accents, this creative, vertical template is a powerhouse of cyber safety education. It's an indispensable resource for IT professionals, and educators seeking to propagate security protocols. The design encapsulates compelling graphics, intuitive icons, and dedicated placeholders. Compatible with Powerpoint, Keynote, and Google Slides. By employing this infographic, users can foster a culture of digital vigilance and defense, making it an asset in the fight against online threats.


5 diapositivas
Circular Wheel for Process Flow
Visualize five interconnected stages or phases in a clean, circular layout. Ideal for presenting workflows, continuous cycles, or recurring business processes with clarity and structure. Easily customizable in PowerPoint, Keynote, and Google Slides to match your project needs.