


Características


¿Tienes alguna pregunta?
Recomendar


10 diapositivas
Agile Project Status Review Presentation
Streamline your Agile methodologies with our "Agile Project Status Review" presentation templates. Designed to enhance visual communication, these templates help you effectively display project phases from start to finish. Ideal for dynamic project management, they are compatible with PowerPoint, Keynote, and Google Slides, ensuring seamless integration into your workflow.


26 diapositivas
Jenzen Presentation Template
Jenzen is a modern multi-purpose template with warm tones for coaching and investing. Jenzen is suitable for all types of businesses Its slide designs can be used in conjunction with each other, making it perfect for sharing information about the various services available to customers. It's easy to use, resulting in high quality presentations. Its slide designs can be used with each other to create more elaborate presentations complete with charts, images and text boxes. It's simple yet stylish design makes it easy for anyone to use and is for both personal use as well as professional use.


5 diapositivas
Diversity in Movies Infographics
Diversity In Movies can have a positive impact on society by promoting acceptance of different cultures, and by promoting messages of equality and social justice. This is a visually stunning vertical infographic template that will help you illustrate and communicate important information about diversity in movies. This template includes various design elements such as icons, illustrations, and graphs, all of which can be easily customized to fit your specific needs. With its bold colors and eye-catching design, this template is sure to capture the attention of your audience and make your message stand out.


16 diapositivas
SEO Research Analysis Presentation
Designed with meticulous attention to detail, this presentation template offers an extensive overview of SEO Analysis Research, perfect for specialists eager to explore the depths of search engine optimization. The initial slide establishes a solid foundation for comprehensive analysis. Following, the 'About' segment delivers a brief yet informative look at the organization's prowess and experience in the realm of SEO. The 'Our Teamwork' slide introduces the team behind the SEO success, showcasing the individuals and their roles. Moving on to 'Strategy,' the template allows for a detailed exposition of the approach and methodologies applied to enhance online visibility. Key metrics are brought to the forefront in a monthly overview, providing insights into traffic sources, content performance, and keyword rankings. The 'SEO Report' highlights significant analytics, such as searches and sign-up rates, emphasizing the impact of the SEO efforts. Complete the presentation with a cordial 'Thank You' to the audience and a 'Credits' slide for resource attribution, ensuring transparency and professionalism. This template is ideal for delivering powerful insights into SEO practices and outcomes.


6 diapositivas
Product Development Cycle Presentation
Illustrate the full journey of bringing a product to market with this Product Development Cycle slide. The circular flow diagram outlines five key phases, making it perfect for showcasing stages like ideation, prototyping, testing, and launch. Each section includes editable icons and placeholder text to highlight insights or key actions. Fully compatible with PowerPoint, Keynote, and Google Slides for smooth customization.


5 diapositivas
Artificial Intelligence Tools Infographics
Artificial Intelligence has advanced rapidly in recent years, leading to the development of various tools and technologies that leverage AI algorithms and techniques. These vertical infographics highlight various tools and technologies used in the field of AI. This template provides an engaging way to showcase different AI tools and their functionalities. This features a sleek and contemporary design that captures attention. The combination of vibrant colors, high-quality icons, and visuals adds a modern touch to the infographics. The template offers multiple slides that provide an overview of AI and its technologies.


5 diapositivas
Traveling Options Infographics
There are various traveling options available, depending on the destination, budget, and personal preferences. These infographic templates are a comprehensive tool for presenting different modes of transportation and travel options. This is the perfect option if you're delivering a presentation on travel planning, transportation choices, or sustainable travel, this template will help you present information in a visually appealing and informative way, assisting your audience in making well-informed decisions for their travel needs. This template is designed to be compatible with PowerPoint, Keynote, and Google Slides.


6 diapositivas
Modern Science Report Presentation
Bring your findings to life with a clean, dynamic layout designed to make scientific insights easy to follow. This presentation highlights key data, research points, and lab observations in a structured, visually engaging format that supports clarity and accuracy. Fully compatible with PowerPoint, Keynote, and Google Slides.


23 diapositivas
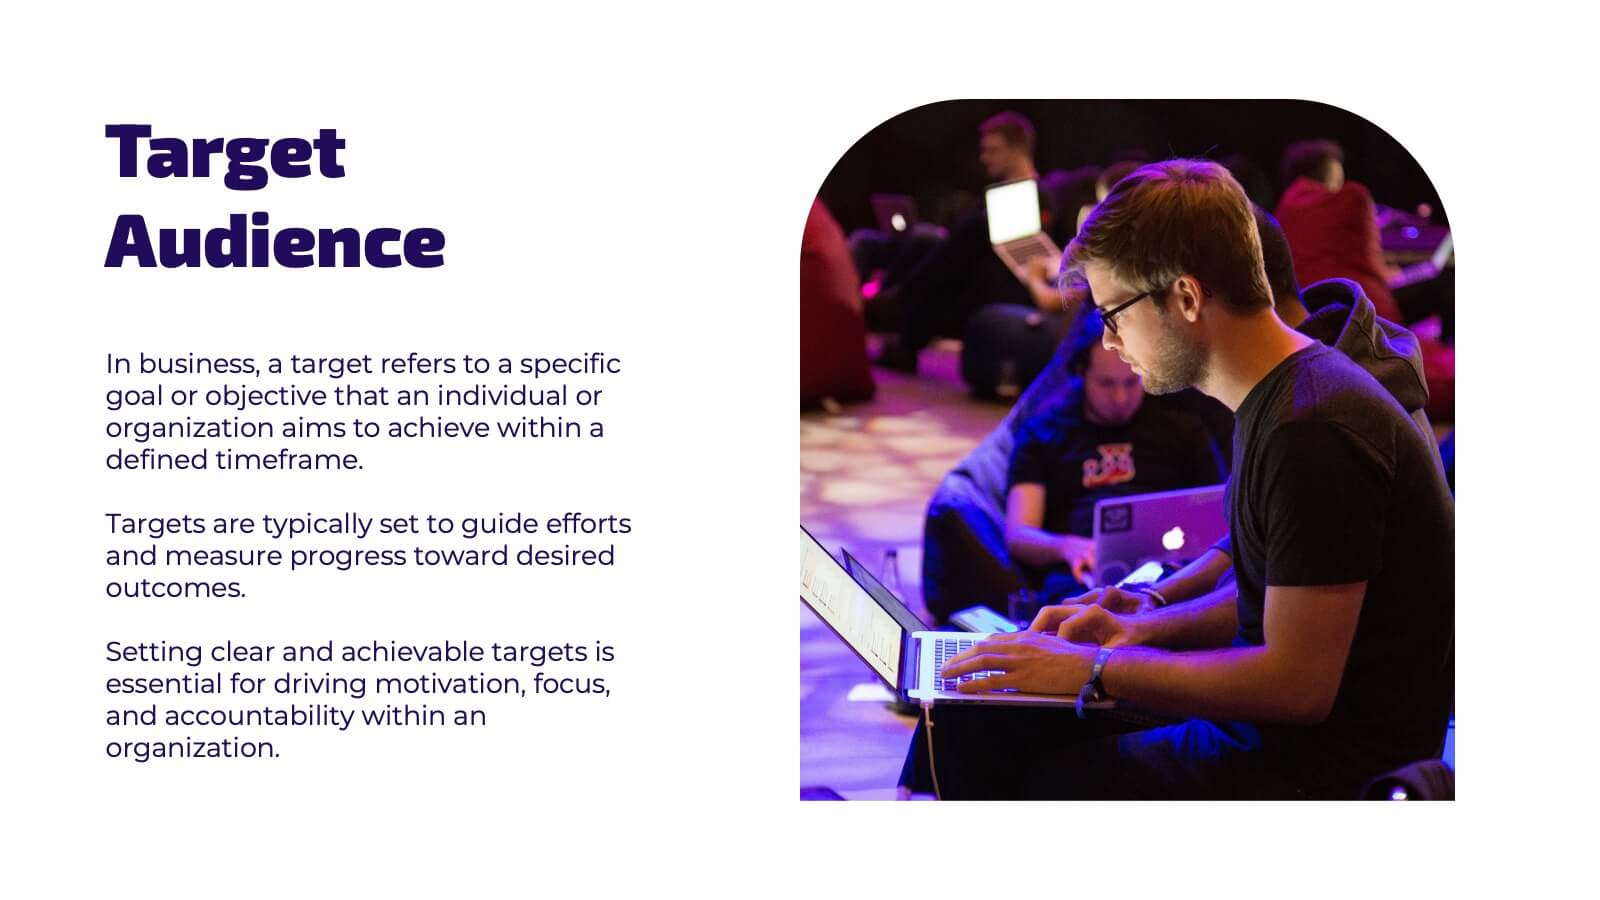
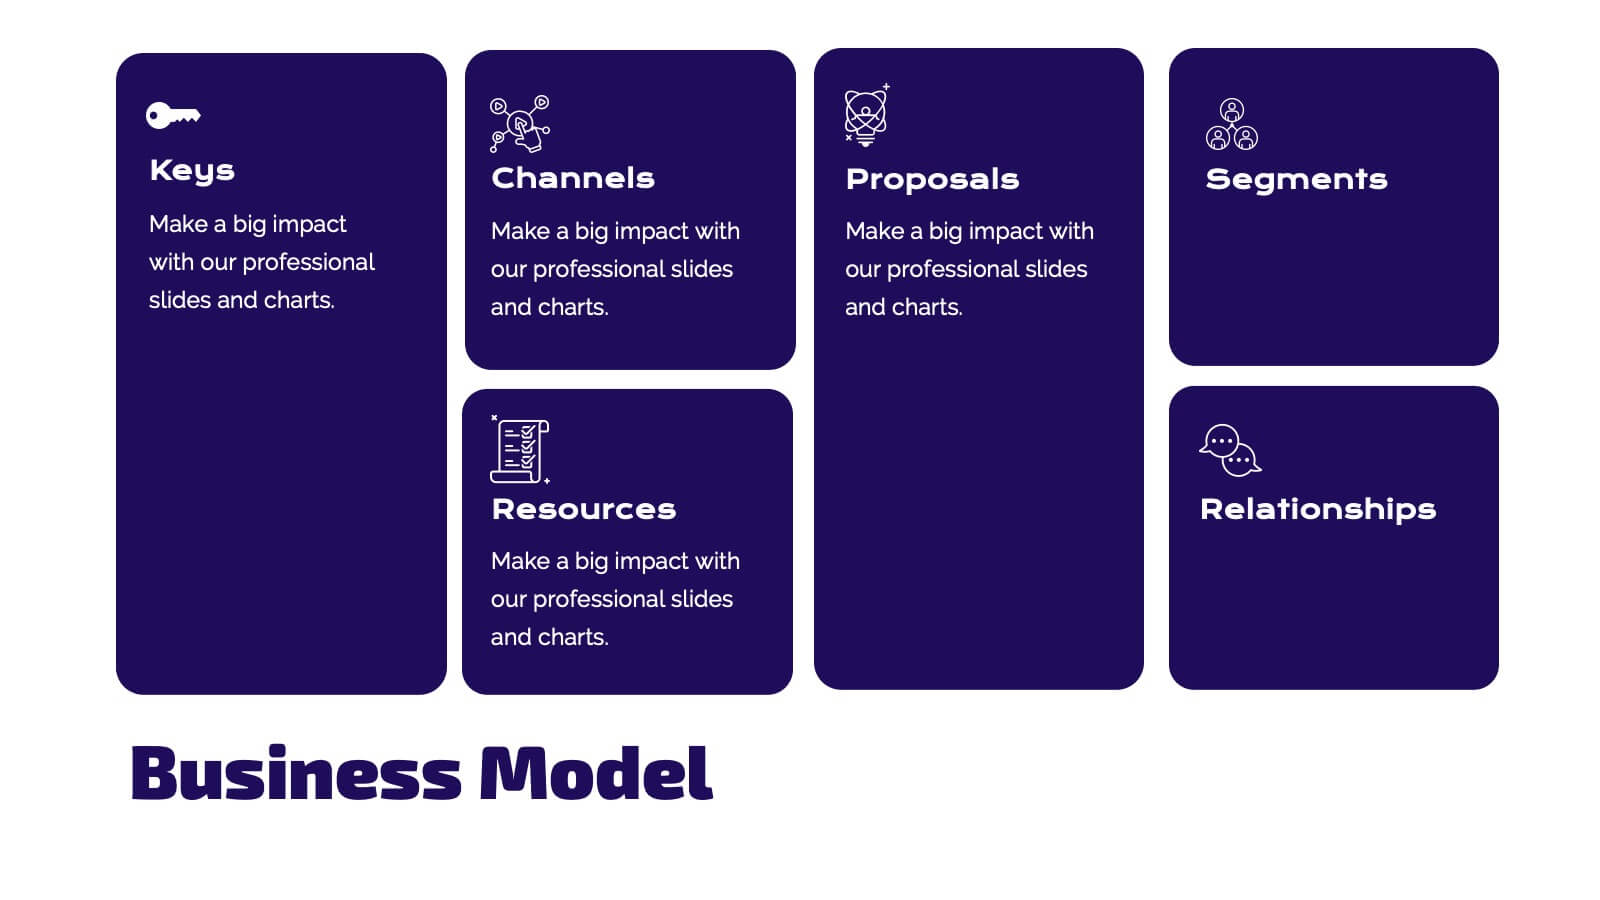
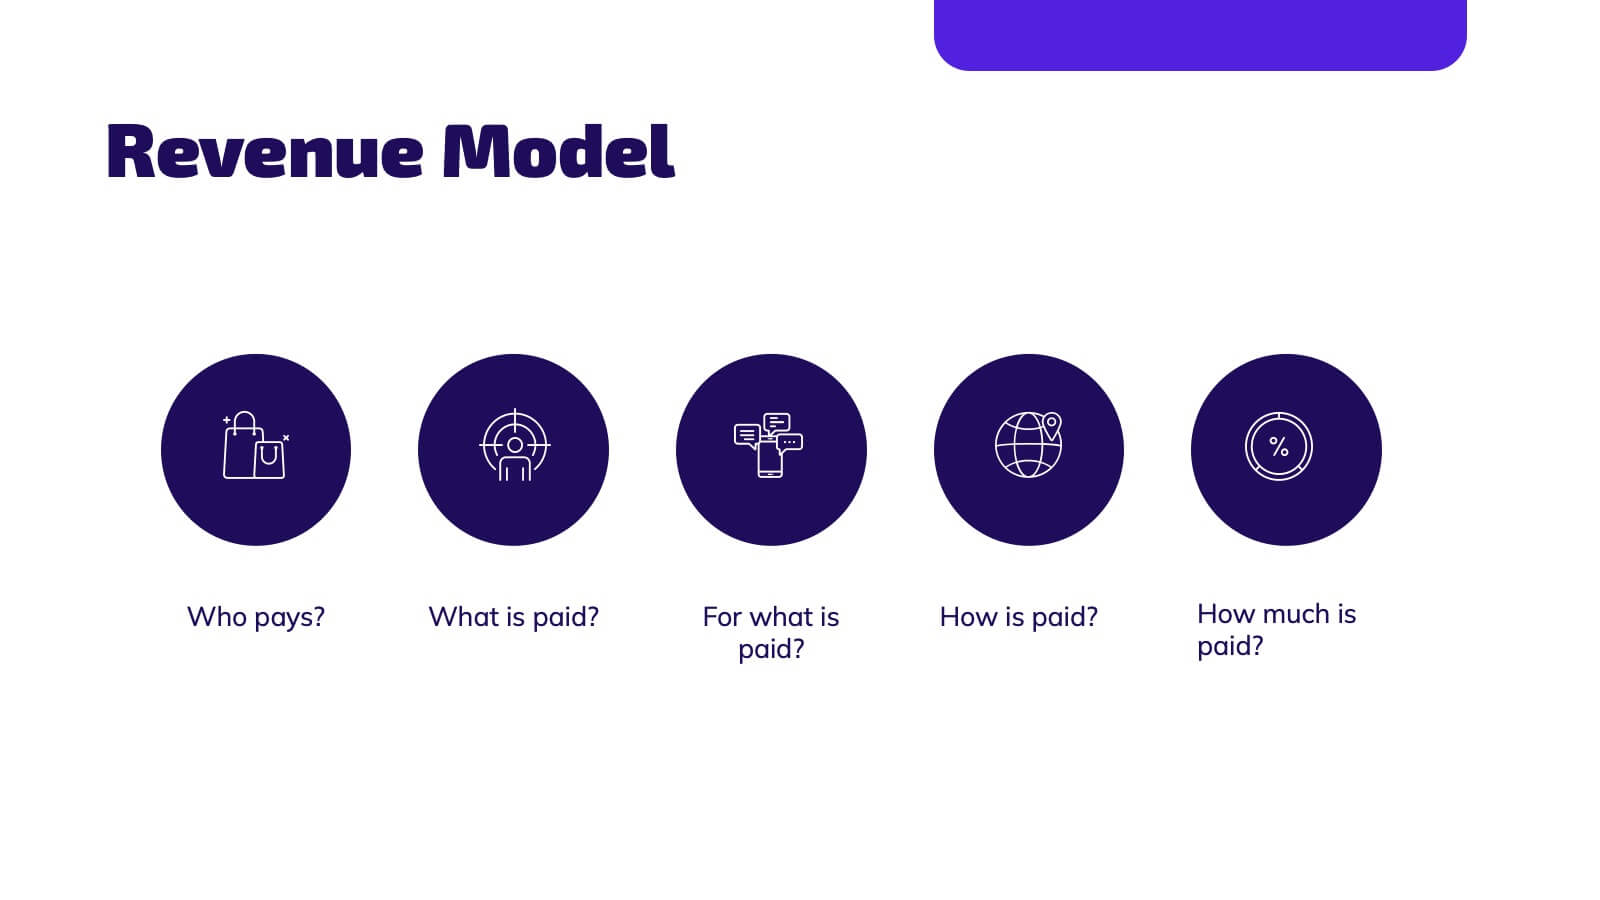
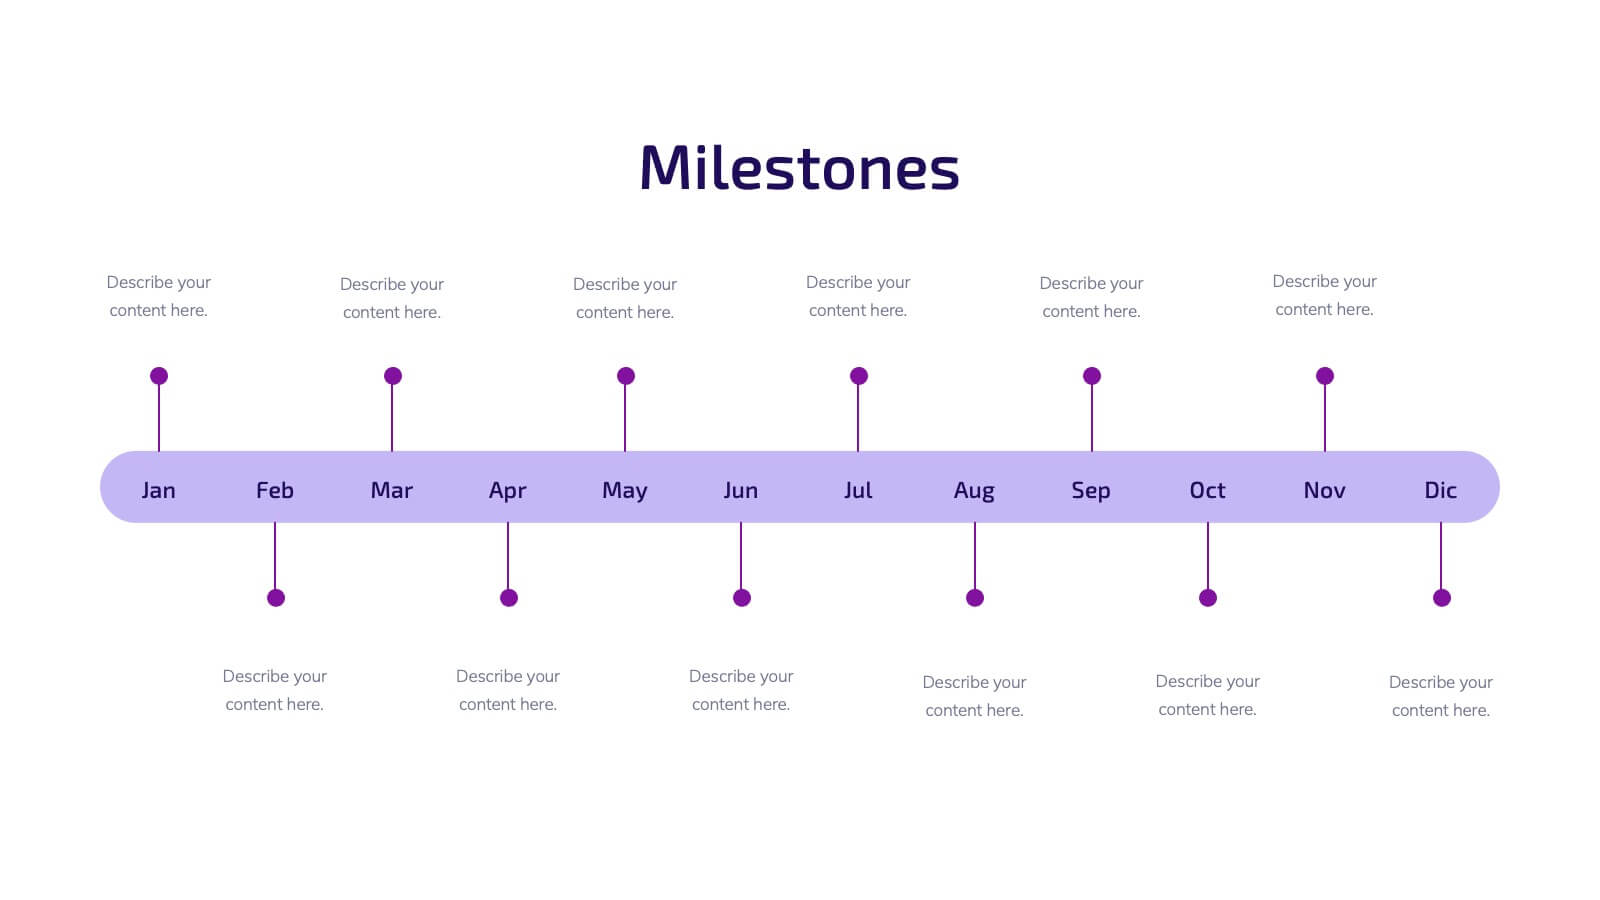
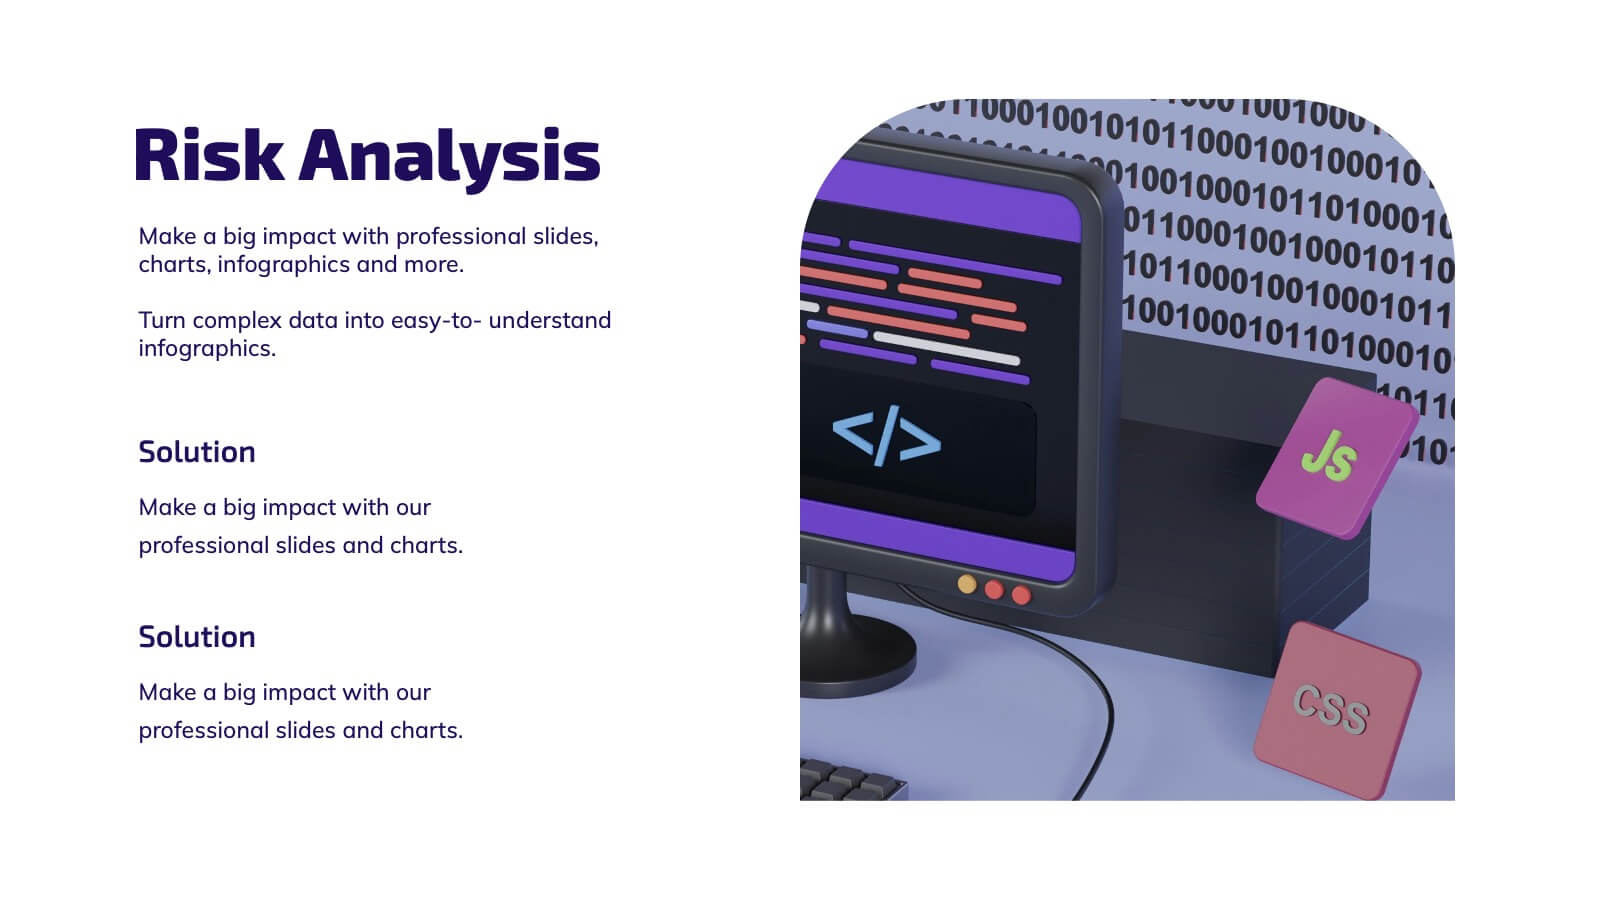
Illume Startup Pitch Deck Presentation
Light up your startup journey with this captivating presentation template! Perfect for pitching your business idea, it guides you through key elements like market analysis, financial projections, and growth strategies. With a modern design that grabs attention, this template will help you shine in front of investors. Compatible with PowerPoint, Keynote, and Google Slides.


12 diapositivas
Compliance and Policy Management Presentation
Visualize your compliance ecosystem with the Compliance and Policy Management Presentation. Designed around a planetary orbit concept, this slide maps core policies at the center with surrounding regulations and enforcement layers. Each orbit can represent levels of governance, department roles, or regulatory zones—making it ideal for risk teams, auditors, and legal advisors. Fully customizable in PowerPoint, Keynote, and Google Slides for seamless use.


10 diapositivas
AIDA Model Explained with Graphics Presentation
Bring your message to life with a dynamic visual flow that guides viewers through each stage of your communication strategy in a clear, compelling way. This presentation breaks complex concepts into simple steps, helping audiences follow your narrative effortlessly. Fully customizable and compatible with PowerPoint, Keynote, and Google Slides.


6 diapositivas
Executive Summary of Findings Presentation
Summarize your key insights with clarity using this Executive Summary of Findings slide. Designed with a centered target icon and surrounding data points, it’s ideal for spotlighting major conclusions. Fully editable in PowerPoint, Keynote, and Google Slides.


7 diapositivas
Rotational Process Flow in Wheel Layout Presentation
Showcase continuous workflows, lifecycle stages, or strategic loops with the Rotational Process Flow in Wheel Layout Presentation. This visually engaging circular diagram breaks down processes into six distinct segments, each with editable icons, colors, and titles—ideal for marketing funnels, product development stages, or team cycles. Fully compatible with PowerPoint, Keynote, and Google Slides.
4 diapositivas
Directional Arrow Diagram Slide Presentation
Make your message stand out with a bold visual that points your audience in the right direction. This presentation uses clear directional arrows to highlight steps, options, or key decisions in a way that’s easy to follow and visually compelling. Fully editable and compatible with PowerPoint, Keynote, and Google Slides.


6 diapositivas
Root Cause Breakdown with Impact Lines Presentation
Visualize the path from causes to consequences with the Root Cause Breakdown with Impact Lines Presentation. Designed with a clear horizontal arrow flow and dual-level layout, this slide helps you dissect key issues and their cascading effects. Ideal for risk analysis, incident reviews, and operational strategy meetings. Fully customizable in PowerPoint, Keynote, and Google Slides.


6 diapositivas
Numbered Steps Diagram Presentation
Watch your workflow come to life as each step rises in a clean, structured path that makes progress easy to follow. This presentation guides audiences through sequential actions with clarity, helping simplify processes, plans, or instructions. Perfect for business, training, or project teams. Fully compatible with PowerPoint, Keynote, and Google Slides.


10 diapositivas
Water Cycle and Hydrological Study Presentation
Break down complex water cycle processes with this engaging diagram layout. Featuring a bottle-shaped center graphic with directional arrows, it’s perfect for illustrating hydrological stages or sustainability concepts. Fully editable in PowerPoint, Keynote, and Google Slides, making it ideal for educational, environmental, or scientific presentations. Clear, modern, and easy to use.