


Características


¿Tienes alguna pregunta?
Recomendar


6 diapositivas
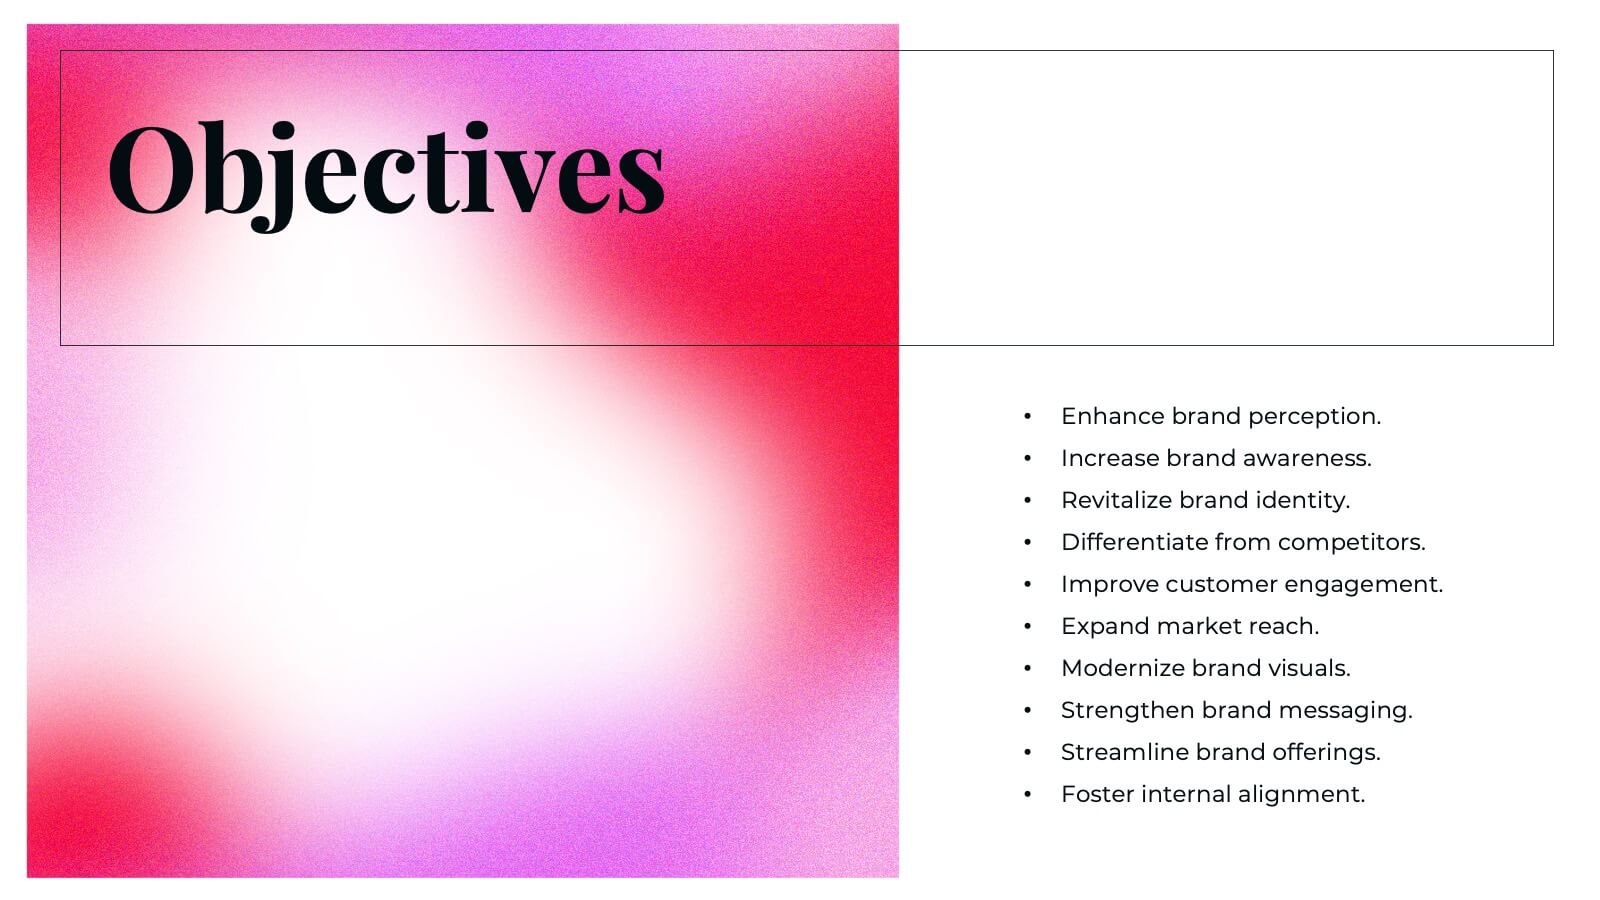
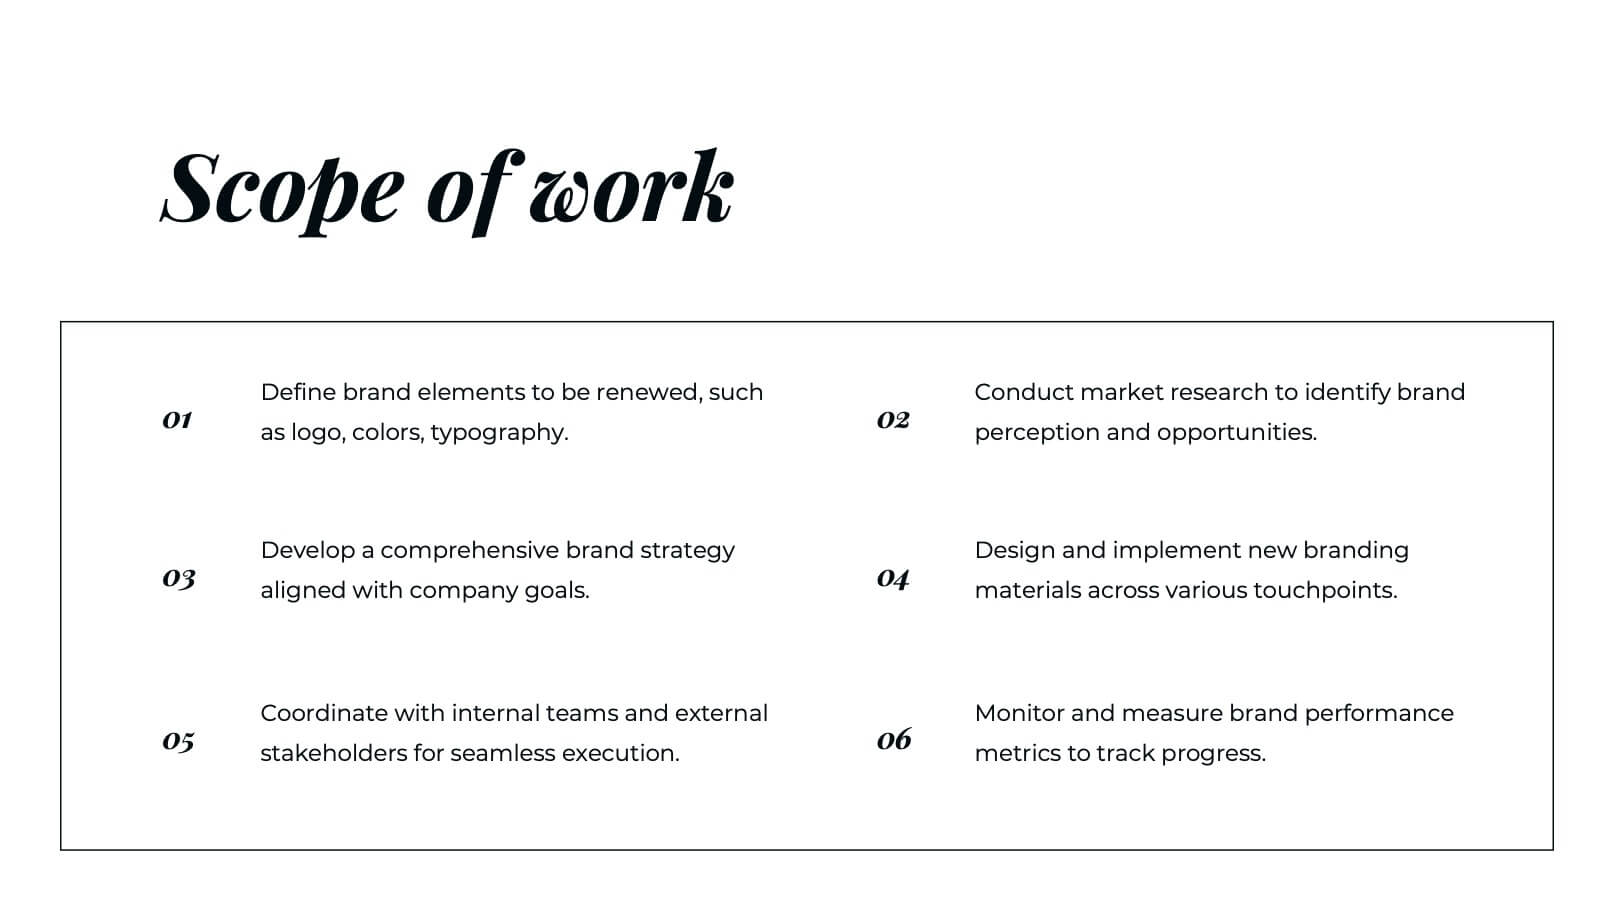
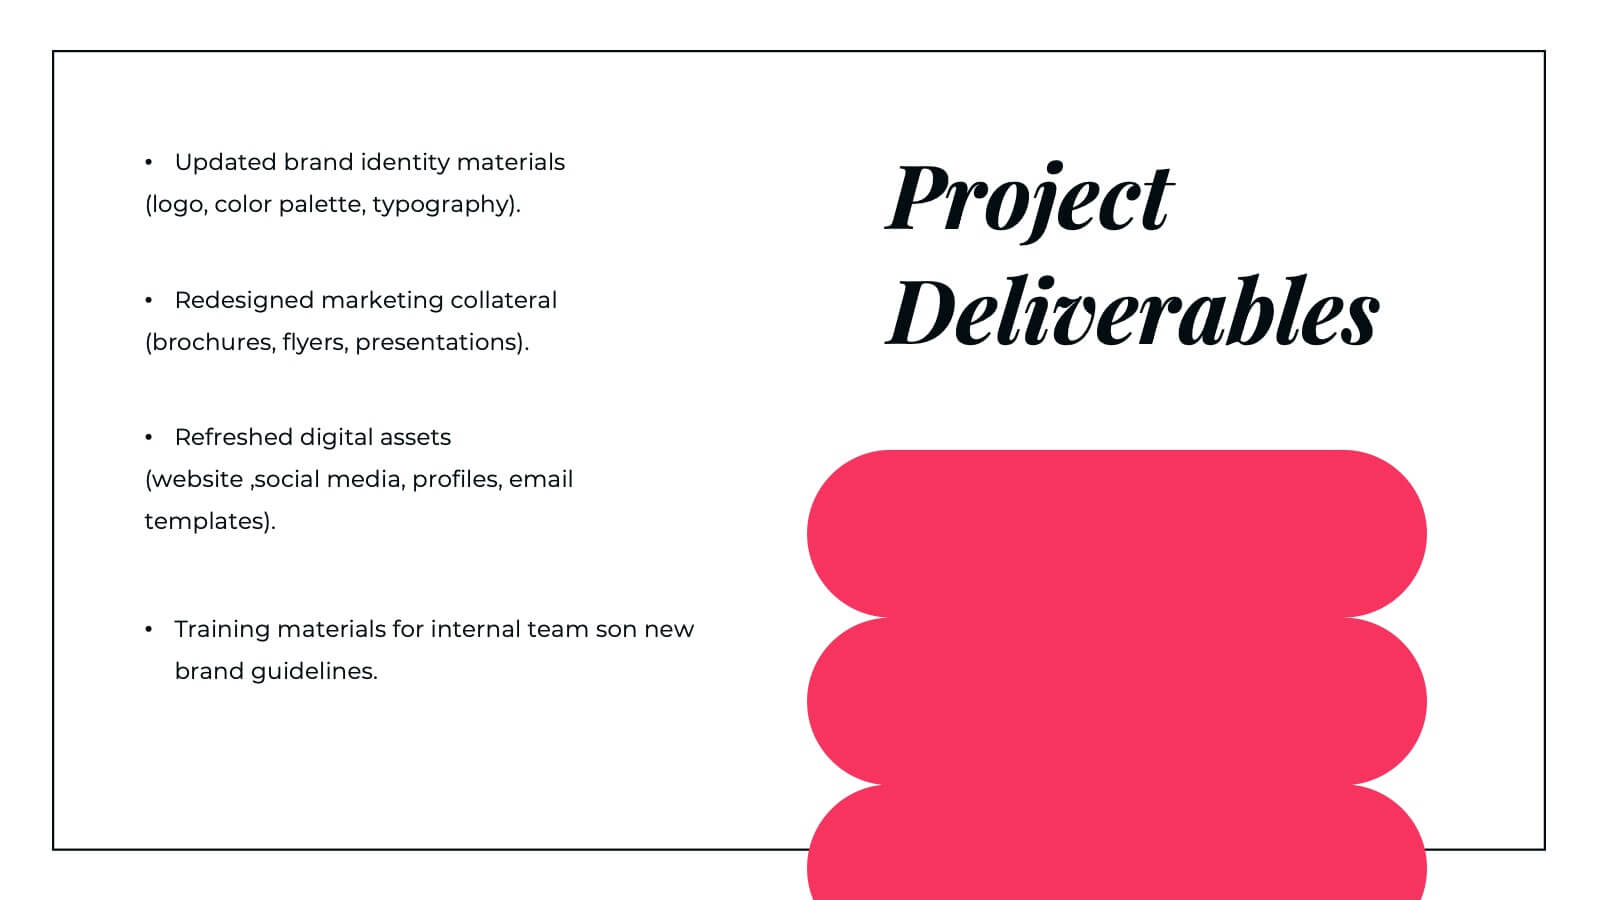
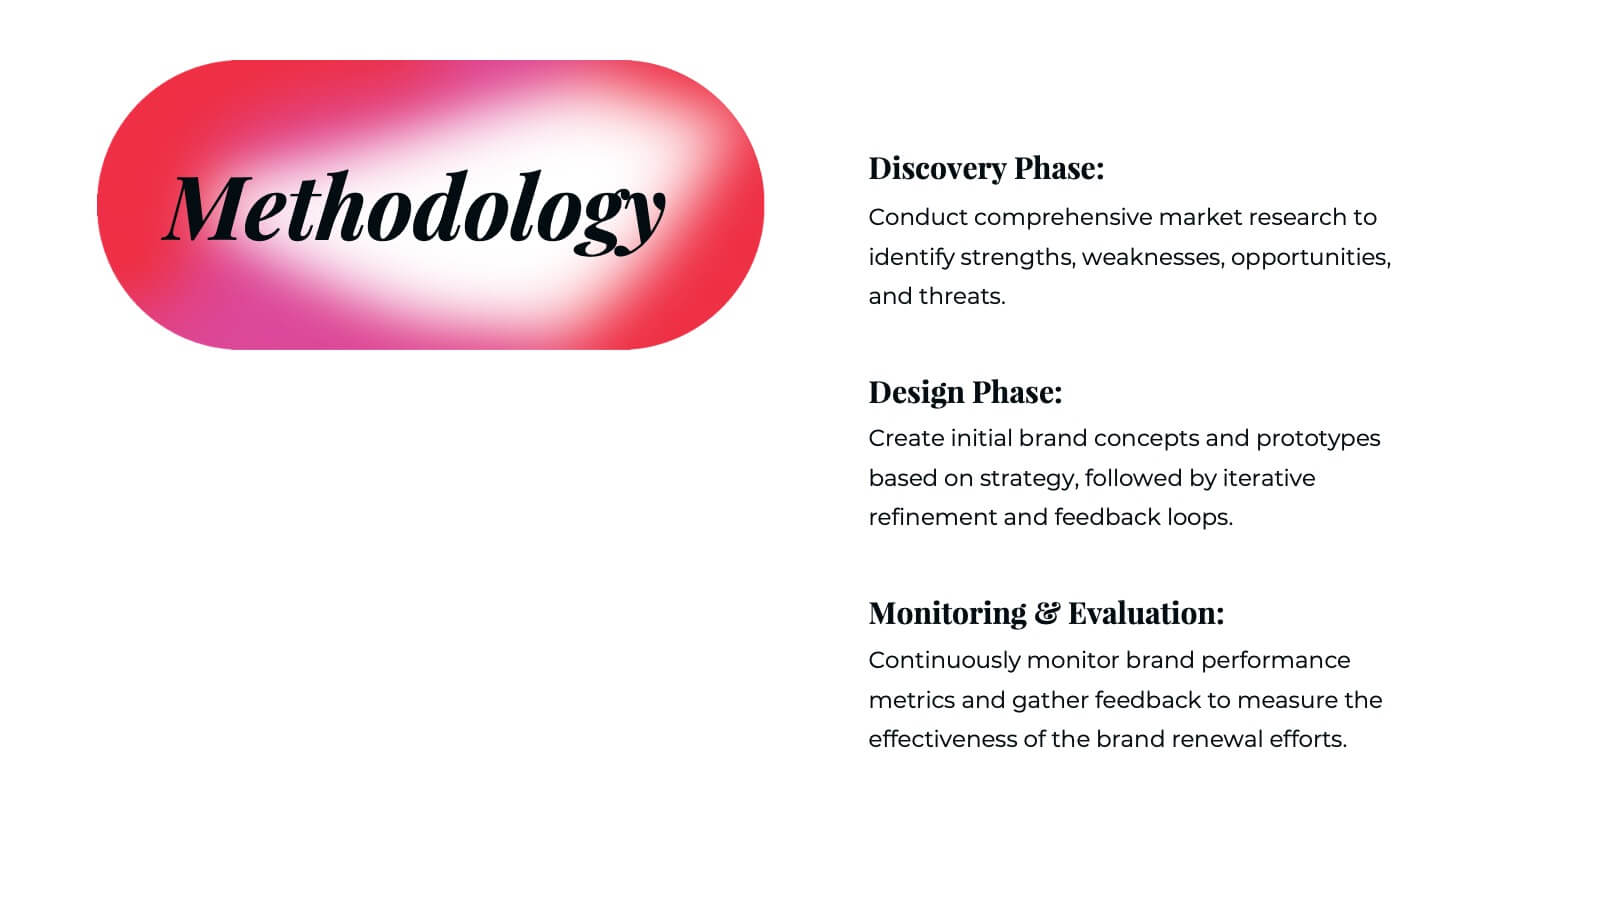
OKR Goal-Setting Framework
Clarify your goals and drive performance with this OKR-based layout that maps Objectives, Key Activities, and Results in a clear, actionable format. Ideal for teams, managers, and performance reviews. Each section is fully editable to match your organizational strategy. Compatible with PowerPoint, Keynote, and Google Slides.


6 diapositivas
Audience Segmentation by Region Presentation
Discover where your audience truly connects with a visually engaging layout that highlights market insights across regions. This presentation helps businesses identify, compare, and target audiences by location for smarter decision-making. Fully customizable and compatible with PowerPoint, Keynote, and Google Slides for seamless professional use and presentation flexibility.


3 diapositivas
Corporate Law and Regulation Guide Presentation
Clarify legal structures with the Corporate Law and Regulation Guide Presentation. This visually balanced design uses legal scale and book icons to symbolize authority, compliance, and fairness. Perfect for illustrating legal frameworks, policy breakdowns, or governance models. Fully editable for PowerPoint, Keynote, and Google Slides.


6 diapositivas
Business Decision Flow Model Presentation
Make smarter choices with this Business Decision Flow Model presentation. Clearly map out key decisions, steps, and potential outcomes using a structured, color-coded flow. Perfect for strategy reviews, team meetings, and executive briefings. Fully editable in Canva, PowerPoint, and Google Slides for seamless customization.


4 diapositivas
Core Company Value Mapping Presentation
Spotlight your business strengths with the Core Company Value Mapping Presentation. This slide design helps you break down and compare key value drivers using a structured visual format—ideal for internal strategy discussions, executive briefings, or stakeholder updates. Highlight metrics, priorities, or departments with side-by-side percentage comparisons and icon indicators. Fully editable in PowerPoint, Keynote, and Google Slides. A must-have for operations teams, consultants, and leadership presentations.


5 diapositivas
Smart Agriculture and Sustainability Trends
Highlight the future of farming with the Smart Agriculture and Sustainability Trends Presentation. This slide features a sleek visual progression of plant growth stages, symbolizing innovation, eco-conscious development, and data-driven agricultural trends. Ideal for sustainability reports, agritech proposals, and environmental briefings. Fully editable and compatible with PowerPoint, Keynote, and Google Slides.

22 diapositivas
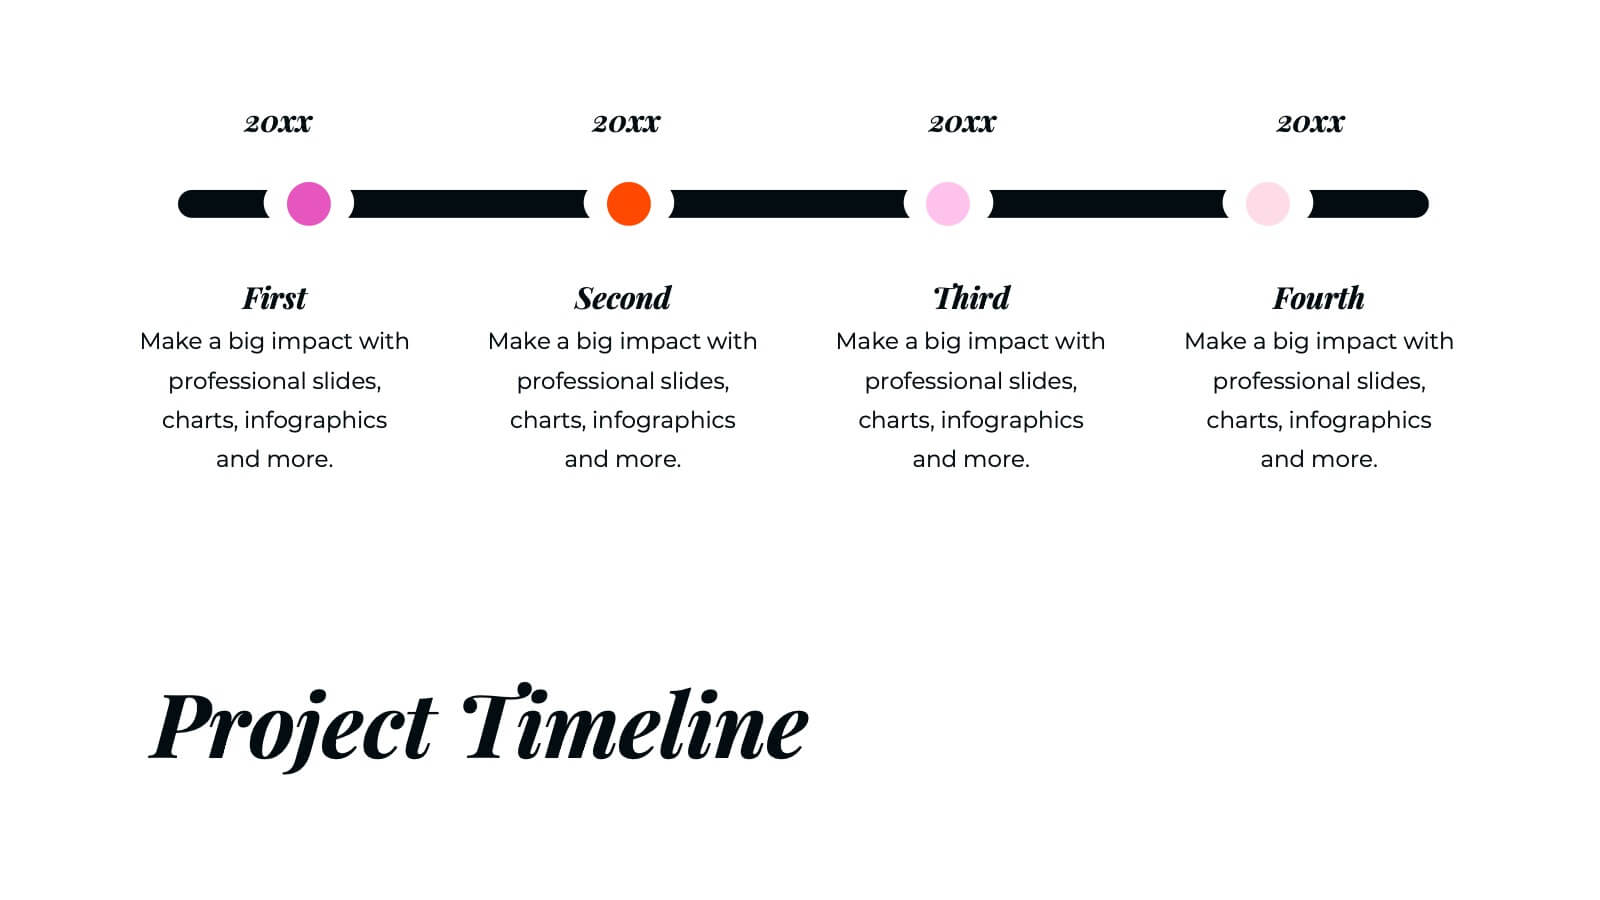
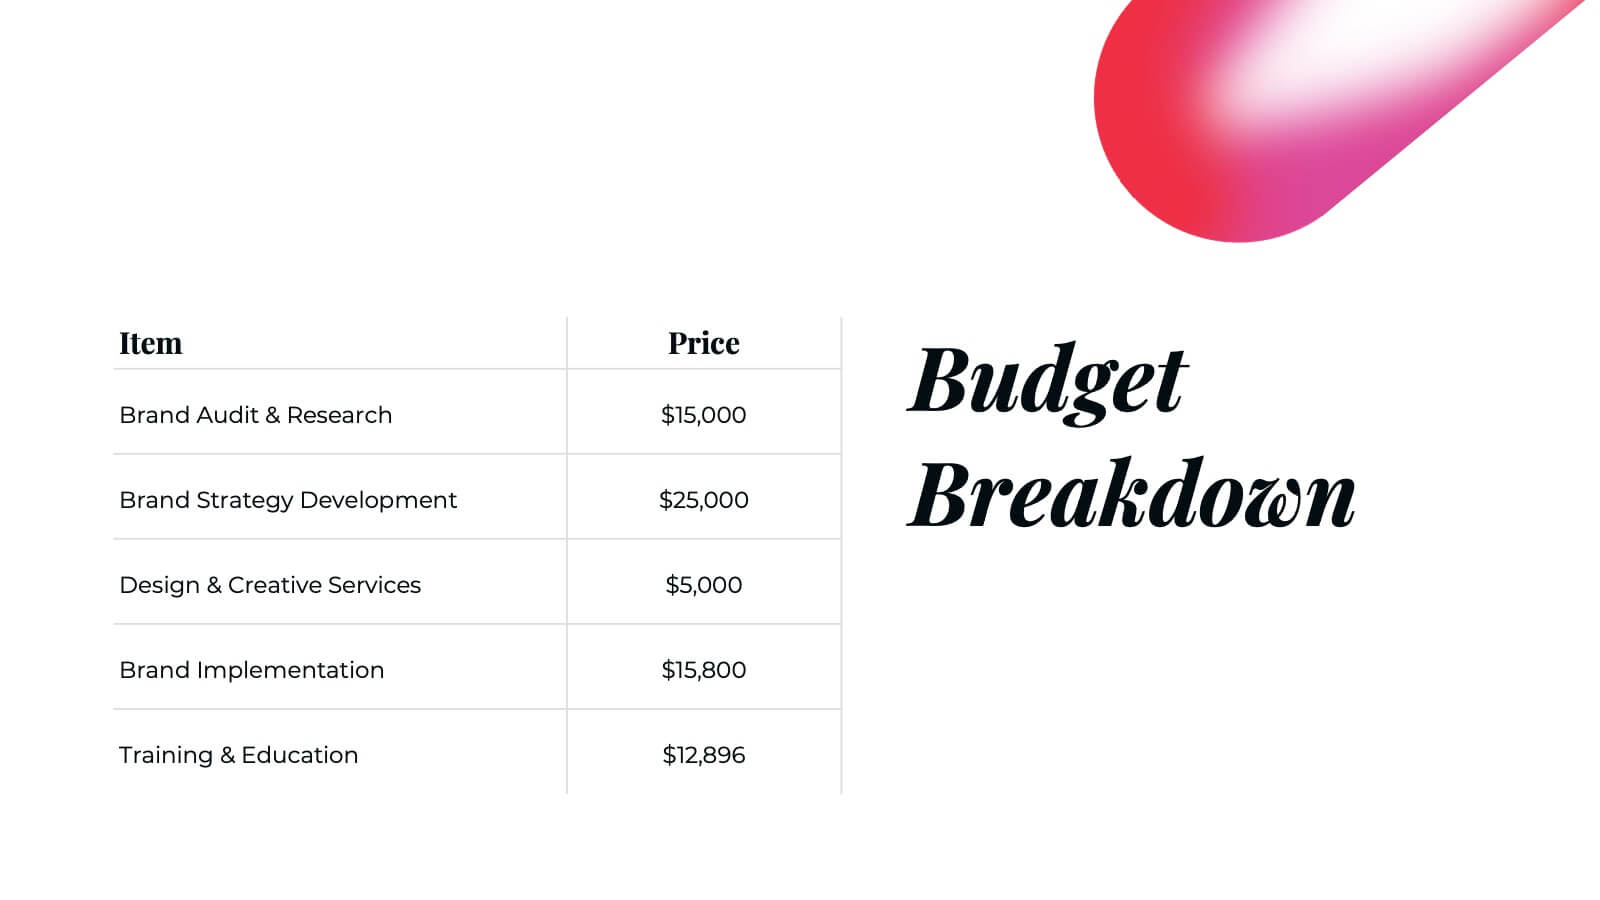
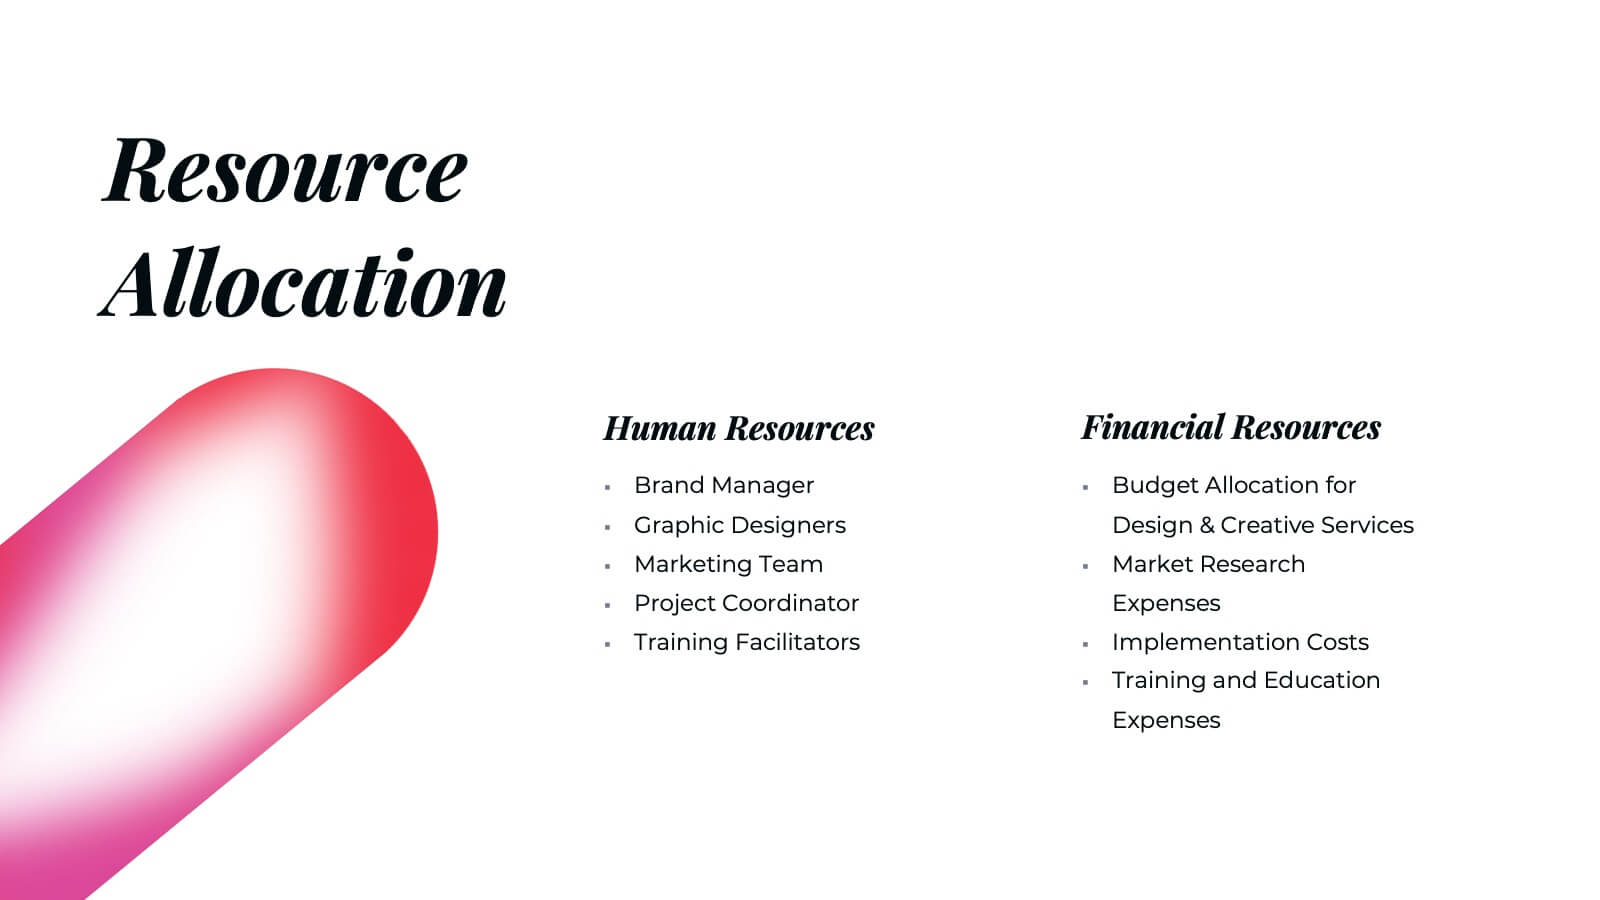
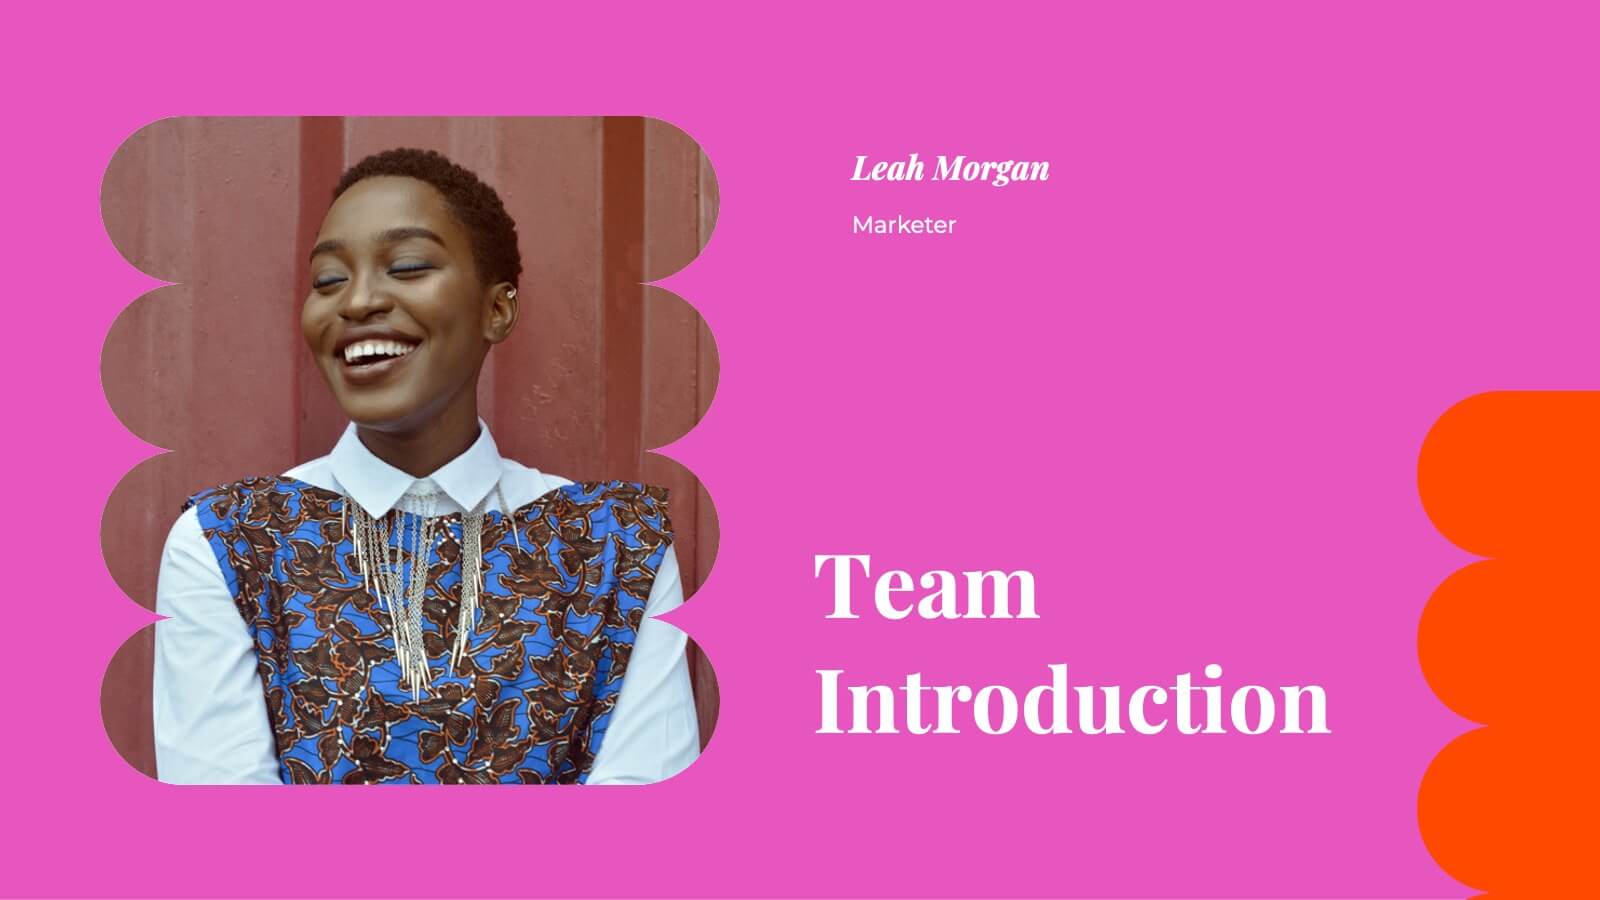
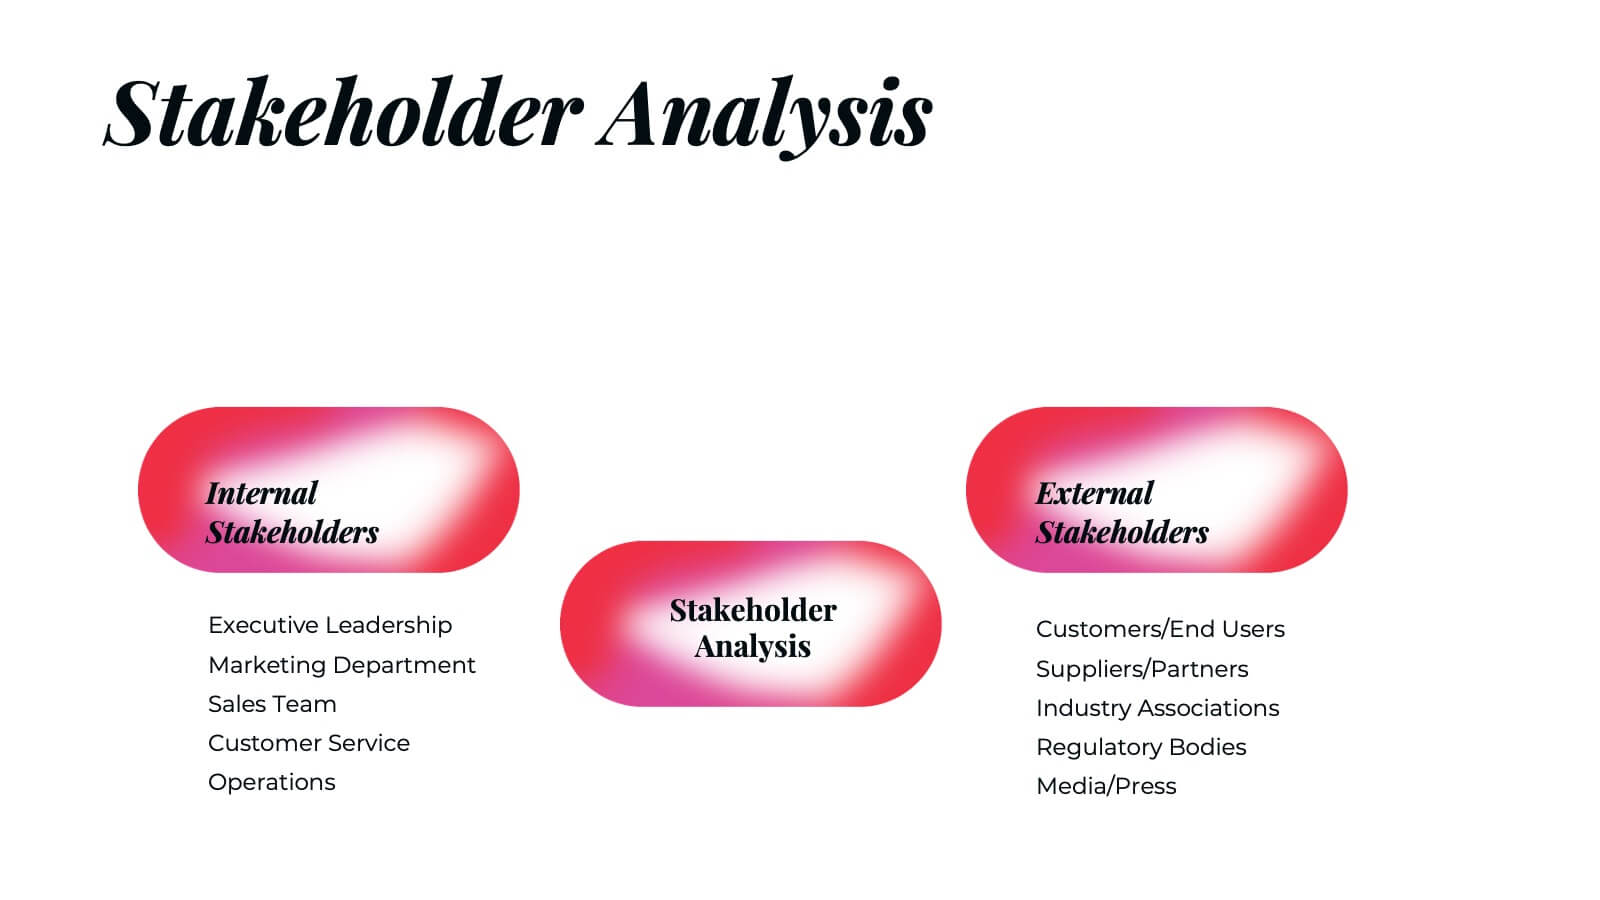
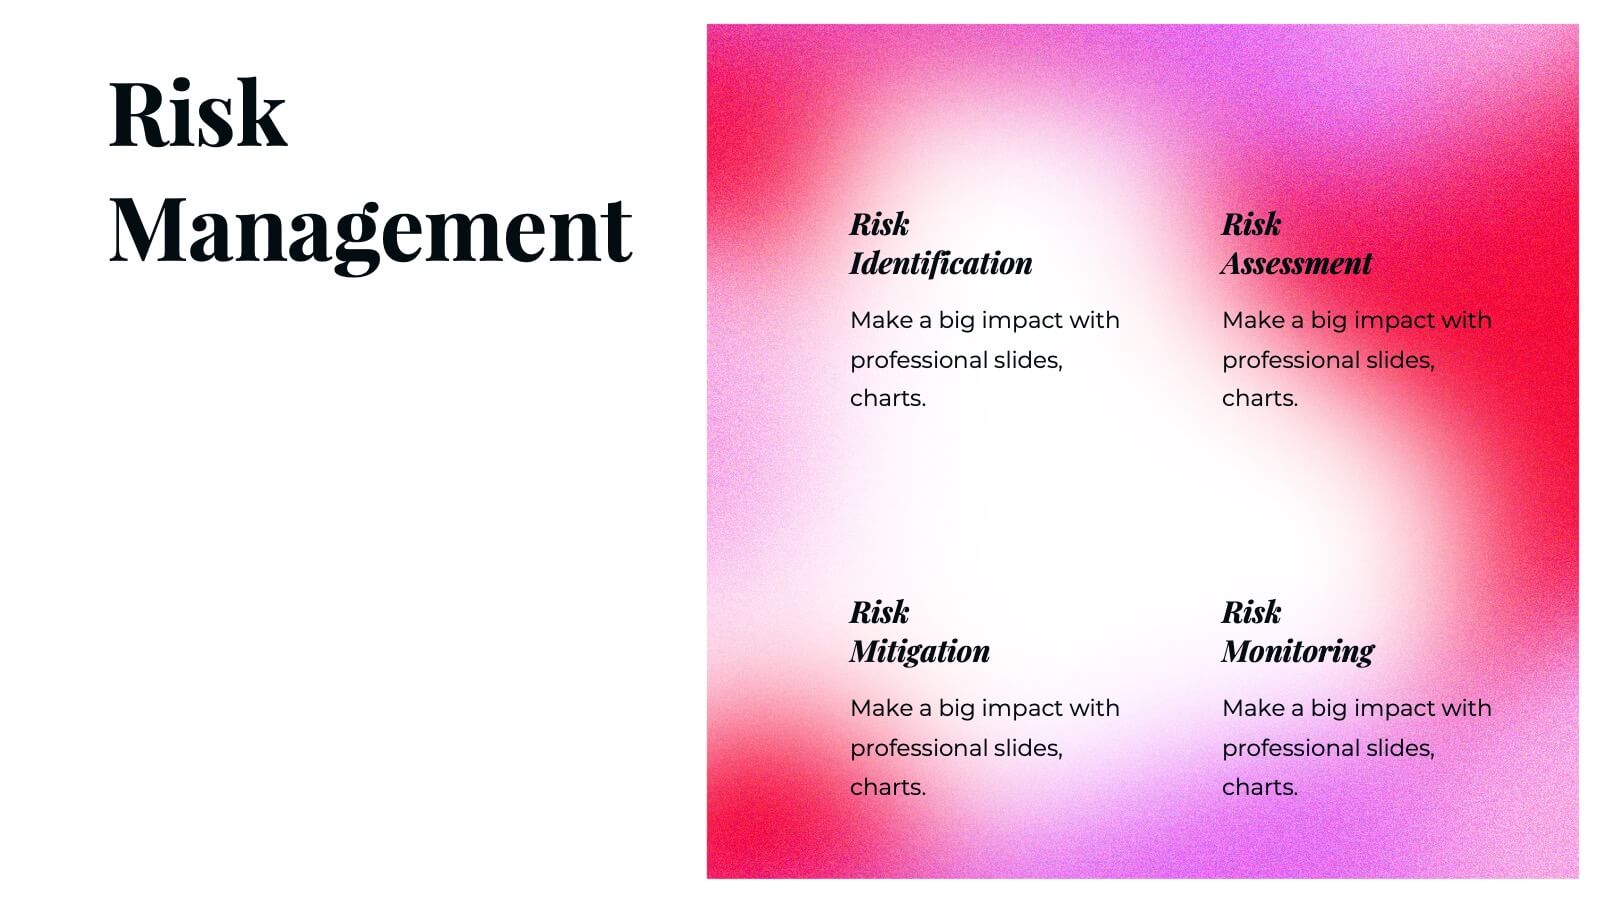
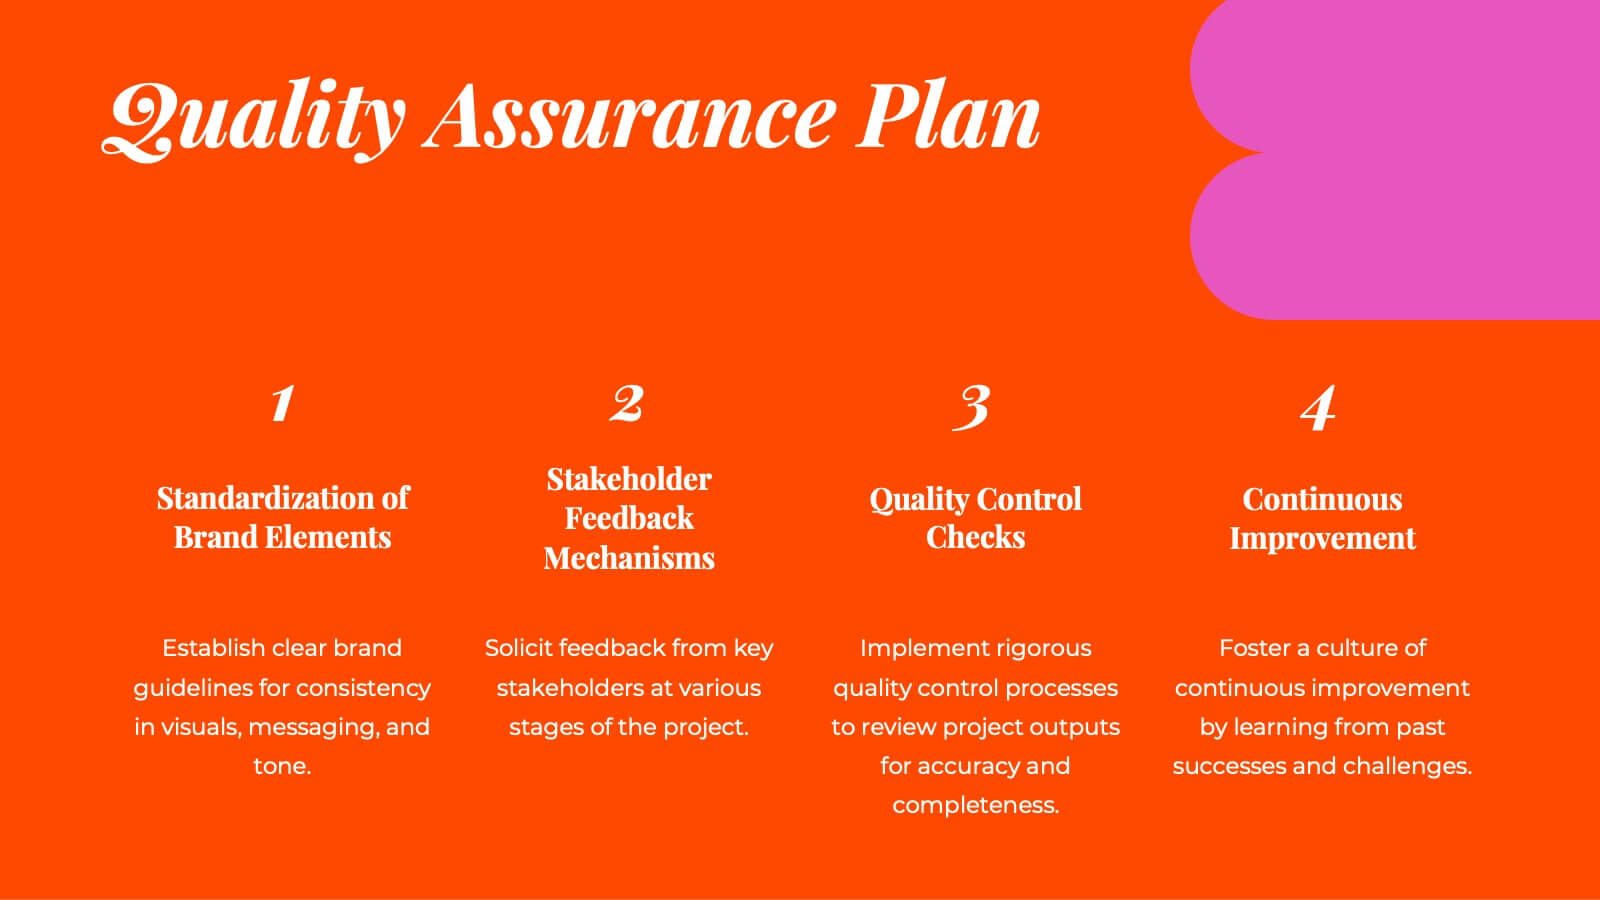
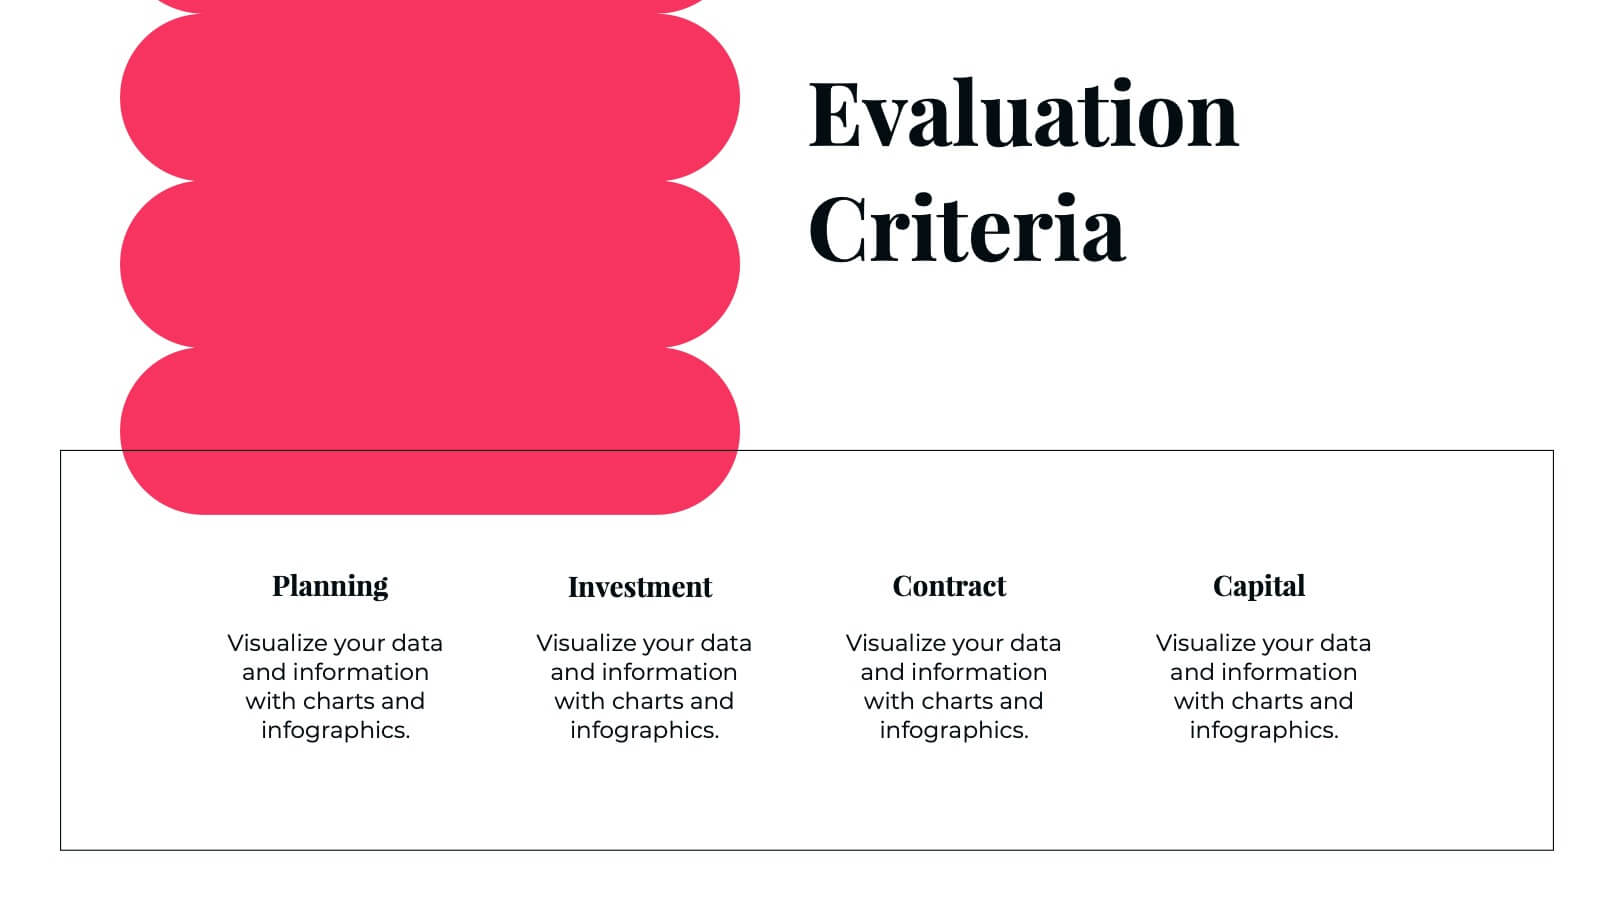
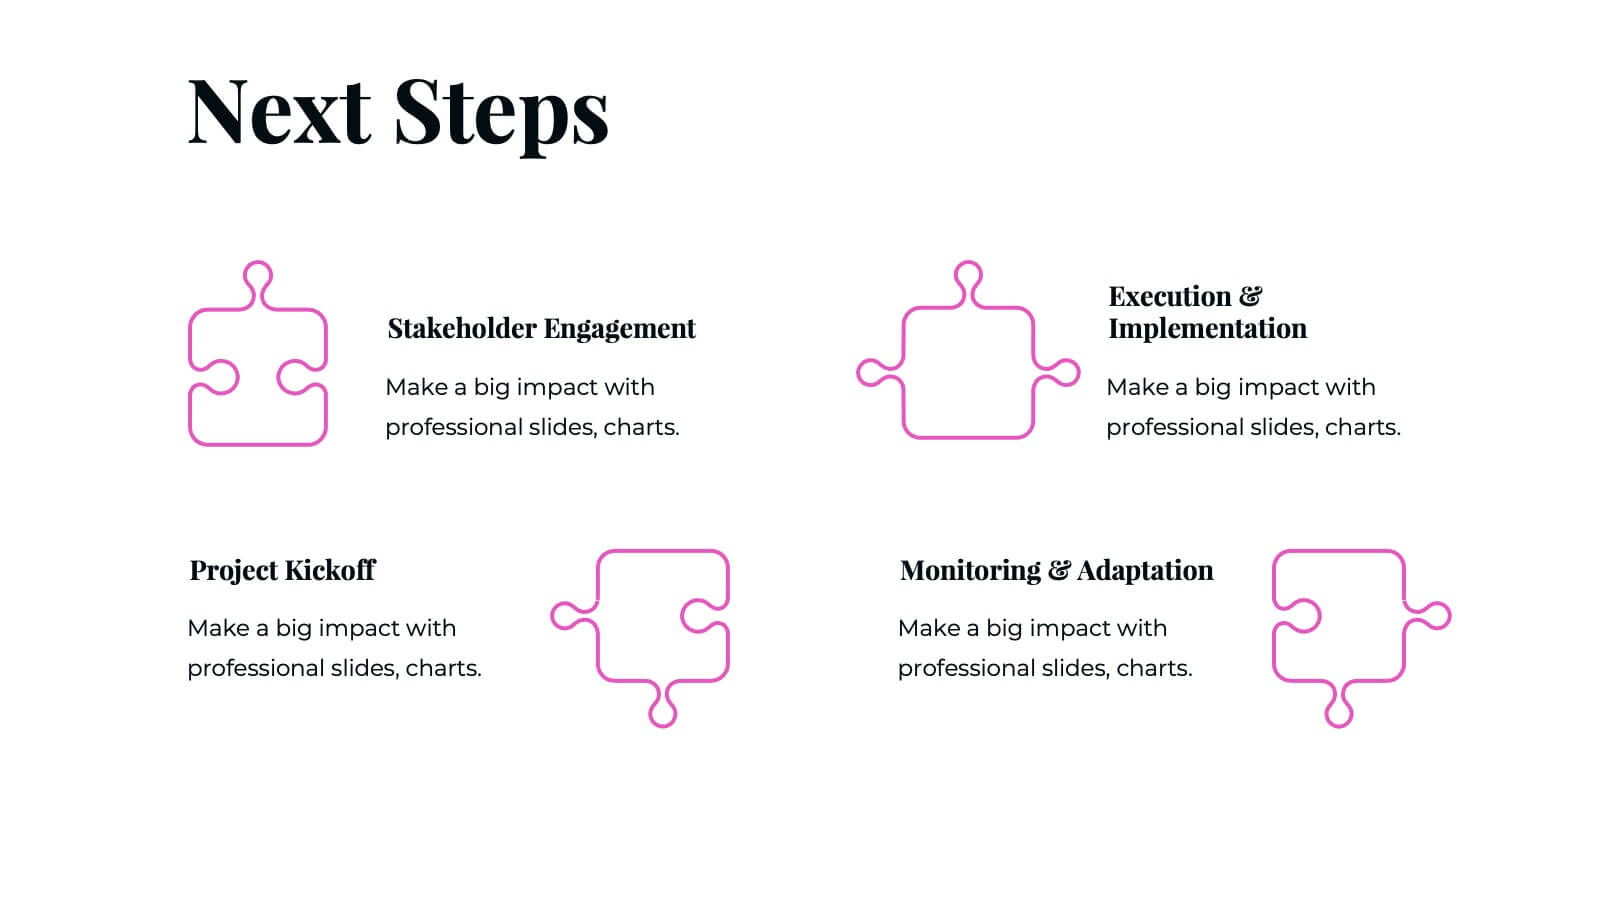
Moonstone Detailed Project Execution Plan Presentation
Create a compelling project execution plan with this vibrant and well-structured presentation template! Covering every key aspect from problem statements and objectives to risk management and quality assurance, this template provides a clear roadmap for your project. It’s perfect for organizing timelines, budget breakdowns, and stakeholder analysis. Compatible with PowerPoint, Keynote, and Google Slides for smooth presentations.


4 diapositivas
Professional Team Member Slides Presentation
Meet your team in a fresh, dynamic way with a layout that highlights personalities, roles, and key contributions at a glance. This presentation helps introduce members clearly, supporting stronger collaboration and professional communication across any project. Fully customizable and compatible with PowerPoint, Keynote, and Google Slides.
6 diapositivas
Task Tracking and Milestone Gantt Overview Presentation
Stay on top of weekly progress with this Task Tracking and Milestone Gantt Overview presentation. Ideal for project managers and teams, it clearly maps tasks by week with visual progress bars and milestone icons. Easily customizable in Canva, PowerPoint, and Google Slides to align with your project timelines and goals.


5 diapositivas
Diversity in Movies Infographics
Diversity In Movies can have a positive impact on society by promoting acceptance of different cultures, and by promoting messages of equality and social justice. This is a visually stunning vertical infographic template that will help you illustrate and communicate important information about diversity in movies. This template includes various design elements such as icons, illustrations, and graphs, all of which can be easily customized to fit your specific needs. With its bold colors and eye-catching design, this template is sure to capture the attention of your audience and make your message stand out.


6 diapositivas
Bubble Map Organizer Infographic
A bubble map, is a visual representation that uses bubbles or circles to display data relationships and patterns. Each bubble in the map represents a data point, and its size and position convey information about various attributes of that data point. This Infographic template is a visual tool that helps organize and represent information in a hierarchical or interconnected manner. The bubble's are used for concepts or topics, and the relationships between bubbles are visually depicted with connecting lines. Compatible with Powerpoint, keynote, and Google Slides. You can choose a color palette that's visually appealing and easily distinguishable.


5 diapositivas
Vaccine Myths Infographic
Vaccine Myths are false or misleading claims about vaccines that can contribute to vaccine hesitancy and misinformation. These infographic templates are designed to debunk common misconceptions and myths surrounding vaccines. These visually appealing and informative templates are ideal for healthcare professionals, educators, and organizations aiming to promote accurate information about vaccines and combat vaccine hesitancy. These infographics aim to educate and empower individuals to make informed decisions about vaccination and contribute to public health efforts. Compatible with Powerpoint, Keynote, and Google Slides.


5 diapositivas
Editable RACI Chart Presentation
Streamline your team’s responsibilities with this clean and easy-to-use RACI chart template! Perfect for project managers, this presentation helps define who is Responsible, Accountable, Consulted, and Informed for each task. Simplify workflows, boost collaboration, and keep everyone aligned. Fully editable and compatible with PowerPoint, Keynote, and Google Slides for seamless customization.


7 diapositivas
Asia Map Economy Infographic
Delve into the economic landscape of Asia with our series of infographic slides designed to outline key economic indicators across the continent. These templates provide a comprehensive visual representation of various economic data, including GDP growth, trade volumes, and sector-specific performance, making them invaluable for analysts, educators, and business professionals. Each infographic features a detailed map of Asia, annotated with data points and statistics that highlight economic trends and disparities between nations. The use of contrasting colors and clear, legible fonts ensures that the information is accessible and engaging. Graphs and charts are integrated within the map, offering a dynamic overview of the economic health of the region. These templates are fully customizable, allowing you to tailor the content to specific presentations or reports. Whether used in academic environments, corporate settings, or public presentations, these slides help to communicate complex economic concepts in a visually appealing and straightforward manner.


5 diapositivas
Visual Decision-Making with Harvey Balls Presentation
Simplify complex evaluations with this Harvey Ball comparison chart. Ideal for product comparisons, feature assessments, or decision-making matrices, this slide presents up to 6 items and 4 features with intuitive visual cues. Fully editable in PowerPoint, Keynote, or Google Slides, it’s perfect for business, marketing, and strategy teams seeking clear and compelling insights.


8 diapositivas
Travel Planning and Itinerary Overview Presentation
Pack your bags—this stylish template makes mapping adventures a breeze! Designed for trip overviews and itinerary planning, it includes world maps, must-see lists, weather forecasts, and schedules all in one layout. Perfect for travel agencies, bloggers, or wanderlust planners. Fully compatible with PowerPoint, Keynote, and Google Slides for easy customization.


12 diapositivas
Real Estate House Market Trends Presentation
Analyze Real Estate House Market Trends with this insightful presentation template. Featuring a house-shaped hexagonal layout, this design helps illustrate key factors such as market demand, property values, investment opportunities, and housing policies. Ideal for real estate professionals, investors, and analysts looking to present market insights with clarity and impact. Fully customizable and compatible with PowerPoint, Keynote, and Google Slides.