
Features
- 6 Unique slides
- Fully editable and easy to edit in Microsoft Powerpoint, Keynote and Google Slides
- 16:9 widescreen layout
- Clean and professional designs
- Export to JPG, PDF or send by email


Do you have any questions?
Recommend

21 slides
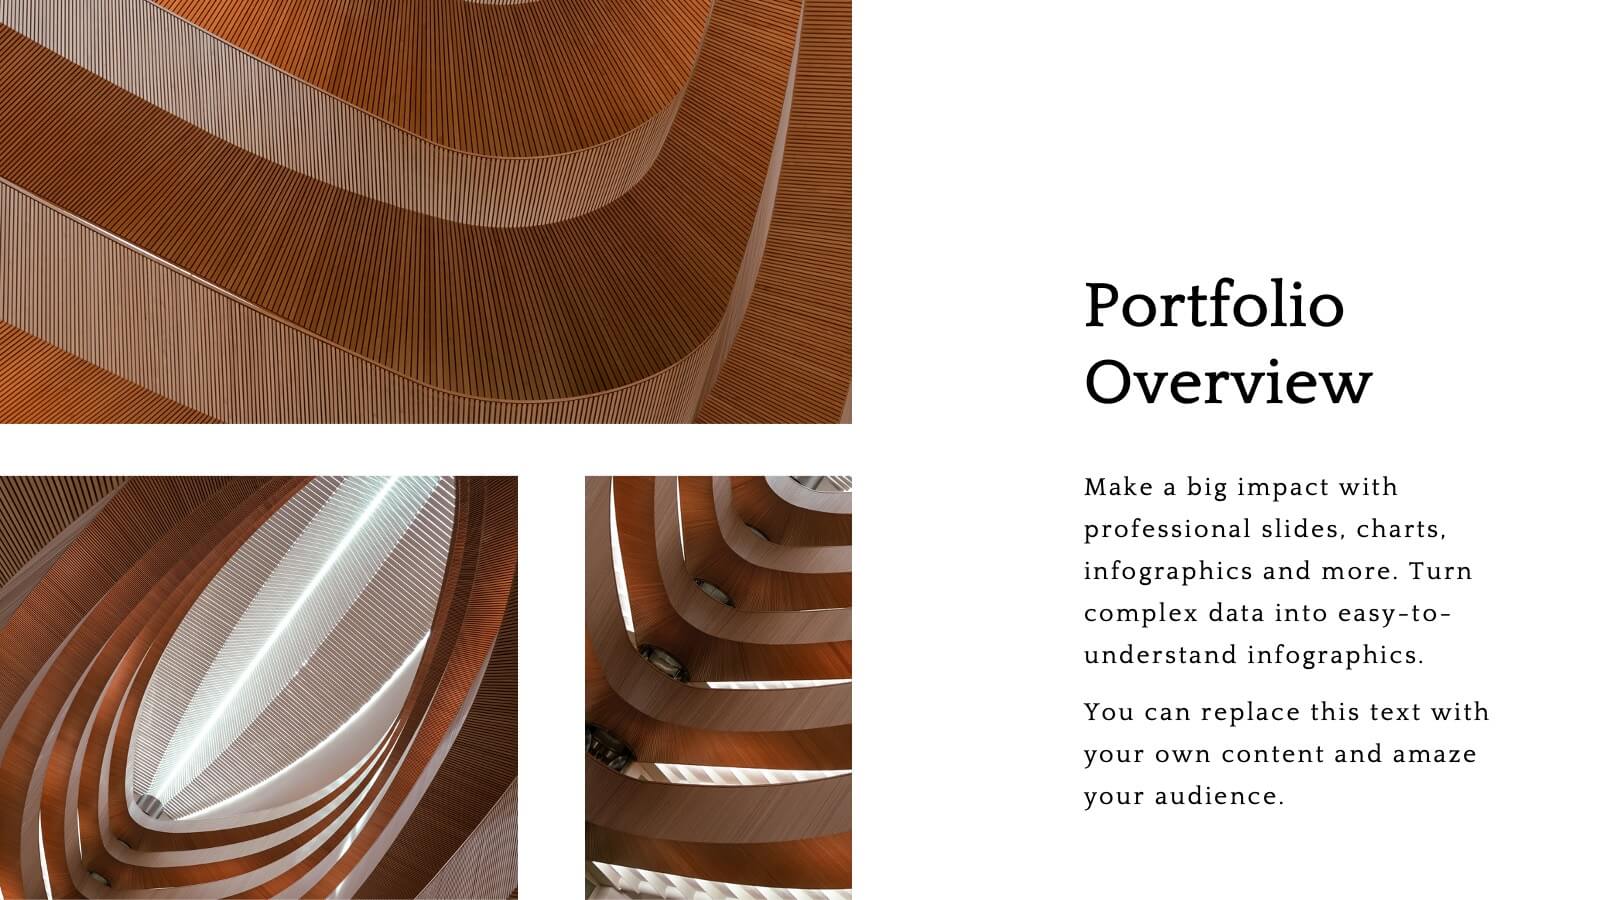
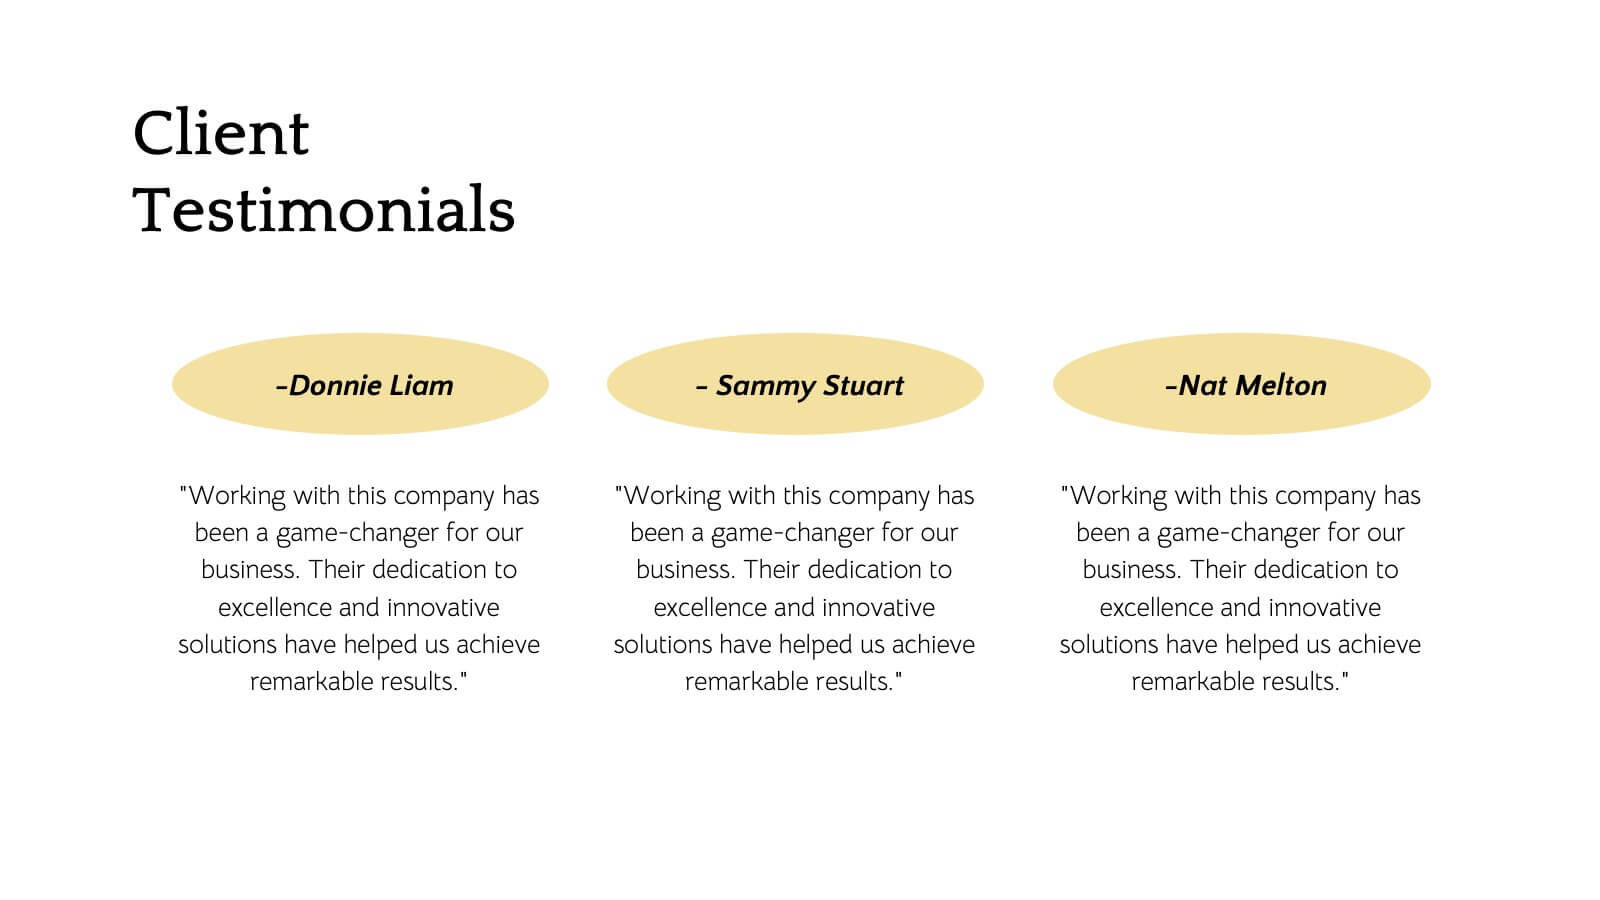
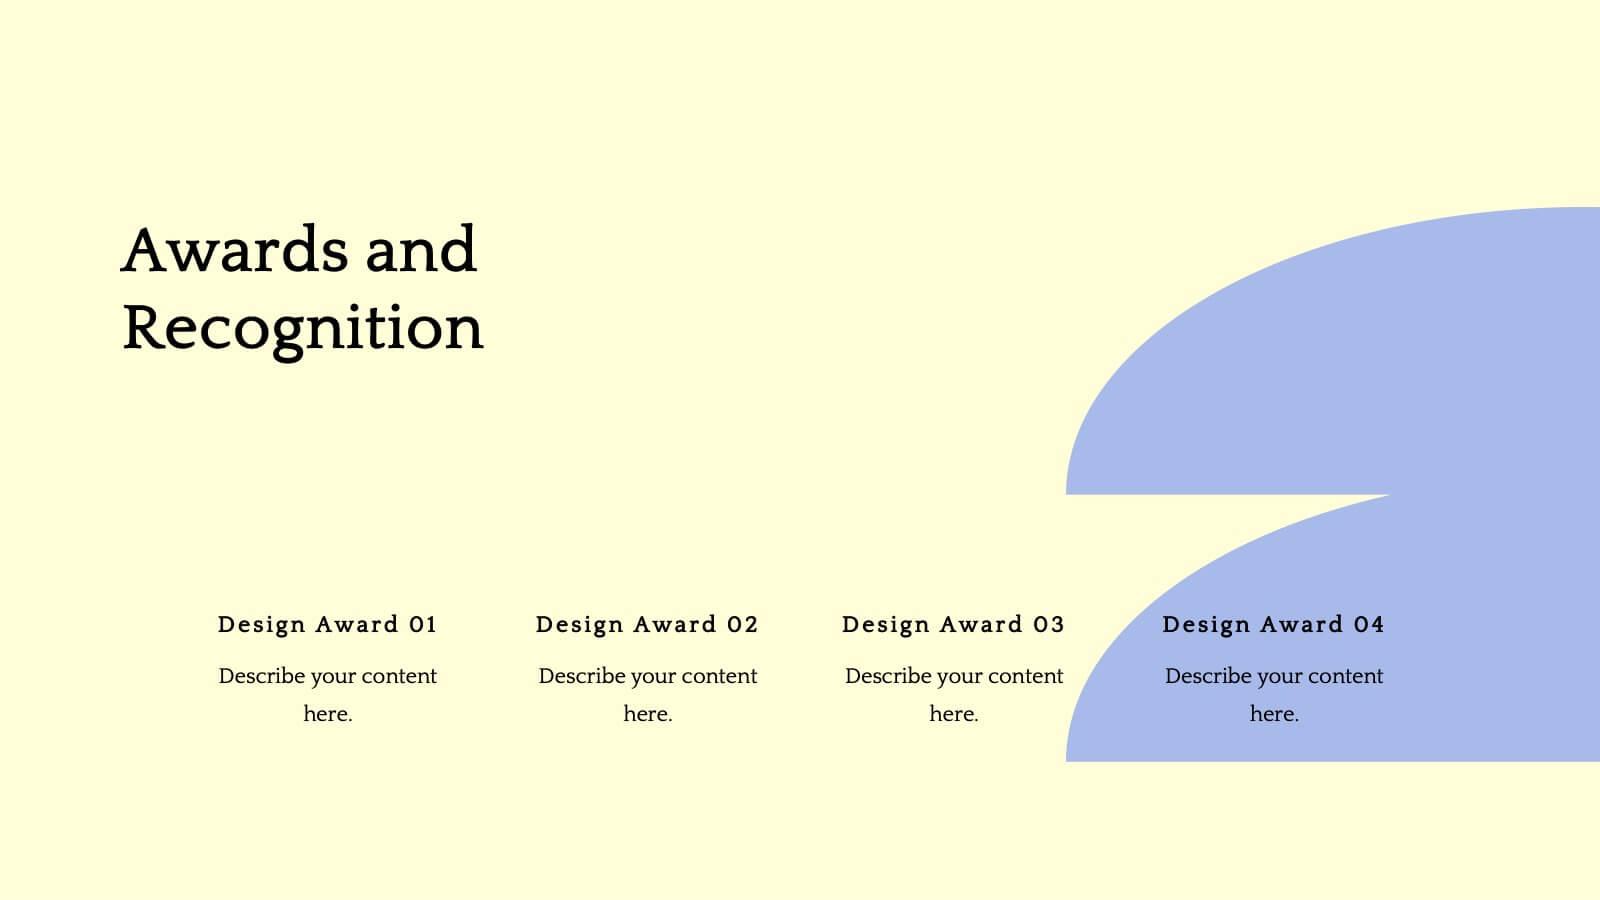
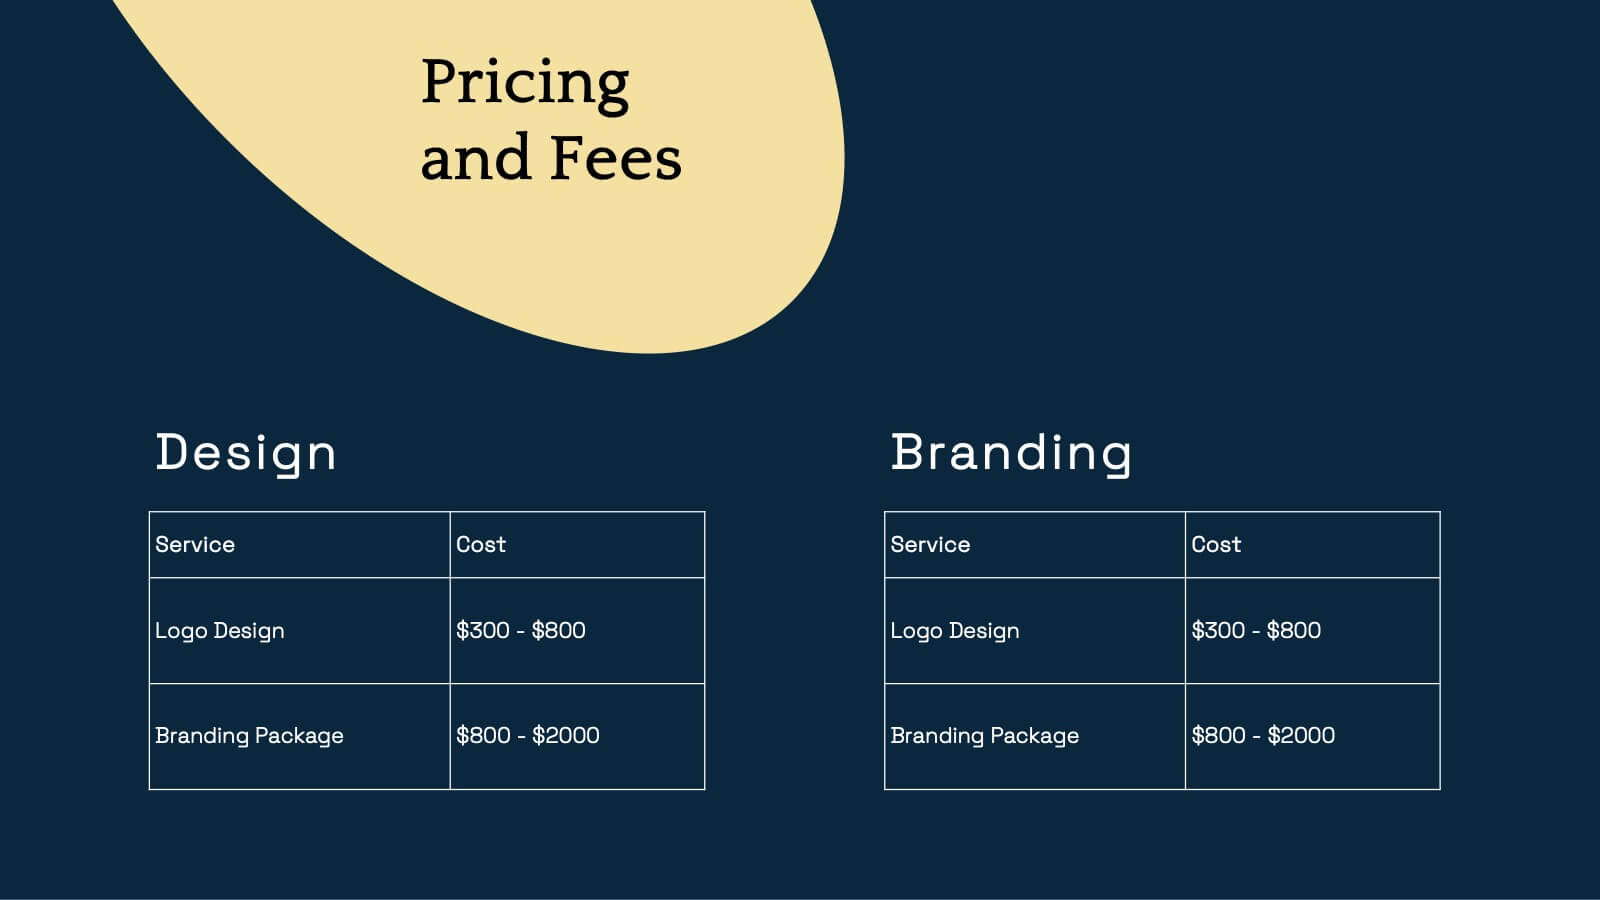
Flare Creative Portfolio Presentation
Showcase your creative work with this elegant portfolio template! Perfect for highlighting projects, client testimonials, and services offered. Ideal for artists, designers, and creatives aiming to impress clients and collaborators. Compatible with PowerPoint, Keynote, and Google Slides, this template ensures your portfolio is clear, professional, and visually stunning. Make your work shine!


20 slides
Unity Sales Proposal Presentation
Boost your sales strategy with this comprehensive sales proposal template! Perfect for outlining objectives, processes, and customer value propositions. Ideal for sales teams aiming to close deals and impress clients. Compatible with PowerPoint, Keynote, and Google Slides, this template ensures your sales presentations are clear, persuasive, and professional. Drive your sales success today!


7 slides
Law Infographics Presentation Template
Featuring our Law Infographic template it is a modern and stylish template for making a presentation about law. It comes with a clean design, typography and plenty of space for annotations and is compatible with powerpoint. This template is suitable for a presentation about business, management, finance or marketing. It contains a one page design, illustrations and many different elements to help you build a strong and compelling presentation. Essential and easy to use, this law Infographic template is a great tool for anyone who wants to make an attractive and professional presentation.


5 slides
Global Warming Activism Infographics
Dive into environmental advocacy with the global warming activism infographics template, steeped in earthy tones of green and brown, reflecting our planet's natural palette. This vertical collection, abundant with nature and animal-themed elements, is a tool for activists, and NGOs driving change. It melds visuals with stark realities, using striking graphics, icons, and adaptable image placeholders to spotlight climate change's impacts and the urgent strides needed for ecological preservation. Compatible with Powerpoint, Keynote, and Google Slides. By simplifying complex information, it empowers community engagement and fosters a united front for global healing efforts.


6 slides
Enterprise IT Infrastructure Architecture
Showcase layered IT systems with the Enterprise IT Infrastructure Architecture Presentation. This vertical stacked diagram helps you illustrate five key components clearly, from top-level strategy to foundational systems. Ideal for IT teams, architects, and consultants. Fully editable in PowerPoint, Keynote, and Google Slides for seamless customization and professional delivery.


23 slides
Imaginix Digital Strategy Presentation
Plan and execute your business strategy with this sleek and modern template. Covering key areas such as SWOT analysis, competitive landscape, performance metrics, and implementation plans, it’s perfect for professionals aiming to optimize digital initiatives. Fully customizable and compatible with PowerPoint, Keynote, and Google Slides.


6 slides
Financial Summary Infographic
The series presented showcases various slide templates tailored for enhancing sales team strategies and communication. Each slide is crafted to assist sales professionals in detailing team structures, sales goals, performance metrics, and strategic initiatives effectively. Utilizing vibrant color blocks and streamlined design elements, these templates make complex sales data approachable and engaging, facilitating clear and impactful presentations. The collection is designed with adaptability in mind, incorporating elements that can be easily customized to fit different team needs and company branding. These include comparative layouts for benchmarking, timeline formats for showcasing sales cycles, and diagrammatic representations for visualizing sales processes and results. Perfect for internal meetings, sales training sessions, and stakeholder presentations, these templates serve as essential tools for sales leaders to convey their team’s progress, celebrate wins, and strategize for future sales endeavors.


4 slides
Corporate Hierarchy Levels Diagram Presentation
Visualize organizational structures clearly with this Corporate Hierarchy Levels Diagram Presentation. Designed for showcasing leadership flow, team divisions, or reporting relationships, each slide features a simple tiered layout with editable icons and placeholders. Great for business planning, team introductions, or org chart overviews. Fully customizable in PowerPoint, Keynote, Canva, and Google Slides.


7 slides
Europe Market Map Infographic
Journey through the intricate tapestry of the European market with our exquisitely crafted map infographic. Set against the refreshing backdrop of white, complemented by the depth of green and blue, our template encapsulates the multifaceted nature of Europe's vibrant market landscape. Augmented with precise infographics, symbolic icons, and country-specific image placeholders, it serves as an insightful guide to Europe's economic terrains. Flawlessly configured for Powerpoint, Keynote, or Google Slides. A priceless asset for business strategists, marketers, or any organization tapping into the European market. Navigate with insight; let every slide be a doorway to European market opportunities.


7 slides
Consecutive Numbers Infographic
Dive into the world of mathematics with our Consecutive Numbers Infographic! Employing an array of serene blues and greens, this visually appealing tool breaks down the concept of consecutive numbers in a fun and comprehensible manner. It's an educator's dream, designed to captivate and engage, making the topic accessible for students of various age groups. Beyond the classroom, it's a handy reference for professionals and enthusiasts alike. With compatibility spanning PowerPoint, Keynote, and Google Slides, this infographic is poised to elevate any presentation, workshop, or lecture it graces.


6 slides
Work From Home Opportunities Infographic
Work-from-home opportunities refer to job positions, projects, or tasks that allow individuals to work remotely from their own homes or any other location outside of a traditional office setting. This infographic template is a visual representation that provides information about different types of remote job opportunities and the benefits of working from home. This template can be divided into sections, to highlight specific categories of remote jobs. The images and icons are included to convey the idea of working from home, such as a home office setup or a person working on a laptop. This is compatible with Powerpoint, Keynote, and Google Slides.


6 slides
Industry Analysis with Porter's Forces Presentation
The Industry Analysis with Porter's Forces Presentation offers a clean and strategic layout for visualizing competitive dynamics. This deck illustrates the five forces—Buyers, Suppliers, Competitors, Substitutions, and New Entry—in a semi-circular flow that makes relationships easy to understand. Each force is paired with editable text and icons for clarity. Ideal for market research, business strategy, or consulting work. Fully compatible with PowerPoint, Keynote, and Google Slides.


7 slides
Lean Business Model Infographic
Step into the dynamic world of lean startup methodology with our lean business model infographic. Utilizing a striking palette of oranges, blacks, and other vivid colors, this infographic simplifies the intricate components of the lean canvas. It's an invaluable asset for entrepreneurs, business educators, and startup enthusiasts. By offering a bird's-eye view of a startup's proposition, it ensures stakeholders align their strategies efficiently. Regardless of the platform - be it PowerPoint, Keynote, or Google Slides - this infographic seamlessly adapts, enhancing your presentation's professional appeal.


5 slides
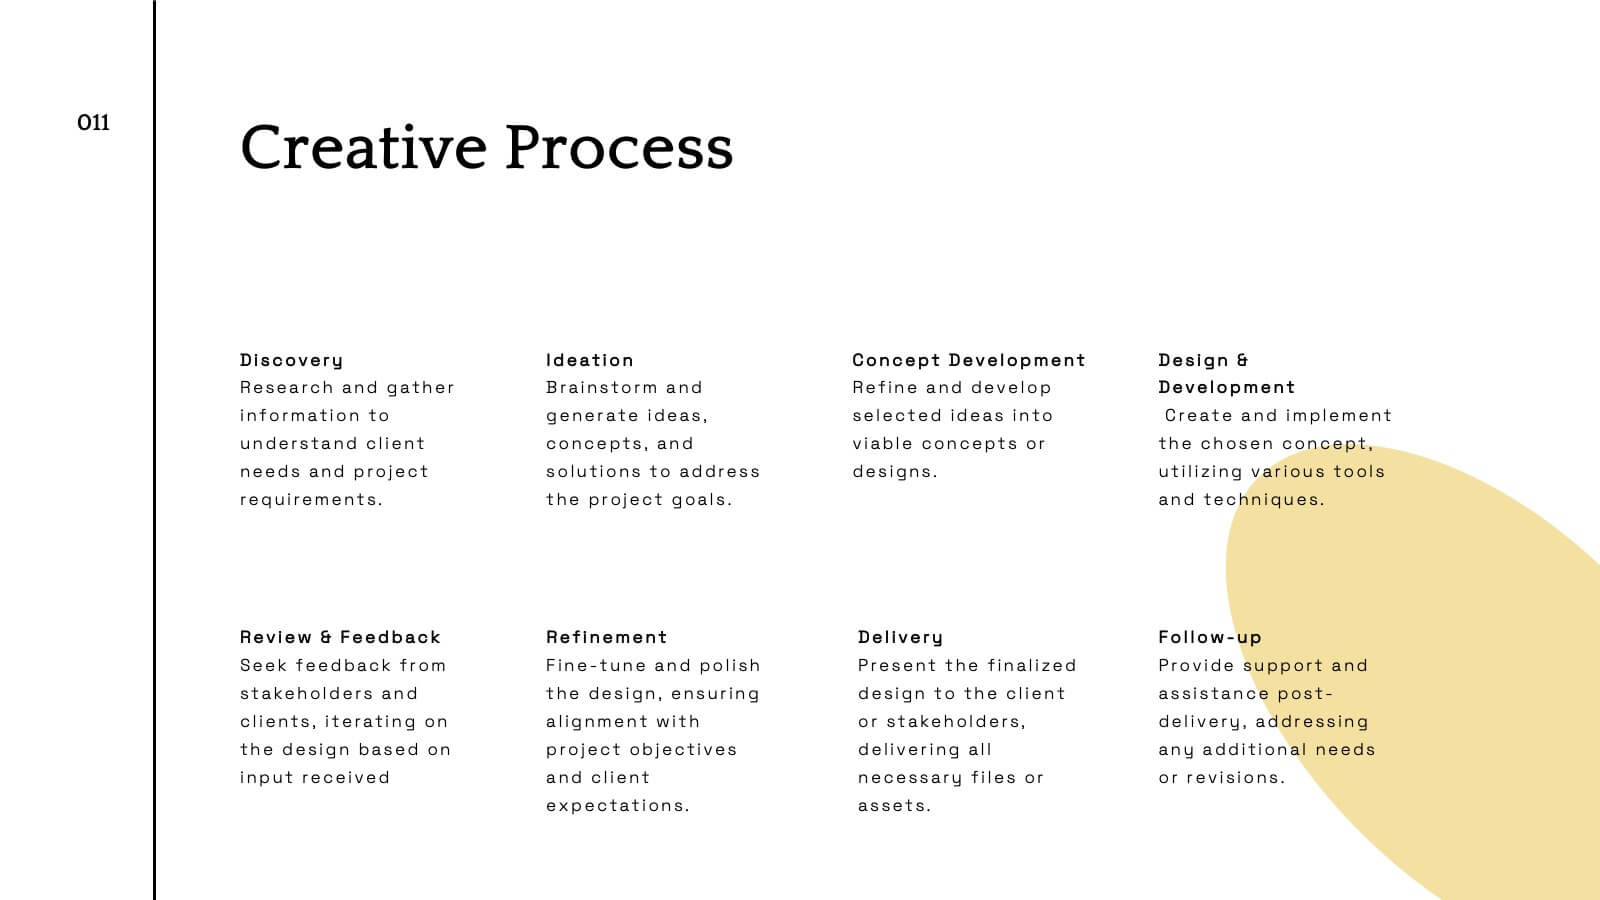
Project Management Framework Presentation
Master the art of project management with our Project Management Framework template. This design is tailored to guide you through every phase of your project, ensuring a smooth and structured execution. The template is perfect for visually representing processes within PowerPoint, Keynote, and Google Slides, providing a clear pathway from project initiation to completion. Ideal for project managers looking to streamline their strategies and enhance project communication.


3 slides
Credit Card Comparison Chart Presentation
Make financial decisions feel clearer and more visual with this clean comparison-focused layout designed to highlight key features side by side. It helps you simplify data, explain differences, and guide smarter choices with confidence. Fully editable and compatible with PowerPoint, Keynote, and Google Slides.


7 slides
Veterinary Hospital Infographic
A veterinary hospital, is a medical facility that provides healthcare services to animals, primarily focusing on the diagnosis, treatment, and prevention of illnesses and injuries in pets and other animals. This vibrant and heartwarming infographic template brings to life the journey of our beloved pets through the lens of a caring veterinary hospital. Compatible with Powerpoint, Keynote, and Google Slides. This template celebrates the love, care, and healing that happens every day at veterinary hospitals. This infographic is a haven where wagging tails and purring hearts find comfort and a reason to smile.


6 slides
Territorial Presence Across the Globe Presentation
Visualize your worldwide footprint with this territorial presence map. Highlight key regions using color-coded markers linked to strategic points, teams, or operations. Ideal for corporate overviews, investor updates, and expansion plans. Fully editable and easy to customize in PowerPoint, Keynote, or Google Slides for impactful global presentations.