


Features
- 10 Unique slides
- Fully editable and easy to edit in Microsoft Powerpoint, Keynote and Google Slides
- 16:9 widescreen layout
- Clean and professional designs
- Export to JPG, PDF or send by email


Do you have any questions?
Recommend


5 slides
Geographic Oceania Overview Presentation
Visualize your regional data with a sleek, easy-to-read map highlighting key areas across Oceania. Perfect for presenting geographic insights, business distribution, or market trends, this clean layout ensures every detail stands out clearly. Fully compatible with PowerPoint, Keynote, and Google Slides for simple editing and professional presentations.


5 slides
Safety Compliance Overview Presentation
Keep your organization protected and compliant with this modern and visual presentation design. Ideal for outlining safety protocols, training programs, and regulatory standards, it helps simplify complex processes into clear, engaging visuals. Fully customizable and compatible with PowerPoint, Keynote, and Google Slides for professional and polished presentations.


5 slides
Team Communication and Info Sharing Presentation
Keep your team aligned and informed with this clear, visual communication flow template. Designed to illustrate how information moves between individuals or departments, it helps teams optimize collaboration and transparency. Great for onboarding, project handoffs, or workflow discussions. Fully compatible with PowerPoint, Keynote, and Google Slides.


7 slides
Business Puzzle Infographic Presentation
A Puzzle Piece Infographic is great for visualizing and communicating complex topics, such as the order of steps to solve a problem or a methodical process. This template is great if you want to show your audience how different topics relate to each other, or if you want to illustrate how information fits together. This infographic will allow you to showcase your data and information in a fun, visual way. The puzzle design will help you organize information for your audience to easily understand. This template is compatible with Powerpoint, keynote and google slides, making it easy to edit!


6 slides
Social Comparison Infographics
The "Social Comparison" infographic template is a thought-provoking and detailed tool, expertly crafted for PowerPoint, Keynote, and Google Slides. This template is particularly useful for psychologists, sociologists, and educators who wish to explore and present the concept of social comparison, its impacts on individual behavior, and its role in society. This template delves into the various dimensions of social comparison, including upward and downward comparisons, the influence on self-esteem, and the effects on social cohesion. It's structured to provide a nuanced understanding of how individuals assess themselves relative to others, making it a valuable resource for educational seminars, psychological workshops, or social research presentations. The design is both engaging and reflective, with a color scheme that is subtle yet impactful. This ensures the presentation is not only visually appealing but also resonates with the complex and multifaceted nature of social comparison. Whether used in academic settings, counseling sessions, or social research meetings, this template ensures that the intricacies of "Social Comparison" are presented in a clear, insightful, and visually compelling manner.


8 slides
Geographic South America Template Presentation
Explore your data through a clean, professional map that highlights key insights and regional details across South America. Ideal for presenting demographics, business distribution, or performance metrics, this design combines clarity with impact. Fully compatible with PowerPoint, Keynote, and Google Slides for easy editing and seamless presentation.


2 slides
Office Interview Scenes Illustrations
Elevate your Interview experience with our office interview scenes illustrations pack! This is a burst of high-energy and lightheartedness that infuses the often nerve-wracking interview process with a touch of excitement and fun. These illustrations seamlessly fit into PowerPoint, Google Slides, and Keynote. Add a splash of color and playfulness to the serious nature of interviews, creating an environment where both interviewers and candidates can feel at ease!


5 slides
Marketing Concepts Infographics
Marketing Concepts refer to the various strategies and philosophies that guide the marketing efforts of businesses and organizations. Our marketing concept infographics are visual representations of the different marketing concepts and strategies that businesses use to promote their products or services. These infographics can cover a wide range of marketing topics, including target audience, product positioning, branding, advertising, and video marketing. The purpose of these infographics is to provide a easy-to-understand overview of key marketing concepts that businesses can use to drive sales and increase brand awareness.


21 slides
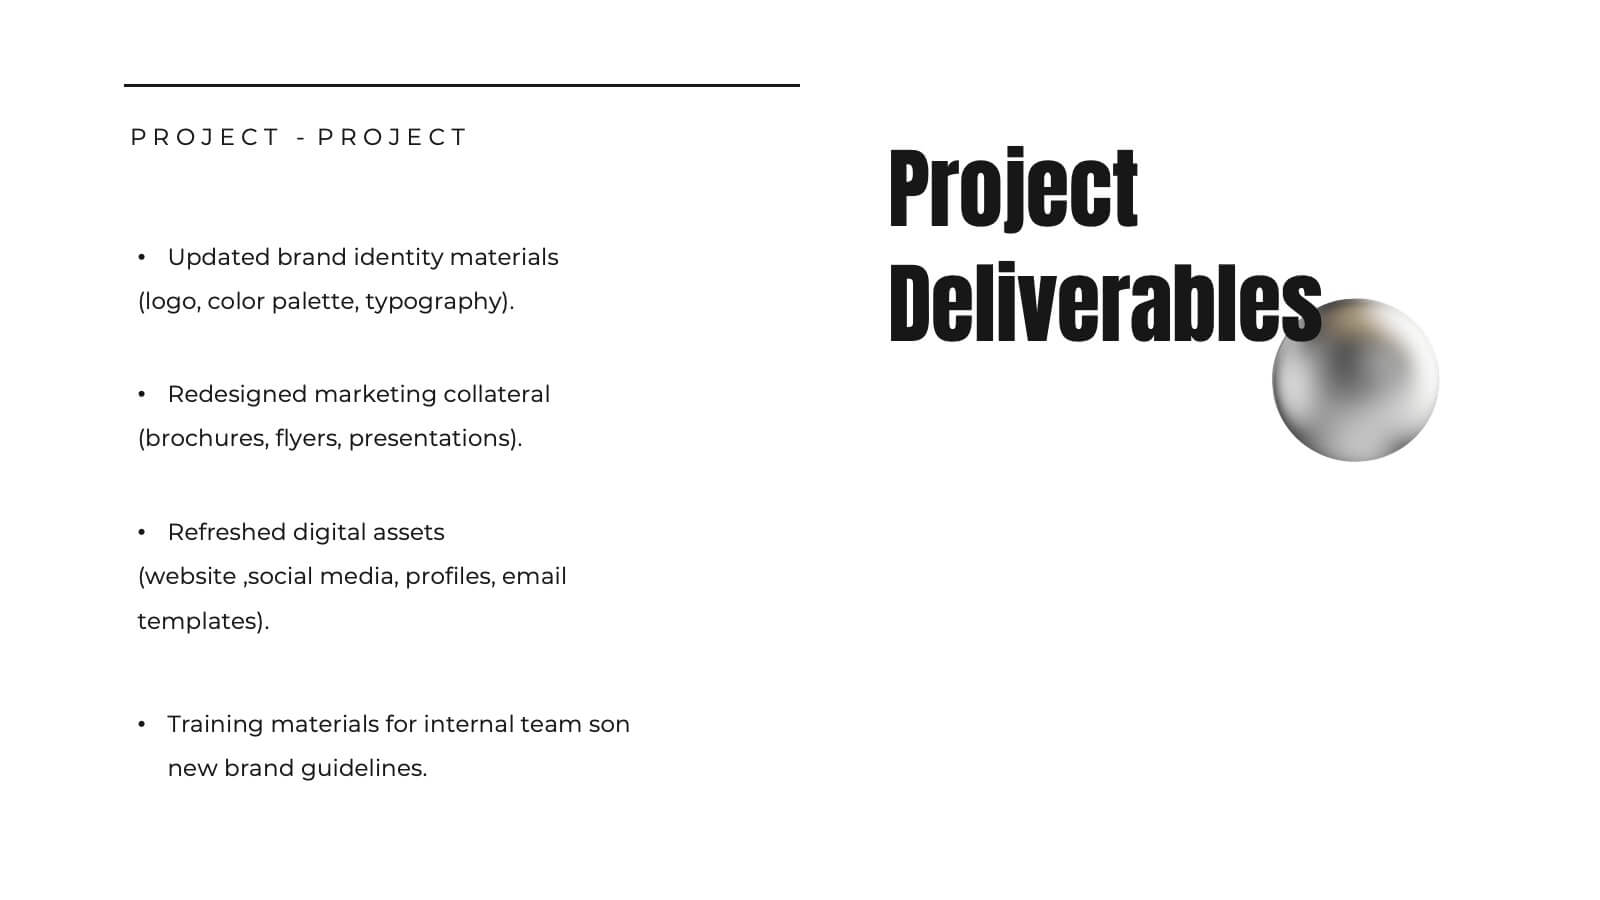
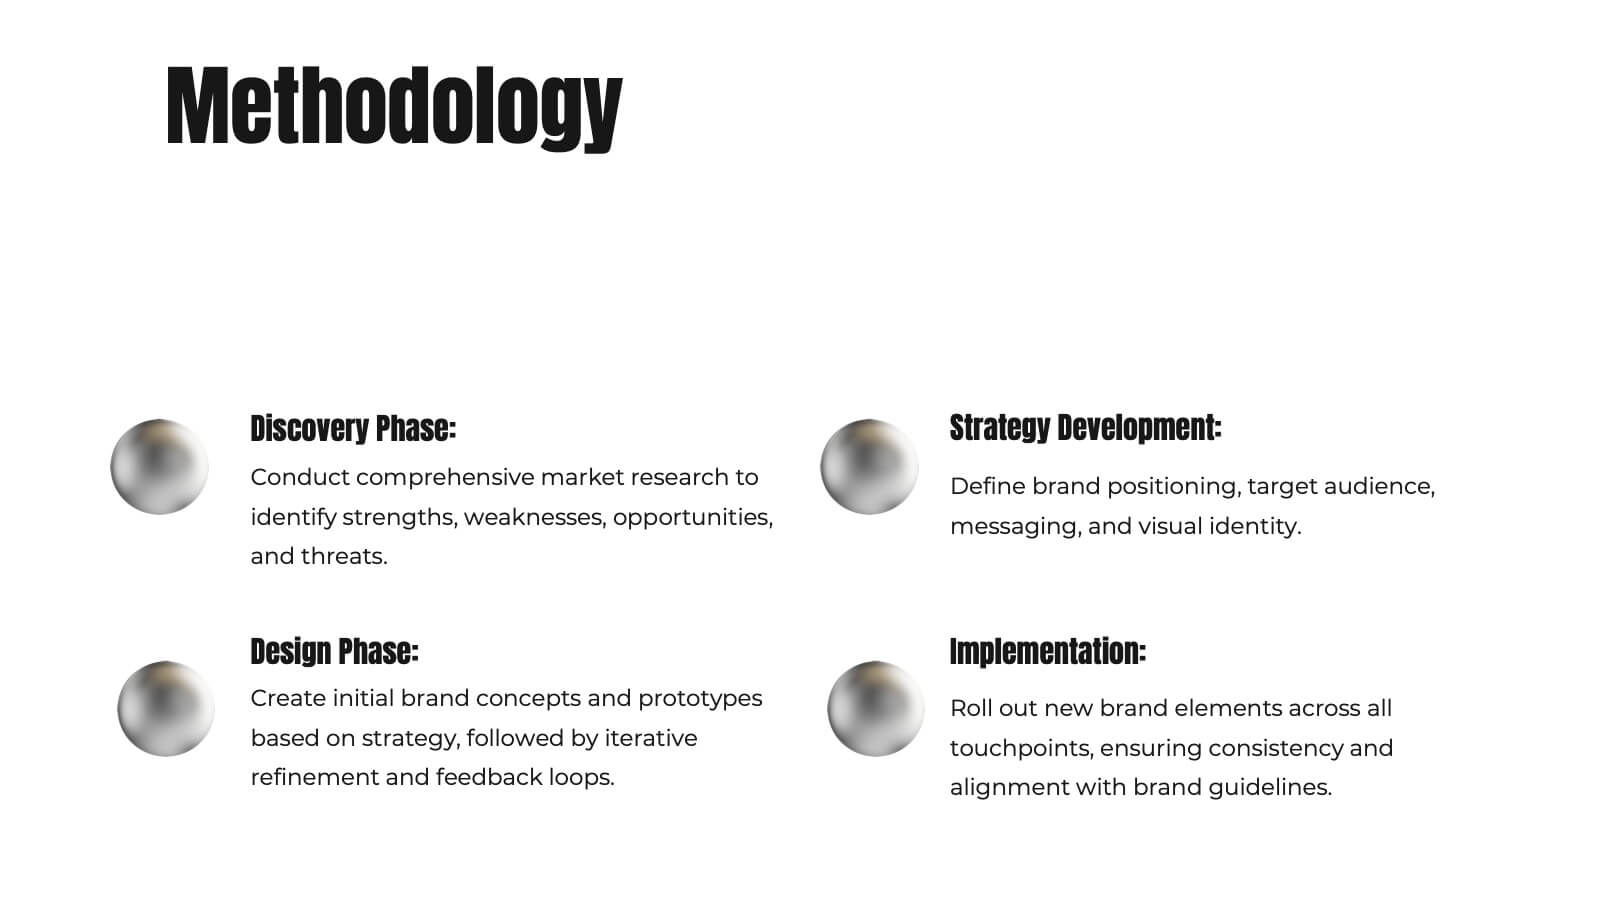
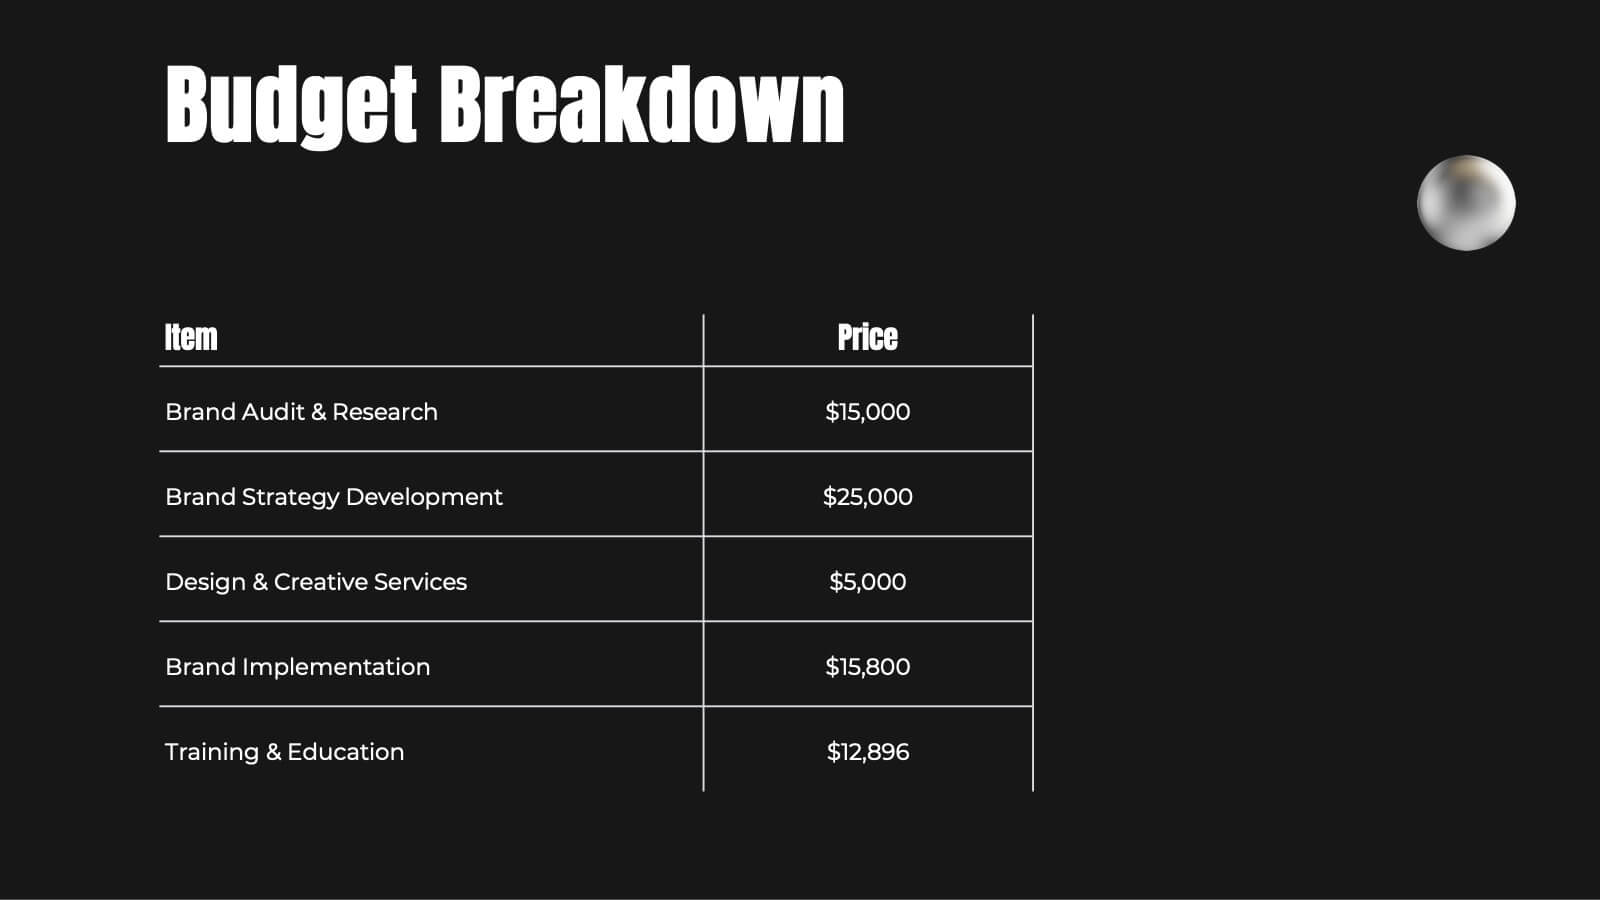
Somnara Full-Service Agency Project Plan Presentation
Present your agency’s expertise with a comprehensive project plan template designed to impress clients and stakeholders. This sleek and professional layout allows you to outline your mission and vision, highlight team strengths, and showcase core services with clarity. Use the client testimonials and case studies sections to establish credibility and trust. Visualize your strategic approach with dedicated slides for market analysis, creative process, and execution strategy. The template also includes detailed sections for partnership opportunities, social responsibility initiatives, and a future outlook, ensuring a holistic view of your agency’s capabilities and forward-thinking approach. Fully editable and compatible with PowerPoint, Google Slides, and Keynote, this template is perfect for full-service agencies seeking to elevate their presentations. Customize each slide to reflect your unique value and deliver impactful, results-oriented proposals.


7 slides
Home Office Scenes Infographic
Dive into the intricacies of the home office environment with our office scenes infographic. Rendered in a sophisticated palette of white and dark blue, this infographic offers an insightful visual exploration of today's work-from-home culture. With detailed icons and illustrative graphics, the design brings to life various scenarios and components of a home office. The layout is geared towards offering practical insights to its viewers. This template is perfect for remote work advocates, and any company transitioning to a hybrid work model. Compatible with PowerPoint, Keynote, and Google Slides this ensures seamless integration into your presentations.


21 slides
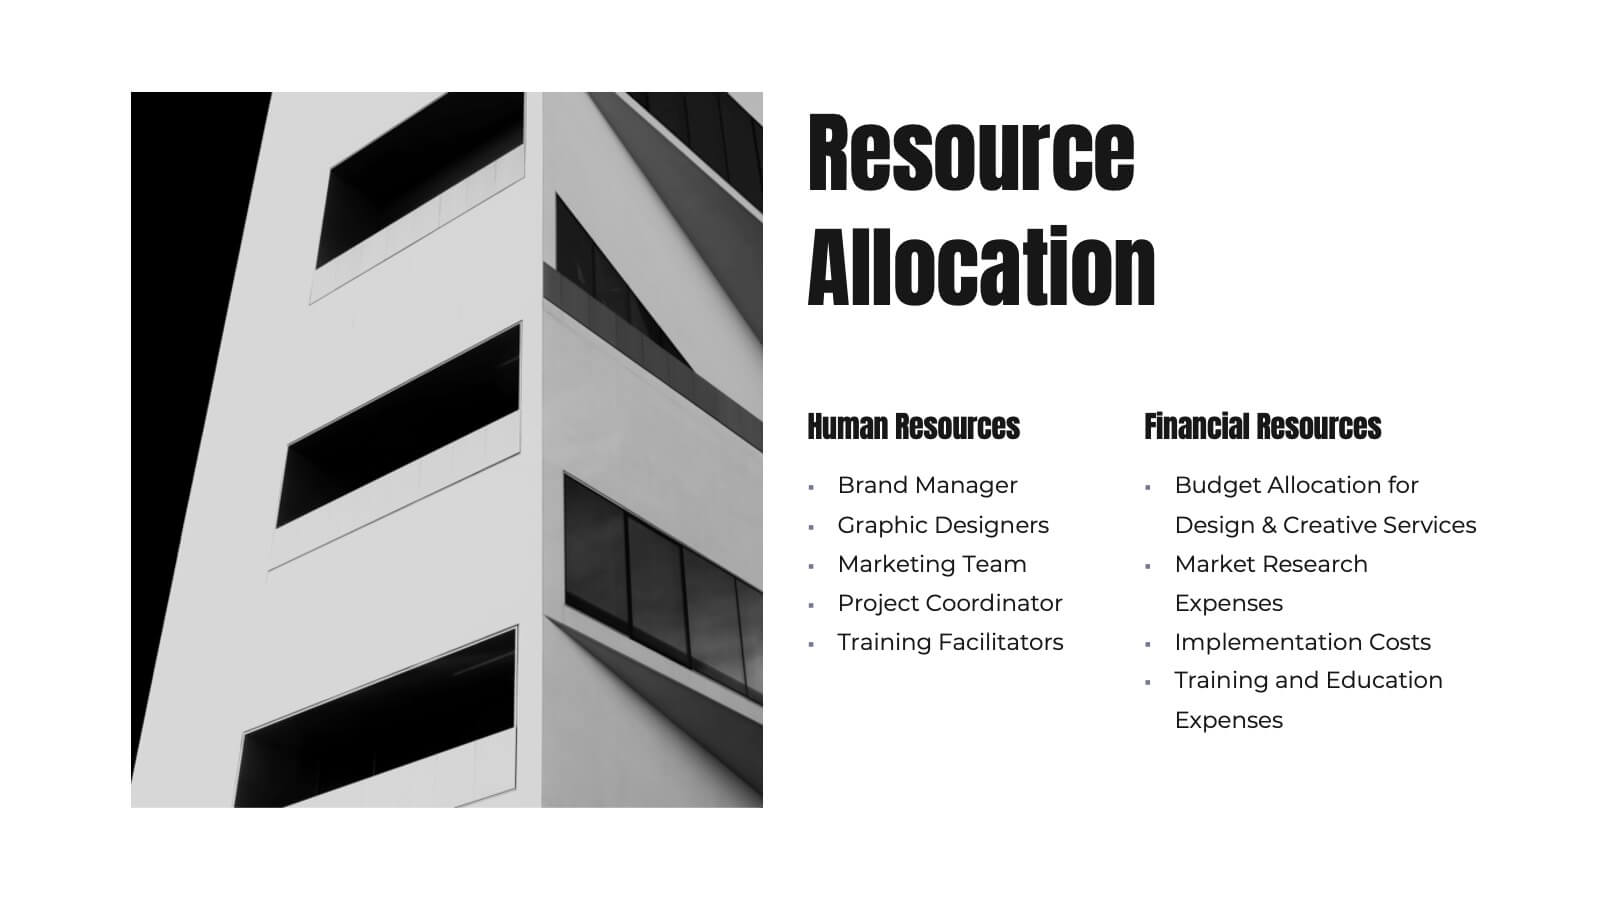
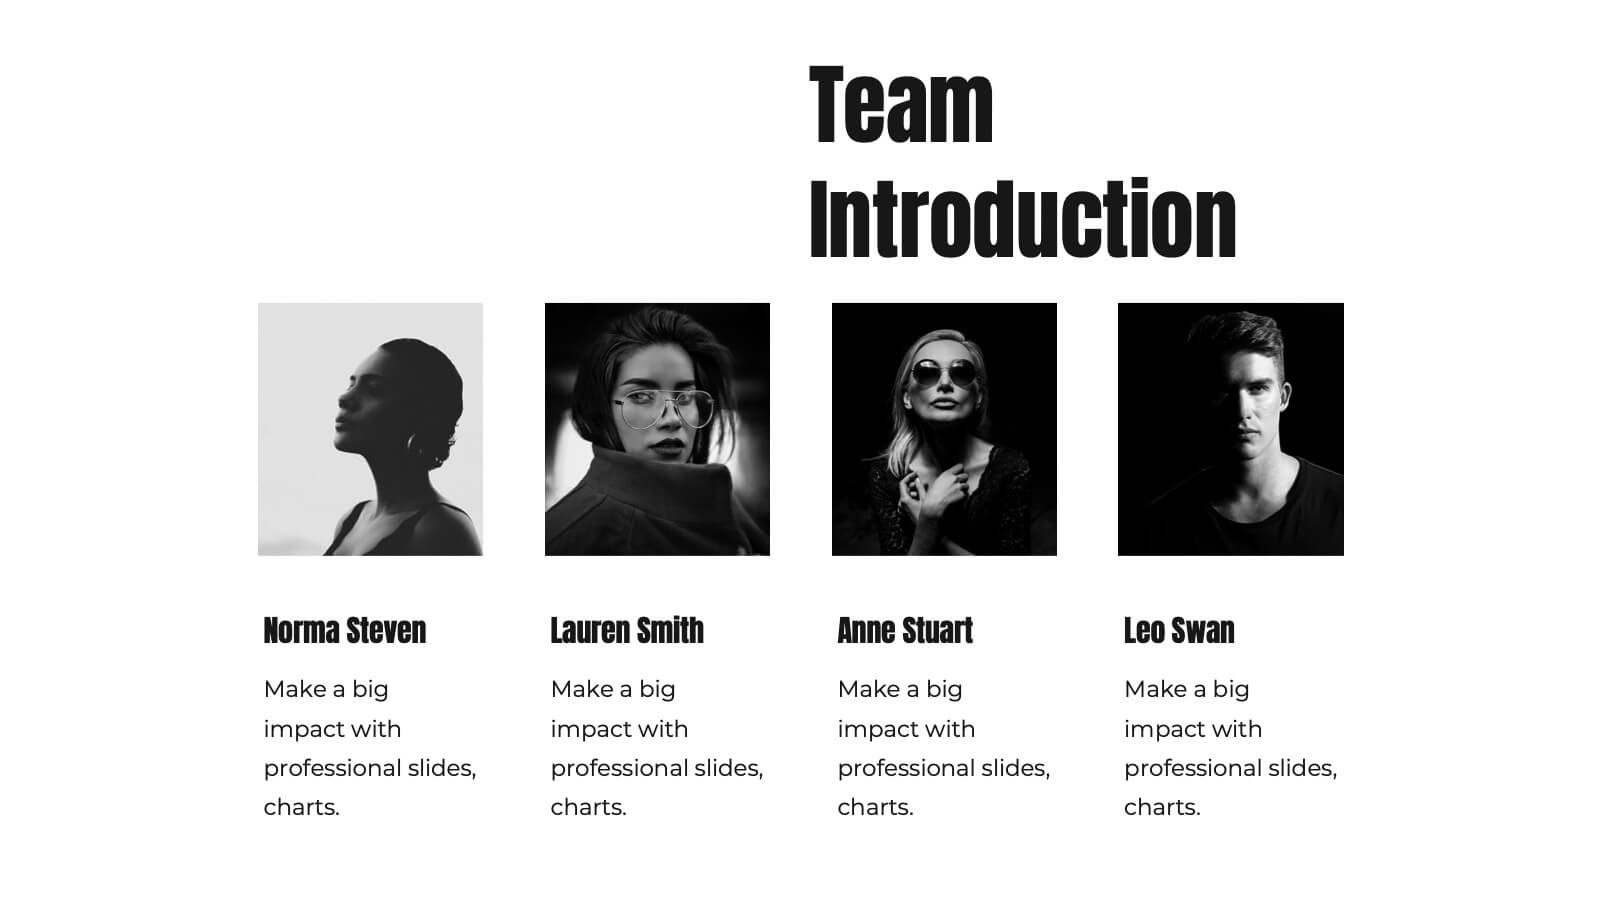
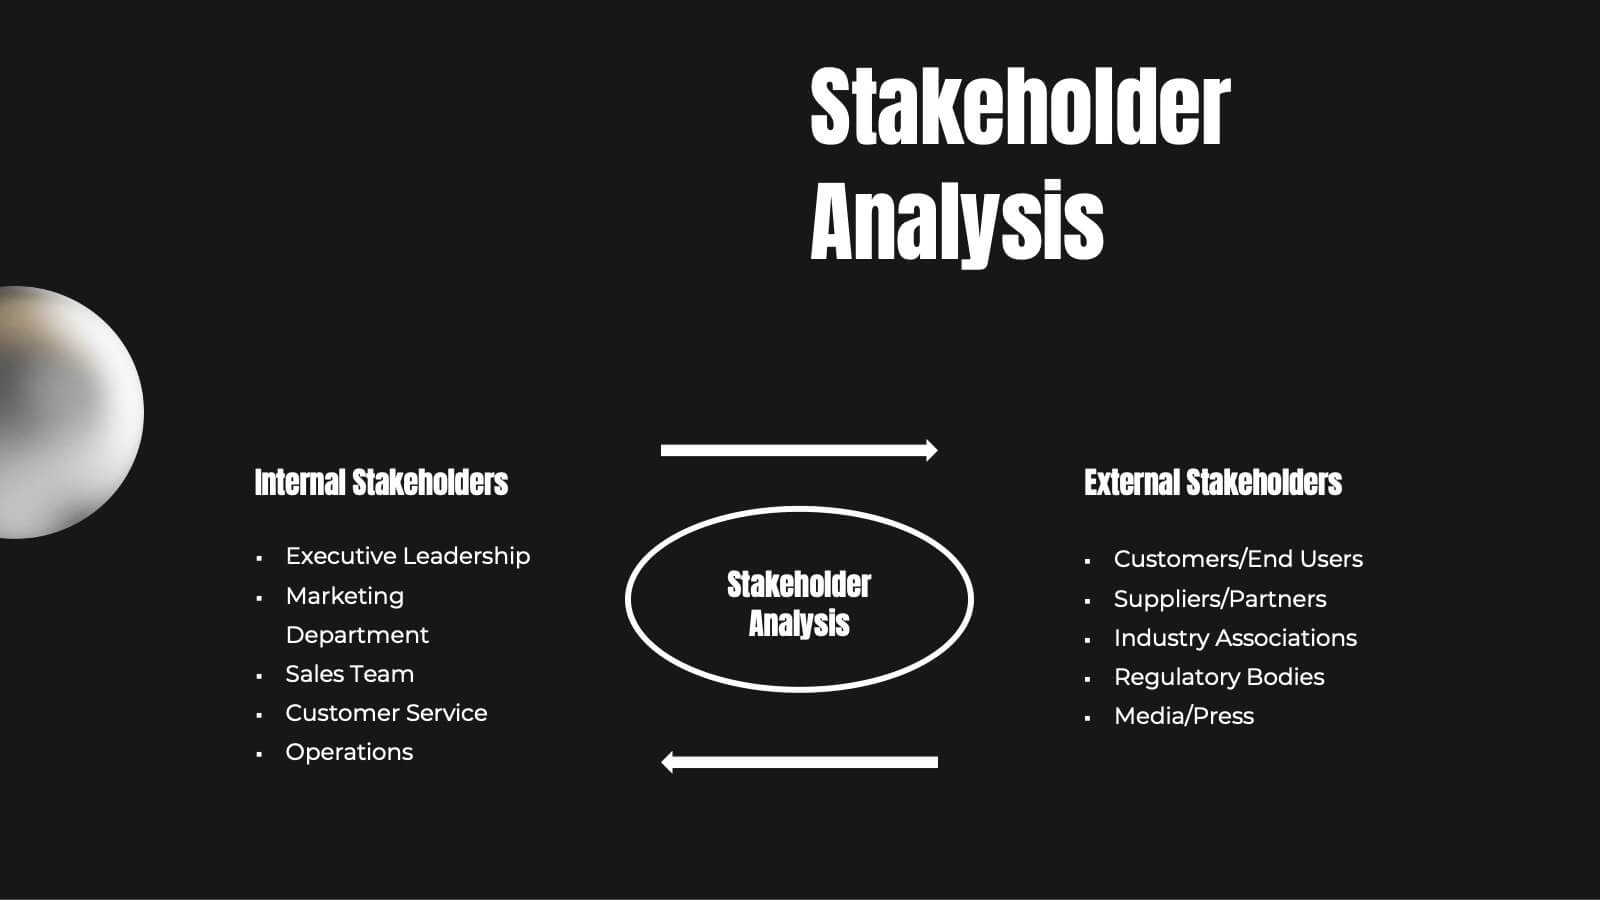
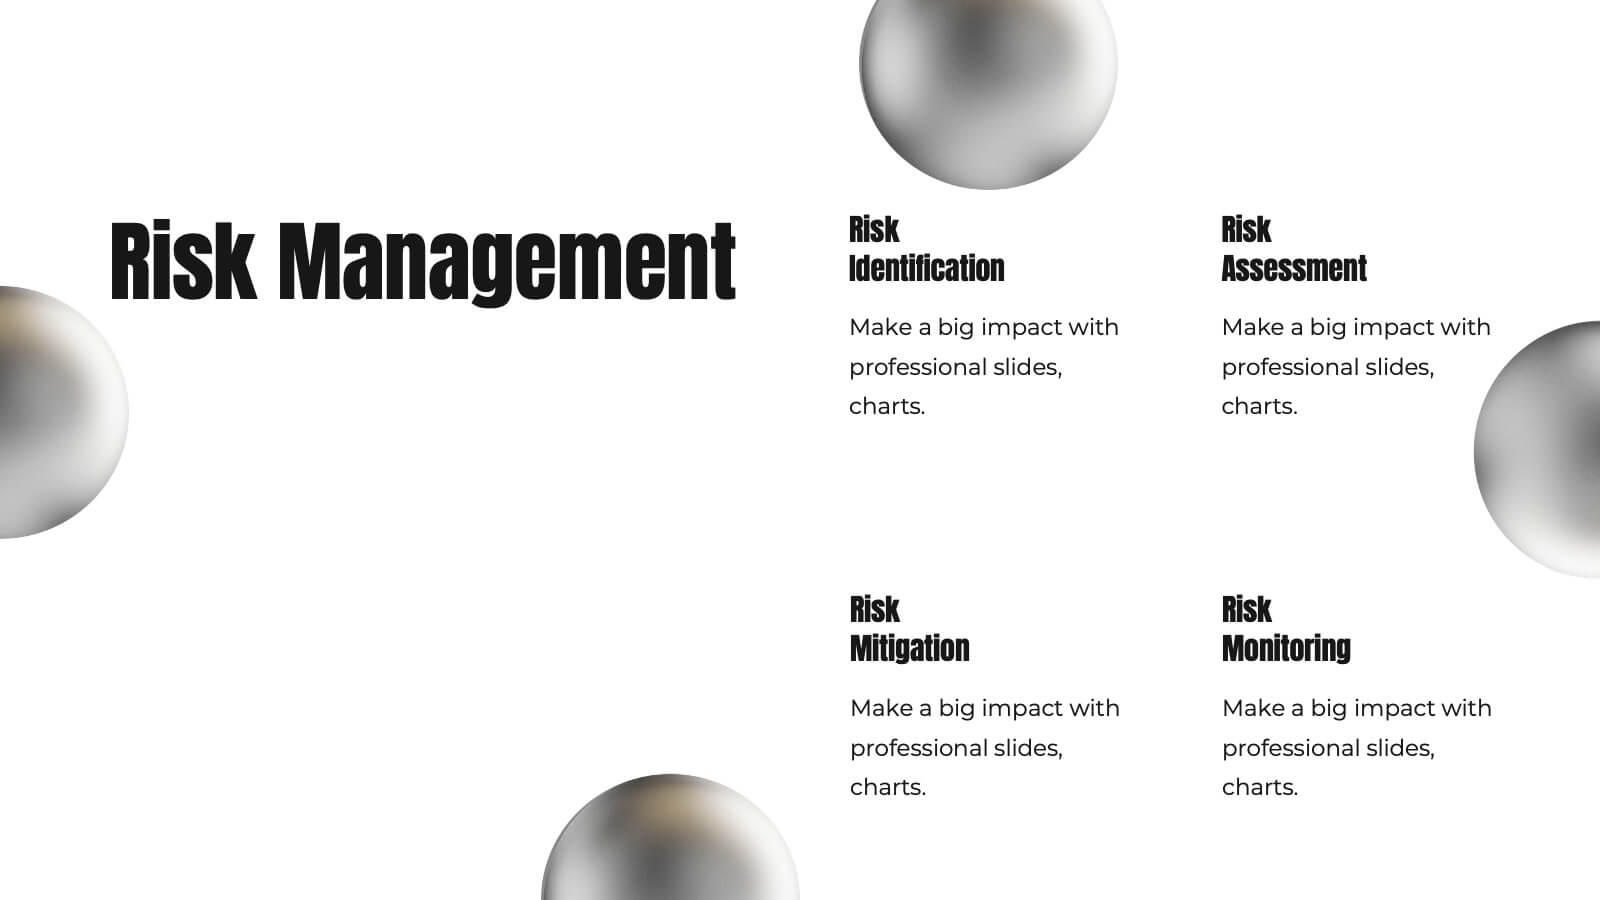
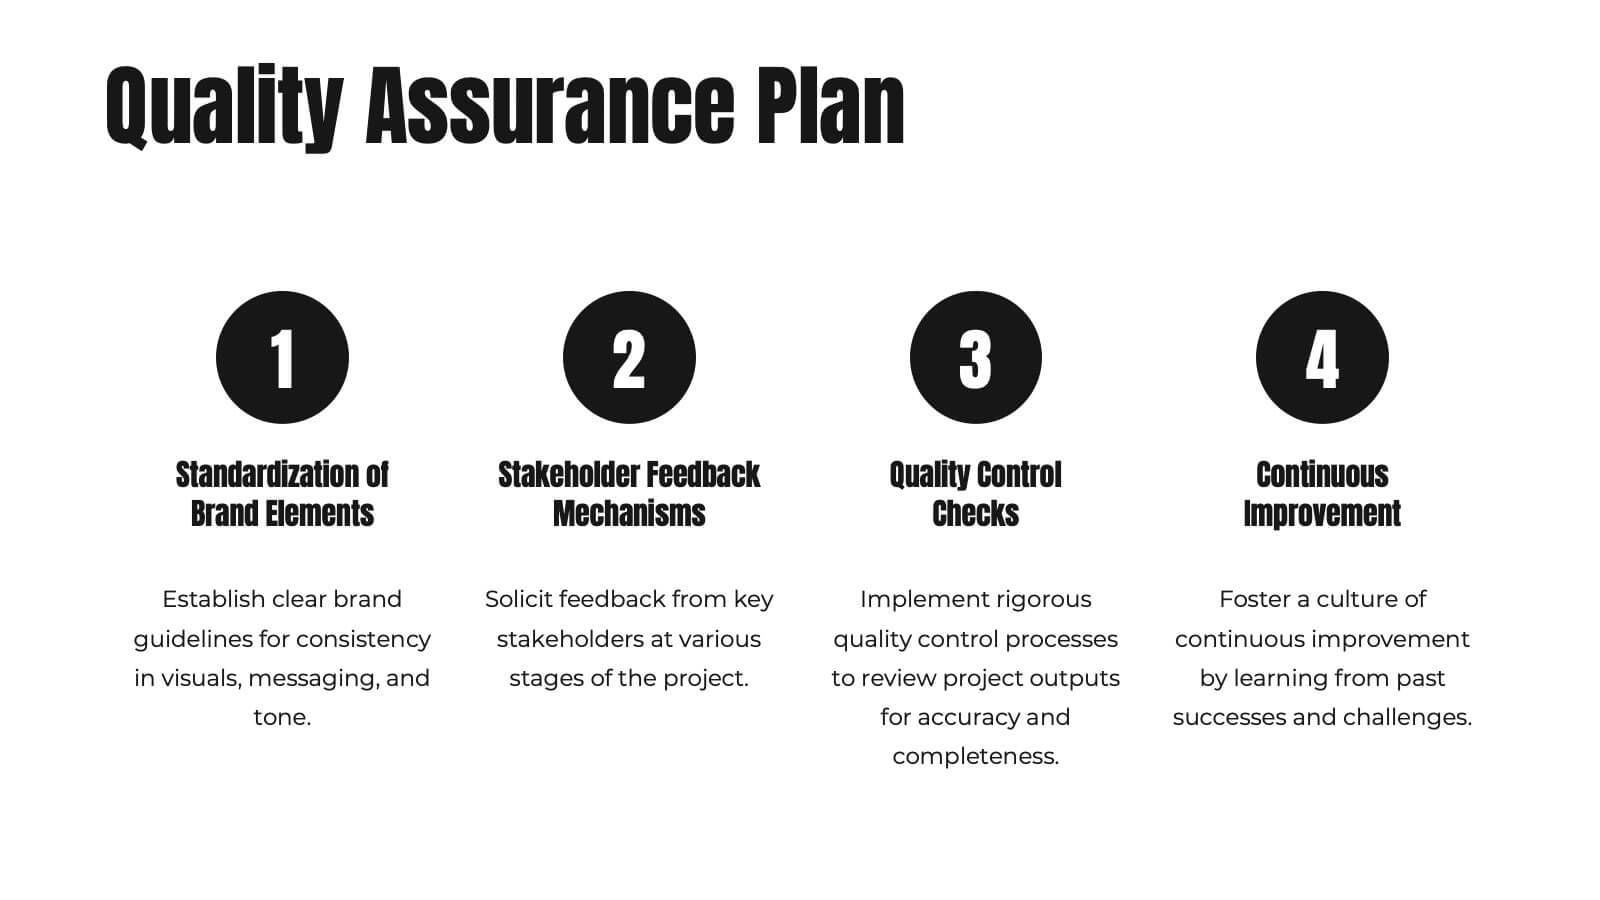
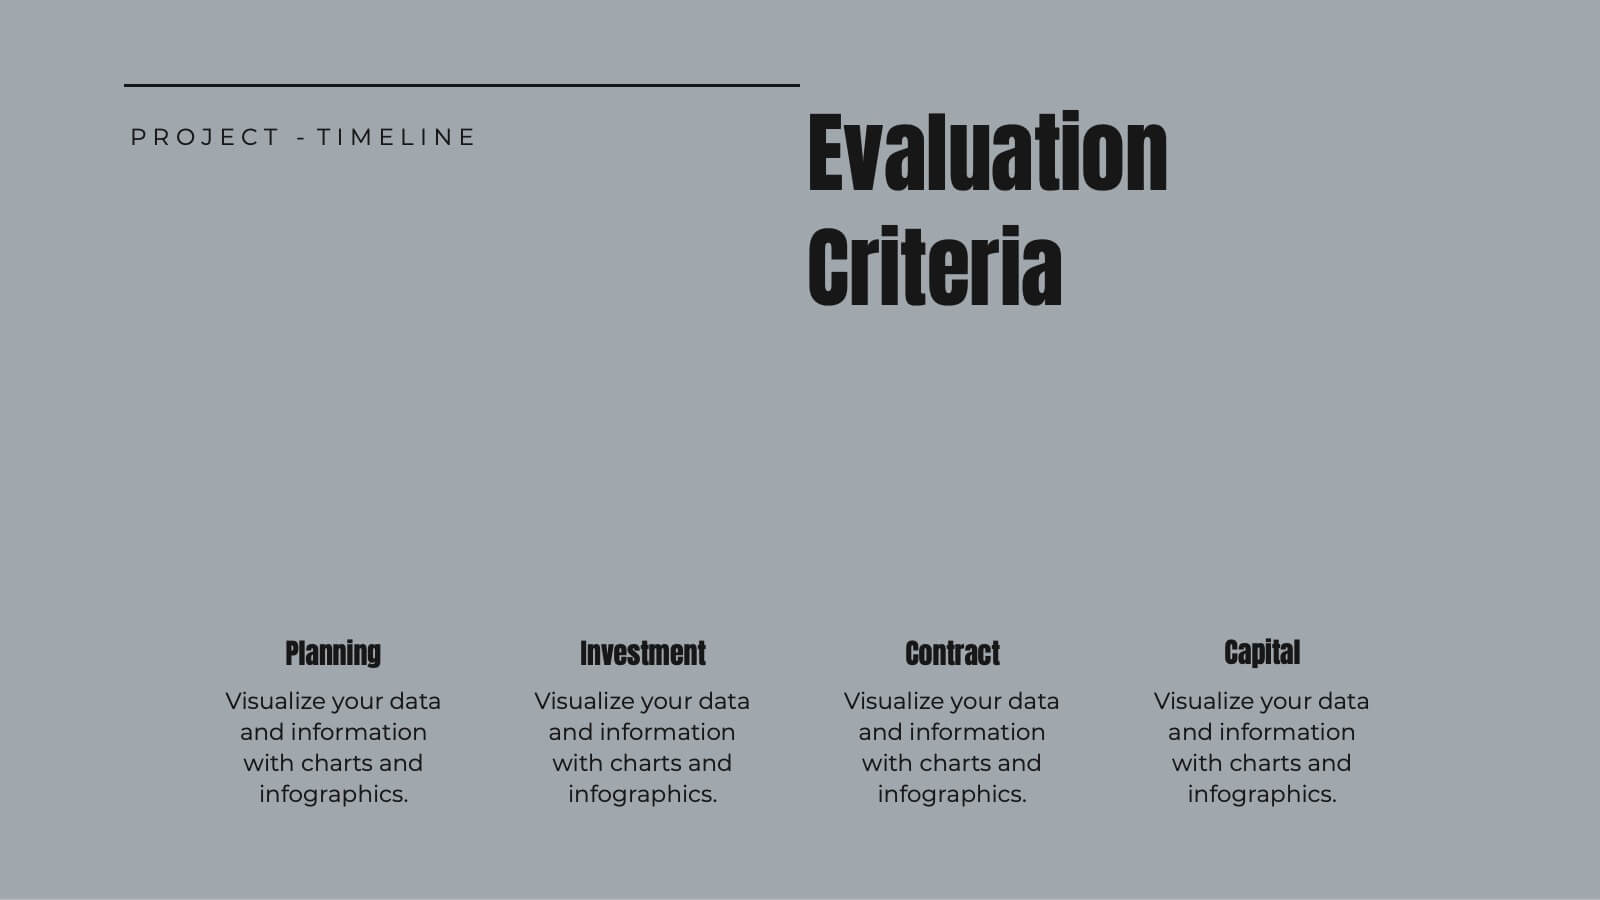
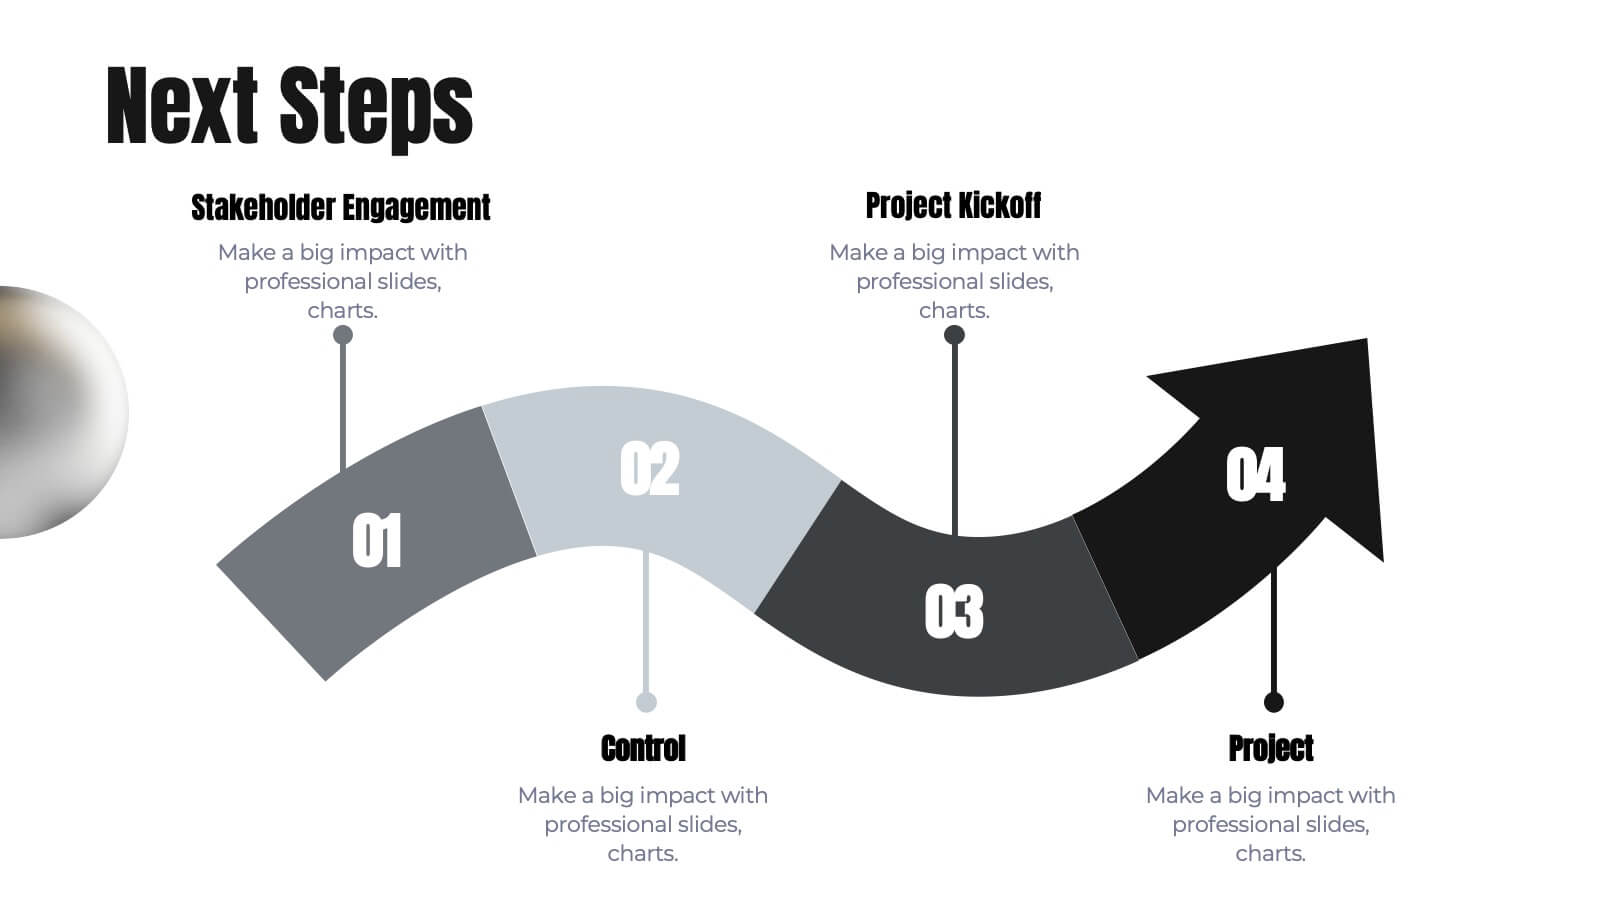
Janus Project Timeline Presentation
Craft a seamless project plan with this sleek and professional presentation template! Designed to guide you through every step, from project overview and scope of work to risk management and resource allocation, this template covers all the essentials. It's perfect for keeping your team on track with clear deliverables, timelines, and evaluation criteria. Compatible with PowerPoint, Keynote, and Google Slides for effortless presentations.


6 slides
Hexagon Infographic Diagram Presentation
Turn your data into a story worth seeing with a clean, geometric layout that connects six key ideas in one bold visual. This presentation is perfect for showcasing processes, strategies, or relationships in a modern, engaging way. Fully compatible with PowerPoint, Keynote, and Google Slides.


7 slides
Operational Workflow Chart Presentation
Turn complex operations into clear, engaging visuals with this clean, structured presentation design. Ideal for outlining procedures, systems, or process improvements, it helps your audience easily follow each stage from start to finish. Fully customizable and compatible with PowerPoint, Keynote, and Google Slides for effortless editing and professional results.


5 slides
Brainstorming Session Diagram Presentation
Spark creativity and structure your next idea session with the Brainstorming Session Diagram Presentation. Featuring a central brain icon and four labeled input areas, this layout makes it easy to visualize and organize group contributions. Fully editable in PowerPoint, Canva, and Google Slides for seamless collaboration and customization.


7 slides
Organizational Structure with 7S Model Presentation
Bring your organizational framework to life with a clean, modern layout that makes complex relationships easy to understand. This presentation helps you explain key elements, show how they connect, and guide strategic discussions with clarity and structure. Fully editable and compatible with PowerPoint, Keynote, and Google Slides.


7 slides
Cause and Consequence Bowtie Model Presentation
Turn complex risks into clear, visual logic with a balanced, intuitive diagram that connects causes to consequences. This presentation is perfect for showcasing preventive and corrective actions in business or project management. Fully customizable and compatible with PowerPoint, Keynote, and Google Slides for a professional, data-driven approach.


8 slides
Team Time Allocation and Planning Presentation
Stay on top of your team's workload with the Team Time Allocation and Planning presentation slide. This template features a clear, month-by-month Gantt-style layout, helping you visualize team tasks, priorities, and resource distribution across the year. Ideal for project managers, department leads, or operations teams aiming to streamline scheduling and improve collaboration. Fully customizable in PowerPoint, Keynote, and Google Slides.