


Features
- 4 Unique slides
- Fully editable and easy to edit in Microsoft Powerpoint, Keynote and Google Slides
- 16:9 widescreen layout
- Clean and professional designs
- Export to JPG, PDF or send by email


Do you have any questions?
Recommend


6 slides
Machine Learning Systems Overview
Get ready to light up your next tech talk with a bold, clean layout that simplifies even the most complex systems. This infographic presentation template is designed to break down how intelligent algorithms function, analyze data, and learn patterns—perfect for explaining how machine learning fits into real-world applications. Each slide uses smart visuals and icons to guide viewers through each system stage with clarity. Ideal for educators, developers, or startups pitching AI-powered solutions, it’s a creative and professional way to keep your audience engaged. Fully compatible with PowerPoint, Keynote, and Google Slides.


26 slides
Flower Shop and Blossoms Presentation
A flower shop, also known as a floral boutique, is a retail establishment that sells fresh flowers, floral arrangements, and related products. This presentation template has a charming design that celebrates the beauty and elegance of flowers. This template is perfect for florists, flower shops, garden enthusiasts, or anyone looking to create a captivating presentation about flowers, floral arrangements, or the art of floristry. The presentation features visually stunning floral icons with colorful and artistic arrangements, creating a delightful and inviting atmosphere. This template is fully customizable and compatible with Powerpoint, Keynote, and Google Slides.


5 slides
Healthcare Facts Infographics
Healthcare facts help promote health literacy, empower individuals to make informed decisions, and contribute to improved healthcare outcomes for individuals and communities. These infographic templates are designed to present key healthcare facts and statistics in a clear and concise manner. These are perfect for creating educational materials, presenting research findings, or raising awareness about healthcare issues, this template will help you effectively communicate important information. Compatible with Powerpoint, Keynote, and Google Slides you can ensures that your healthcare infographics are visually compelling and impactful.


5 slides
Cryptocurrency Scams Infographics
Navigate the intricate world of digital currency with our cryptocurrency scams infographics template. This essential tool, designed with an informative and vertical style, serves as a beacon for investors, financial advisors, and digital currency enthusiasts, providing safeguarding strategies against the rising tide of cryptocurrency scams. Set against a bold palette of purple, yellow, and green, the template employs crisp graphics, decipherable icons, and strategic image placeholders to break down complex scam methodologies and preventive measures. Compatible with Powerpoint, Keynote, and Google Slides. Promote informed decision-making in the volatile cryptocurrency market.


4 slides
Investment Planning and Risk Guide
Simplify your financial presentation with the Investment Planning and Risk Guide Presentation. This 3-step visual layout walks viewers through the key stages of financial decision-making, from initial capital to potential return. Perfect for illustrating risk assessment, investment flow, or budgeting strategies. Fully editable in PowerPoint, Keynote, and Google Slides.
22 slides
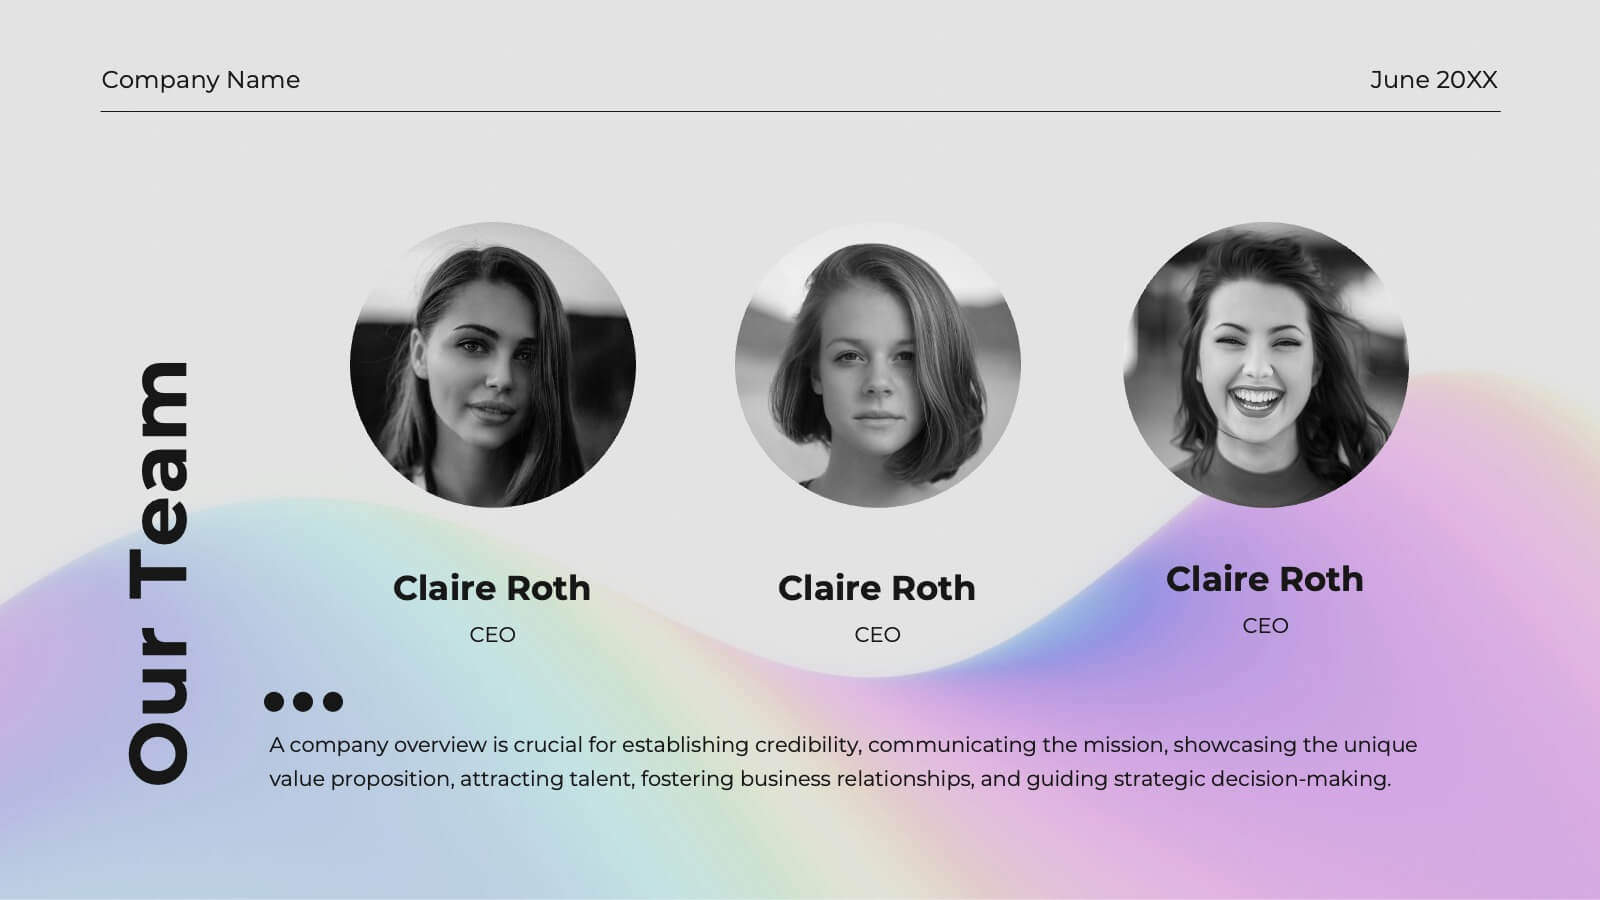
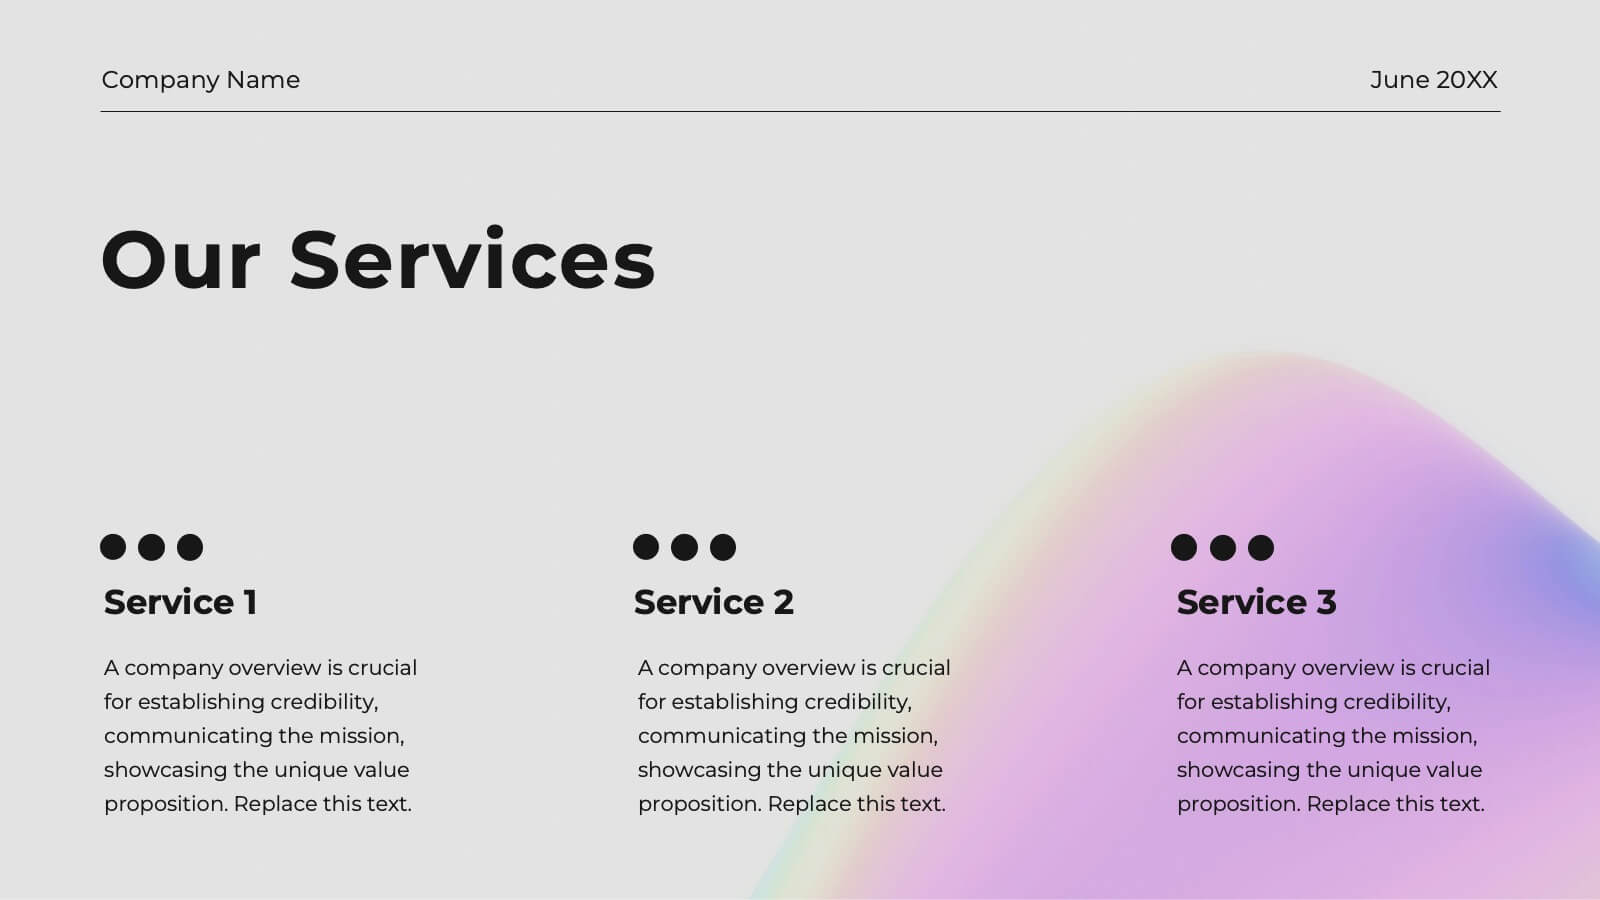
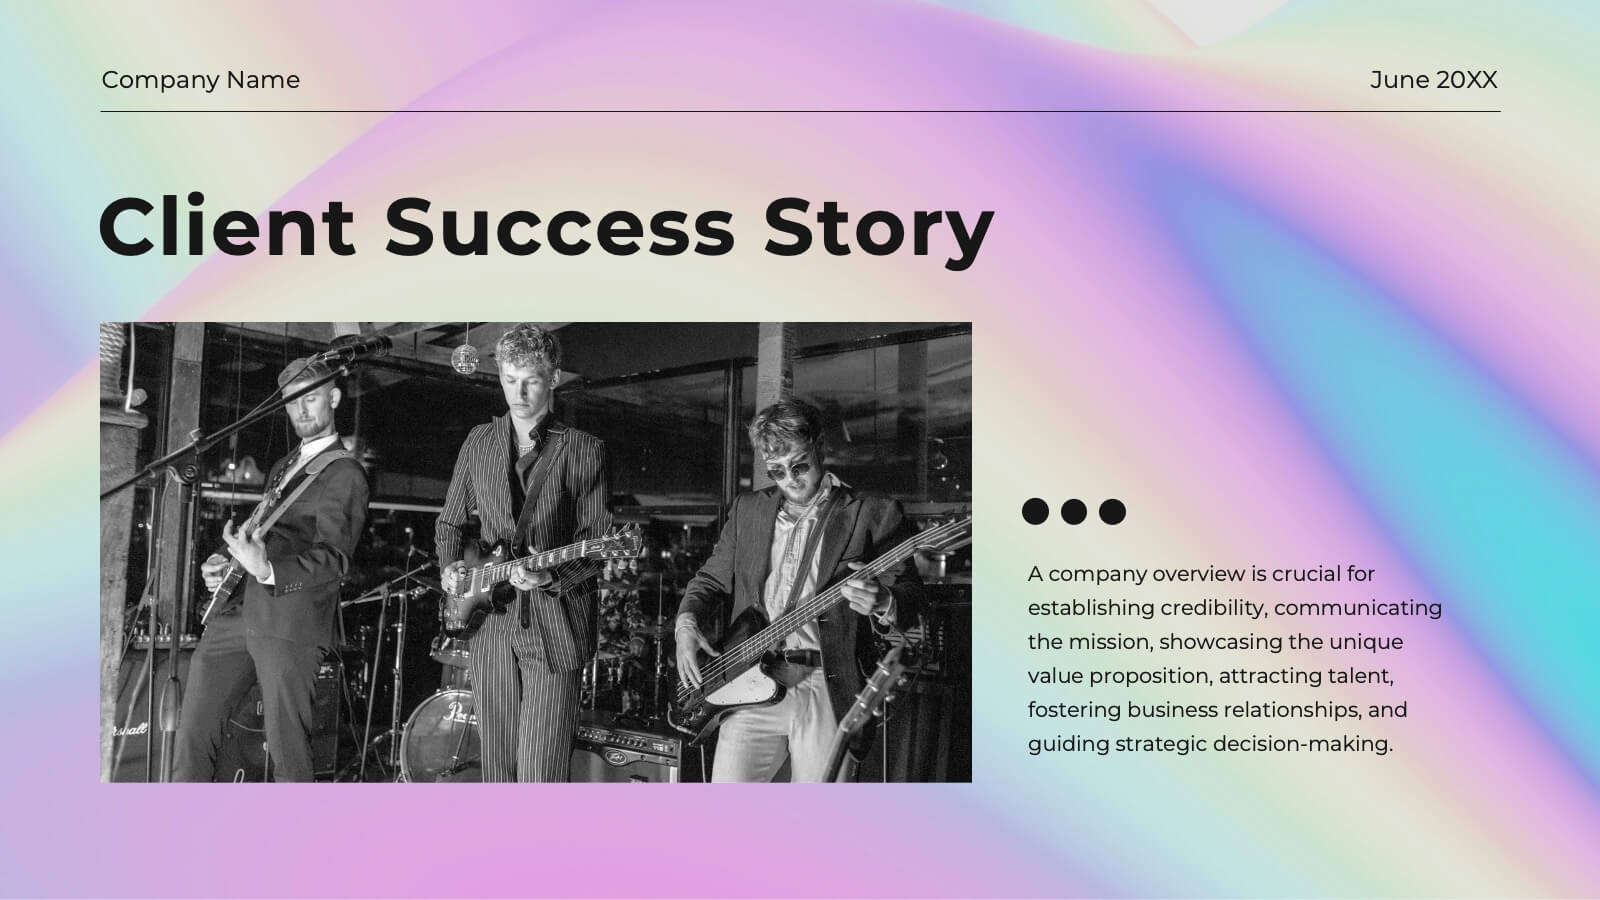
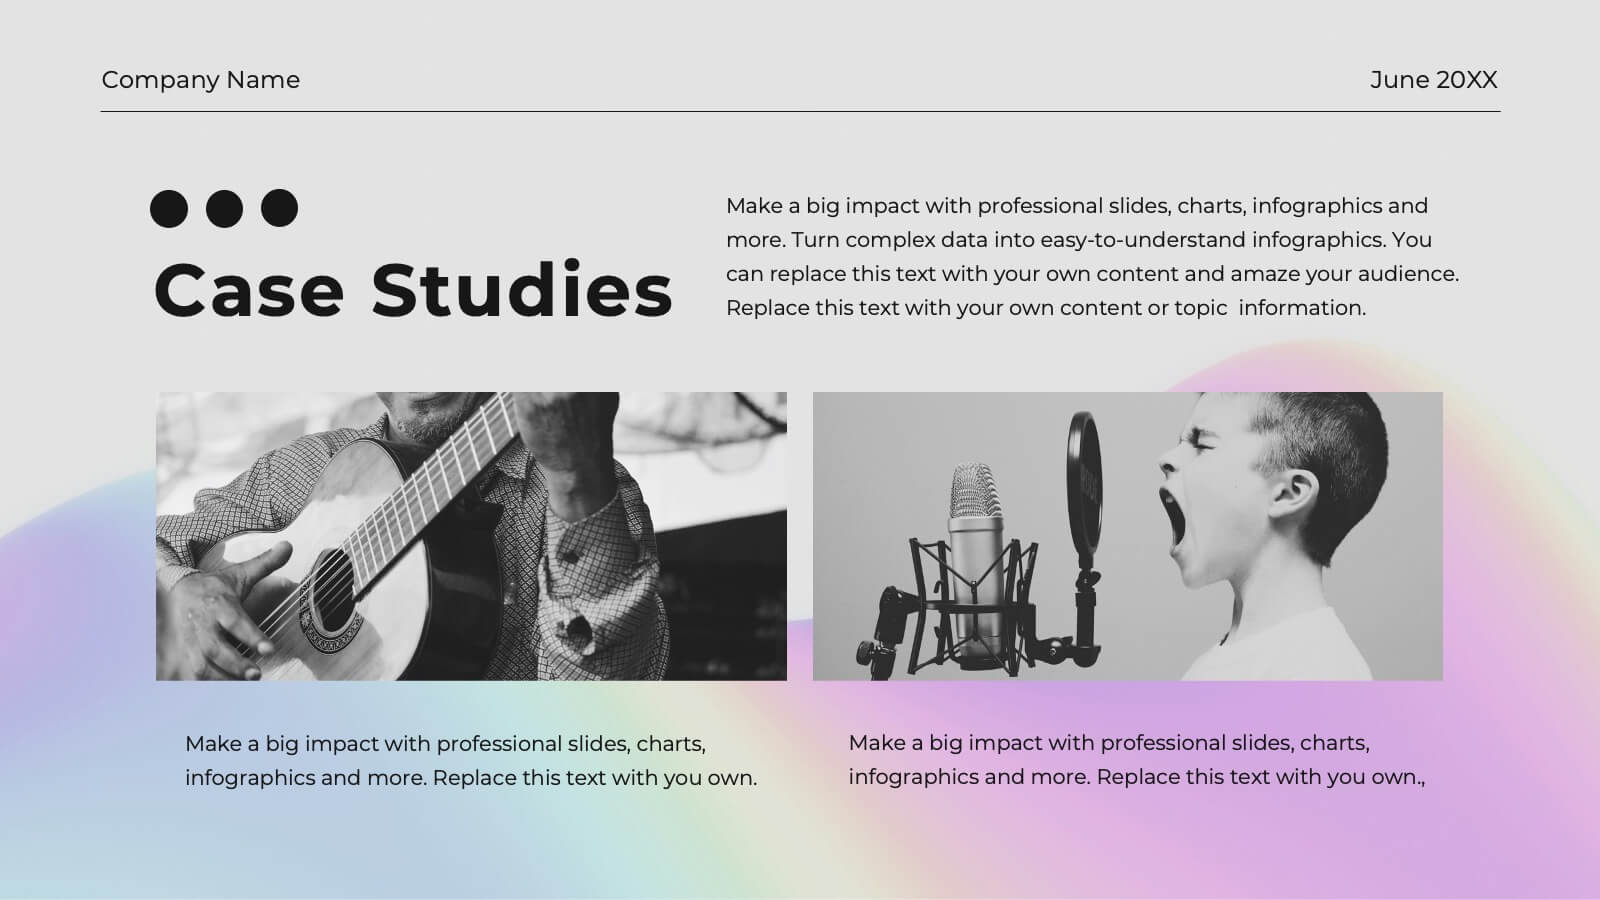
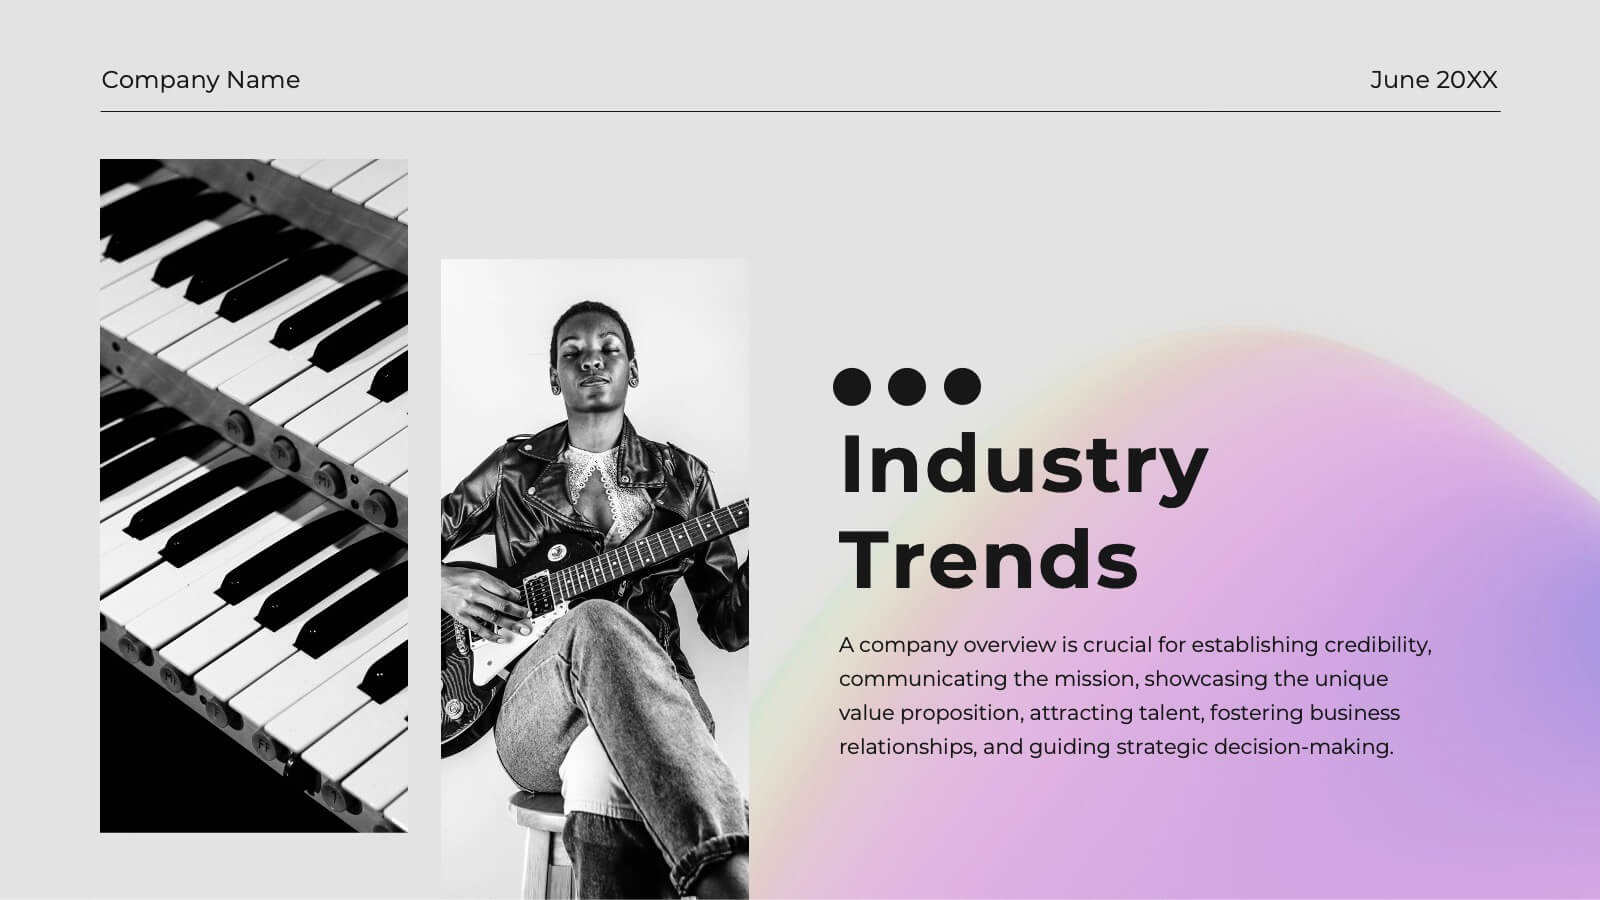
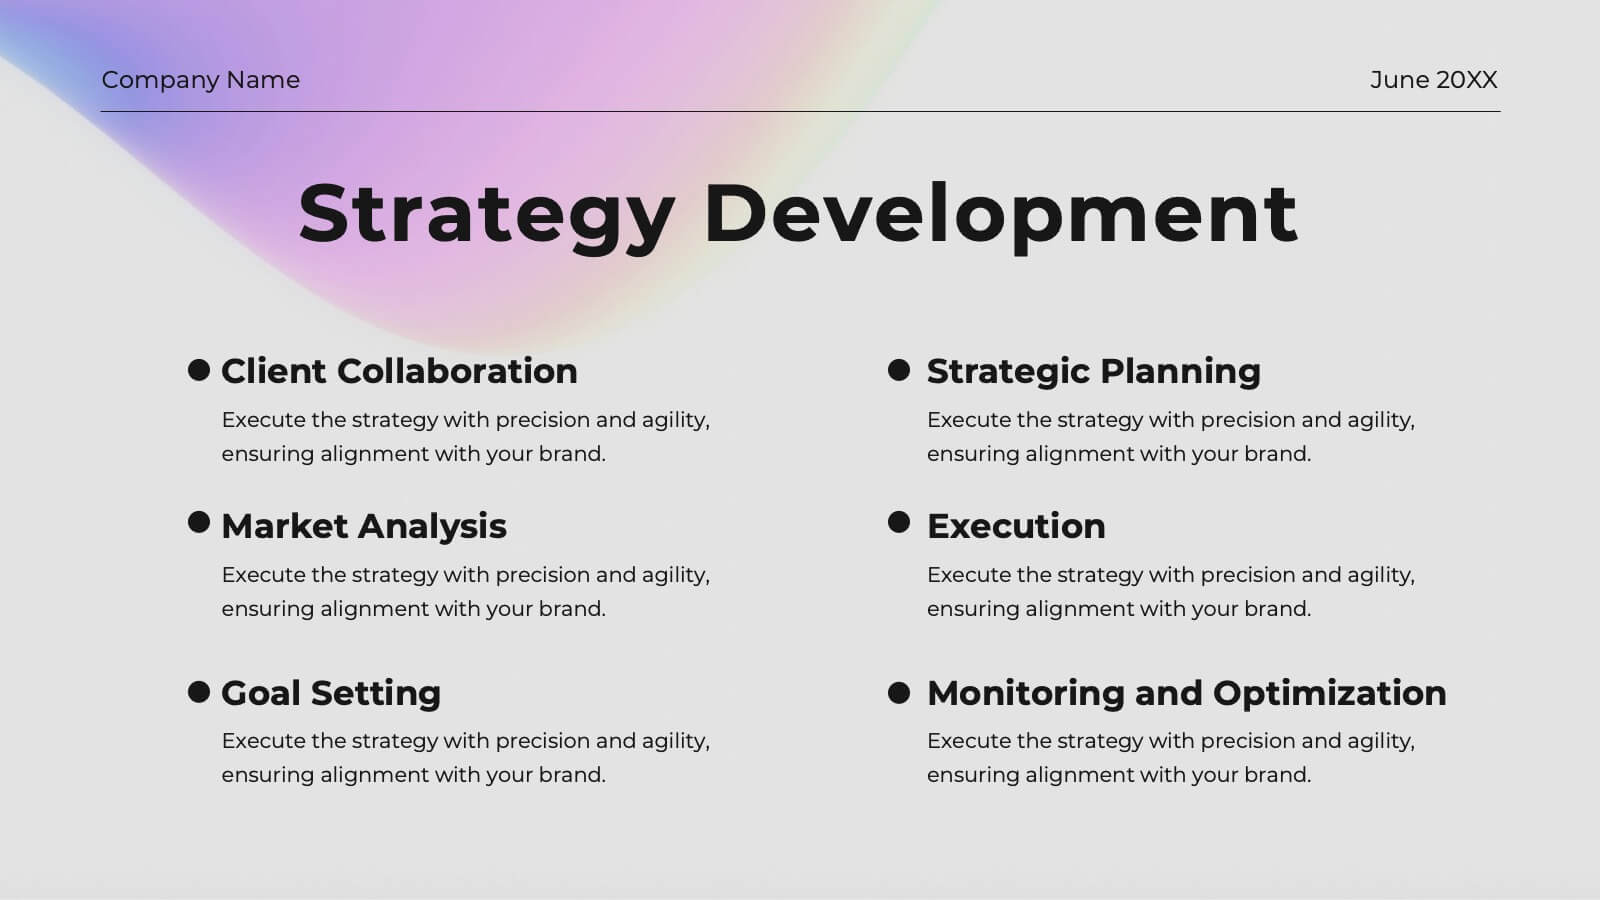
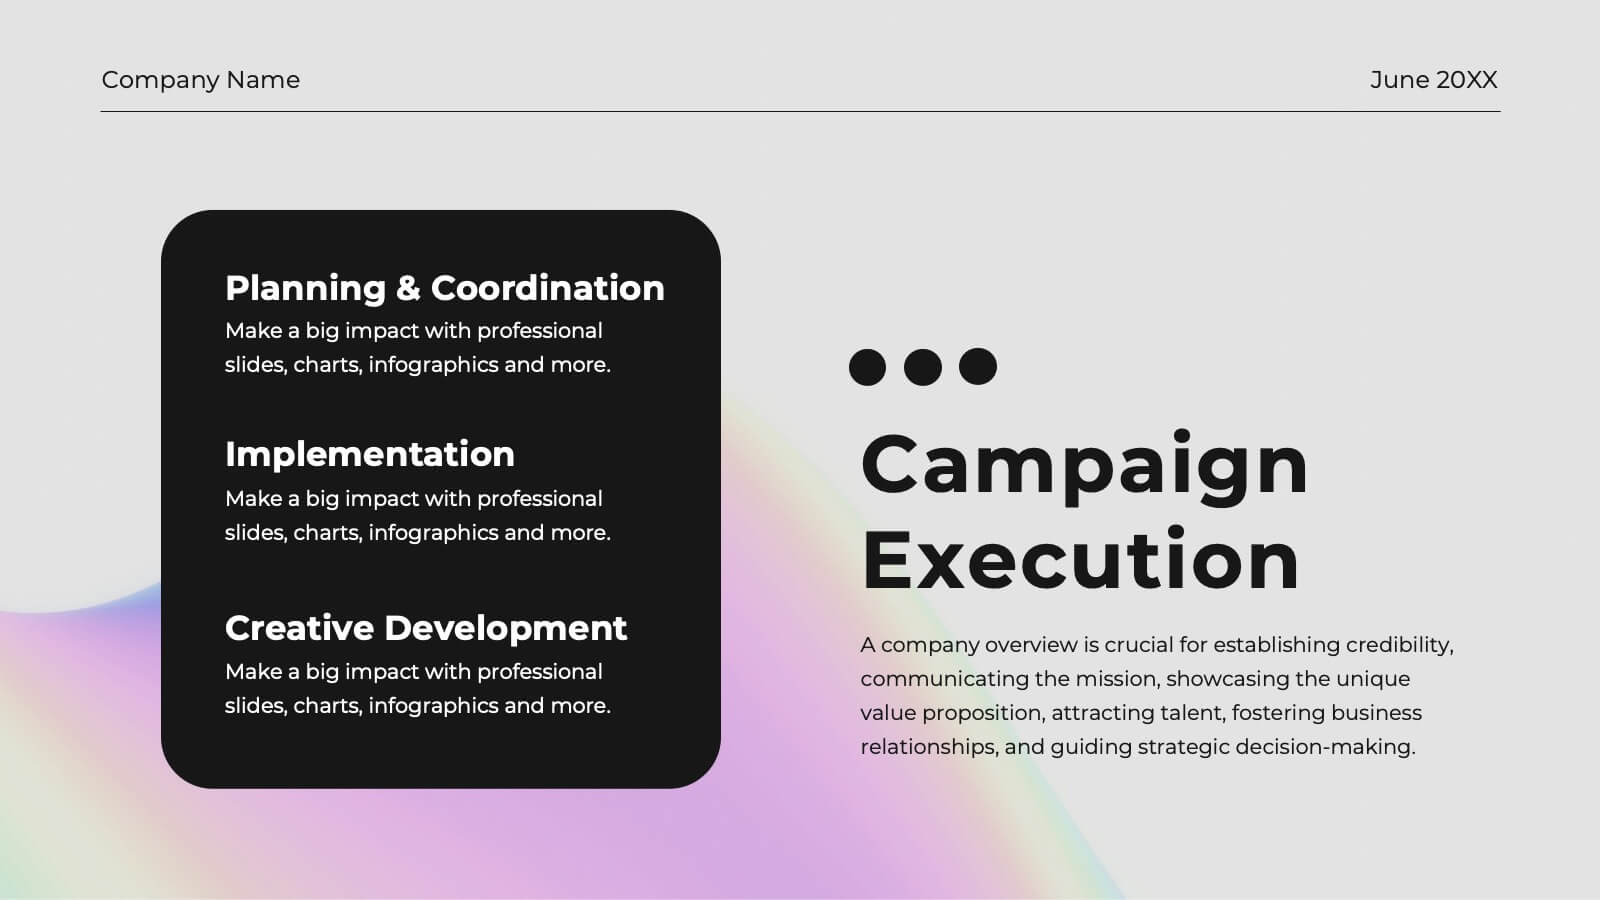
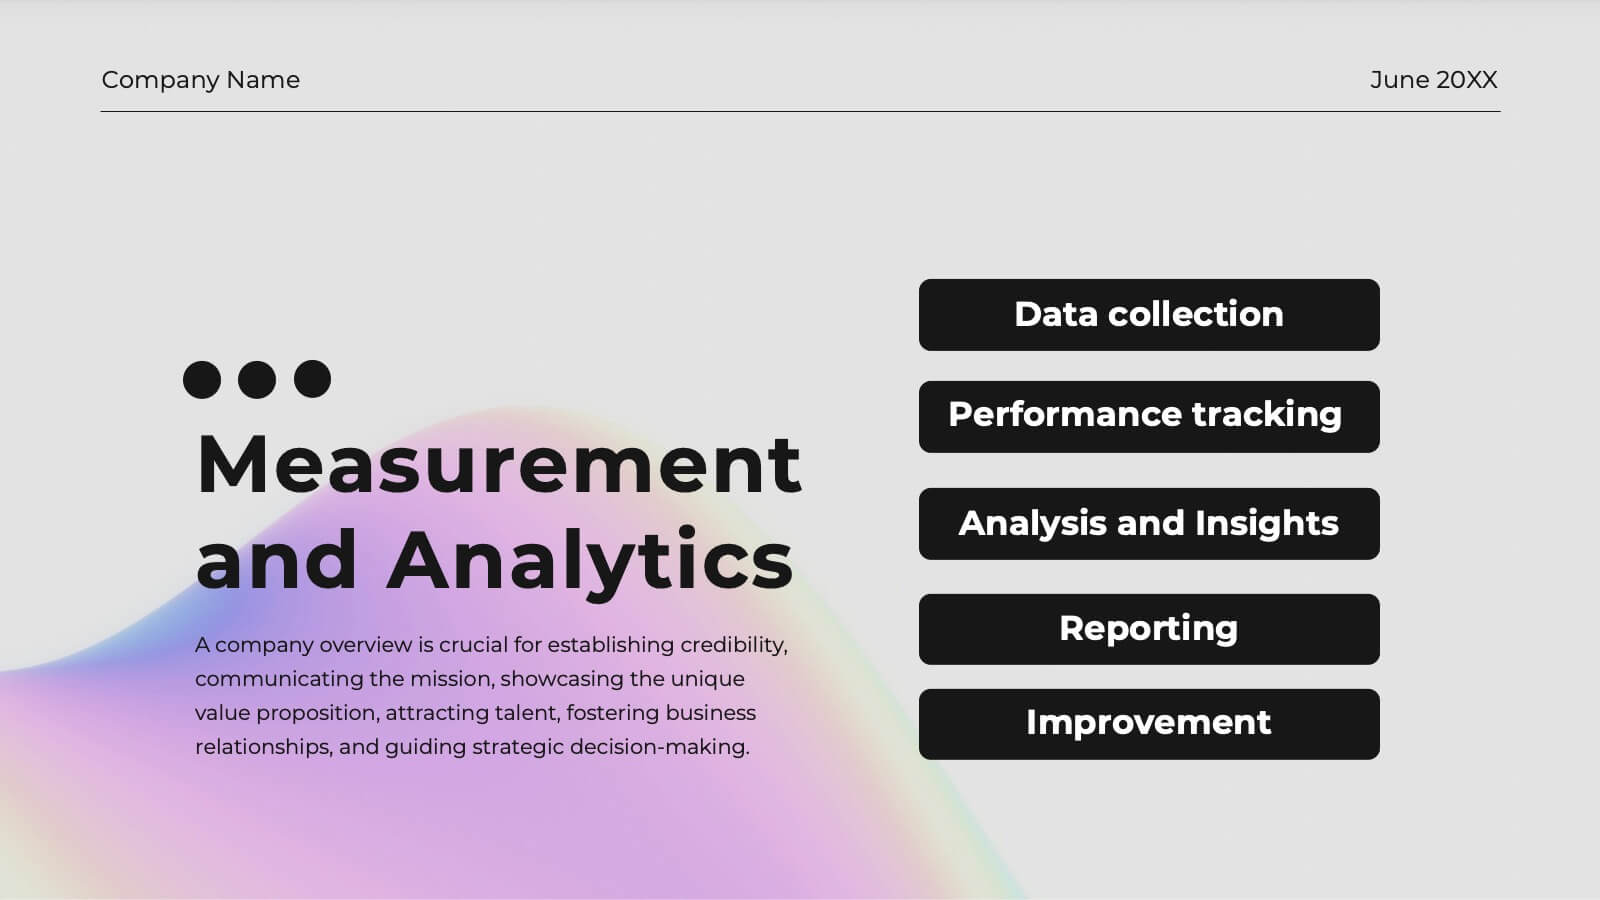
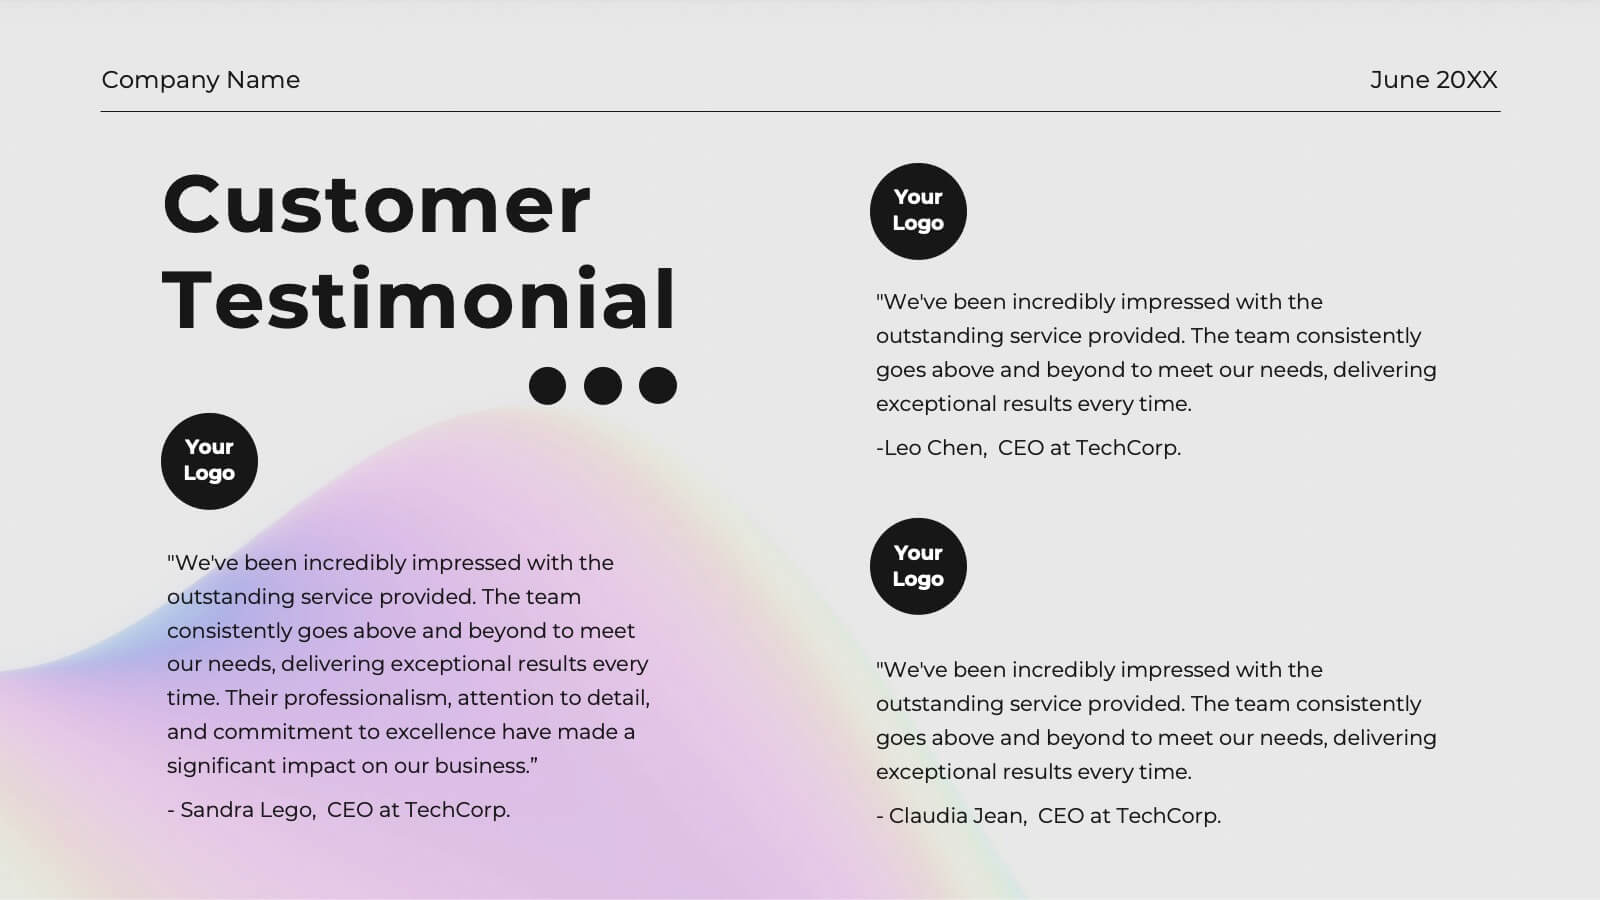
Frost Advertising Agency Proposal Presentation
Dazzle your clients with this radiant agency proposal template! Perfect for presenting your mission, services, and market analysis, it includes slides for case studies, strategy development, and campaign execution. Impress stakeholders with vibrant visuals and detailed content. Compatible with PowerPoint, Keynote, and Google Slides for seamless presentations on any platform.


7 slides
Bowtie Chart for Threat Mitigation Presentation
Visualize and mitigate threats with precision using the Bowtie Chart for Threat Mitigation Presentation. This structured layout highlights risks, controls, and consequences in a mirrored bowtie format—perfect for safety planning, compliance, and risk assessment. Fully customizable in Canva, PowerPoint, Google Slides, and Keynote for seamless integration into your workflow.


7 slides
5G Advantages Infographic
Explore the power of 5G with this engaging infographic template, designed to clearly showcase the technology's many benefits. Ideal for educators, tech enthusiasts, and professionals, it highlights how 5G enhances connectivity, speeds up data transfer, and supports innovations like smart cities and IoT devices. With vibrant graphics and simple explanations, it makes complex concepts easy to understand. Use this tool in classrooms, workshops, or online to educate and inspire others about 5G's transformative impact on industries like healthcare, entertainment, and finance. Discover the future of technology and how 5G is making it happen today!


6 slides
Modern Circle Infographic
Our Modern Circle infographic is a contemporary visual tool designed for seamless integration with Powerpoint, Keynote, and Google Slides. This infographic is particularly useful for professionals and educators looking to present information in a cyclical process or to illustrate a concept that involves interconnected elements. The design of the Modern Circle infographic is intuitive and engaging, facilitating the representation of processes, relationships, or statistics in a clear, circular format. The sleek and modern aesthetic ensures that your information is conveyed in a visually appealing manner, keeping your audience engaged and focused on the content. By utilizing this infographic, you have the ability to present complex data or concepts in a simplified form, making it accessible for all audience types. Whether you’re detailing a business cycle, demonstrating a feedback loop, or presenting a series of steps in a continuous process, the Modern Circle infographic is your go-to for adding a touch of sophistication to your presentations. Its adaptability and stylish design will enhance your ability to communicate effectively with any audience.


5 slides
Mind and Brain Creativity Concept Diagram Presentation
Ignite fresh thinking with the Mind and Brain Creativity Concept Diagram Presentation—a smart and visually engaging template that maps out five core concepts around a central brain icon. Each idea is linked with intuitive visuals and labeled A through E, ideal for creative strategy, innovation pitches, or mental model breakdowns. Fully customizable in PowerPoint, Keynote, and Google Slides.


4 slides
Organizational Hierarchy Chart Presentation
A clear, engaging way to map out team structure, this presentation highlights how roles connect and flow across an organization. It visually simplifies reporting lines, helping audiences quickly understand leadership levels and team responsibilities. Perfect for planning, onboarding, or strategy discussions, and fully compatible with PowerPoint, Keynote, and Google Slides.


4 slides
Target Audience Slide Deck Presentation
Make your message click instantly with a bold, puzzle-style slide that brings your audience insights to life. This presentation helps you break down key segments, user needs, and demographic details in a clear, engaging format that supports strategic decision-making. Fully compatible with PowerPoint, Keynote, and Google Slides.


8 slides
Customer Market Segmentation Analysis
Visualize your audience insights with precision using the Customer Market Segmentation Analysis Presentation. This slide features a sleek, layered funnel design with percentage bars and arrow pointers—ideal for illustrating demographic splits, buyer behavior, or psychographic segments. With space for four data-driven categories and custom labels, this template is perfect for marketers, analysts, and product teams looking to present actionable customer data. Fully editable in PowerPoint, Keynote, and Google Slides, and easy to adapt to any color scheme or branding.


6 slides
AIDA Diagram
The AIDA Diagram is a simple and effective marketing tool used to guide the design of advertising and promotional materials with the goal of attracting and retaining customers. AIDA stands for Attention, Interest, Desire, and Action, and it represents the four stages a potential customer goes through when exposed to marketing content. This infographic template is a classic marketing and advertising framework used to understand and guide the consumer's journey through the buying process. This infographic is completely customizable and compatible with Powerpoint, Keynote, and Google Slides.


5 slides
Management Levels Hierarchy Presentation
Effectively outline Management Levels Hierarchy with this structured pyramid diagram. Ideal for corporate presentations, HR strategy, and leadership training, this template visually represents top, middle, and lower management roles. Fully customizable in PowerPoint, Keynote, and Google Slides, making it easy to tailor for business planning and organizational structure discussions.


21 slides
Dreamwood Sales Pitch Deck Presentation
Deliver powerful sales presentations with this vibrant and engaging sales pitch deck template! It provides all essential sections, including sales objectives, customer testimonials, pricing strategy, and performance metrics, to help you leave a lasting impact. Perfect for business teams and client pitches, it’s compatible with PowerPoint, Keynote, and Google Slides for seamless customization.


7 slides
Veterinary Hospital Infographic
A veterinary hospital, is a medical facility that provides healthcare services to animals, primarily focusing on the diagnosis, treatment, and prevention of illnesses and injuries in pets and other animals. This vibrant and heartwarming infographic template brings to life the journey of our beloved pets through the lens of a caring veterinary hospital. Compatible with Powerpoint, Keynote, and Google Slides. This template celebrates the love, care, and healing that happens every day at veterinary hospitals. This infographic is a haven where wagging tails and purring hearts find comfort and a reason to smile.