


Features
- 5 Unique slides
- Fully editable and easy to edit in Microsoft Powerpoint, Keynote and Google Slides
- 16:9 widescreen layout
- Clean and professional designs
- Export to JPG, PDF or send by email


Do you have any questions?
Recommend


7 slides
Job Objective Infographic Presentation
A Job Objective is an introduction that summarizes an individual's career goals and objectives. This Template is designed to create a visual experience with a focus of solving your objectives, showcasing your expertise and individuality. Use this infographic to help you visually communicate your knowledge and skills with a powerful presentation. Highlight your experience, skills and key achievements. You can edit the graphics, photos, data and text in this template so that it fits your needs perfectly. All you have to do is just download this template in PowerPoint, Keynote, or Google Slides.


5 slides
Oil Industry Trends Infographics
The oil industry, also known as the petroleum industry, is a crucial sector of the global economy that involves exploration, production, refining, and distribution of petroleum products. These infographic templates are designed to showcase key trends and insights in the oil industry. They aims to present complex information in a clear and visually appealing manner, making it easy for your viewers to grasp important concepts and trends in the industry. This is perfect for anyone interested in understanding the trends and dynamics shaping the oil industry. Compatible with Powerpoint, Keynote, and Google Slides.


7 slides
National Survey Results Infographics
Survey Results can provide valuable insights and data that can be used to make informed decisions, improve offerings, and stay ahead of the competition. This survey results template features a clean design and is a completely customizable presentation that allows you to easily change the colors, fonts and graphics. You can use this infographic as a tool to insert into your product and marketing presentations. This presentation is compatible with Powerpoint, Keynote and Google Slides. Simply add your information and have it customized with your text and chart options to suit your needs.


6 slides
Unique Intersection Comparison Diagram
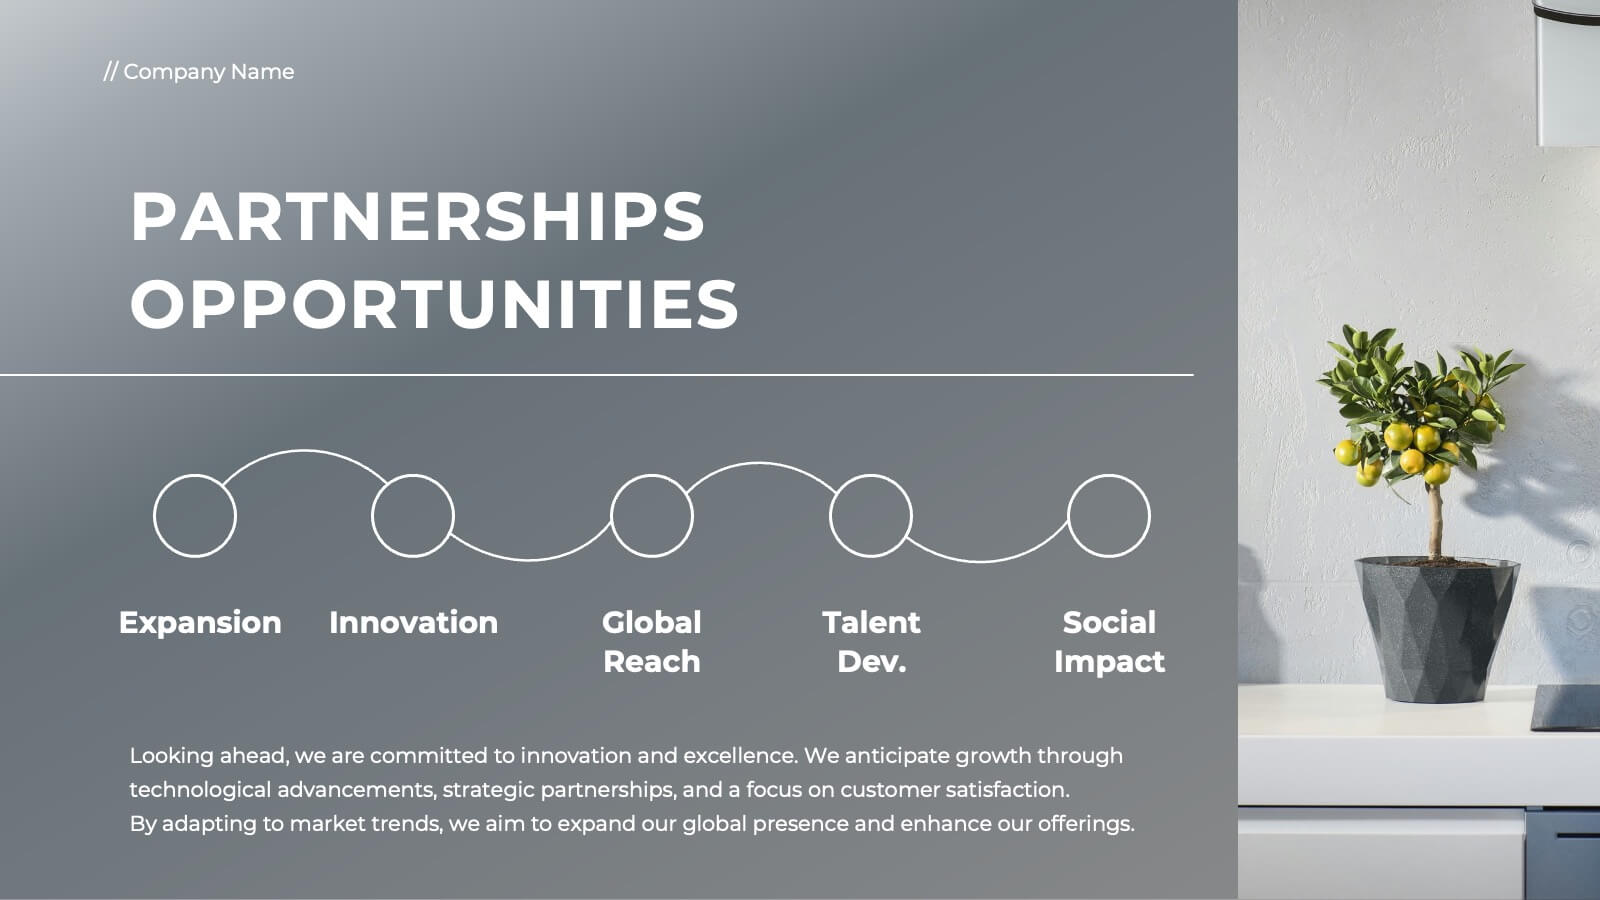
Illustrate complex relationships with clarity using the Unique Intersection Comparison Diagram Presentation. This visually engaging 5-circle diagram highlights overlaps and distinct points, ideal for showcasing cross-functional collaboration, multi-variable strategies, or layered comparisons. Each segment supports titles and brief text, making it perfect for business planning, product features, or audience segmentation. Fully editable in PowerPoint, Keynote, and Google Slides.


5 slides
3-Level Concentric Diagram Presentation
Bring clarity and structure to your ideas with a clean, layered diagram design that simplifies complex concepts. Perfect for showcasing stages, hierarchies, or interconnected systems, it keeps your audience engaged with visual balance and flow. Fully compatible with PowerPoint, Keynote, and Google Slides for effortless customization and presentation flexibility.


24 slides
Dreamveil UX Strategy Plan Presentation
Enhance your user experience strategy with this professionally designed UX Strategy Plan presentation. Covering essential topics such as user research, wireframes, prototyping, design principles, and usability guidelines, this deck offers a structured approach to refining your UX/UI processes. With a clean layout and engaging visuals, it’s perfect for teams, stakeholders, and clients looking to improve user interactions and design consistency. Fully customizable in popular formats like PowerPoint, Keynote, and Google Slides.


6 slides
PESTEL Analysis Business Presentation
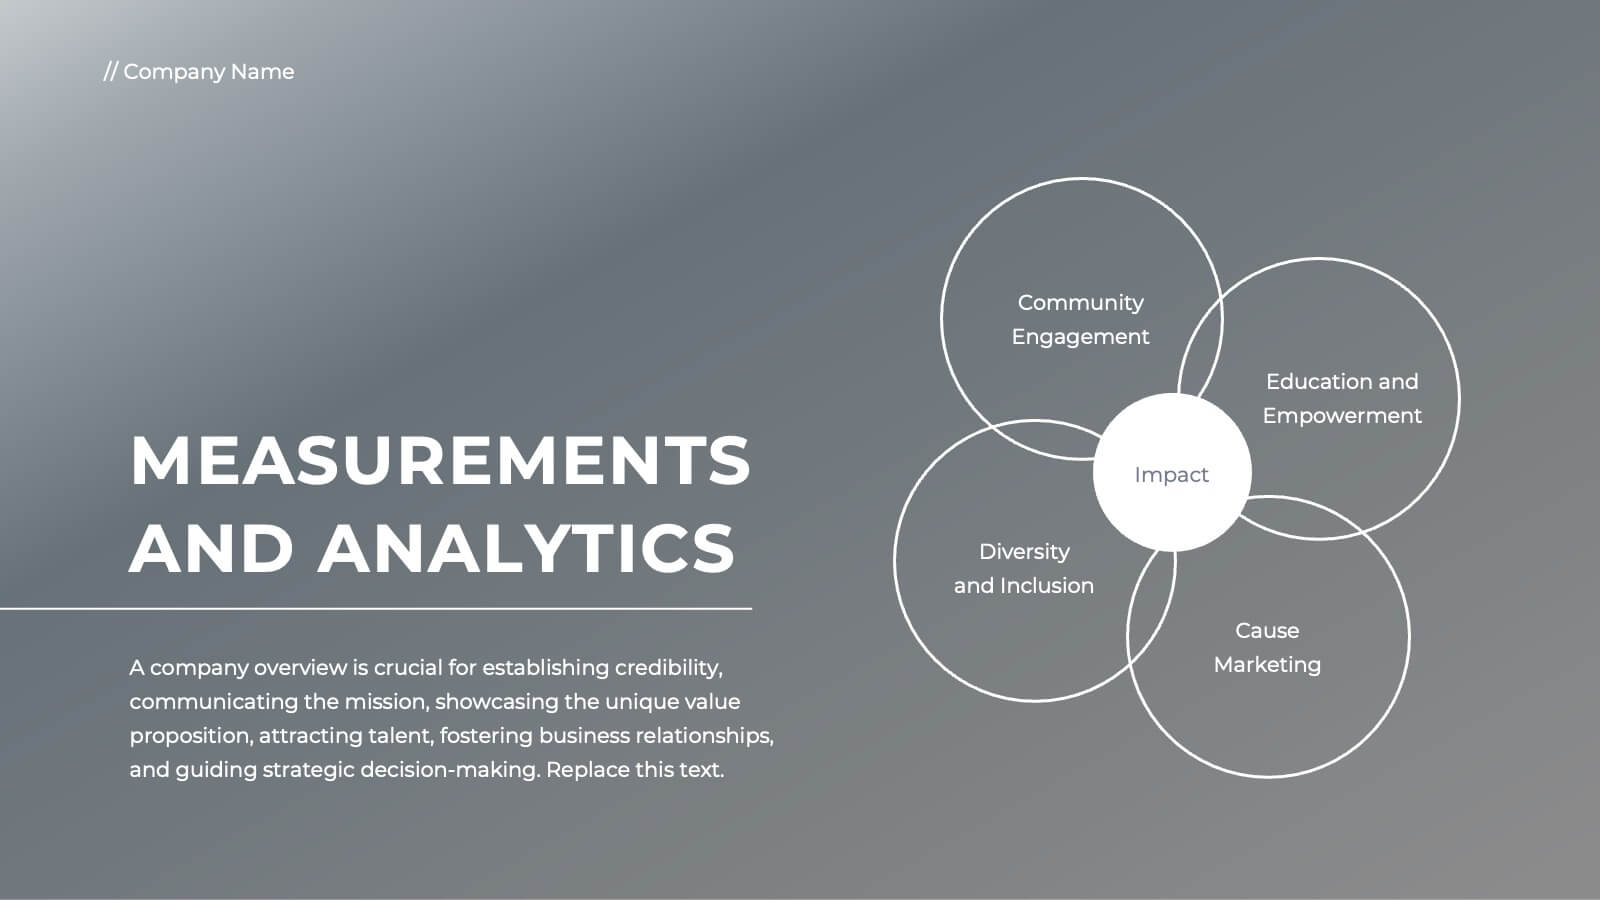
The "PESTEL Analysis Business Presentation" template effectively facilitates a comprehensive review of the political, economic, social, technological, environmental, and legal factors that impact strategic business decisions. This template is designed to help strategists, analysts, and managers evaluate and present external factors that could affect their business operations and market environment. Each segment of the analysis is visually represented through connected circles, making complex data easily understandable. This layout encourages a structured discussion on each PESTEL aspect, ensuring that all critical elements are covered, making it an essential tool for businesses looking to align their strategies with external conditions.


2 slides
Designer Portfolio for Client Showcase Presentation
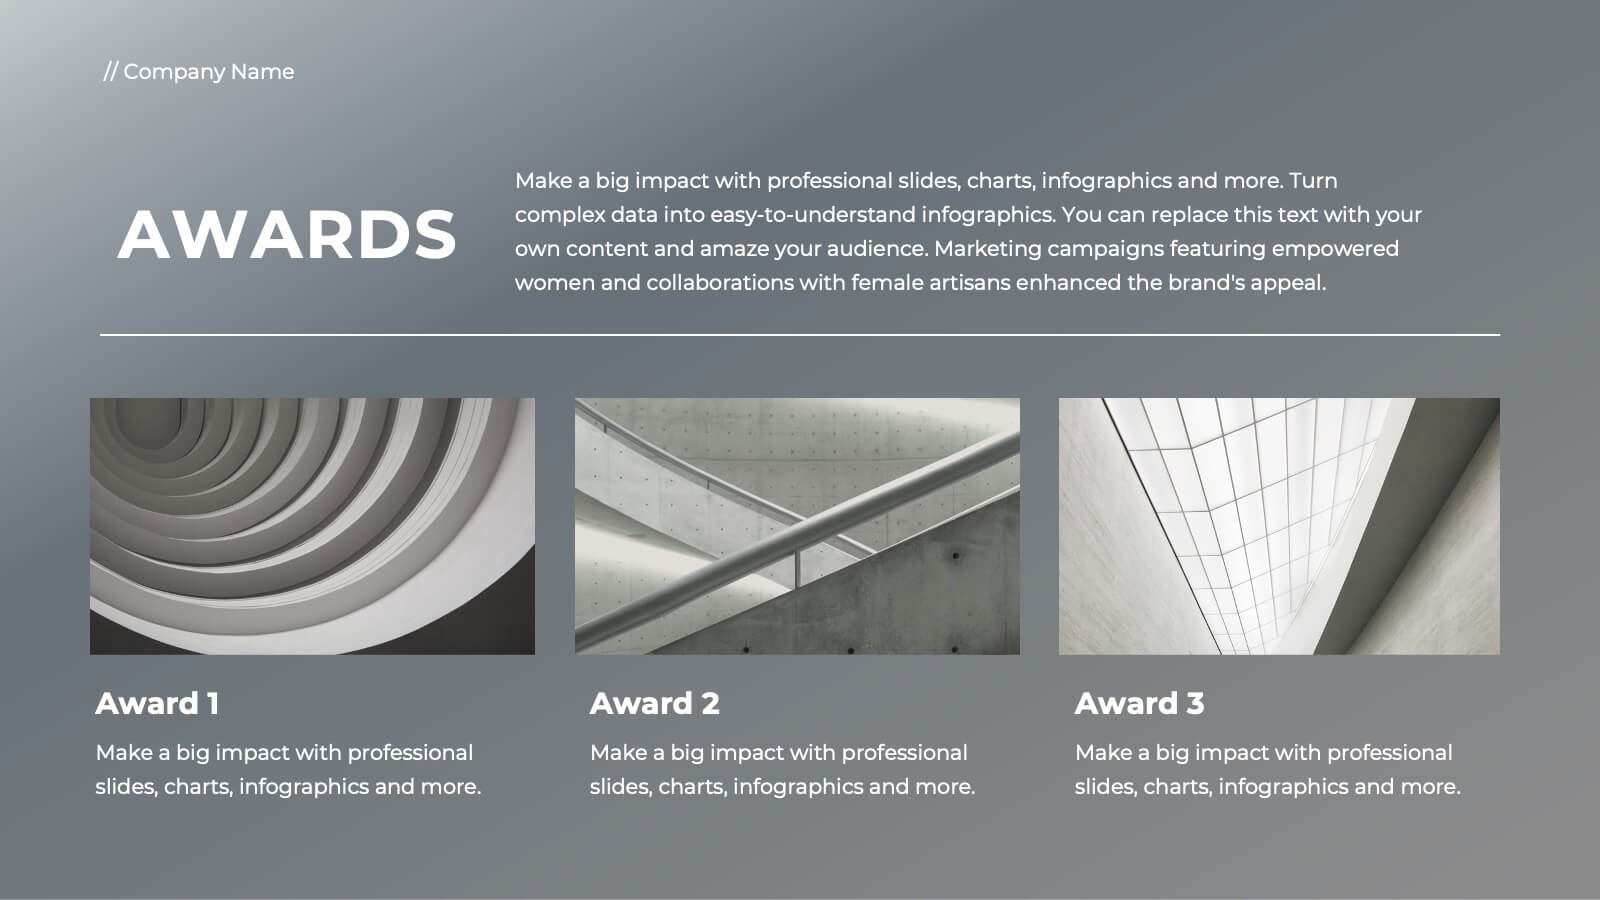
Showcase your creative work with the Designer Portfolio for Client Showcase Presentation. This sleek layout emphasizes visual storytelling, making it ideal for graphic designers, illustrators, and creatives presenting to potential clients. Highlight your projects in a clean, modern format. Compatible with Canva, PowerPoint, Keynote, and Google Slides for full customization.

22 slides
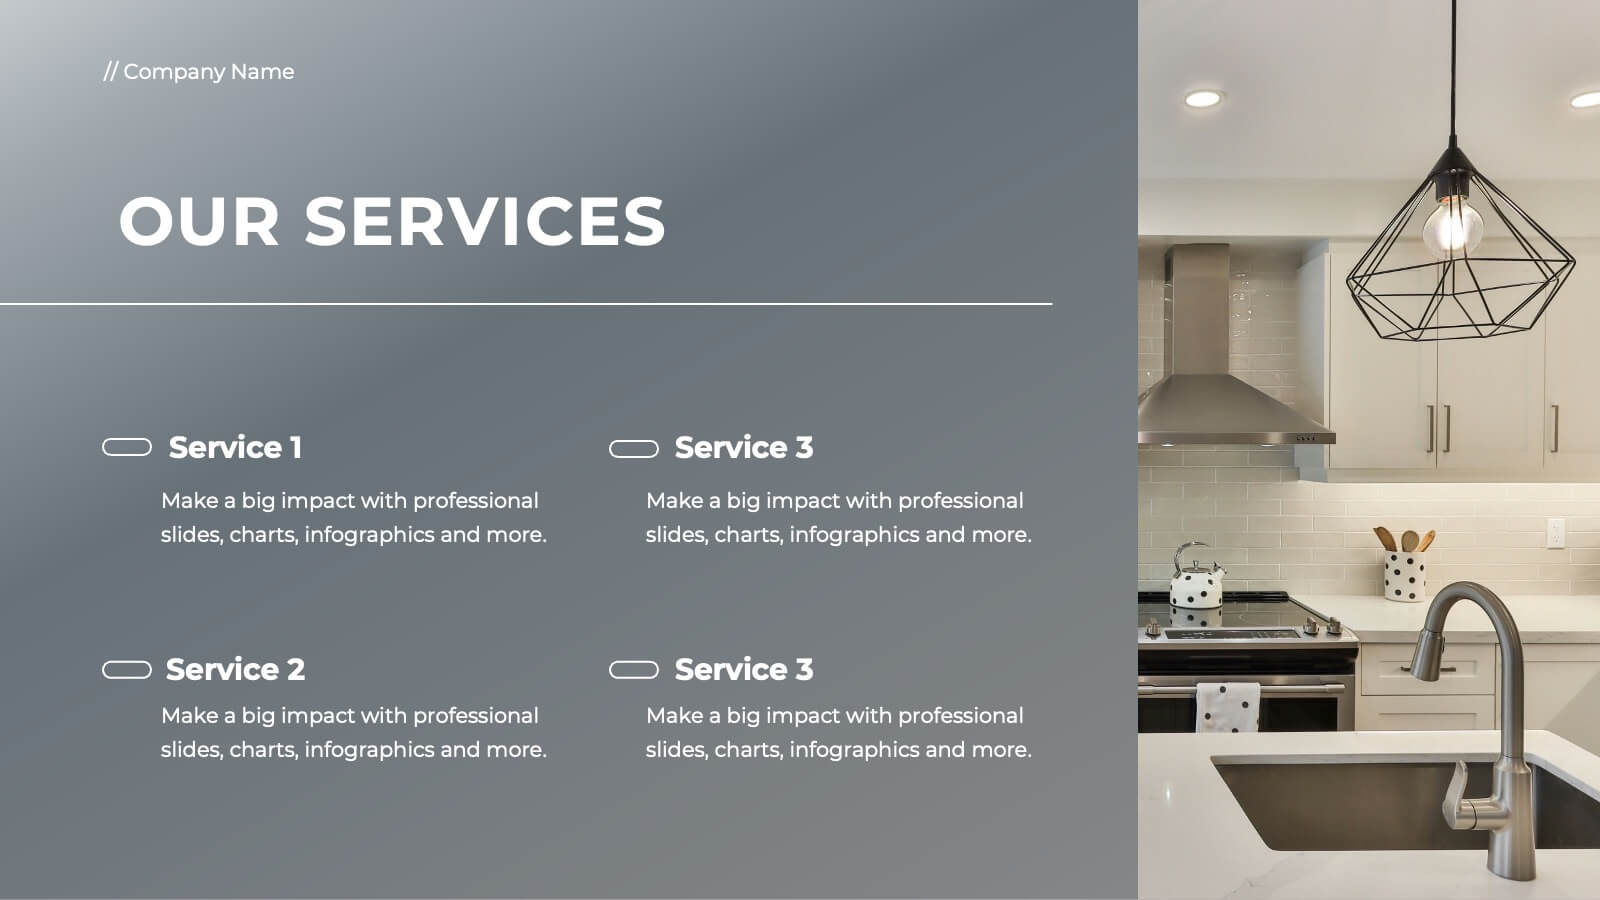
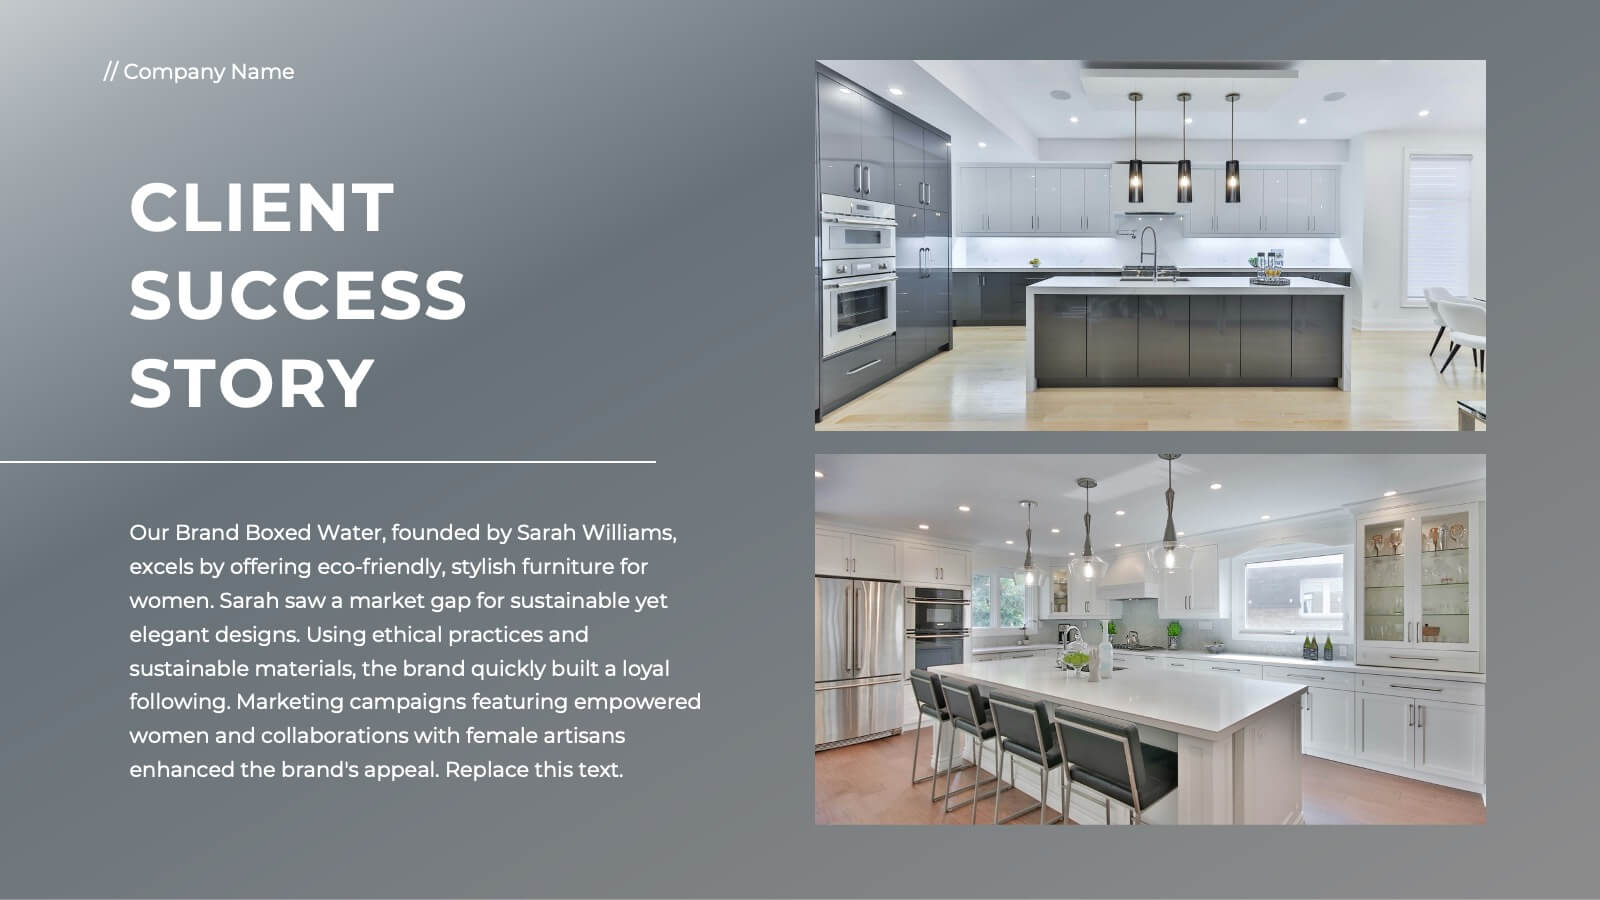
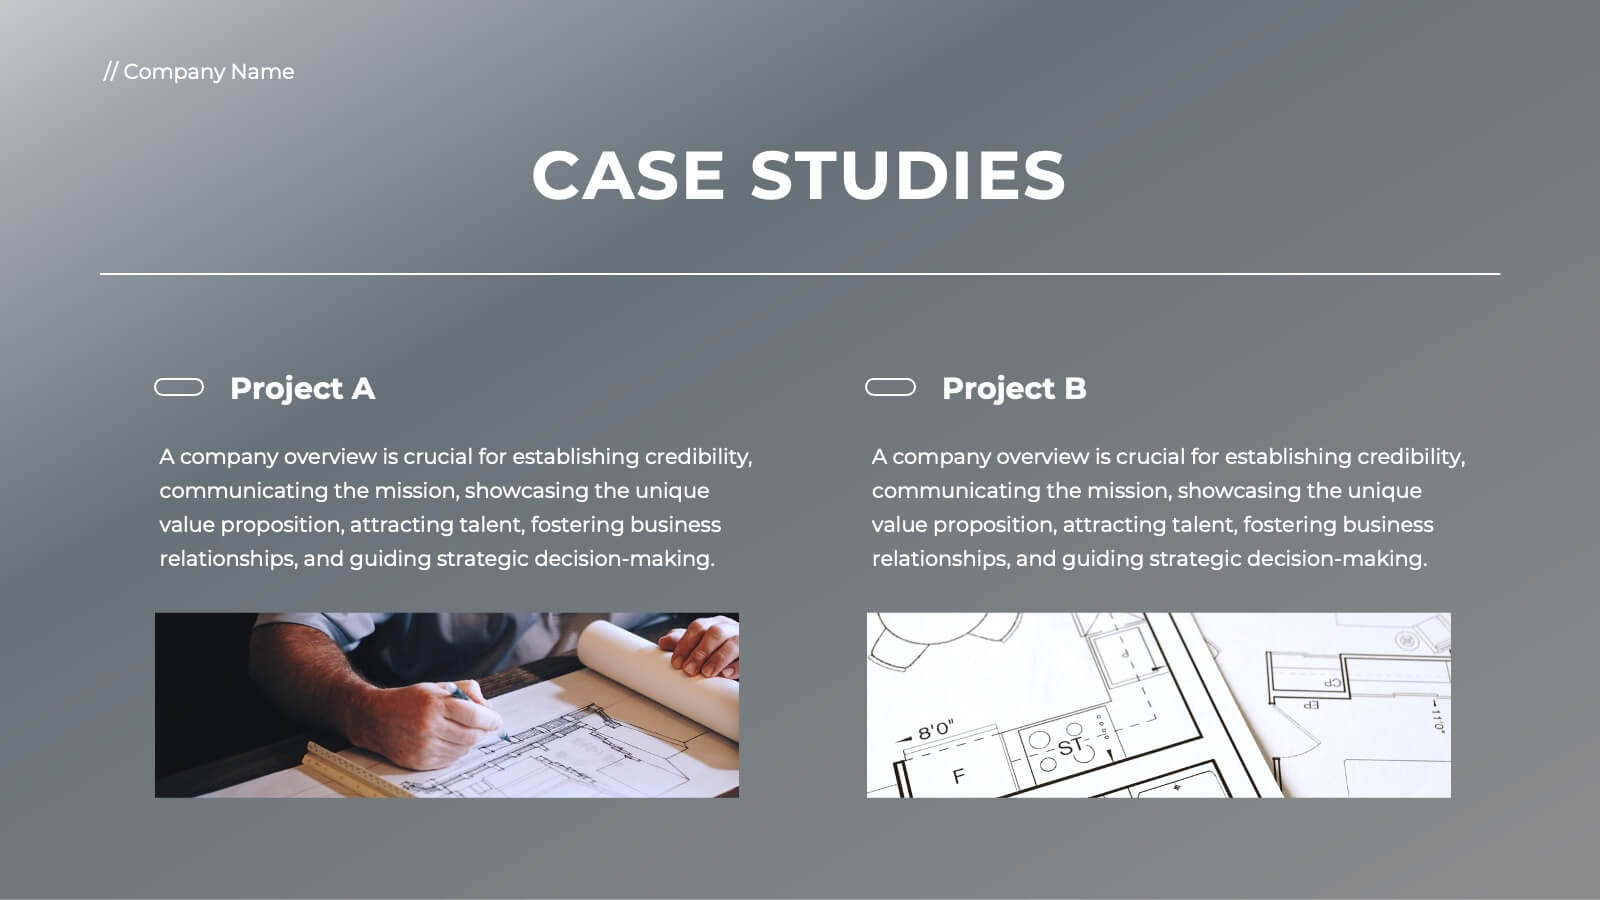
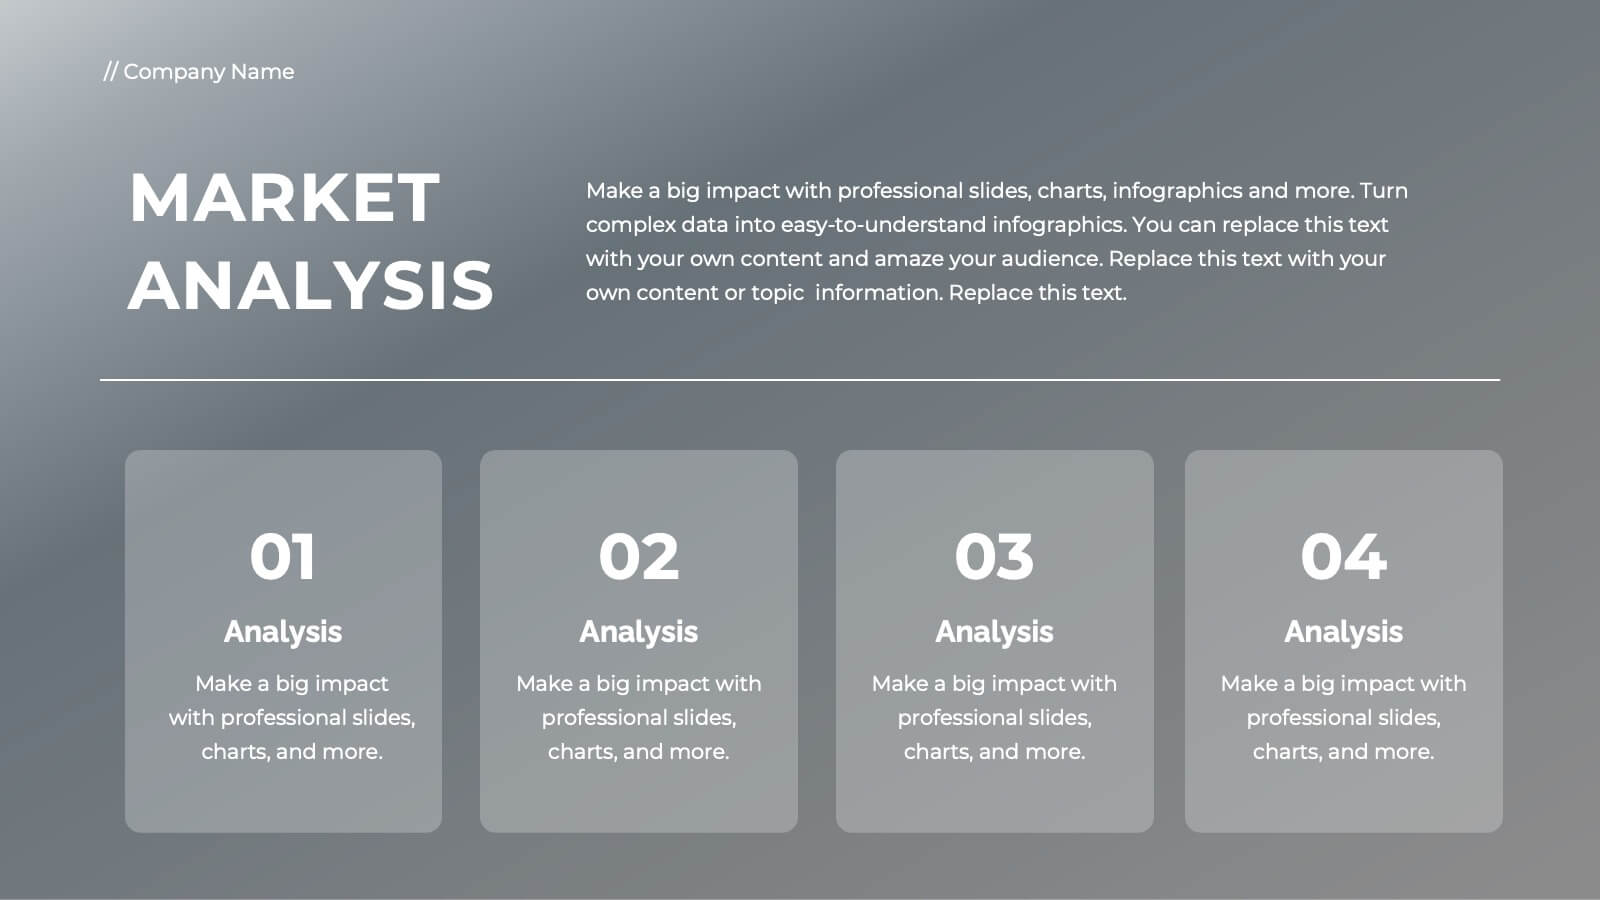
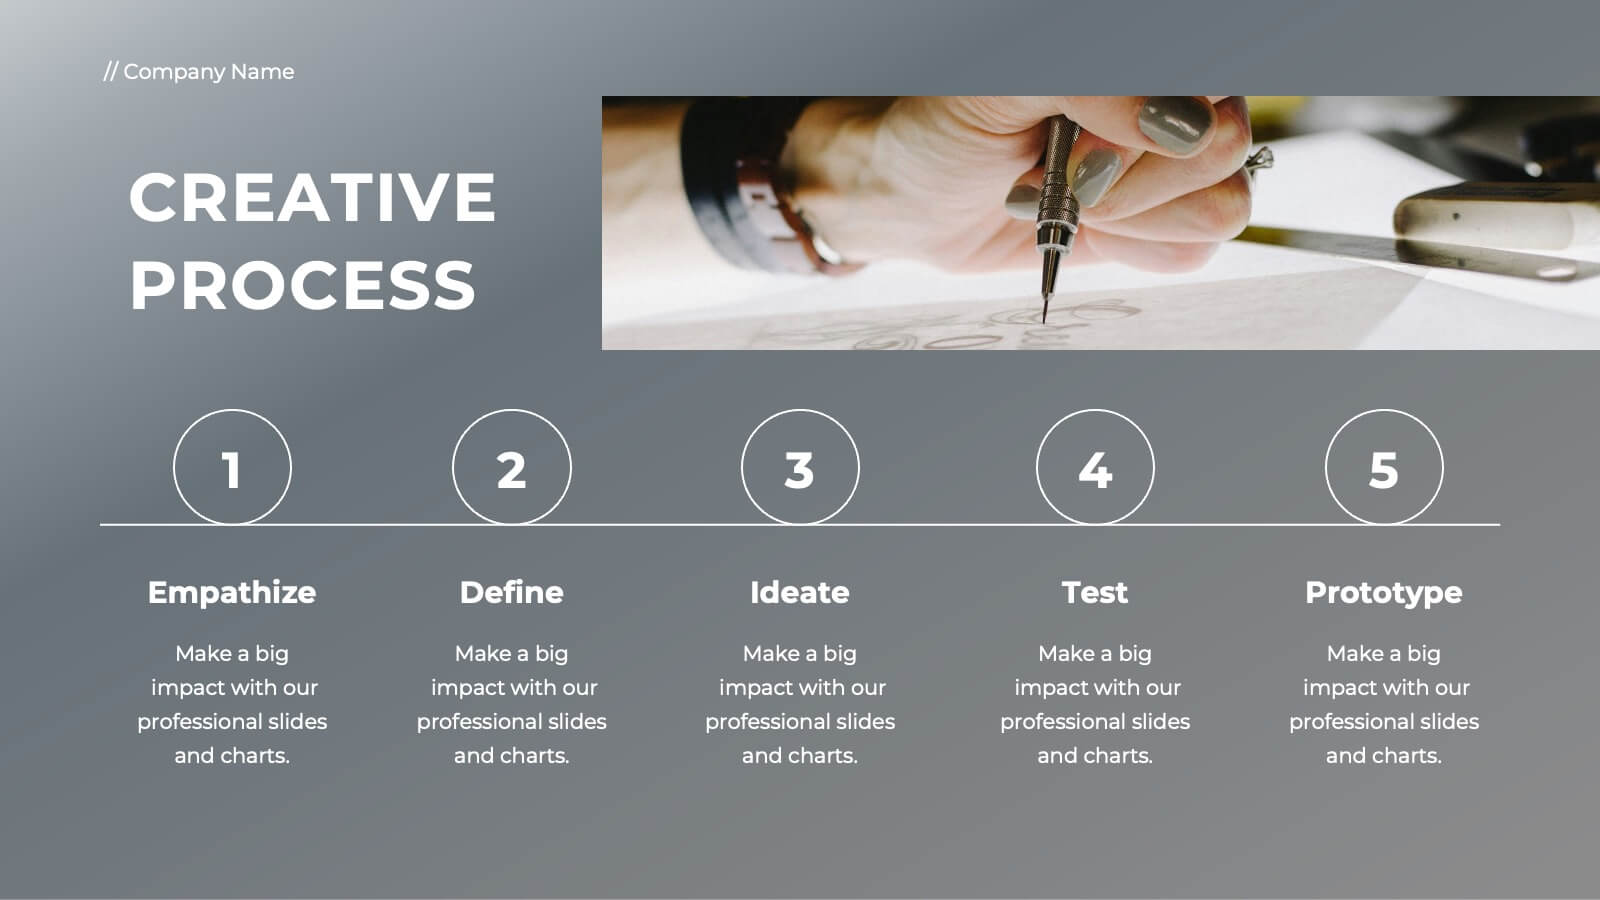
Ember Full-Service Agency Project Plan Presentation
Elevate your agency's presentation with this sleek project plan template! Ideal for showcasing your team's vision, market analysis, and client success stories, it includes slides for strategic development, campaign execution, and partnerships. Impress clients and stakeholders with professional visuals and detailed content. Compatible with PowerPoint, Keynote, and Google Slides for seamless presentations on any platform.


7 slides
Interpersonal Communication Infographic
Interpersonal communication is the process by which people exchange information, feelings, and meaning through verbal and non-verbal messages in various contexts. This vibrant infographic template is a visual exploration of the art of effective communication, revealing the key to building strong relationships both personally and professionally. Compatible with Powerpoint, Keynote, and Google Slides. Immerse yourself in the world of communication, where understanding and connection are paramount. This template will help you explore how technology has transformed communication, showcasing its advantages in the modern world.


8 slides
Social Media Engagement Metrics
Track engagement with clarity using the Social Media Engagement Metrics Presentation. This layout features a smartphone mockup at the center, with four vertically stacked icons representing key engagement indicators. Surrounding the device, space is allocated for concise data insights or definitions labeled A through D. Perfect for presenting analytics like likes, shares, comments, and reach. Fully editable in PowerPoint, Keynote, and Google Slides.


7 slides
Weight Challenge Infographic Presentation
Challenges are essential for personal and professional growth, and they play an important role in our lives in several ways. This template is designed for any and all use. You can use it in business, academic presentations, or home. This template is designed to give you flexibility in your presentations and allow you to create dynamic content that stands out from the crowd. This is compatible with Powerpoint, Keynote, and Google Slides so you can easily edit your presentation. This template can be used for a variety of projects, including team building, goal setting and brainstorming!


4 slides
Corporate Role Hierarchy Structure Presentation
Visualize your company’s reporting structure with this modern corporate role hierarchy diagram. Perfect for team overviews, leadership charts, or onboarding sessions. Each role node is clearly connected for easy understanding. Fully editable in Canva, PowerPoint, or Google Slides—ideal for HR teams, managers, or organizational planning presentations.


7 slides
Agenda Company Infographic
Optimize your corporate meetings with our premium collection of company agenda slide templates. Each slide is precisely designed to streamline and enhance the presentation of meeting agendas within a corporate setting. These templates are perfect for laying out the sequence of discussions, key points, and decision-making processes planned for corporate gatherings. The designs range from minimalistic layouts to more detailed ones, incorporating various graphical elements like charts, icons, and timelines to aid in visualizing the meeting’s structure. This not only helps in keeping the meeting on track but also enhances participant engagement by clearly outlining expectations and topics. These agenda slides are fully customizable, enabling adjustments in color schemes, text placement, and design elements to suit your corporate identity and specific meeting needs. Whether it's weekly team meetings, executive briefings, or annual general meetings, these templates provide the necessary structure to conduct efficient and effective corporate discussions.


4 slides
Data Analytics Heat Map Presentation
Turn complex data into clear insights with this dynamic heat map template! Ideal for visualizing trends, risks, or performance metrics, this design enhances decision-making at a glance. With fully customizable elements, it simplifies data analysis for business, finance, or research. Compatible with PowerPoint, Keynote, and Google Slides for seamless use.


5 slides
Comprehensive Sex Education Infographics
Navigate the sensitive landscape of human sexuality education with our comprehensive sex education infographics. Cast on a canvas of bold colors like black, yellow, and red, these infographics delicately handle the topics inherent to sex education. This tool is invaluable for educators, health professionals, advocacy groups, and policymakers who champion for informed, safe, and healthy choices. Compatible with Powerpoint, Keynote, and Google Slides. Ensuring the content resonates with audiences of diverse ages and backgrounds. The inclusion of compelling graphics and intuitive icons, fosters an environment of learning and openness, essential for impactful discussions.


6 slides
Risk Management in Insurance Presentation
Ensure Stability and Security with this Risk Management in Insurance Presentation template. Featuring a shield-themed layout, this slide effectively communicates key risk assessment strategies, mitigation plans, and compliance measures in the insurance sector. Ideal for insurance professionals, financial risk analysts, and compliance teams, this fully editable template is compatible with PowerPoint, Keynote, and Google Slides, allowing you to tailor the content to your specific risk management needs.