Customer Conversion Funnel Presentation
PowerPoint Template and Google Slides Theme


Features
- 10 Unique Slides
- Fully editable and easy to edit in Microsoft Powerpoint, Keynote and Google Slides
- 16:9 widescreen layout
- Clean and professional designs
- Export to JPG, PDF or send by email
- Remove from favorites
Powerpoint Template
1 MB
Google Slides Template
External link
Keynote Template
1 MB
Recommend
- Remove from favorites
Powerpoint Template
1 MB
Google Slides Template
External link
Keynote Template
1 MB
6 slides
4 Stage Roadmap Template
Navigate your projects with clarity using our "4 Stage Roadmap Template." This engaging presentation template offers a unique, pathway-like design to outline the progression of any project through four distinct stages. Each step is visually differentiated, making it easy to follow and understand the sequence and dependencies of tasks. Perfect for project managers and teams, this template ensures your strategic milestones are visually aligned and easy to communicate. Compatible with PowerPoint, Keynote, and Google Slides, it's an essential tool for effective project visualization and management.
- Remove from favorites
Powerpoint Template
6 MB
Google Slides Template
External link
Keynote Template
5 MB
26 slides
Retail Industry Trends Presentation
Immerse yourself in the evolving world of commerce with a presentation template that brings the latest retail trends to the forefront. Ideal for market analysts, store managers, or business strategists, the slides combine a contemporary look with insightful layouts that highlight key industry shifts and consumer patterns. From the colorful introductions of team members to the analysis of market dynamics, this template facilitates a comprehensive look at the retail landscape. Visualize data with stylish charts, compare competitive strategies with dynamic slides, and track the growth trajectory with crisp infographics. Each element is designed to not just inform but also to engage your audience with the vibrant nature of today's retail environment. The collection ensures that your presentation is both an informative journey and a visually appealing experience, ready to be tailored in Keynote, Google Slides, and PowerPoint for audiences across the retail spectrum.
- Remove from favorites
Powerpoint Template
1 MB
Google Slides Template
External link
Keynote Template
1 MB
5 slides
Workforce Performance Evaluation Slide Presentation
Evaluate performance with clarity using the Workforce Performance Evaluation Slide presentation. This star-rating format helps you visually assess employee contributions, competencies, and overall effectiveness. Ideal for HR reviews, team feedback sessions, and progress tracking. Easily editable in PowerPoint, Keynote, or Google Slides.
- Remove from favorites
Powerpoint Template
1 MB
Google Slides Template
External link
Keynote Template
1 MB
10 slides
Business KPI Metrics Dashboard
Maximize your business analysis with our "Business KPI Metrics Dashboard" template. This detailed infographic is designed to clearly present key performance indicators (KPIs) using a variety of charts, including bar graphs, line charts, and histograms. Each chart is color-coded to distinguish different metrics such as sales volume, revenue growth, and customer engagement, facilitating quick understanding and comparison. This layout is ideal for executives, analysts, and managers, supporting data-driven decisions in strategic reviews and planning sessions. Fully compatible with PowerPoint, Keynote, and Google Slides, this template is essential for any business looking to effectively communicate performance trends and insights.
- Remove from favorites
Powerpoint Template
1 MB
Google Slides Template
External link
Keynote Template
1 MB
5 slides
Business Organizational Structure Presentation
Showcase your Business Organizational Structure with this modern and professional infographic template. Designed to visually represent company hierarchy, this slide enhances clarity in roles, team relationships, and reporting structures. Fully customizable in PowerPoint, Keynote, and Google Slides, making it perfect for corporate strategy presentations, HR reports, and leadership meetings.
- Remove from favorites
Powerpoint Template
1 MB
Google Slides Template
External link
Keynote Template
1 MB
5 slides
RAPID Decision-Making Roles Overview Presentation
Clarify accountability and streamline decisions with the RAPID Decision-Making Roles Overview Presentation. This visual layout breaks down the five essential roles—Recommend, Agree, Perform, Input, and Decide—into a clear quadrant diagram. Ideal for project teams, leadership alignment, or decision-making workshops. Fully editable in PowerPoint, Google Slides, Keynote, and Canva.
- Remove from favorites
Powerpoint Template
9 MB
Google Slides Template
External link
Keynote Template
10 MB
26 slides
Wildlife Photography Presentation
Unleash the wild beauty of nature with this presentation template, specifically designed to highlight the splendor and complexity of wildlife photography. Each slide serves as a window into the animal kingdom, featuring vivid images that capture the essence of wildlife in their natural habitats. The design is both vibrant and organized, allowing photographers and nature enthusiasts to showcase their work in a structured yet visually engaging manner. The template offers a variety of layouts that can accommodate a range of content, from detailed animal profiles to the narratives behind each shot. With tools like comparison slides, you can juxtapose images from different environments, and with chart slides, you can present the technical aspects of wildlife photography. Suitable for educational purposes, exhibitions, or photography workshops, this template is versatile for use with PowerPoint, Keynote, and Google Slides, making it a perfect choice for sharing the beauty of the wild with a broad audience.
- Remove from favorites
Powerpoint Template
3 MB
Google Slides Template
External link
Keynote Template
2 MB
4 slides
Vision Statement Slide Presentation
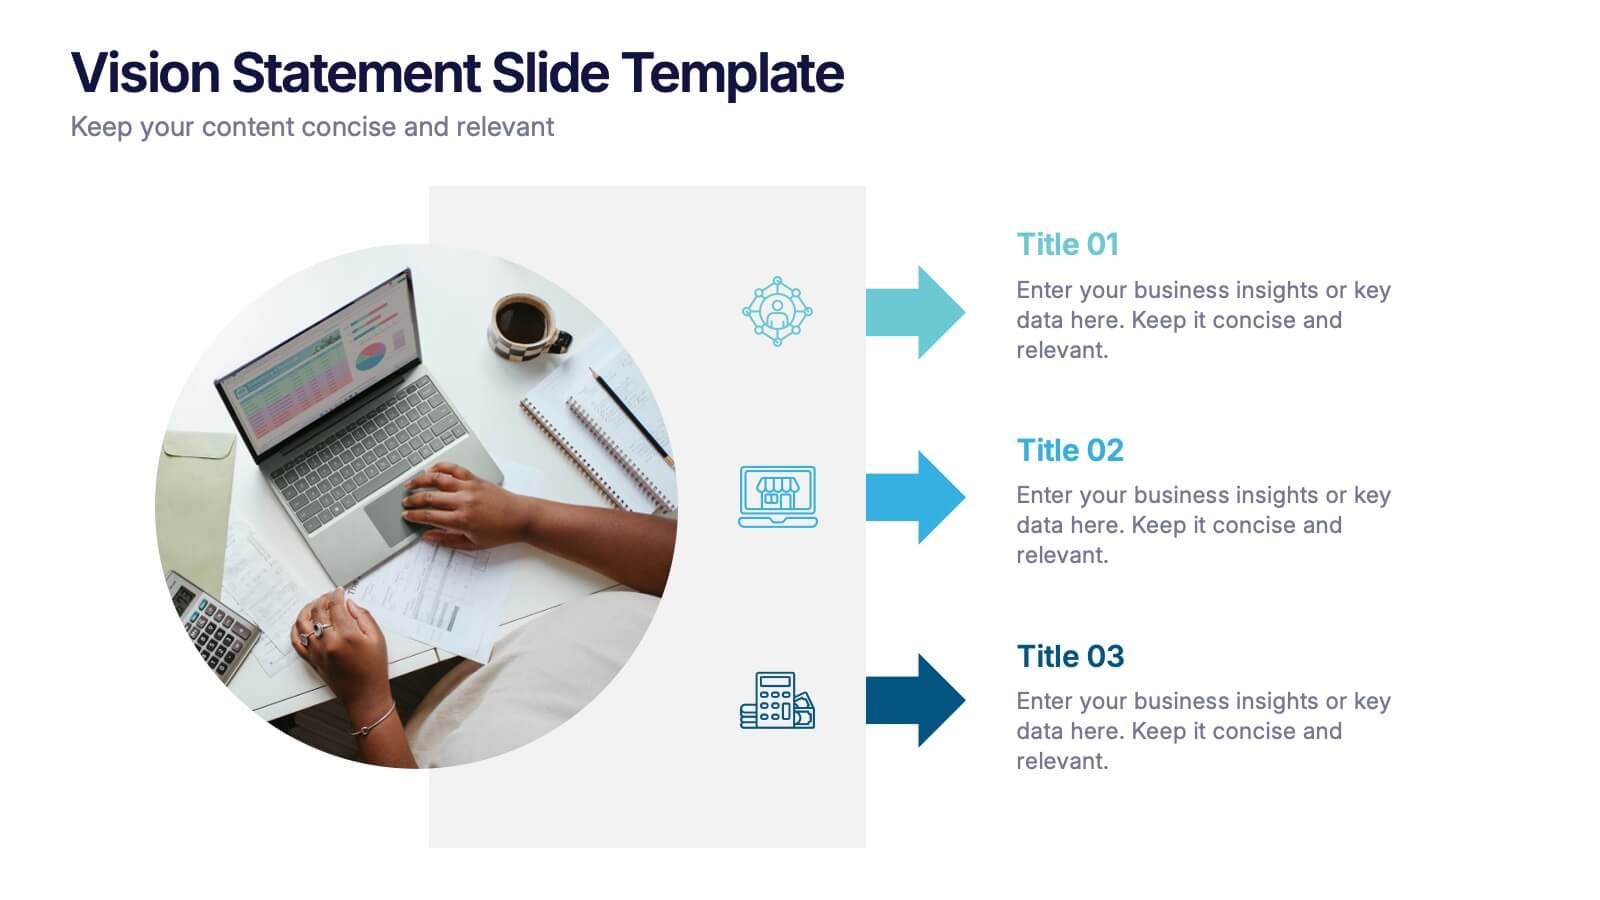
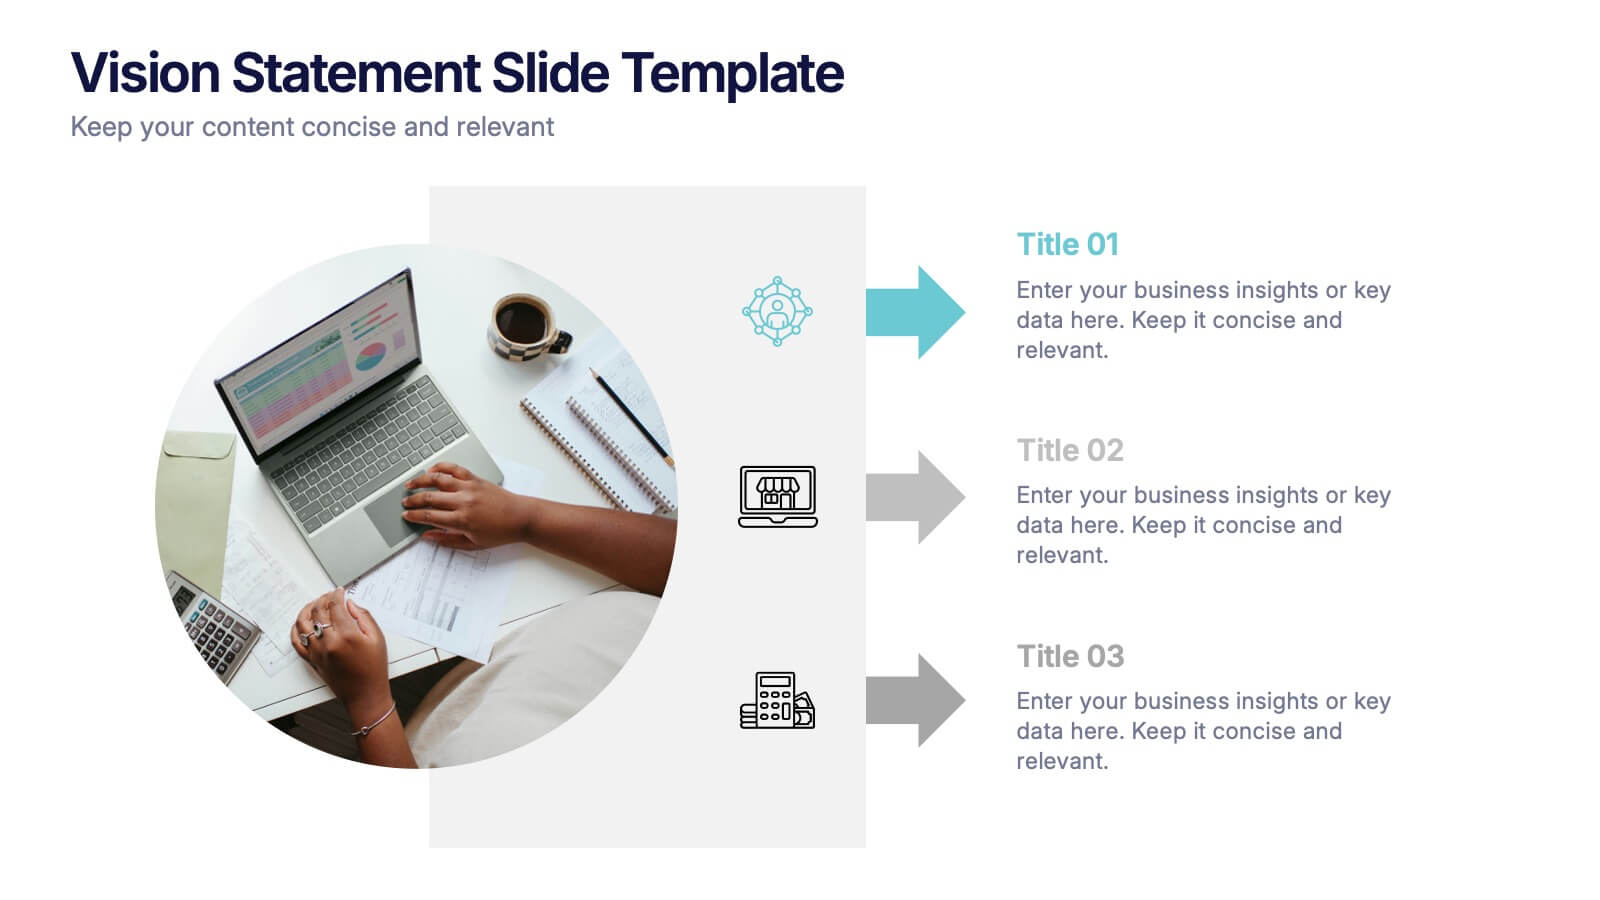
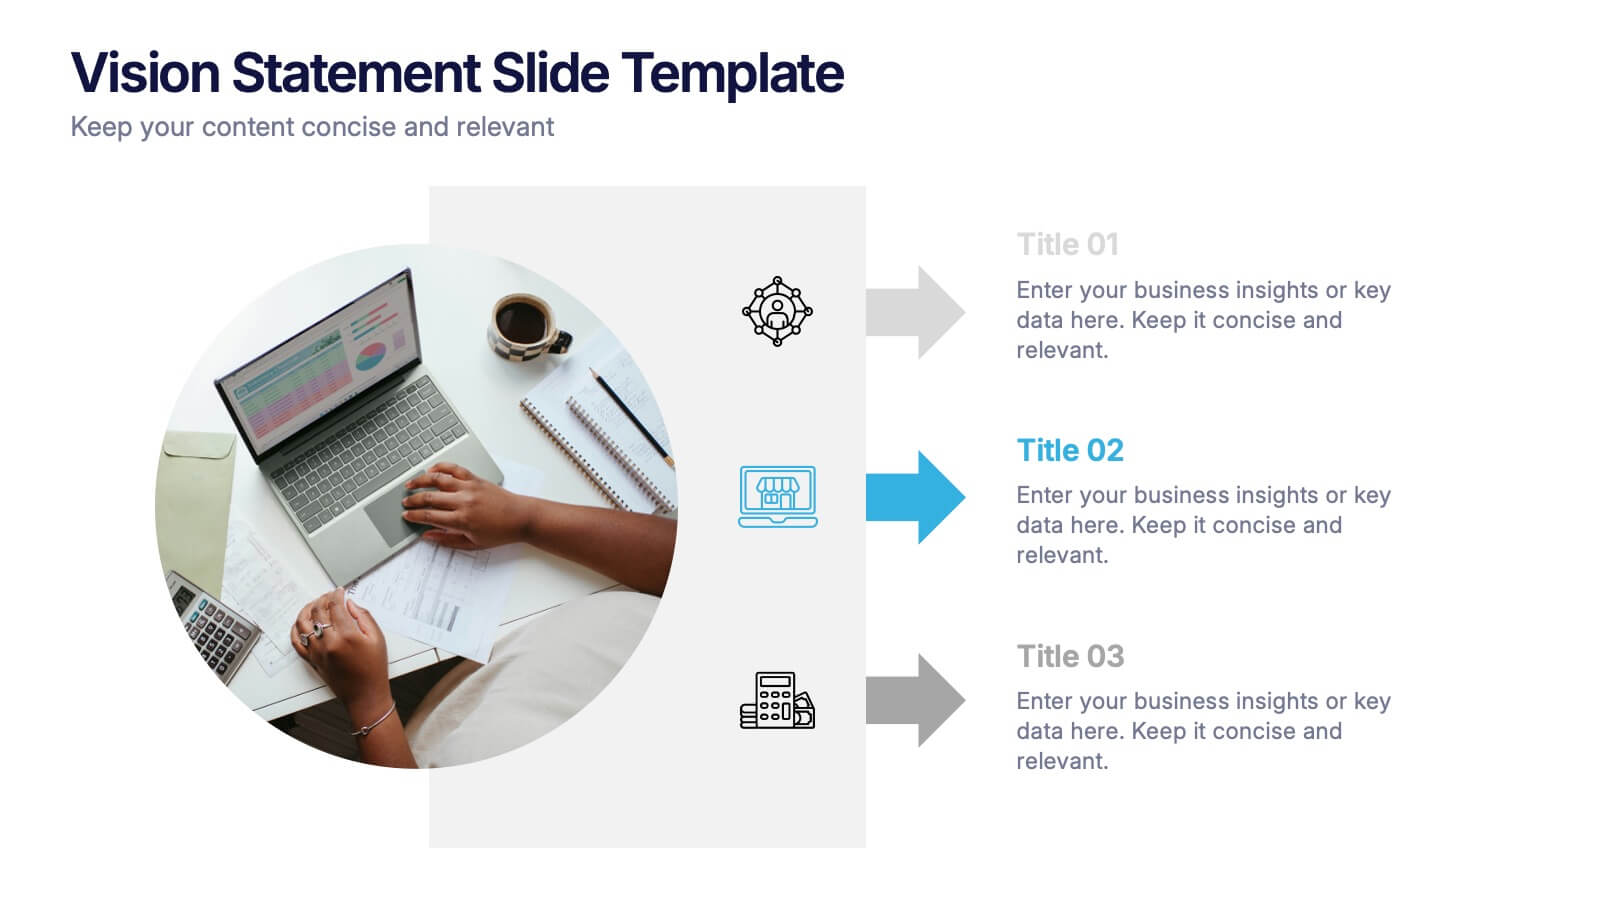
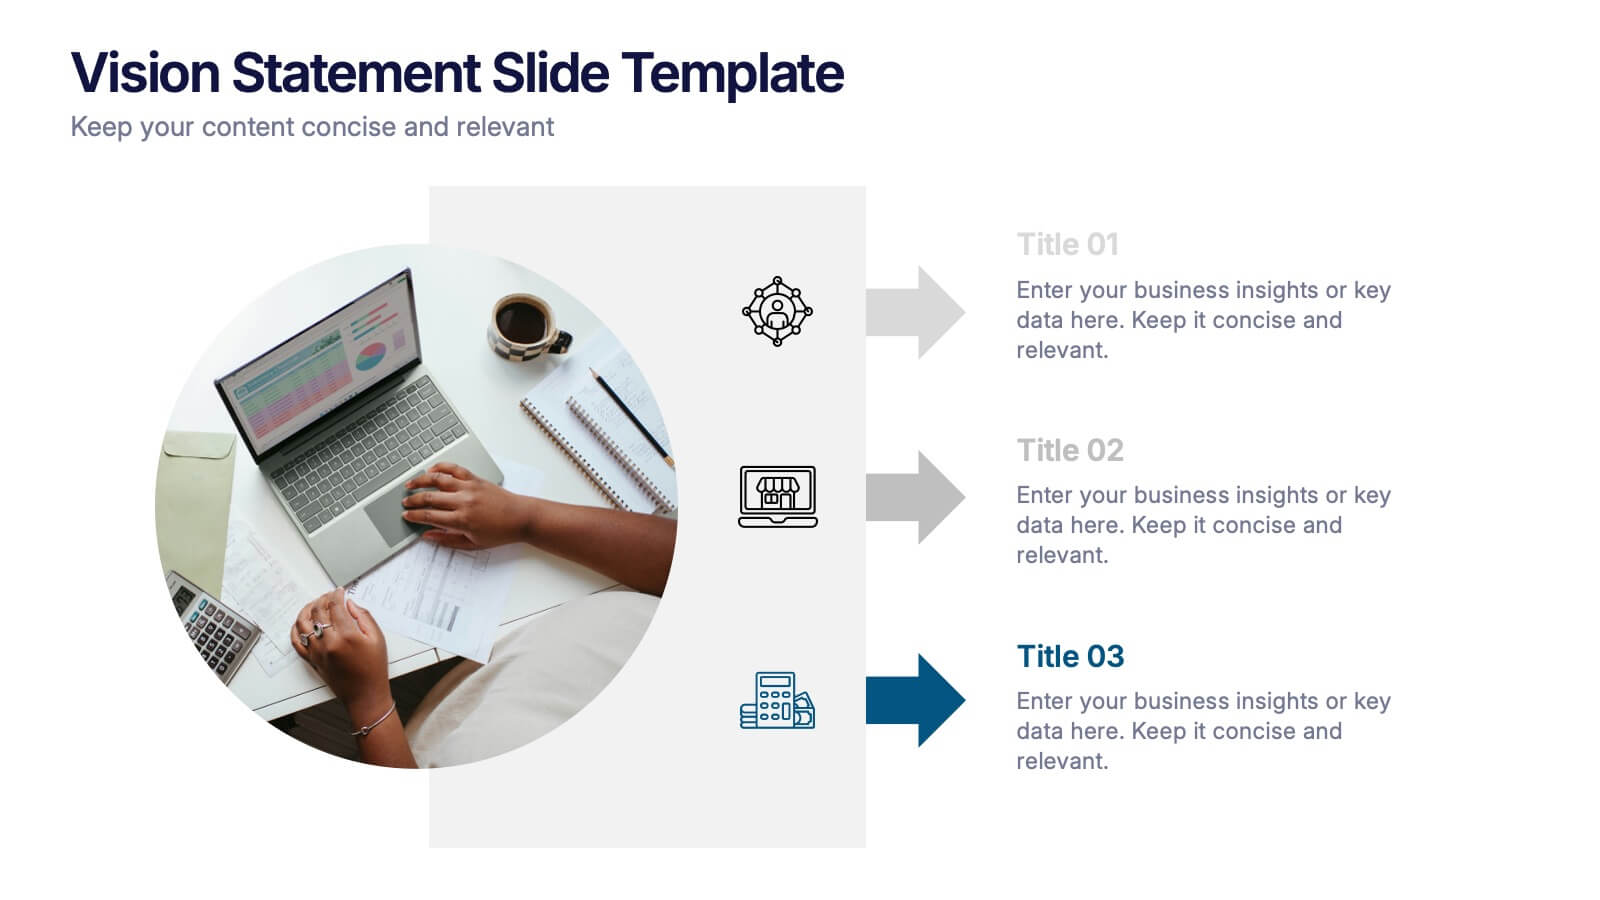
Spark inspiration from the very first slide with a clean, modern layout designed to express future goals with clarity and confidence. This presentation helps teams communicate direction, long-term aspirations, and strategic focus in a simple, structured format. Fully compatible with PowerPoint, Keynote, and Google Slides.
- Remove from favorites
Powerpoint Template
1 MB
Google Slides Template
External link
Keynote Template
1 MB
6 slides
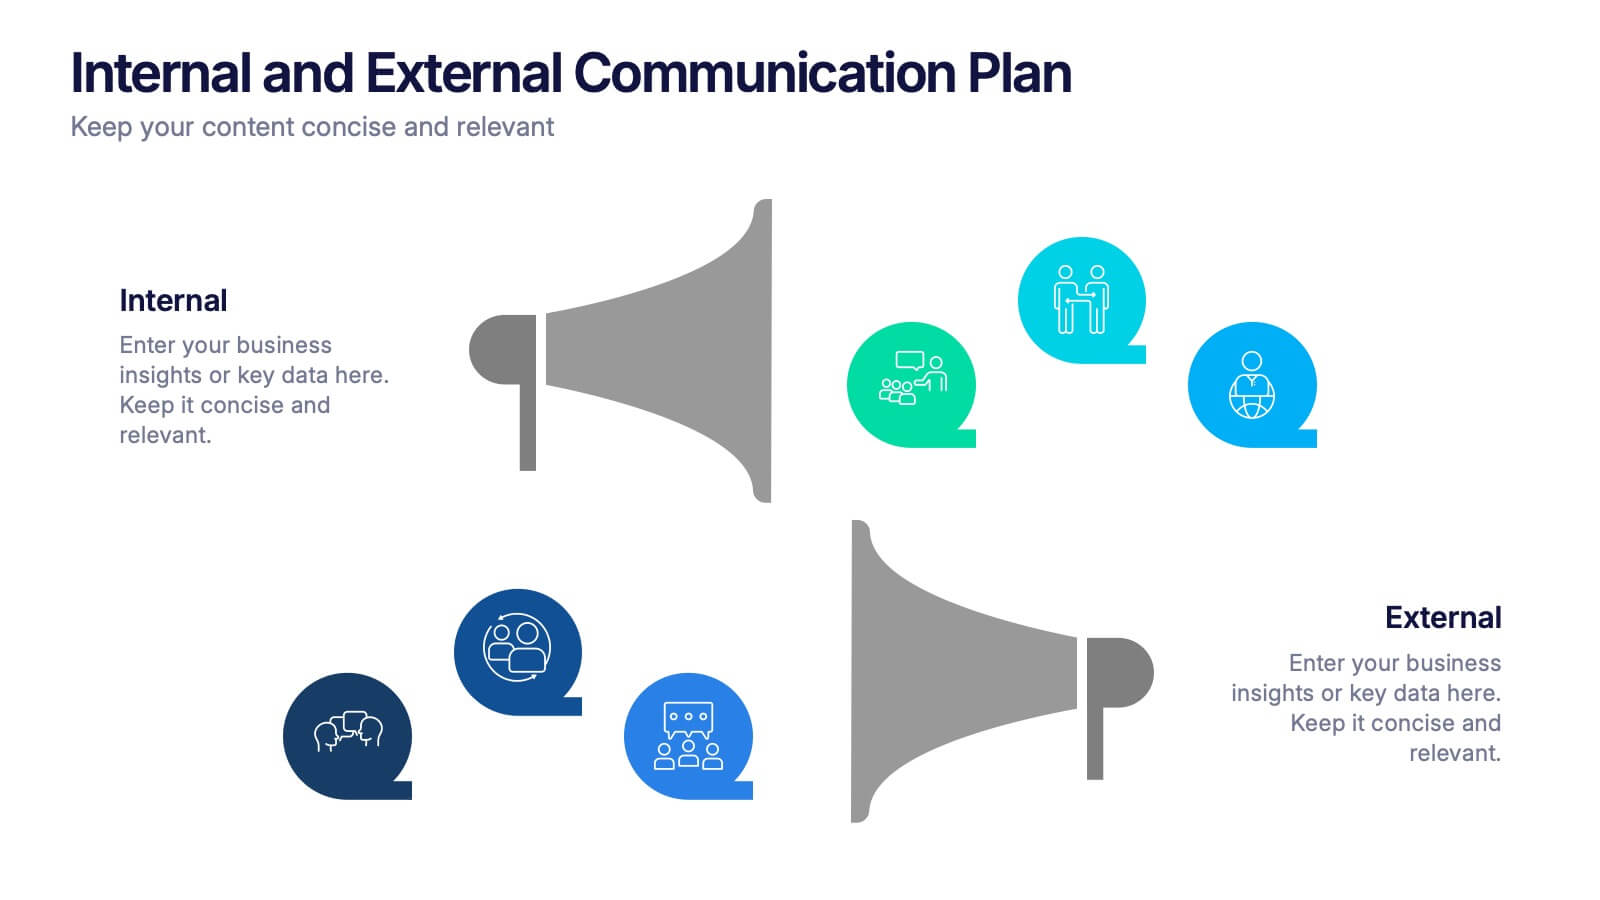
Internal and External Communication Plan
Visualize your communication strategy with this dual-channel megaphone infographic, perfect for showcasing internal and external messaging flows. Ideal for corporate updates, PR plans, or stakeholder communications. Fully editable in PowerPoint, Keynote, and Google Slides.
- Remove from favorites
Powerpoint Template
1 MB
Google Slides Template
External link
Keynote Template
1 MB
8 slides
Blue Ocean Strategy Business Model Presentation
Chart unexplored market territories with our Blue Ocean Strategy Business Model template! This dynamic presentation tool, designed to simplify complex business strategies, illustrates the pivotal elements of cost reduction and value innovation to unlock new buyer value. Compatible with PowerPoint, Keynote, and Google Slides, it's ideal for strategists aiming to create uncontested market spaces and make competition irrelevant. Perfect for workshops, business meetings, or strategy sessions.
- Remove from favorites
Powerpoint Template
1 MB
Google Slides Template
External link
Keynote Template
1 MB
6 slides
Demographic Trends and Audience Breakdown Presentation
Visualize key audience segments and population trends with this modern demographic breakdown slide. Featuring a clean circular chart layout, it's perfect for showcasing age, gender, location, or behavioral data. Ideal for marketing, branding, or user research reports, it turns complex demographics into clear, impactful insights for strategic planning and targeting.
- Remove from favorites
Powerpoint Template
6 MB
Google Slides Template
External link
Keynote Template
8 MB
26 slides
Digital Transformation Trends Presentation
In the fast-paced world of technology, staying ahead means keeping up with the latest digital transformation trends. This presentation template is crafted for professionals who aim to discuss cutting-edge developments in digital transformation. With a dynamic blend of vibrant gradients and clean, modern design elements, it's perfect for conveying complex information in an engaging way. The slides are diverse, encompassing everything from team introductions to detailed infographics and data visualization. Whether you're presenting a timeline of technological advances, outlining a business strategy, or showcasing global impact with an Africa map slide, these templates are versatile and easy to customize. Suitable for PowerPoint, Keynote, and Google Slides, they are designed for seamless integration across platforms, ensuring your presentation is accessible anywhere, anytime. If you're a strategist, tech analyst, or business leader looking to present on digital trends, this set will help you create a narrative as innovative as the subject you're covering.
- Remove from favorites
Powerpoint Template
1 MB
Google Slides Template
External link
Keynote Template
1 MB
6 slides
Milestone Roadmap and Deadlines Presentation
Track progress with clarity using the Milestone Roadmap and Deadlines Presentation. This curved timeline layout highlights six key stages or deliverables with color-coded markers and icons. Perfect for visualizing project phases, quarterly goals, or deadline-driven strategies. Fully editable and compatible with PowerPoint, Keynote, and Google Slides.
- Remove from favorites
Powerpoint Template
1 MB
Google Slides Template
External link
Keynote Template
2 MB
6 slides
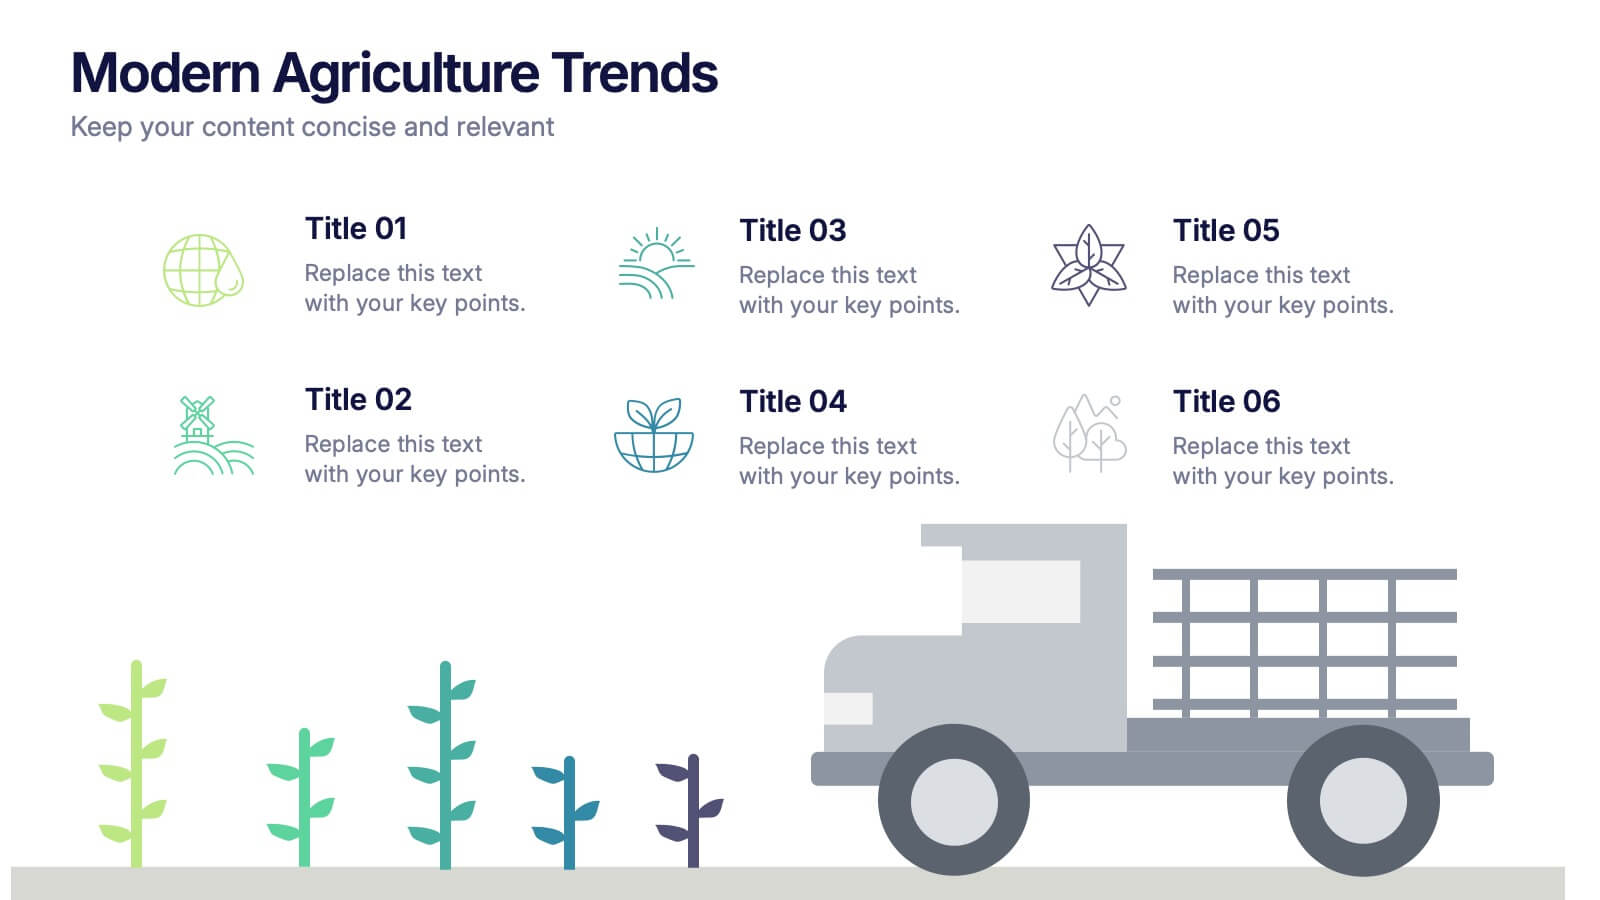
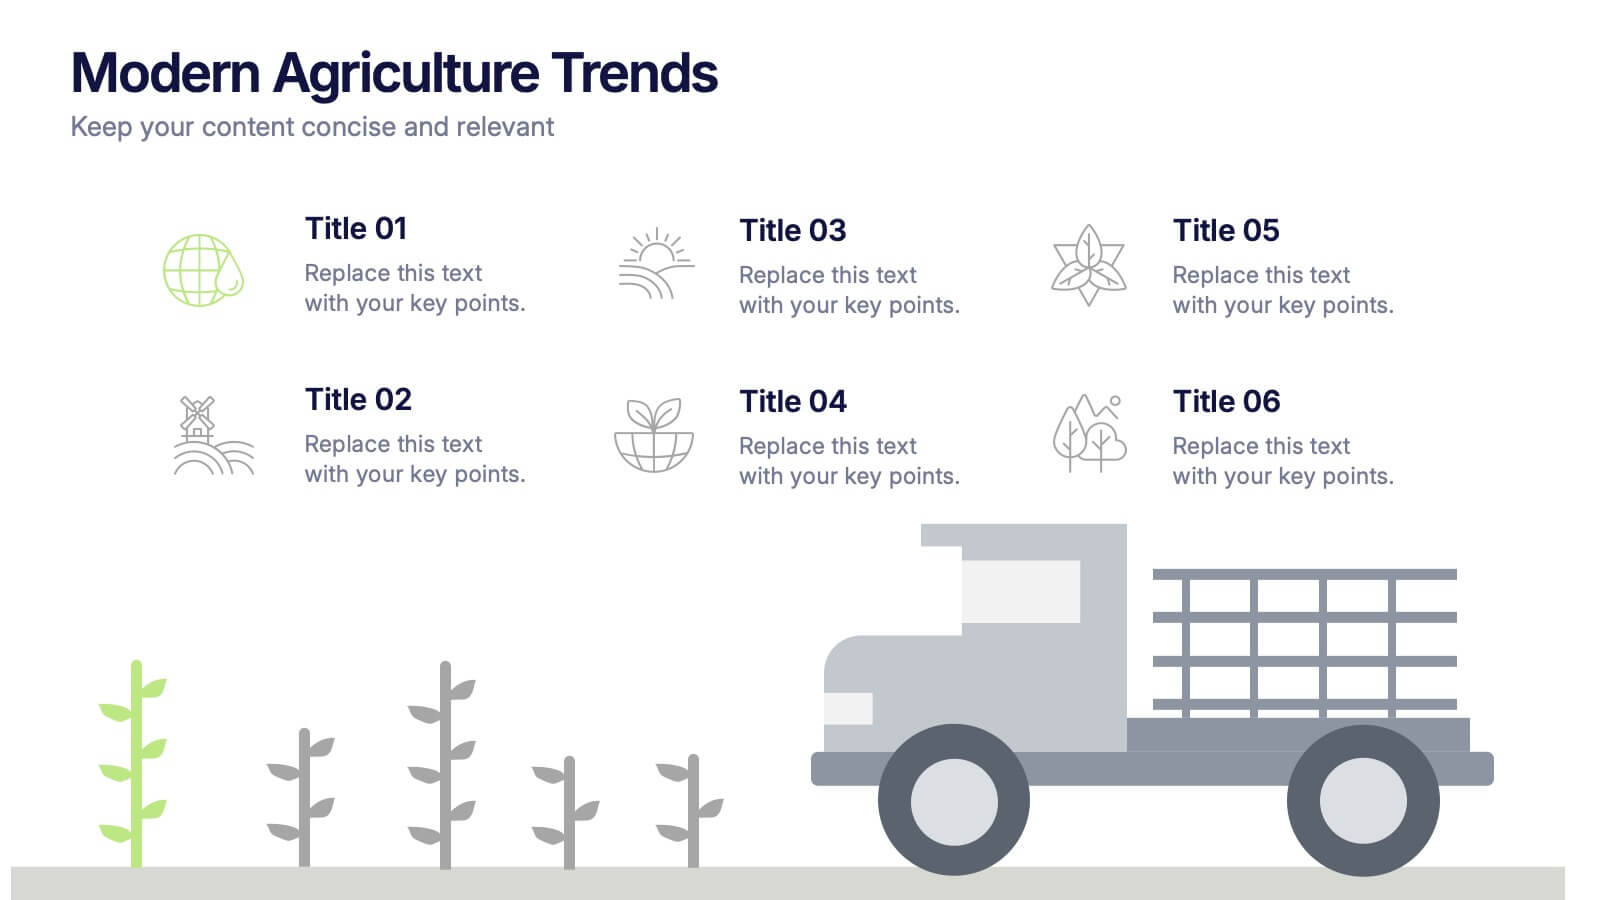
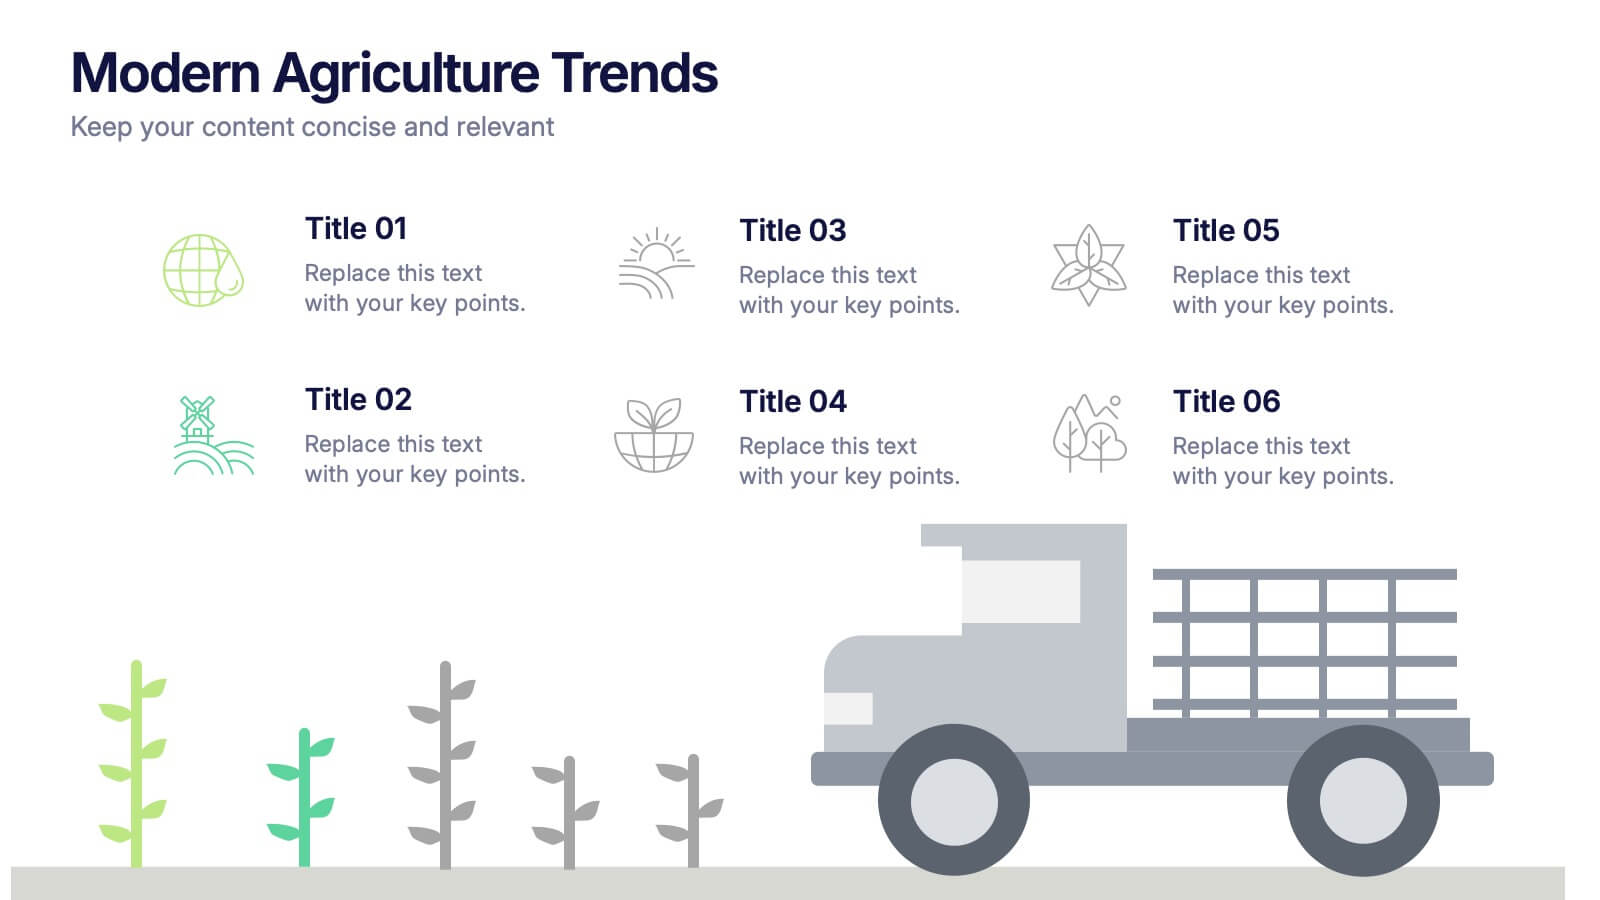
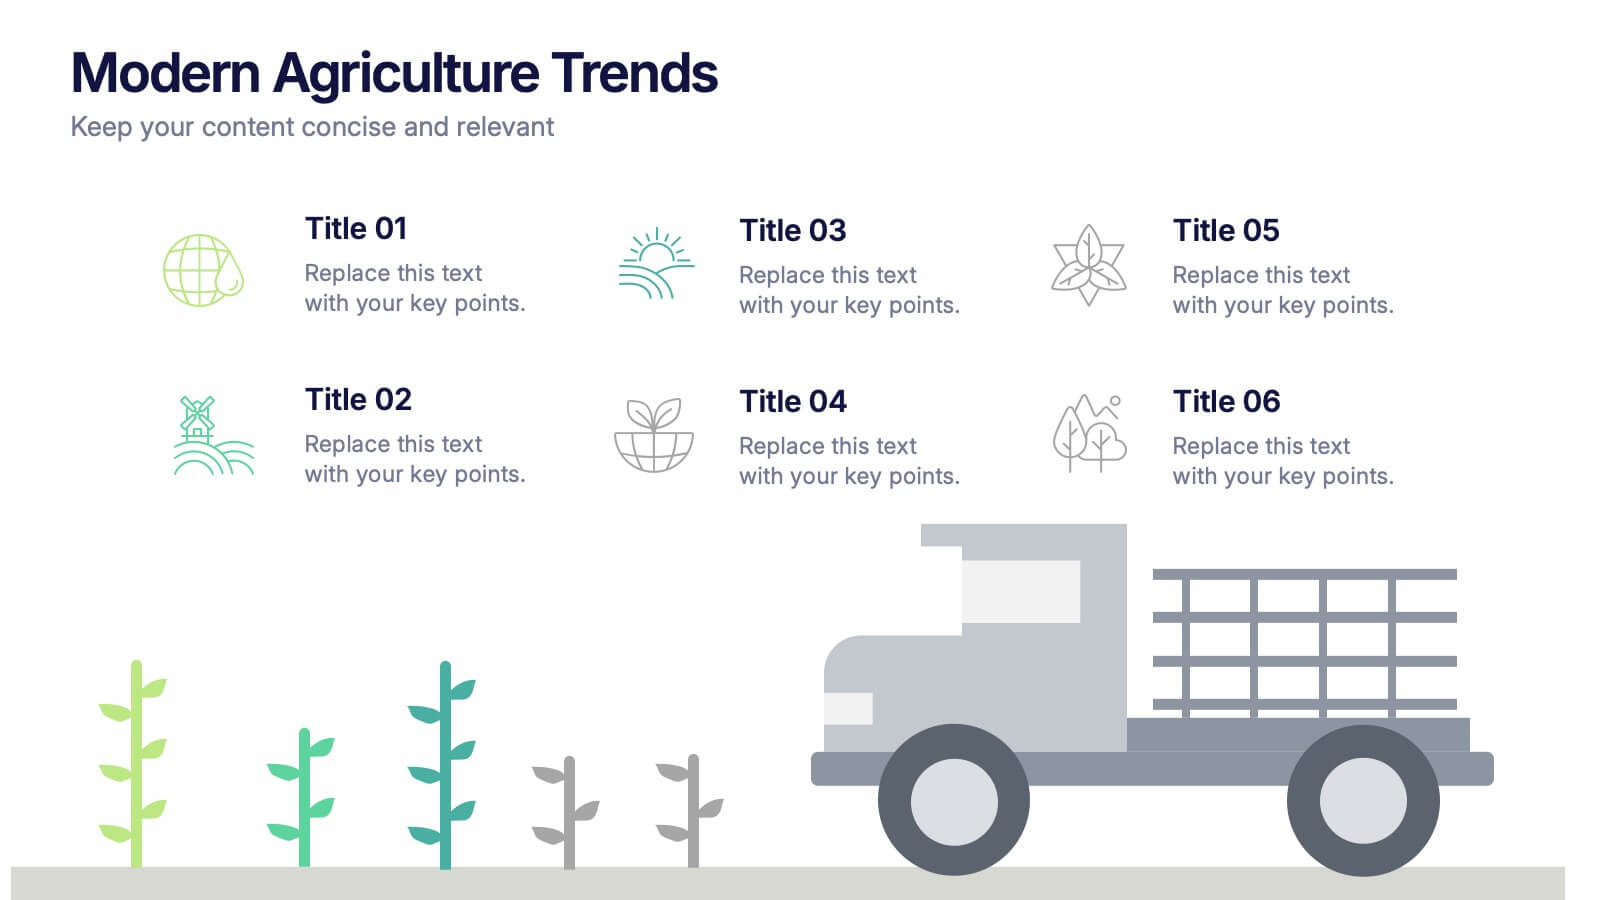
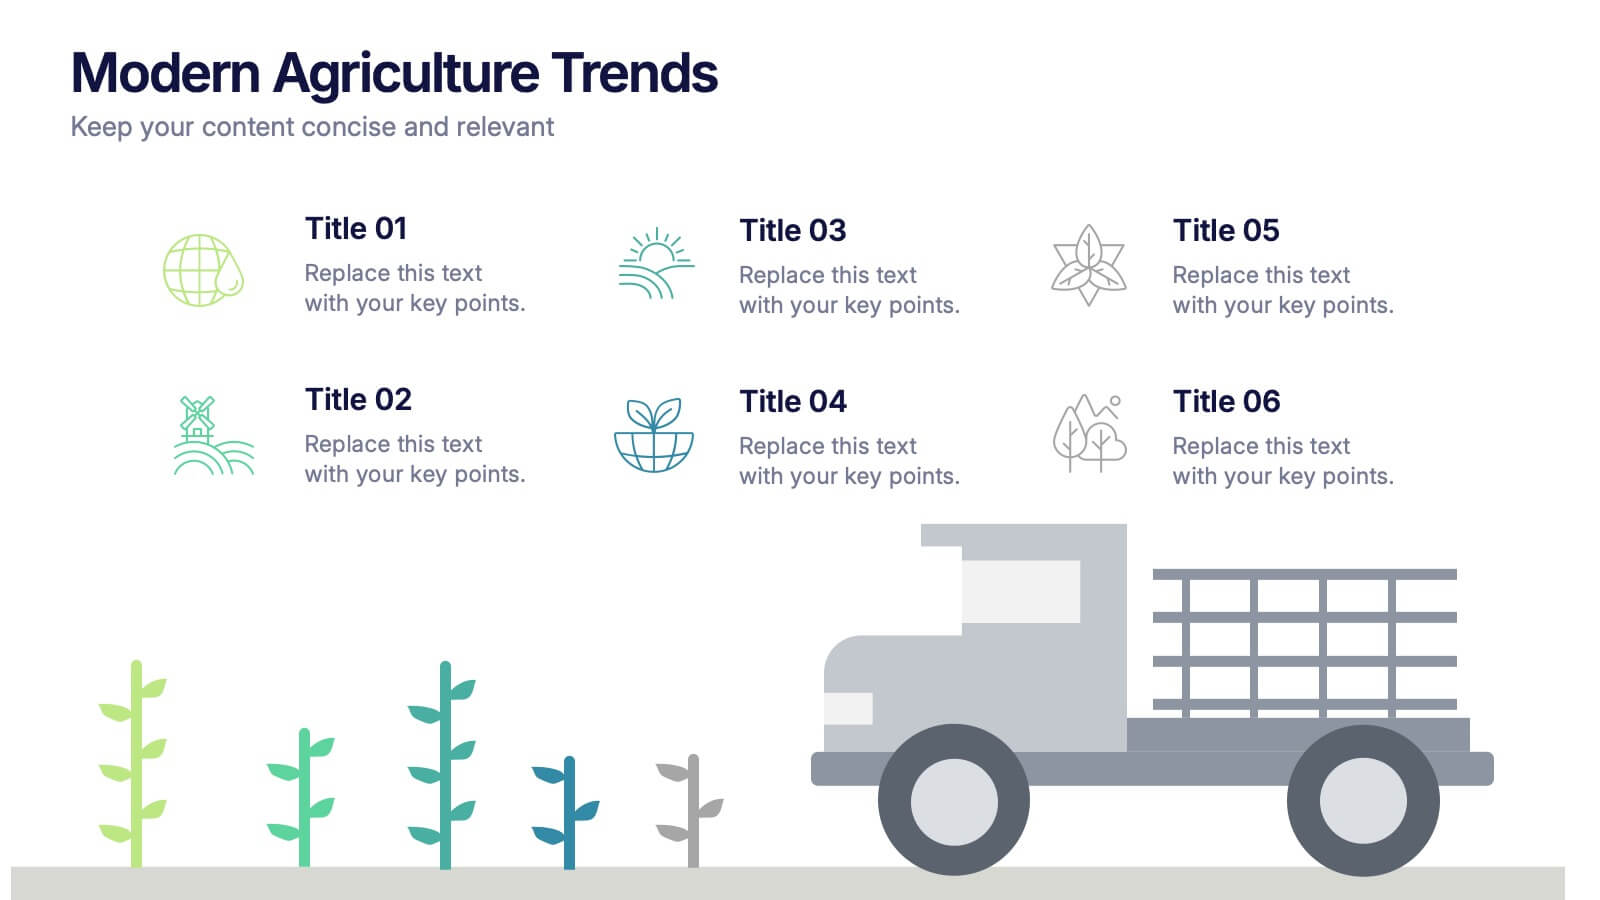
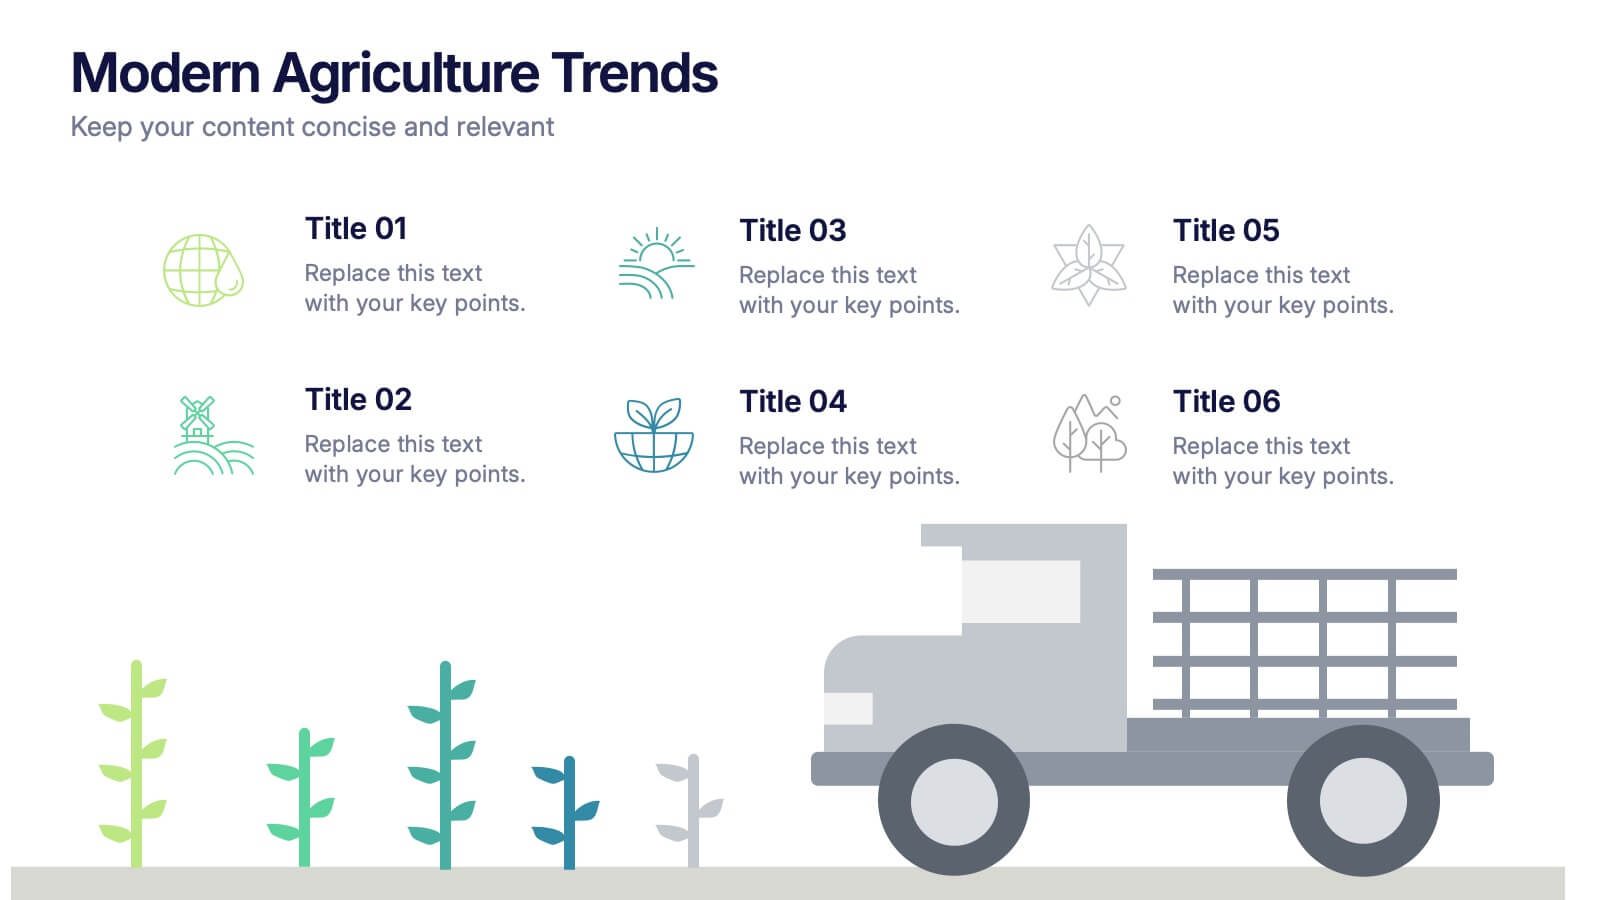
Modern Agriculture Trends Presentation
Bring innovation to the forefront with this visually engaging presentation design. Perfect for highlighting sustainability practices, agri-tech developments, and market evolution, it helps communicate key insights with clarity and style. Fully customizable and compatible with PowerPoint, Keynote, and Google Slides for a polished, professional presentation experience.
- Remove from favorites
Powerpoint Template
4 MB
Google Slides Template
External link
Keynote Template
2 MB
5 slides
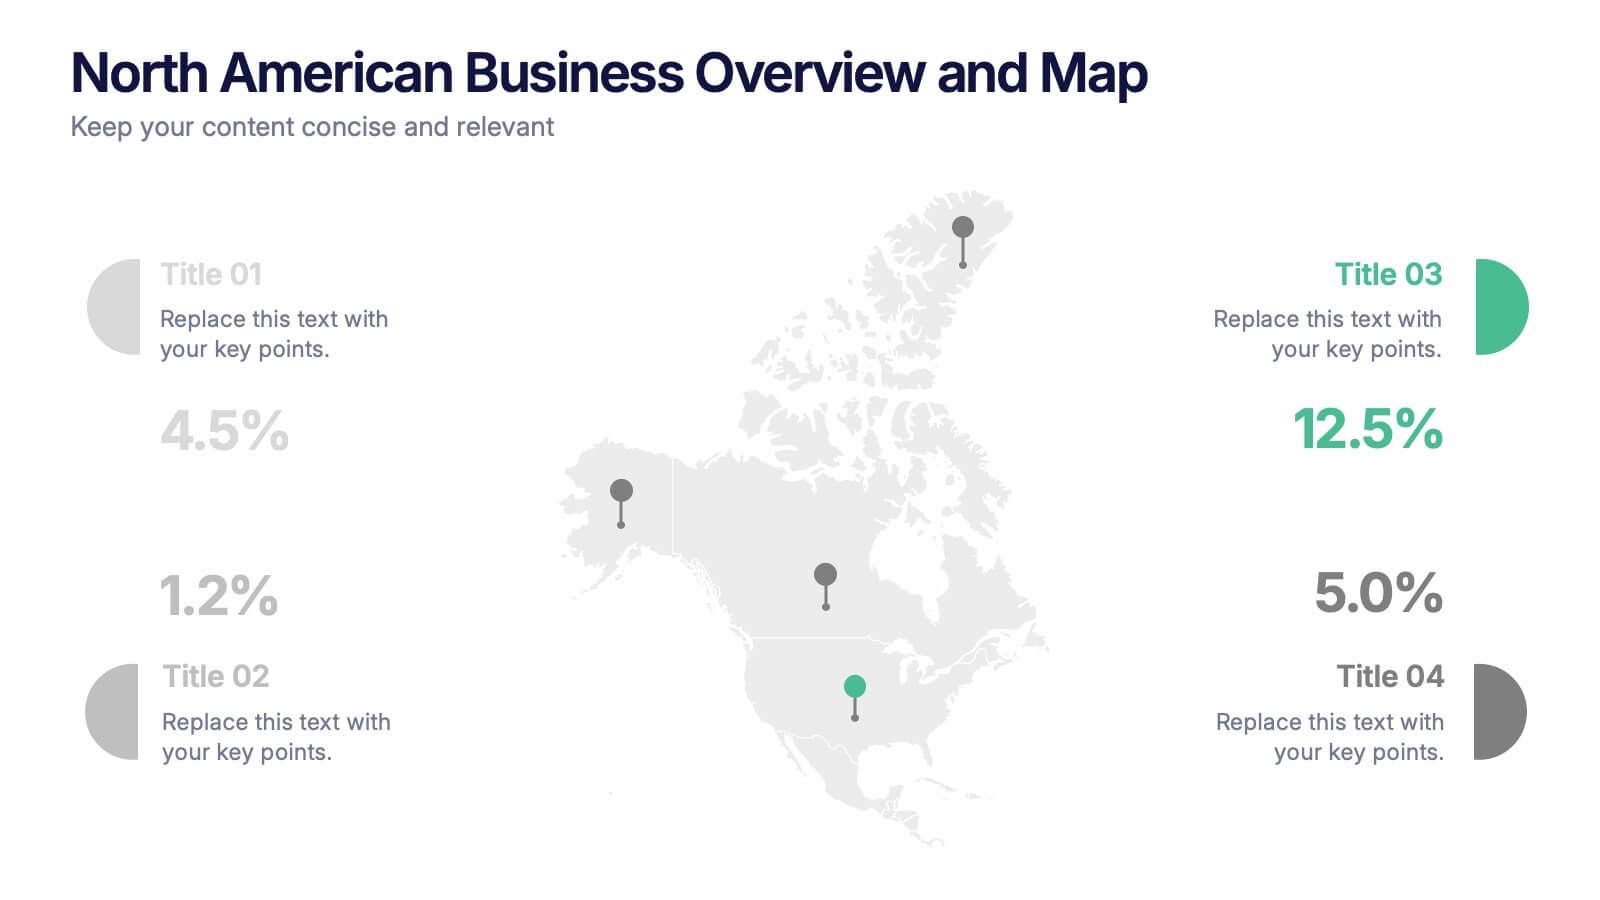
North American Business Overview and Map Presentation
Showcase regional performance data across North America with this clean, data-driven map slide. Highlight four key statistics using pinpoint markers and modern percentage indicators. Ideal for market overview, financial reporting, or strategic insights. Fully customizable and compatible with PowerPoint, Keynote, and Google Slides for seamless business presentations.
- Remove from favorites
Powerpoint Template
1 MB
Google Slides Template
External link
Keynote Template
1 MB
6 slides
Property Investment Analysis Presentation
Evaluate Property Investment Analysis with this insightful presentation template. Perfect for real estate investors, financial analysts, and property managers, it features key factors, risk assessments, and investment opportunities in a visually structured format. Fully editable and compatible with PowerPoint, Keynote, and Google Slides for seamless customization.
- Remove from favorites
Powerpoint Template
1 MB
Google Slides Template
External link
Keynote Template
2 MB
10 slides
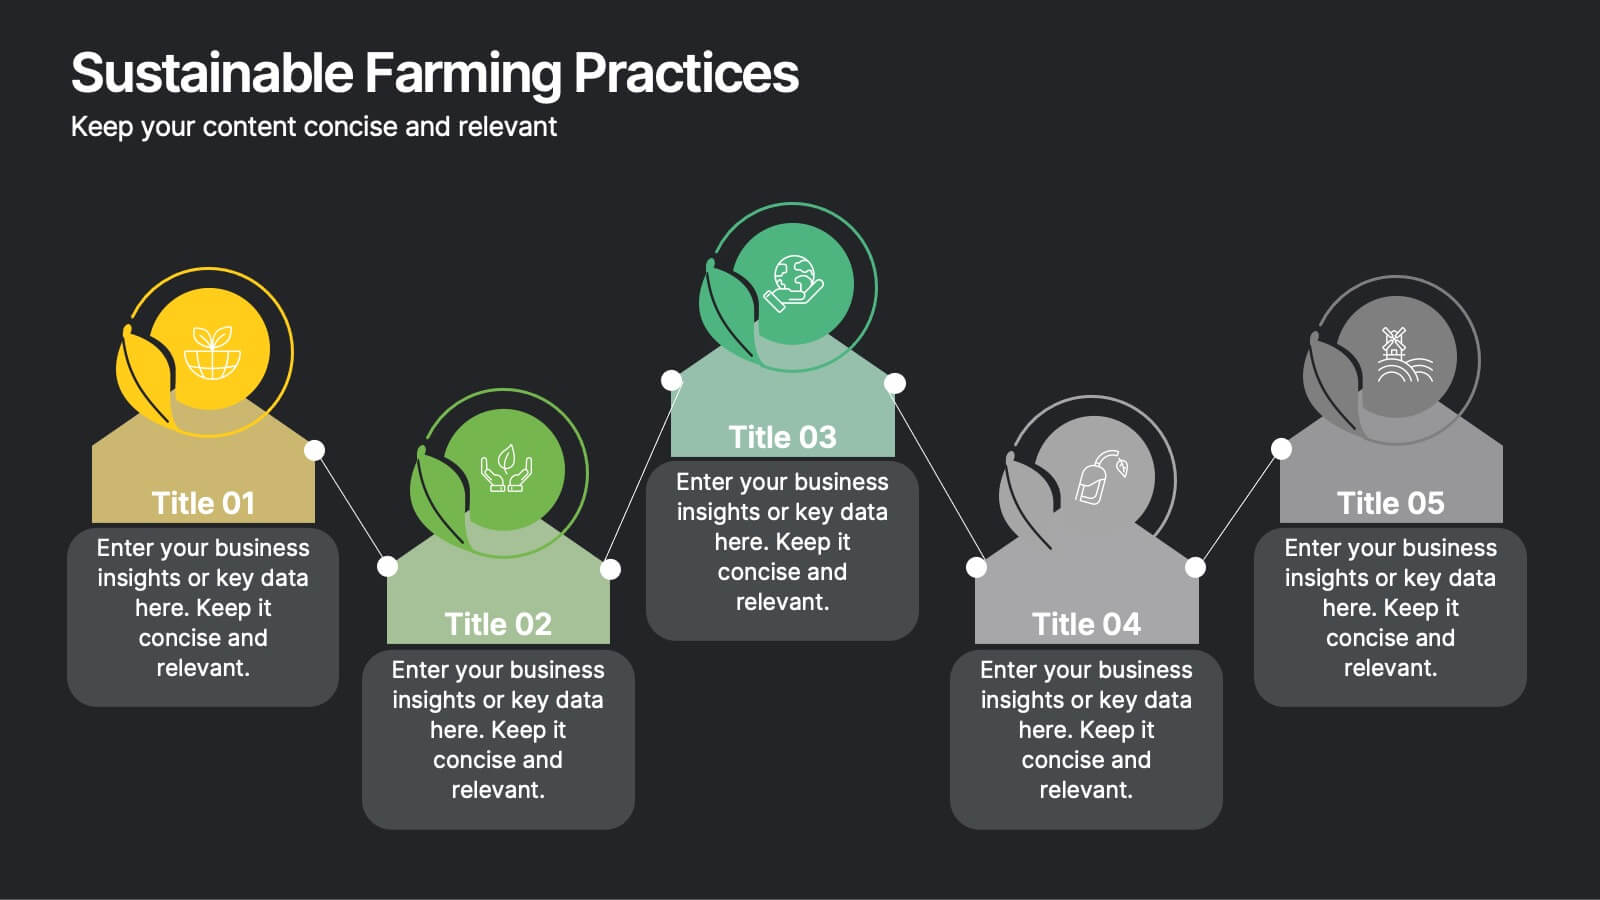
Sustainable Farming Practices
Present eco-friendly agricultural strategies with this visually structured layout. Featuring a linear process flow and eco-themed icons, this slide is ideal for outlining key sustainability practices, steps, or phases. Use it for presentations on regenerative agriculture, organic farming, or environmental policy. Fully editable in PowerPoint, Keynote, and Google Slides.


