


Features
- 5 Unique slides
- Fully editable and easy to edit in Microsoft Powerpoint, Keynote and Google Slides
- 16:9 widescreen layout
- Clean and professional designs
- Export to JPG, PDF or send by email


Do you have any questions?
Recommend


7 slides
Health Infographic Presentation Template
A health infographic is a visual representation of information and data related to health. This template can be used to convey complex information about a variety of health topics, such as disease symptoms, risk factors, and preventive measures, in a simple and easily understandable manner. This Health infographic displays graphics, images, and charts to help illustrate the information and make it more engaging and accessible to your audience. This template can be used for various purposes, such as educating the public, promoting healthy habits, and informing healthcare professionals.


21 slides
Dewspire Project Management Plan Presentation
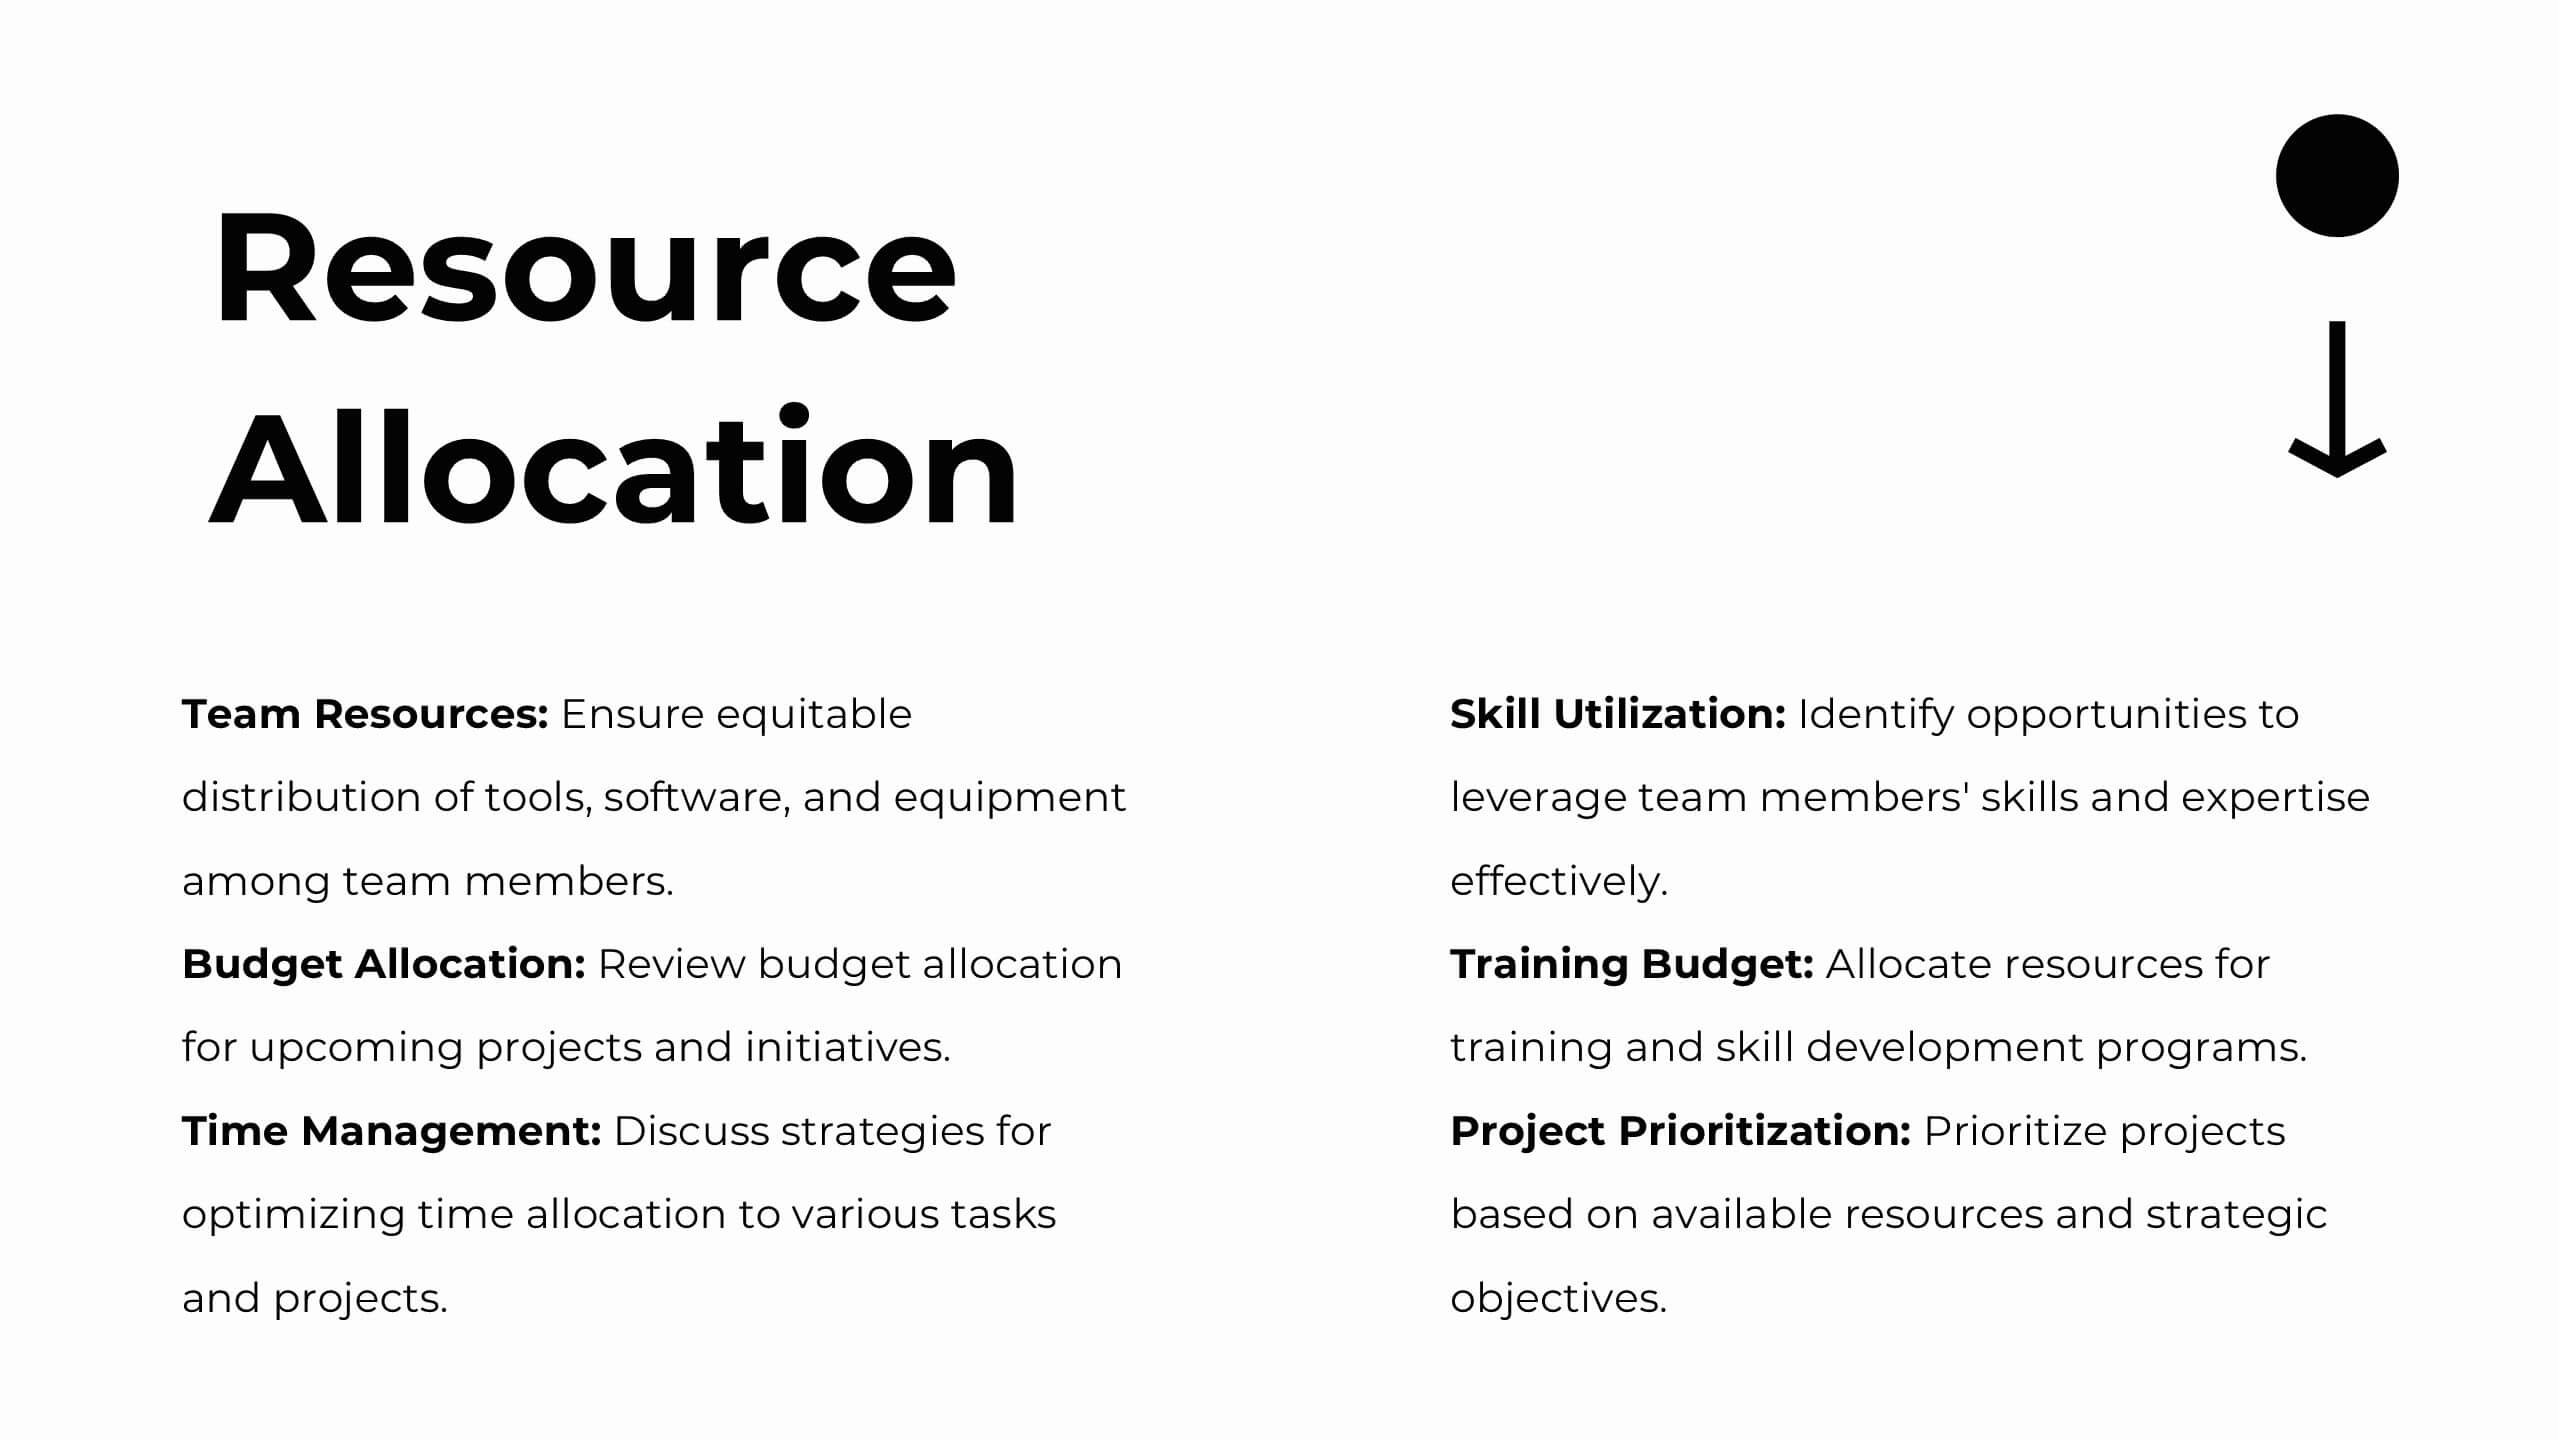
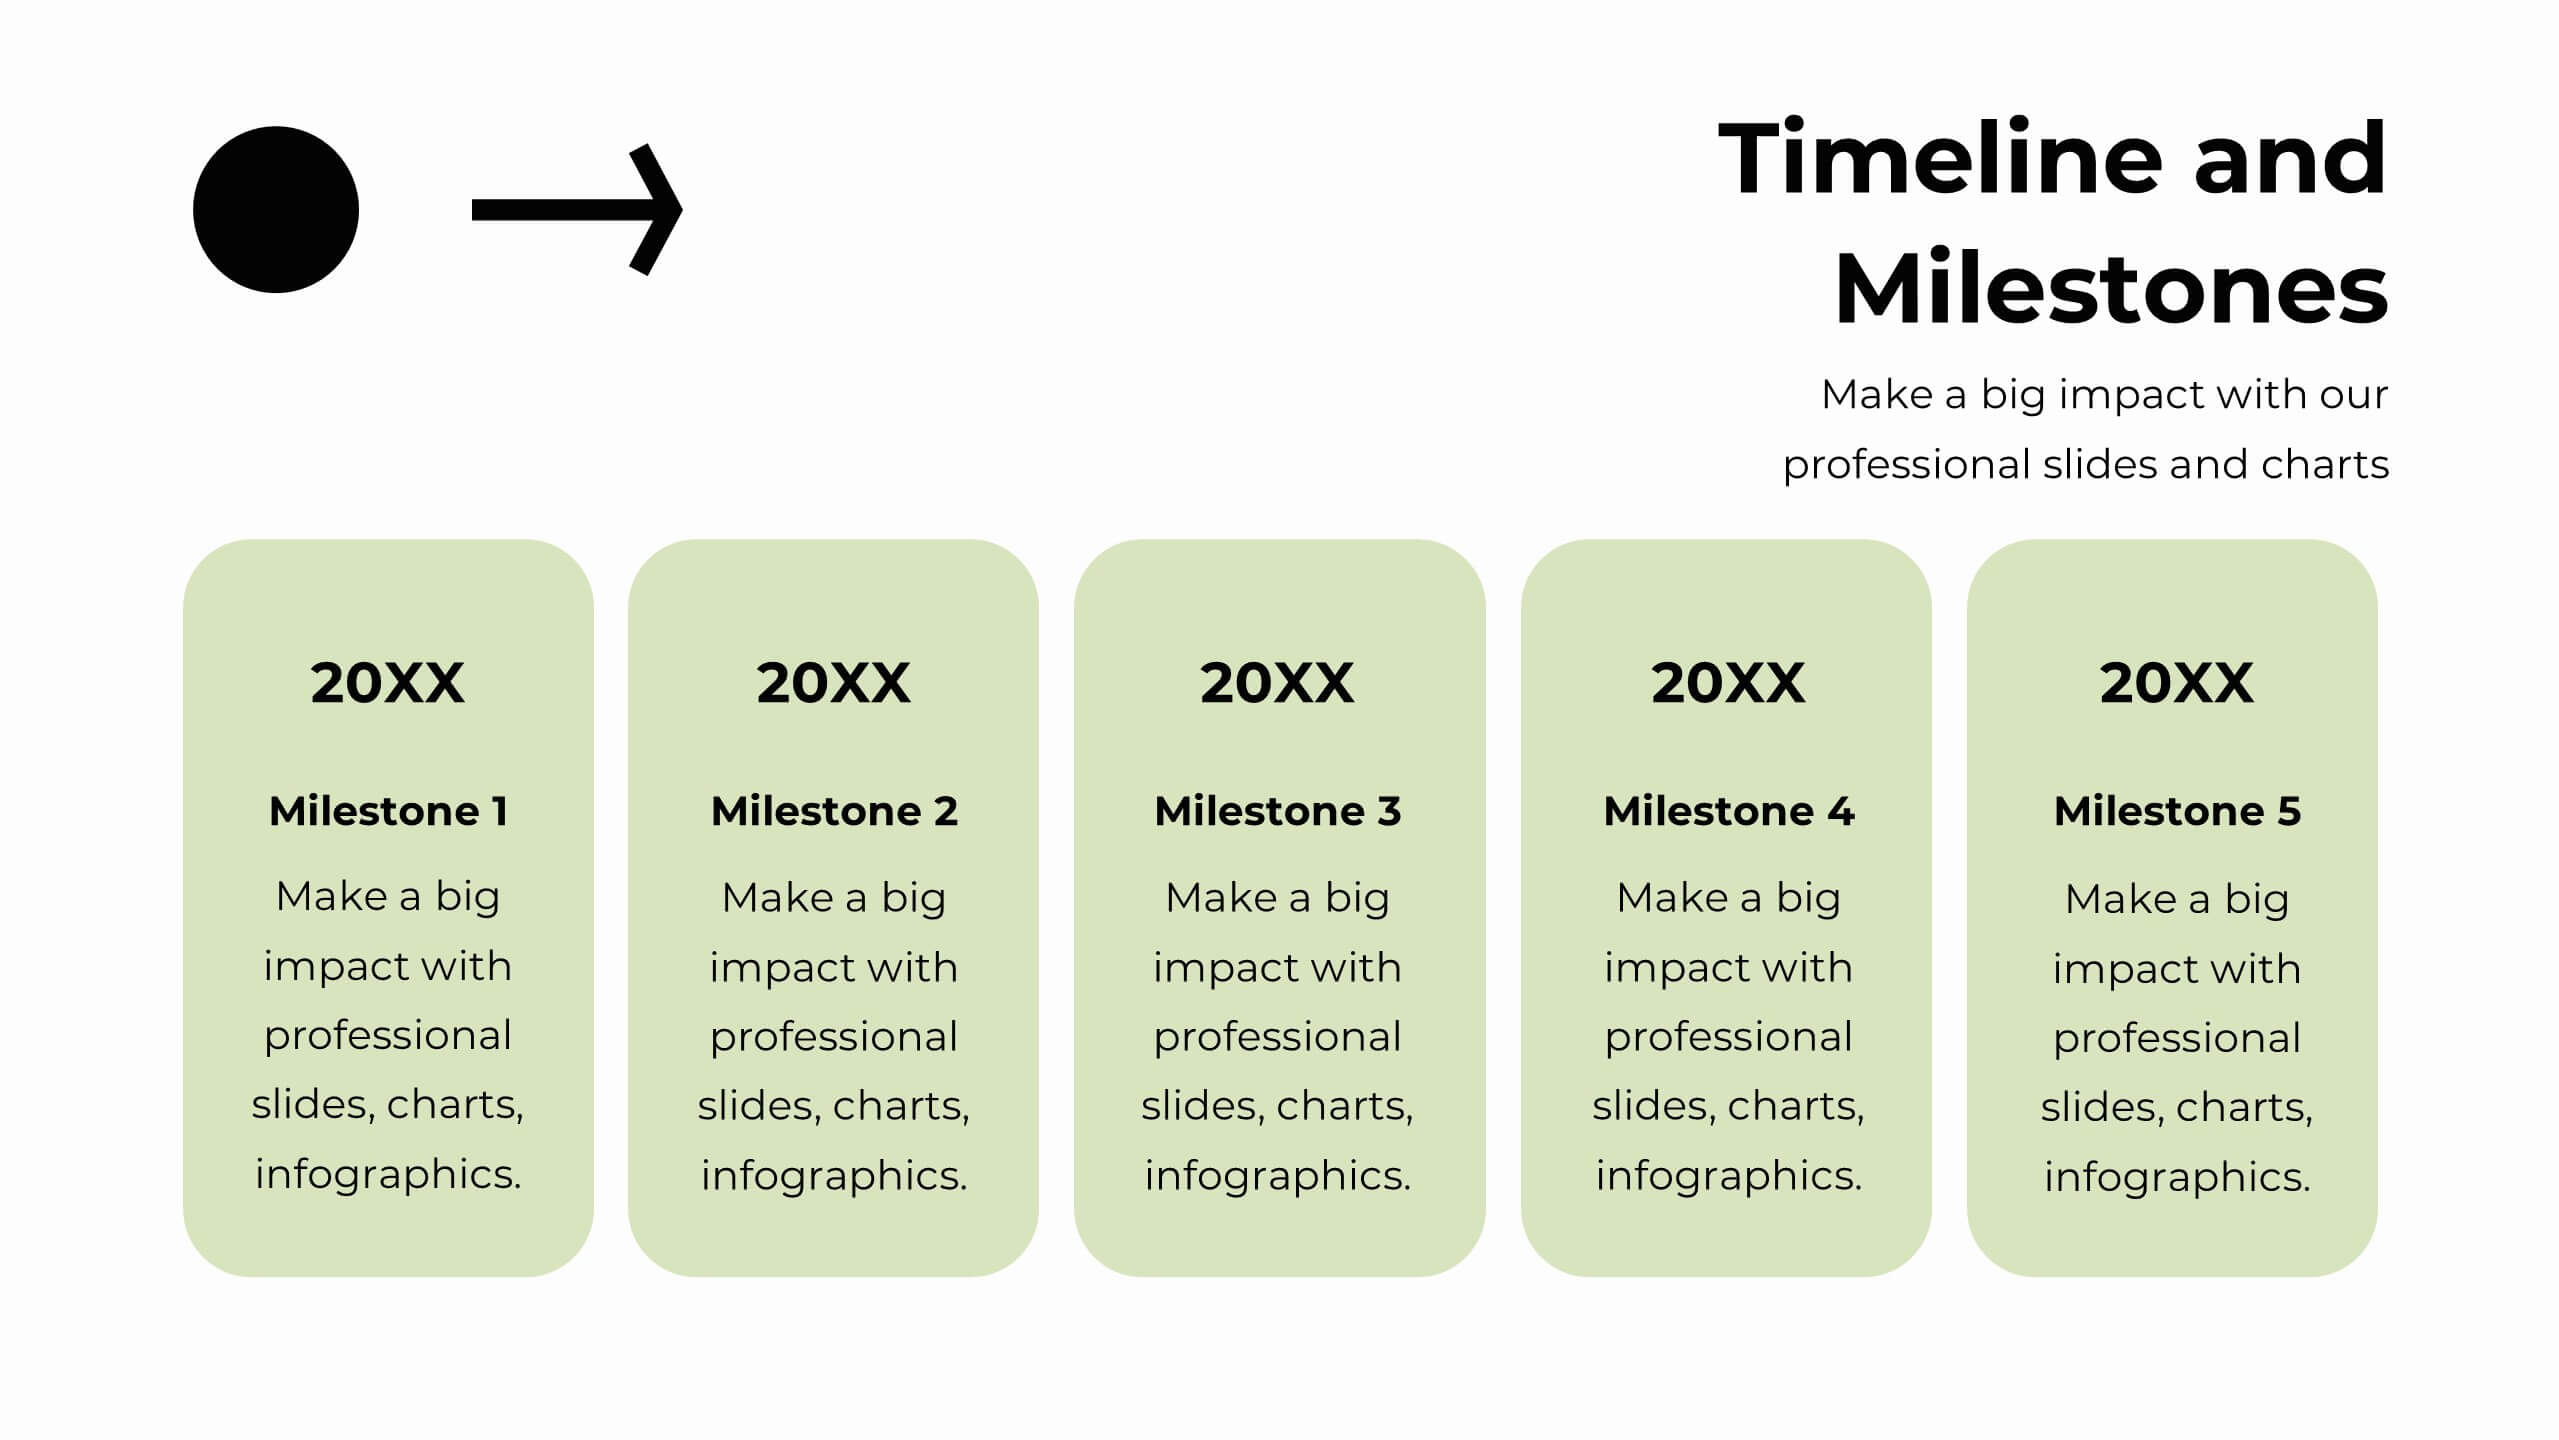
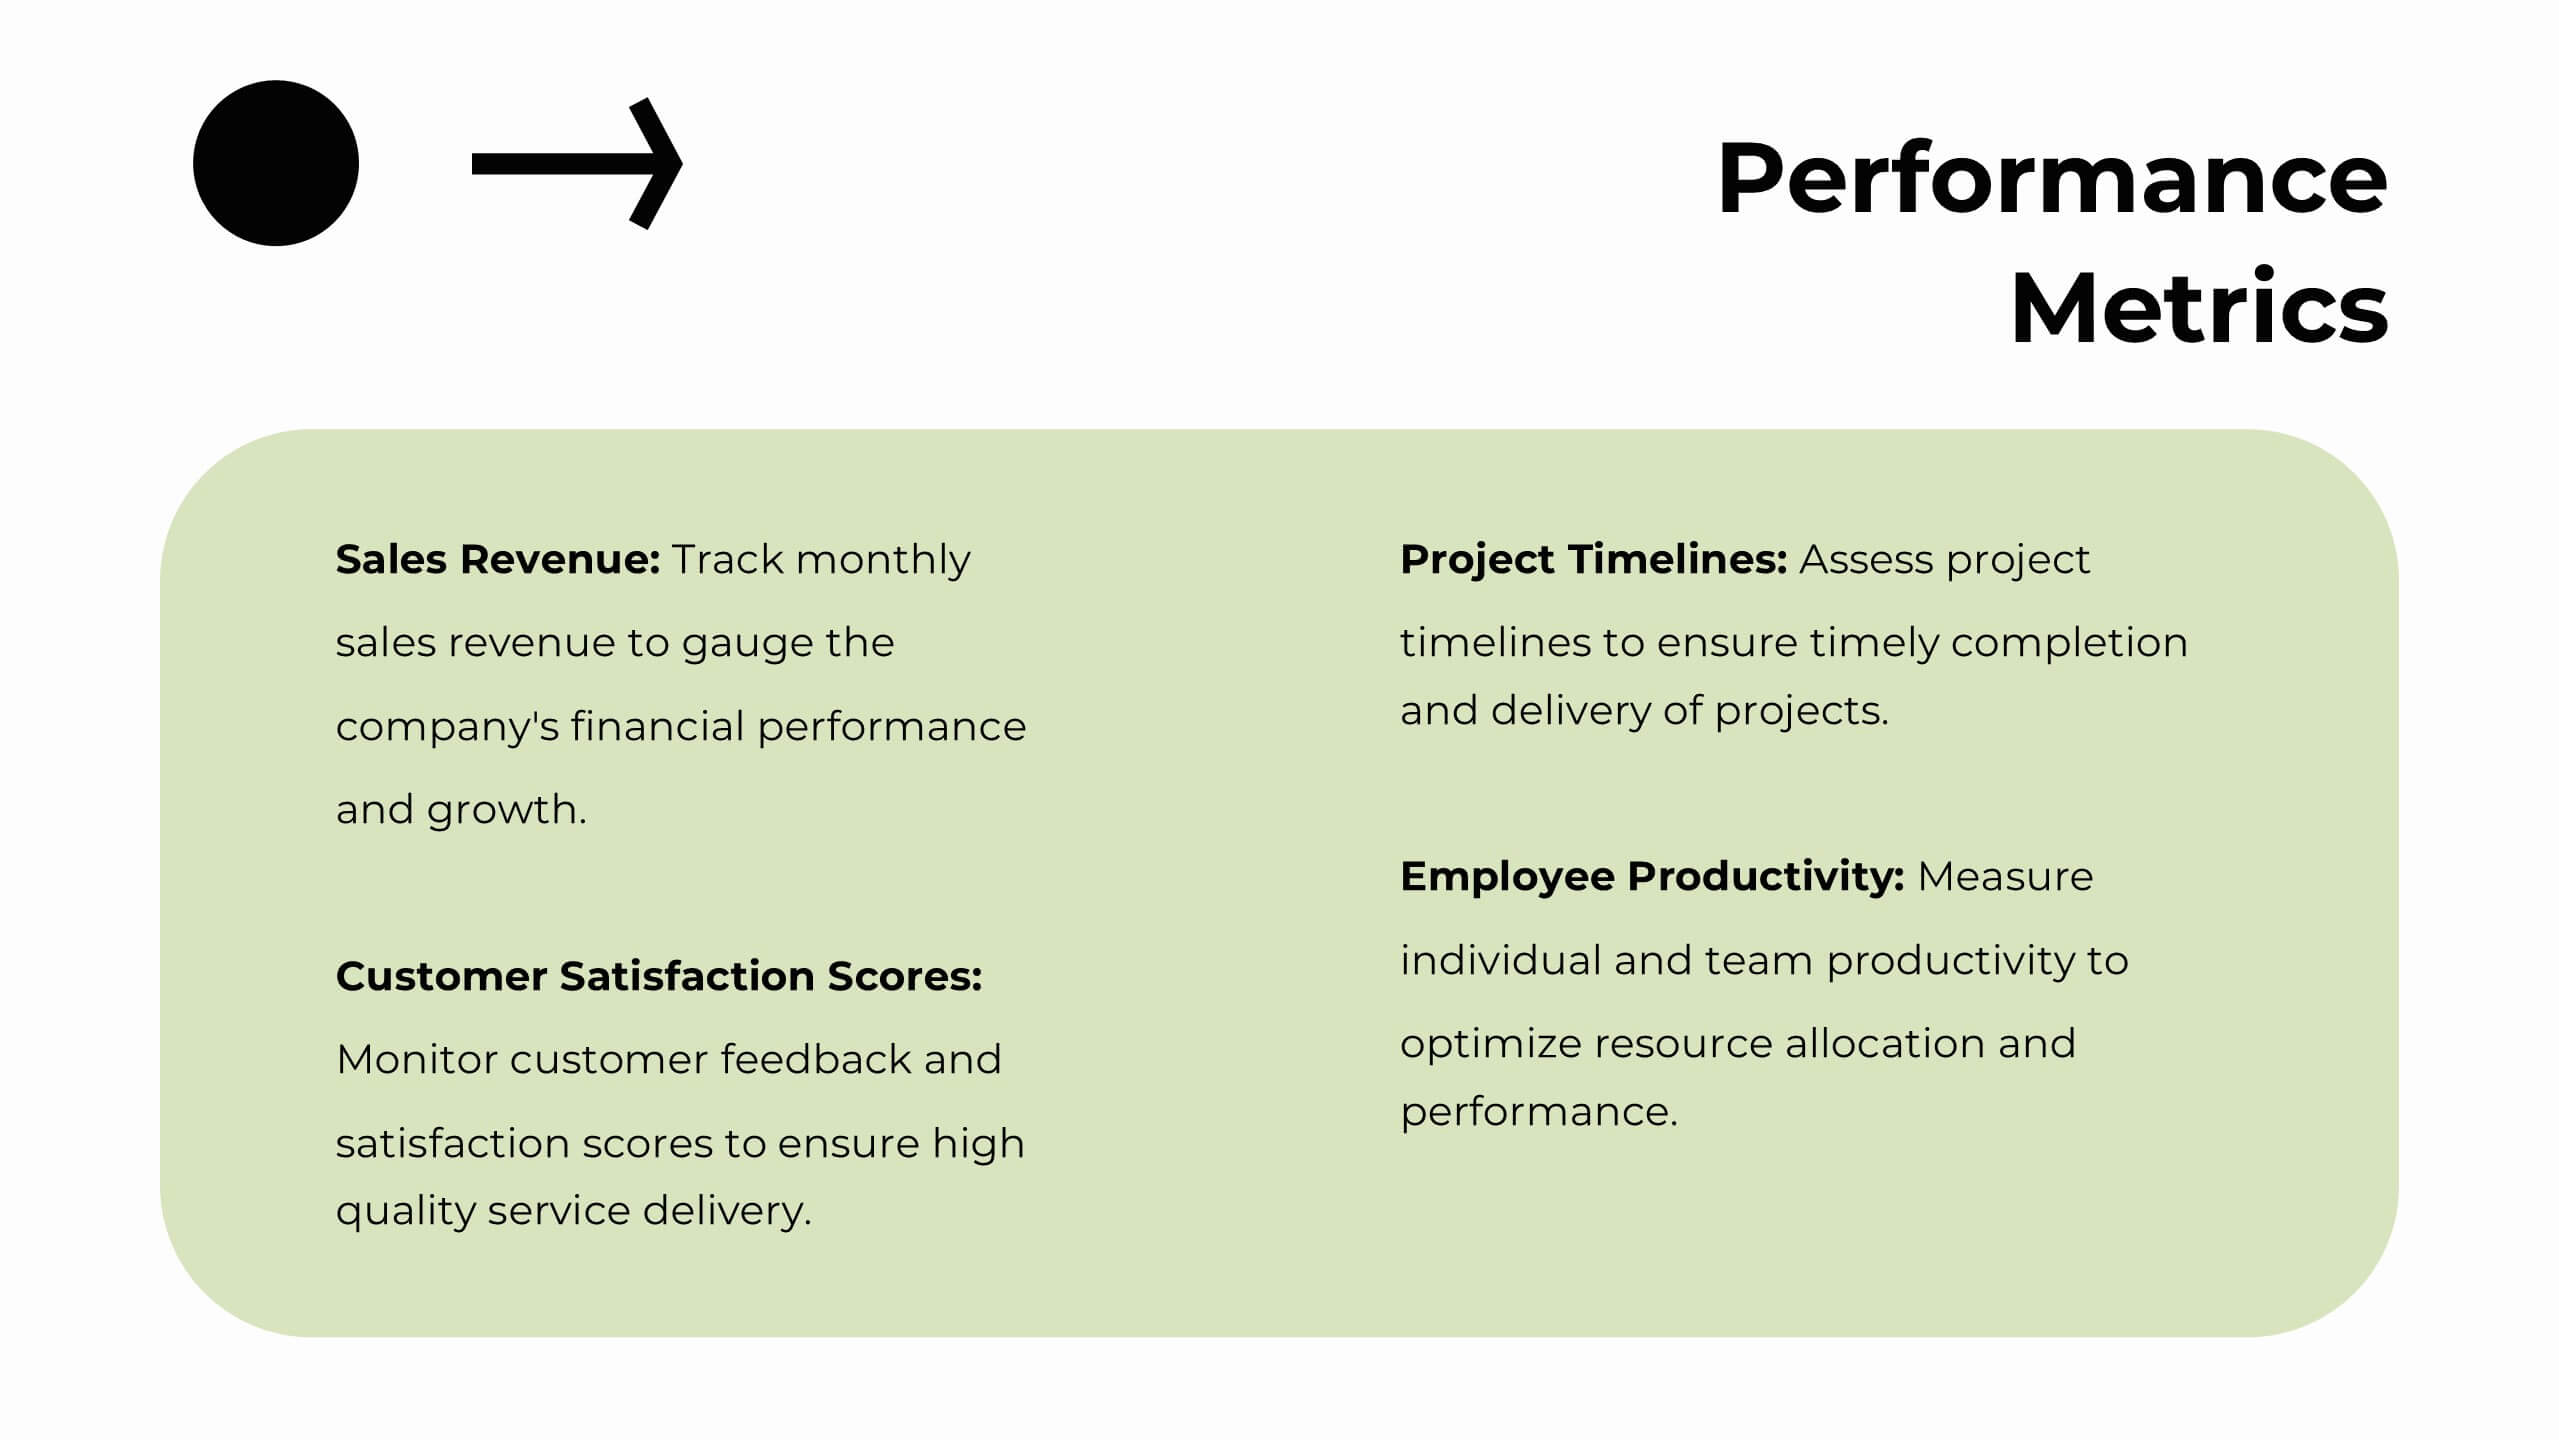
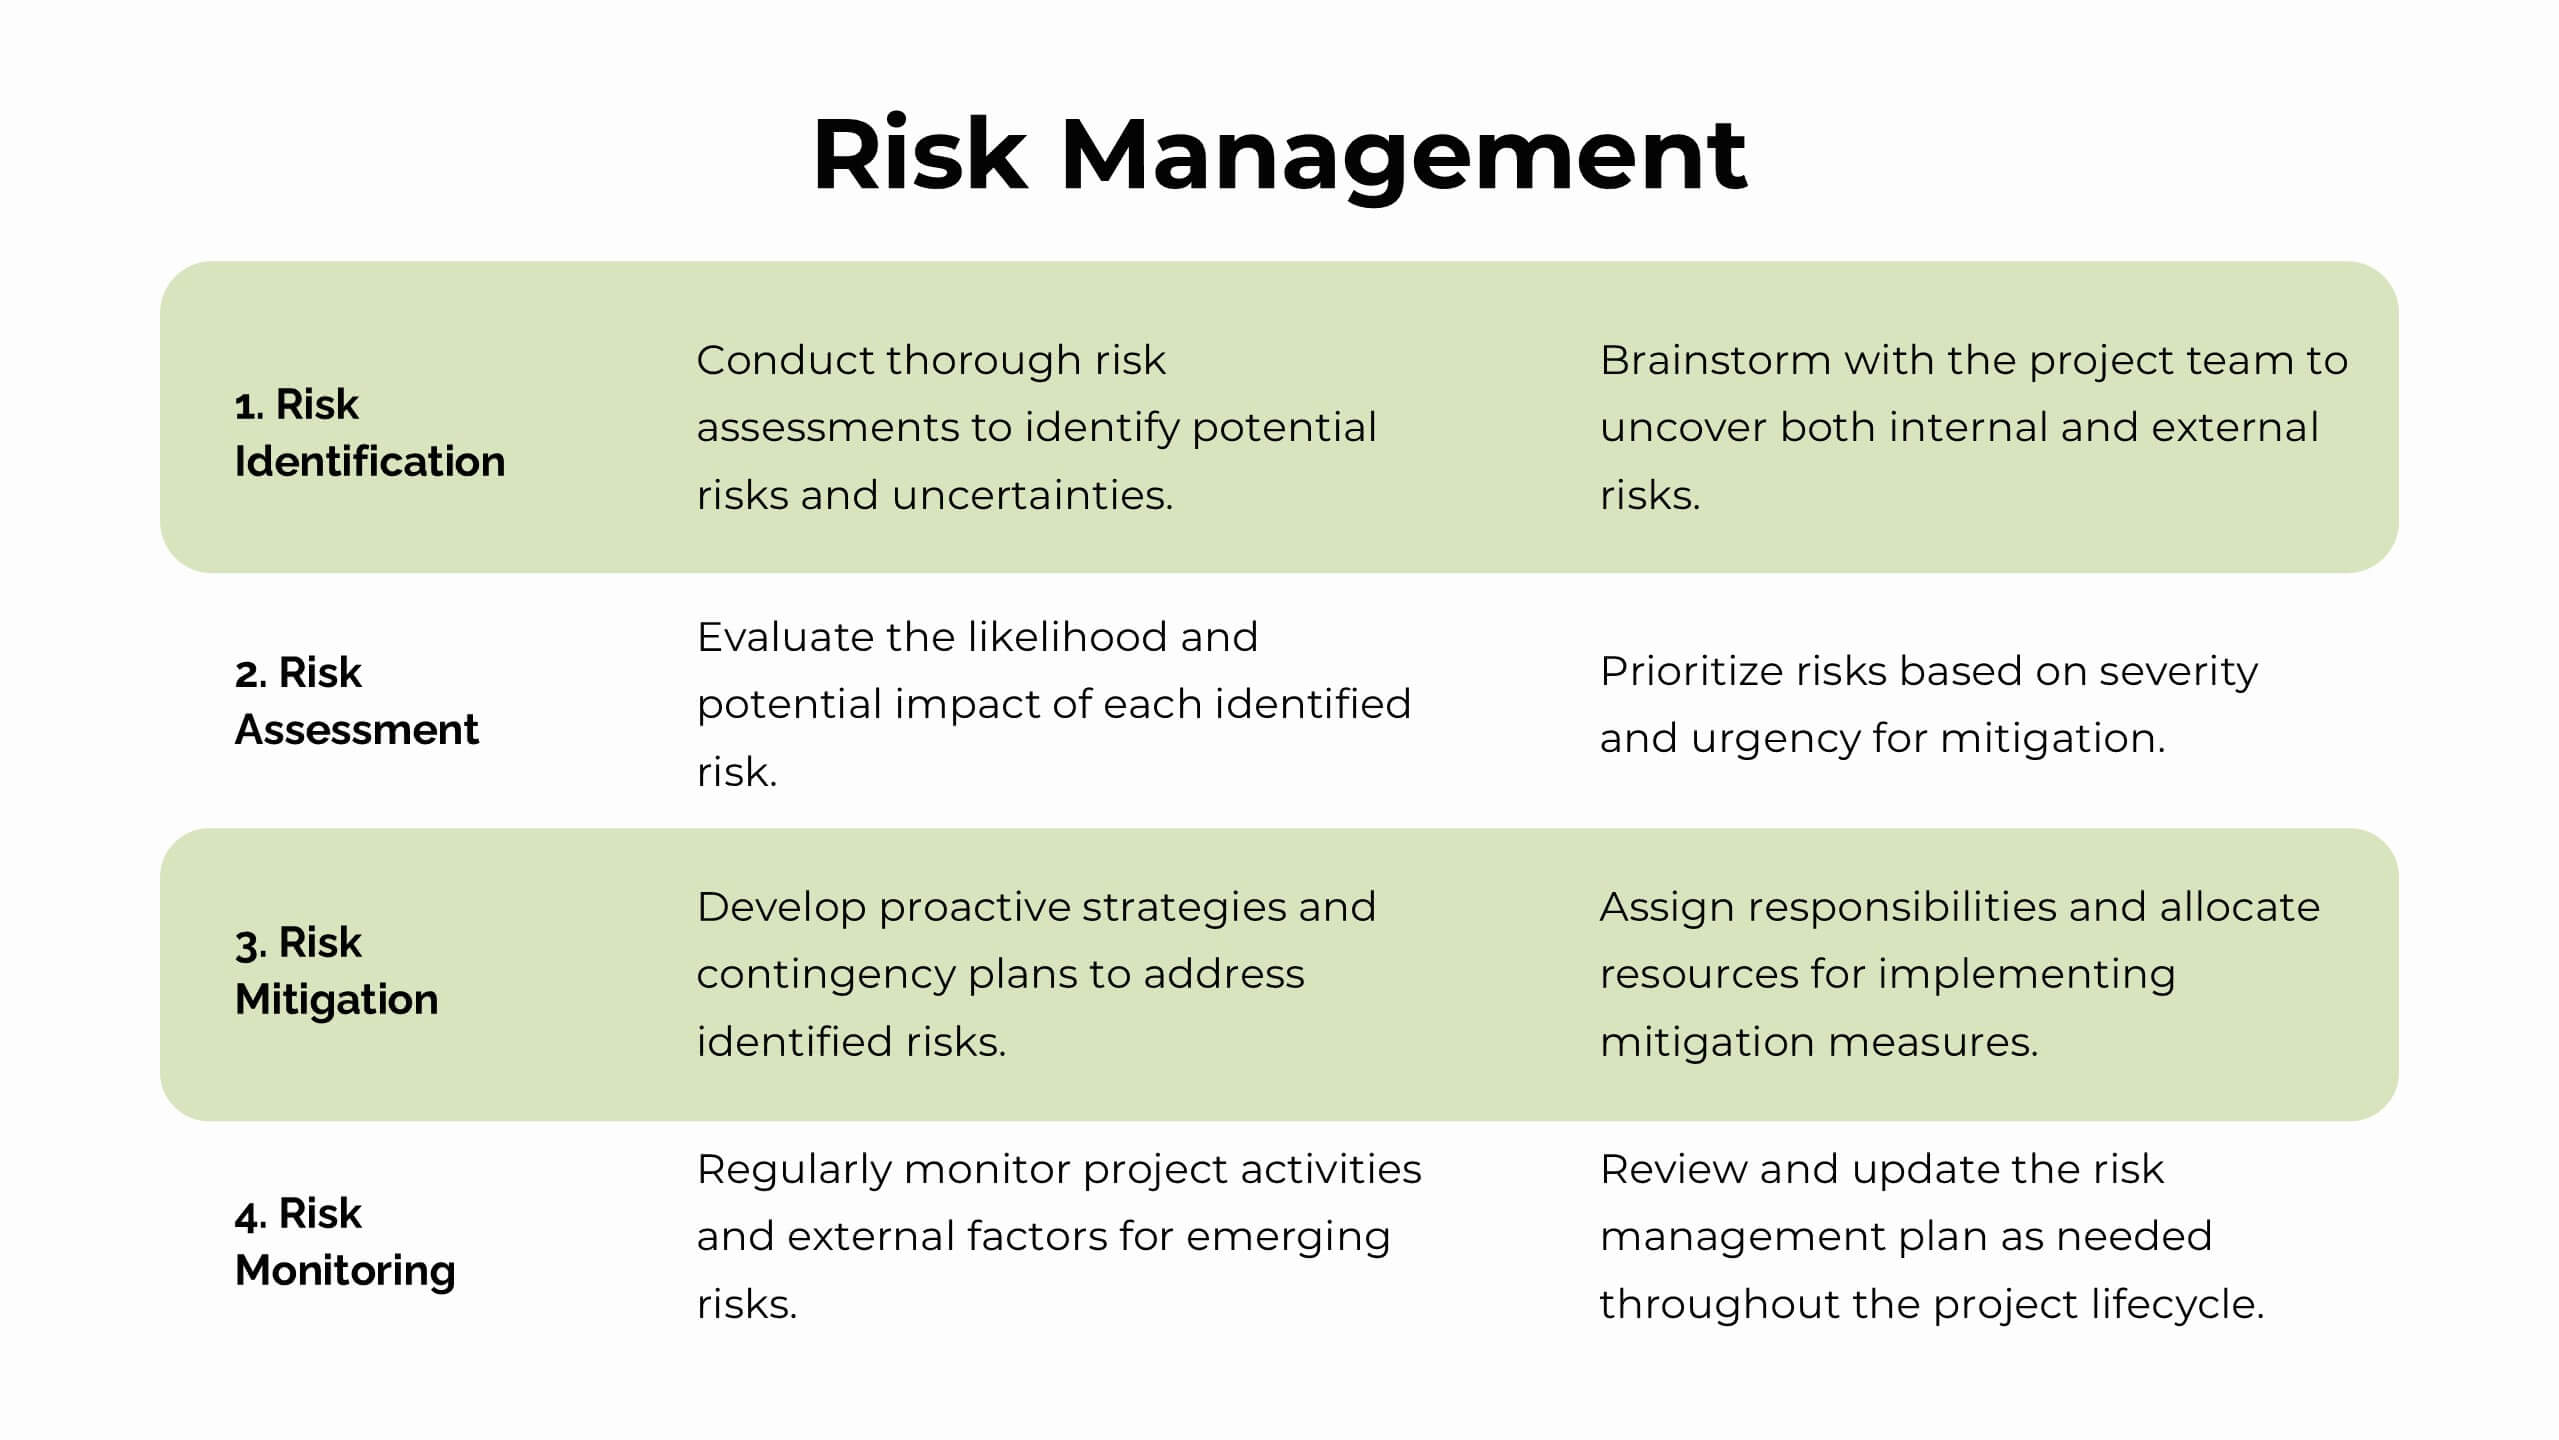
Streamline your project planning process with this visually striking and organized presentation template. Perfectly designed to communicate every stage of your project management, it features sections for problem analysis, objectives, and the scope of work. The timeline, budget breakdown, and resource allocation slides ensure your plans are both clear and actionable. Highlight team expertise with dedicated meet the team layouts and showcase your commitment to quality through evaluation criteria and risk management plans. Ideal for team presentations or client proposals, this template supports PowerPoint, Google Slides, and Keynote, offering full customization for seamless adaptability. Deliver your project vision with confidence and precision!


4 slides
Sales and Reach Across Asia Map Presentation
Visualize your company’s market presence with the Sales and Reach Across Asia Map Presentation. Featuring clean markers, color-coded regions, and icon-labeled highlights, this template helps you clearly showcase key sales zones, distribution channels, or growth markets across Asia. Perfect for business reviews, expansion pitches, and performance updates. Fully editable in PowerPoint, Keynote, Google Slides, and Canva.


7 slides
Product Life Cycle Model Infographic
Navigate the evolution of any product with our vibrant product life cycle model infographic. Utilizing a vivid color palette of purple, blue, green, and pink, this design masterfully illustrates each phase of a product's journey, from inception to decline. Ideal for marketers, product managers, and business educators, this infographic serves as a visual guide to understand and optimize a product's life span. With its sleek design, it can effortlessly engage audiences in presentations and discussions. And with seamless compatibility across PowerPoint, Keynote, and Google Slides, presenting this dynamic process is both effortless and impactful.


23 slides
Zirconium Strategic Planning Report Presentation
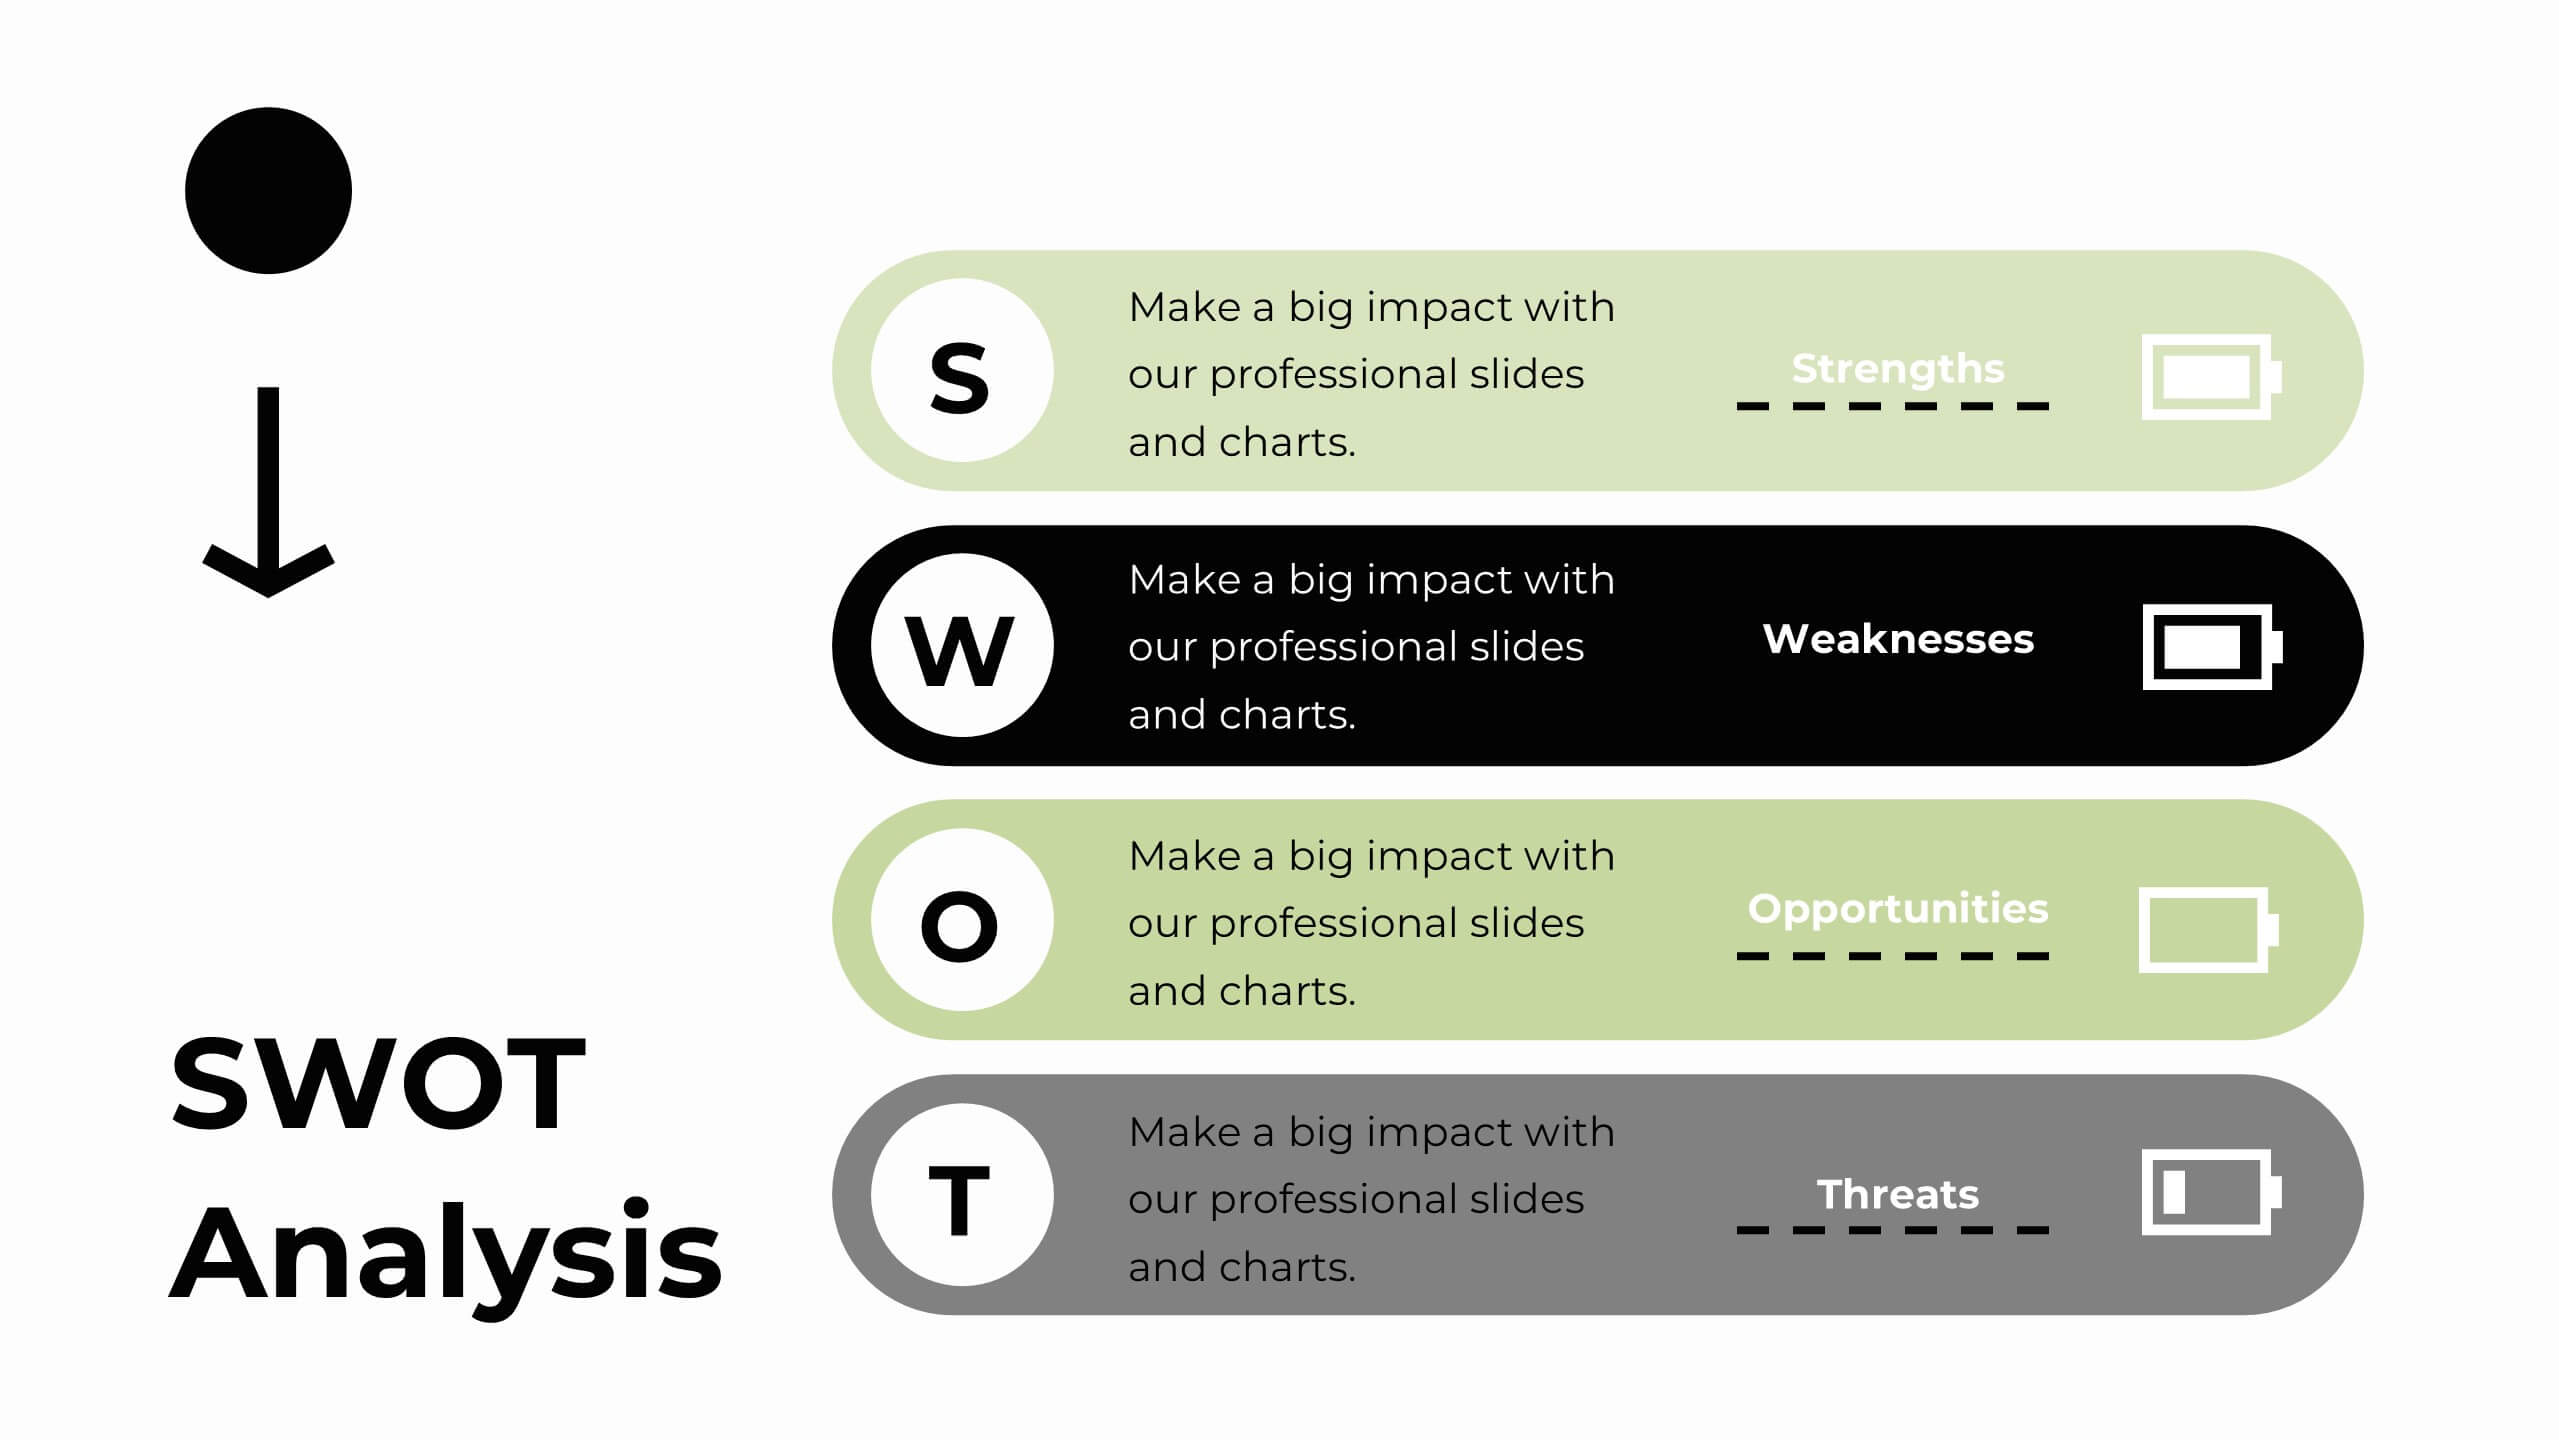
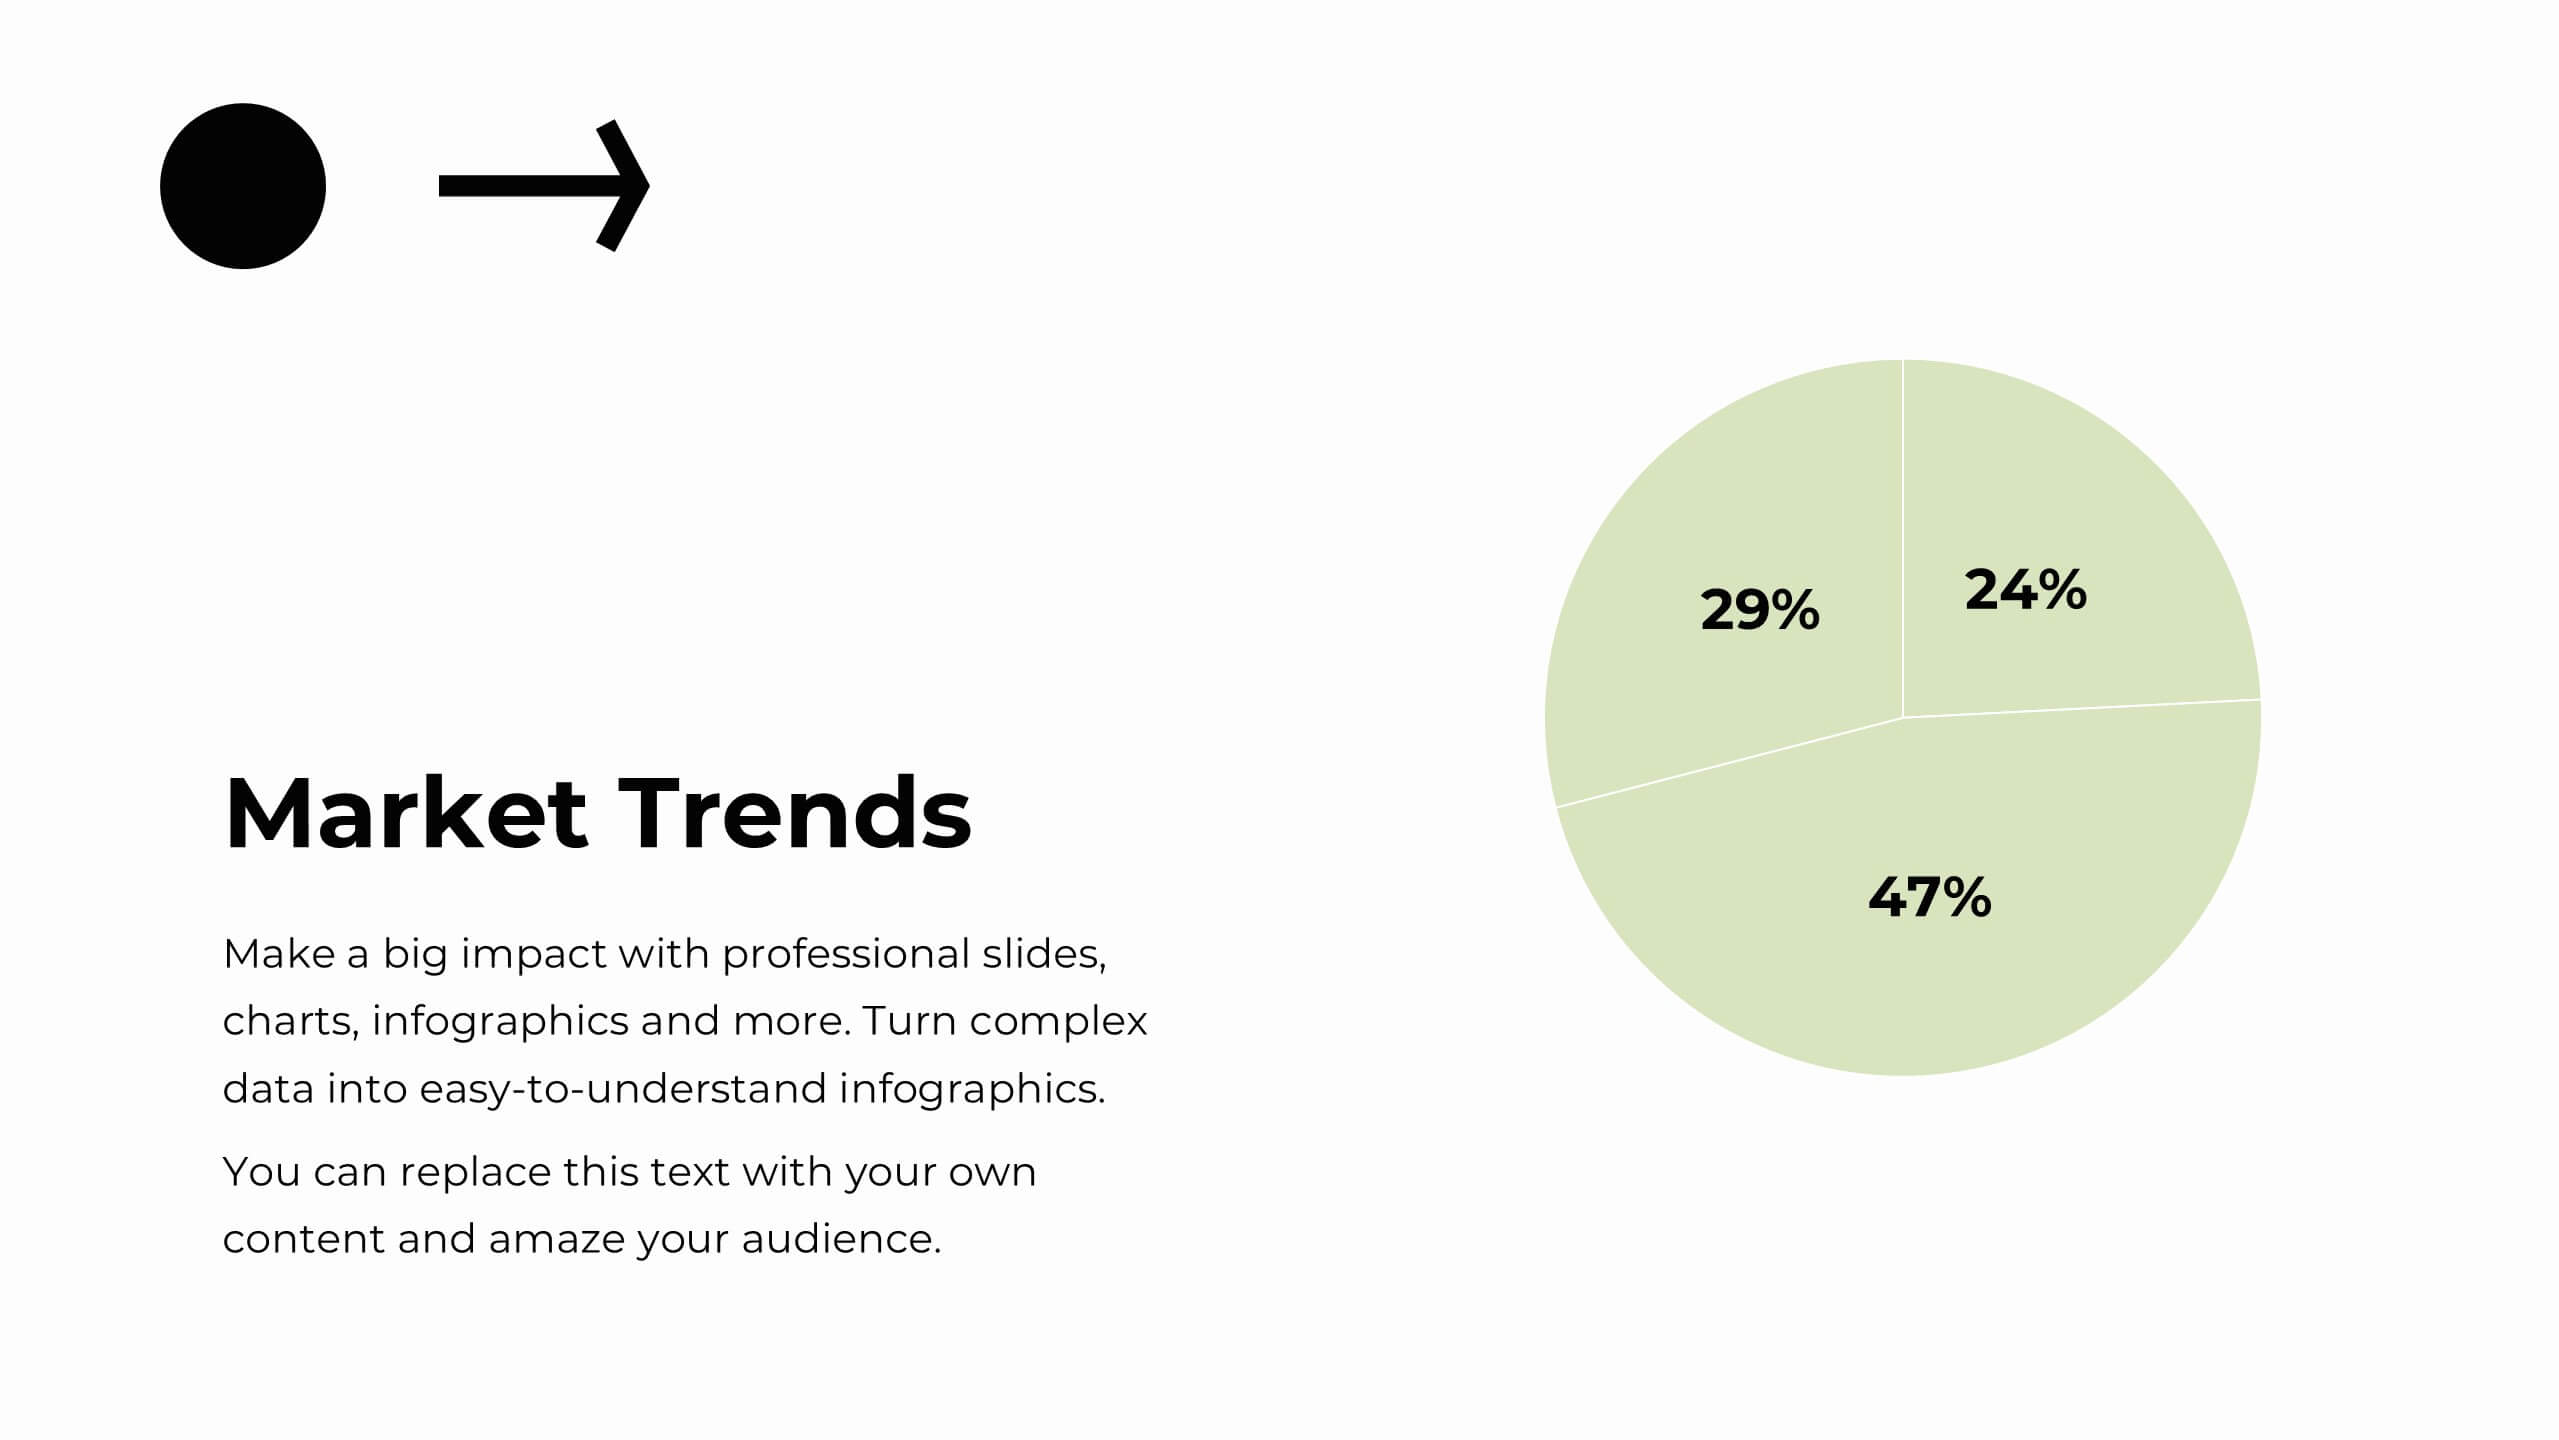
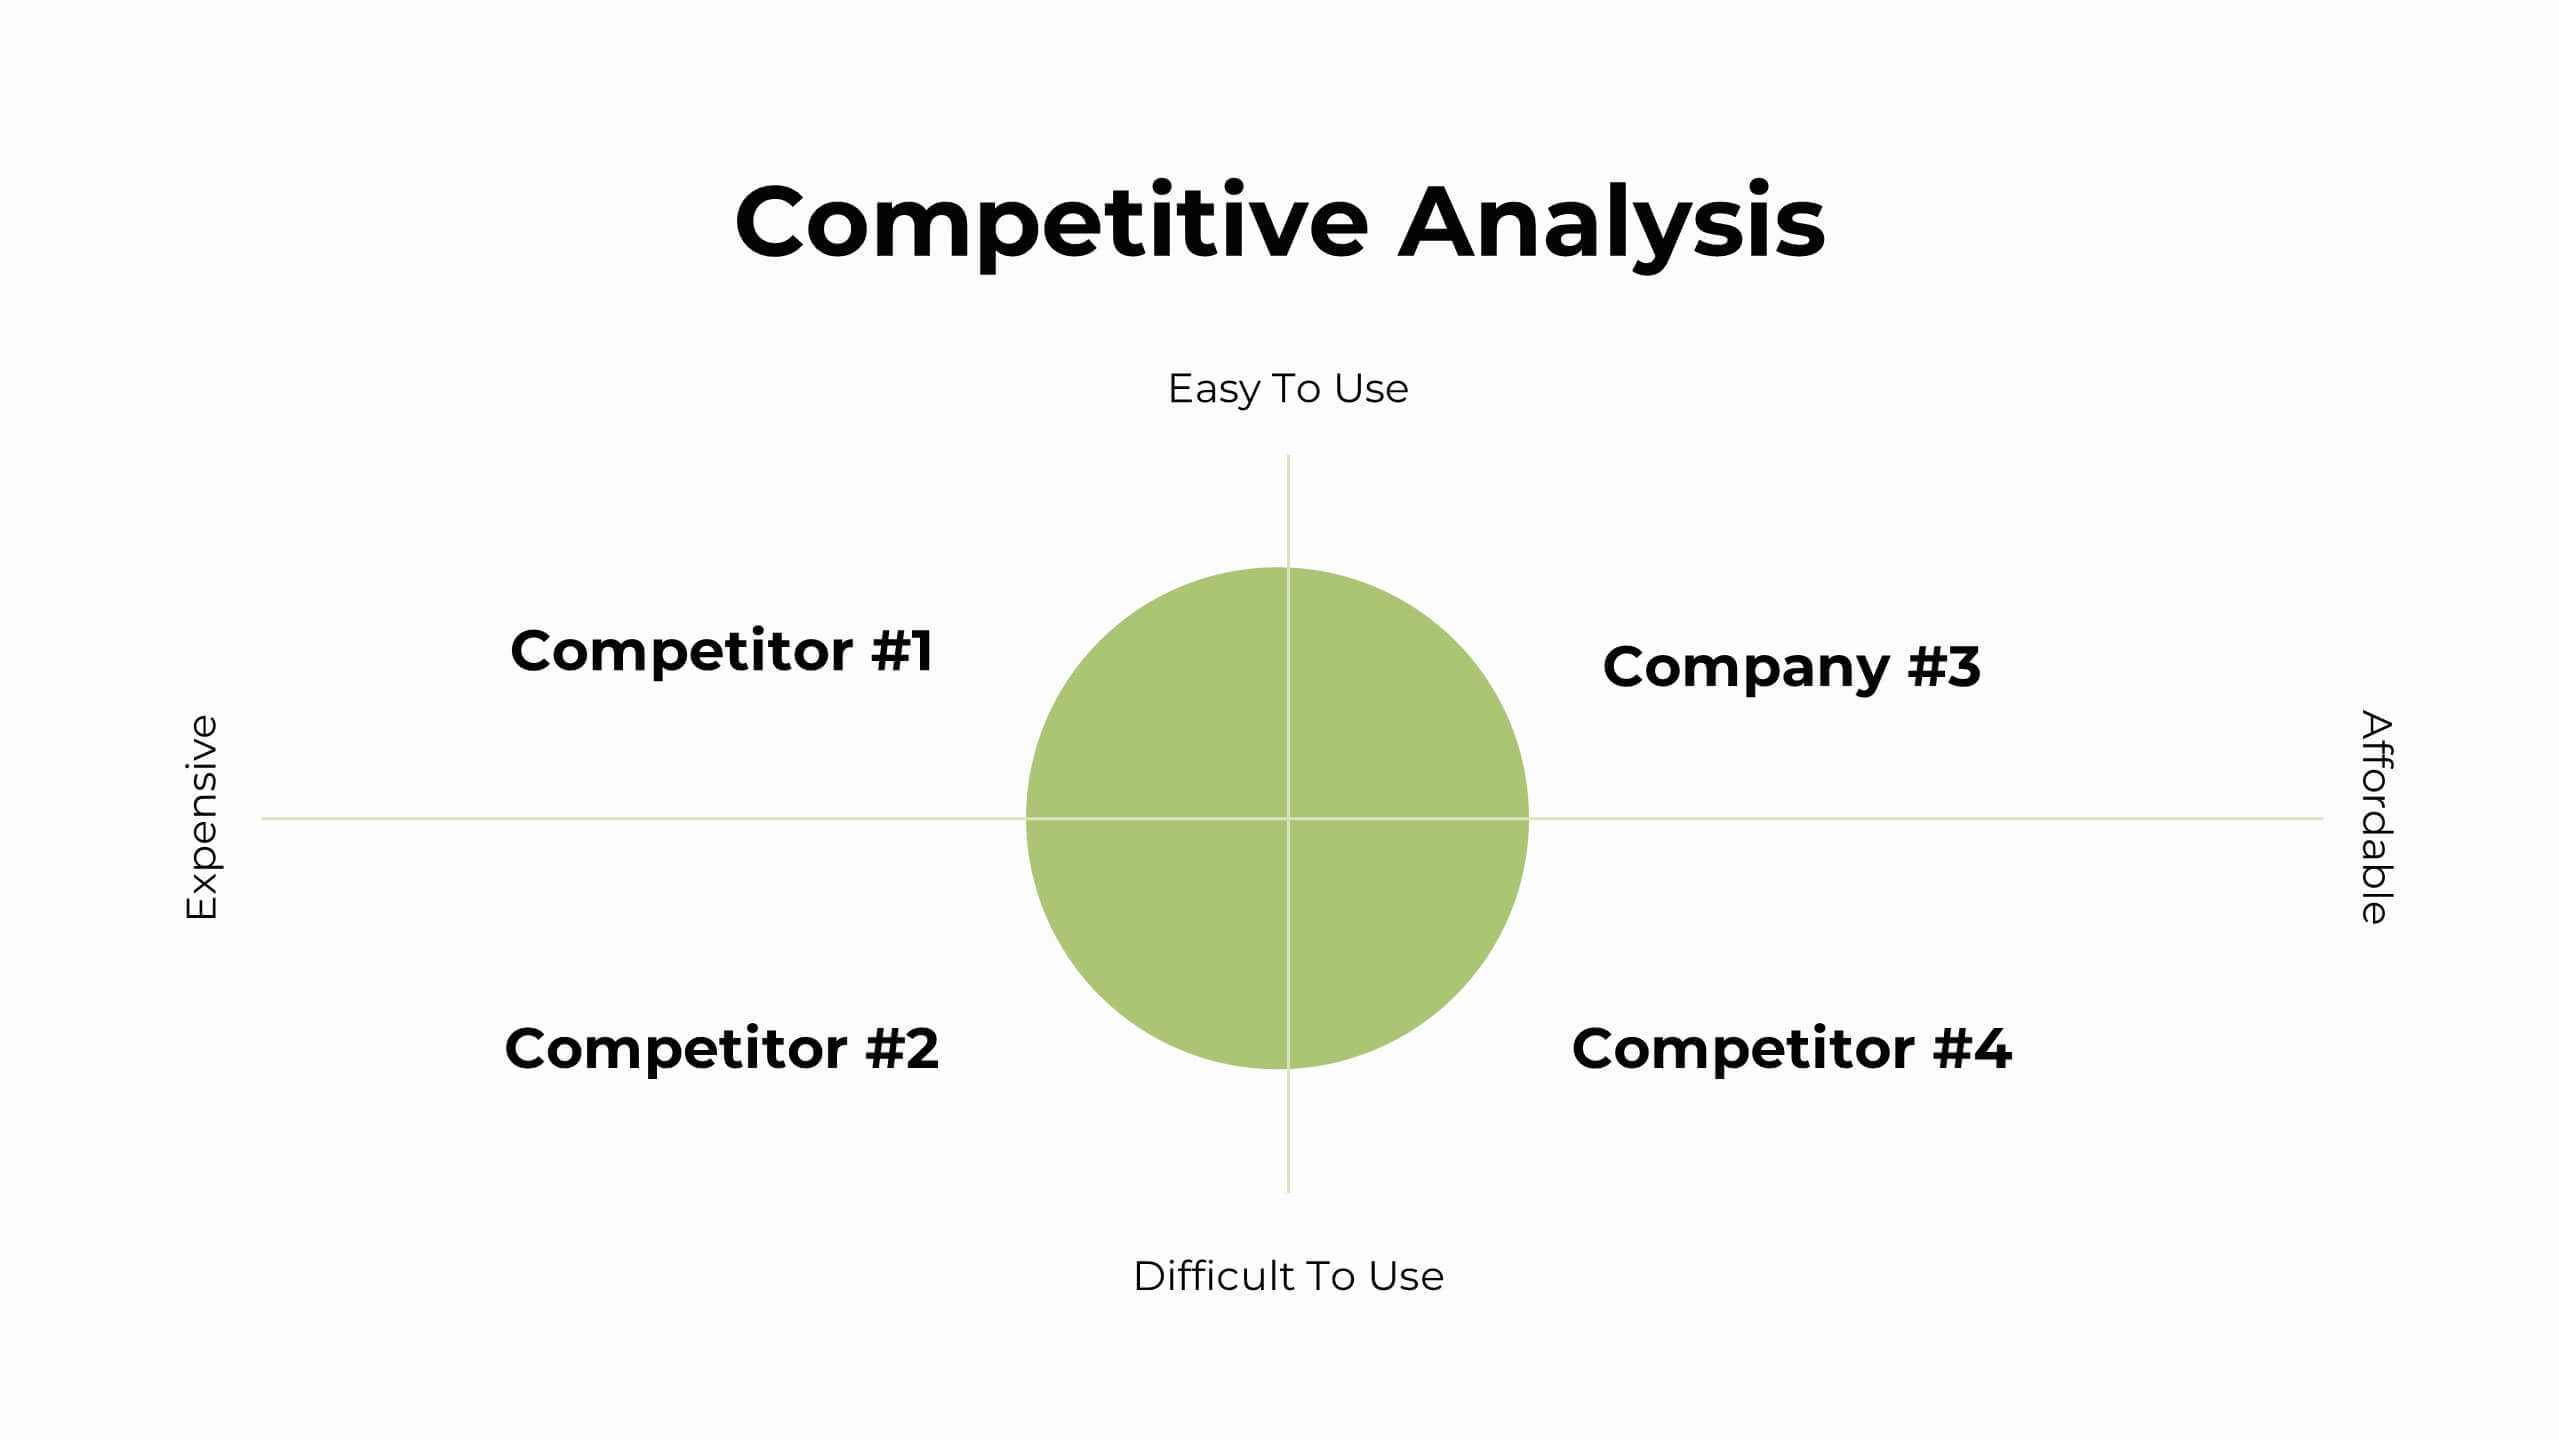
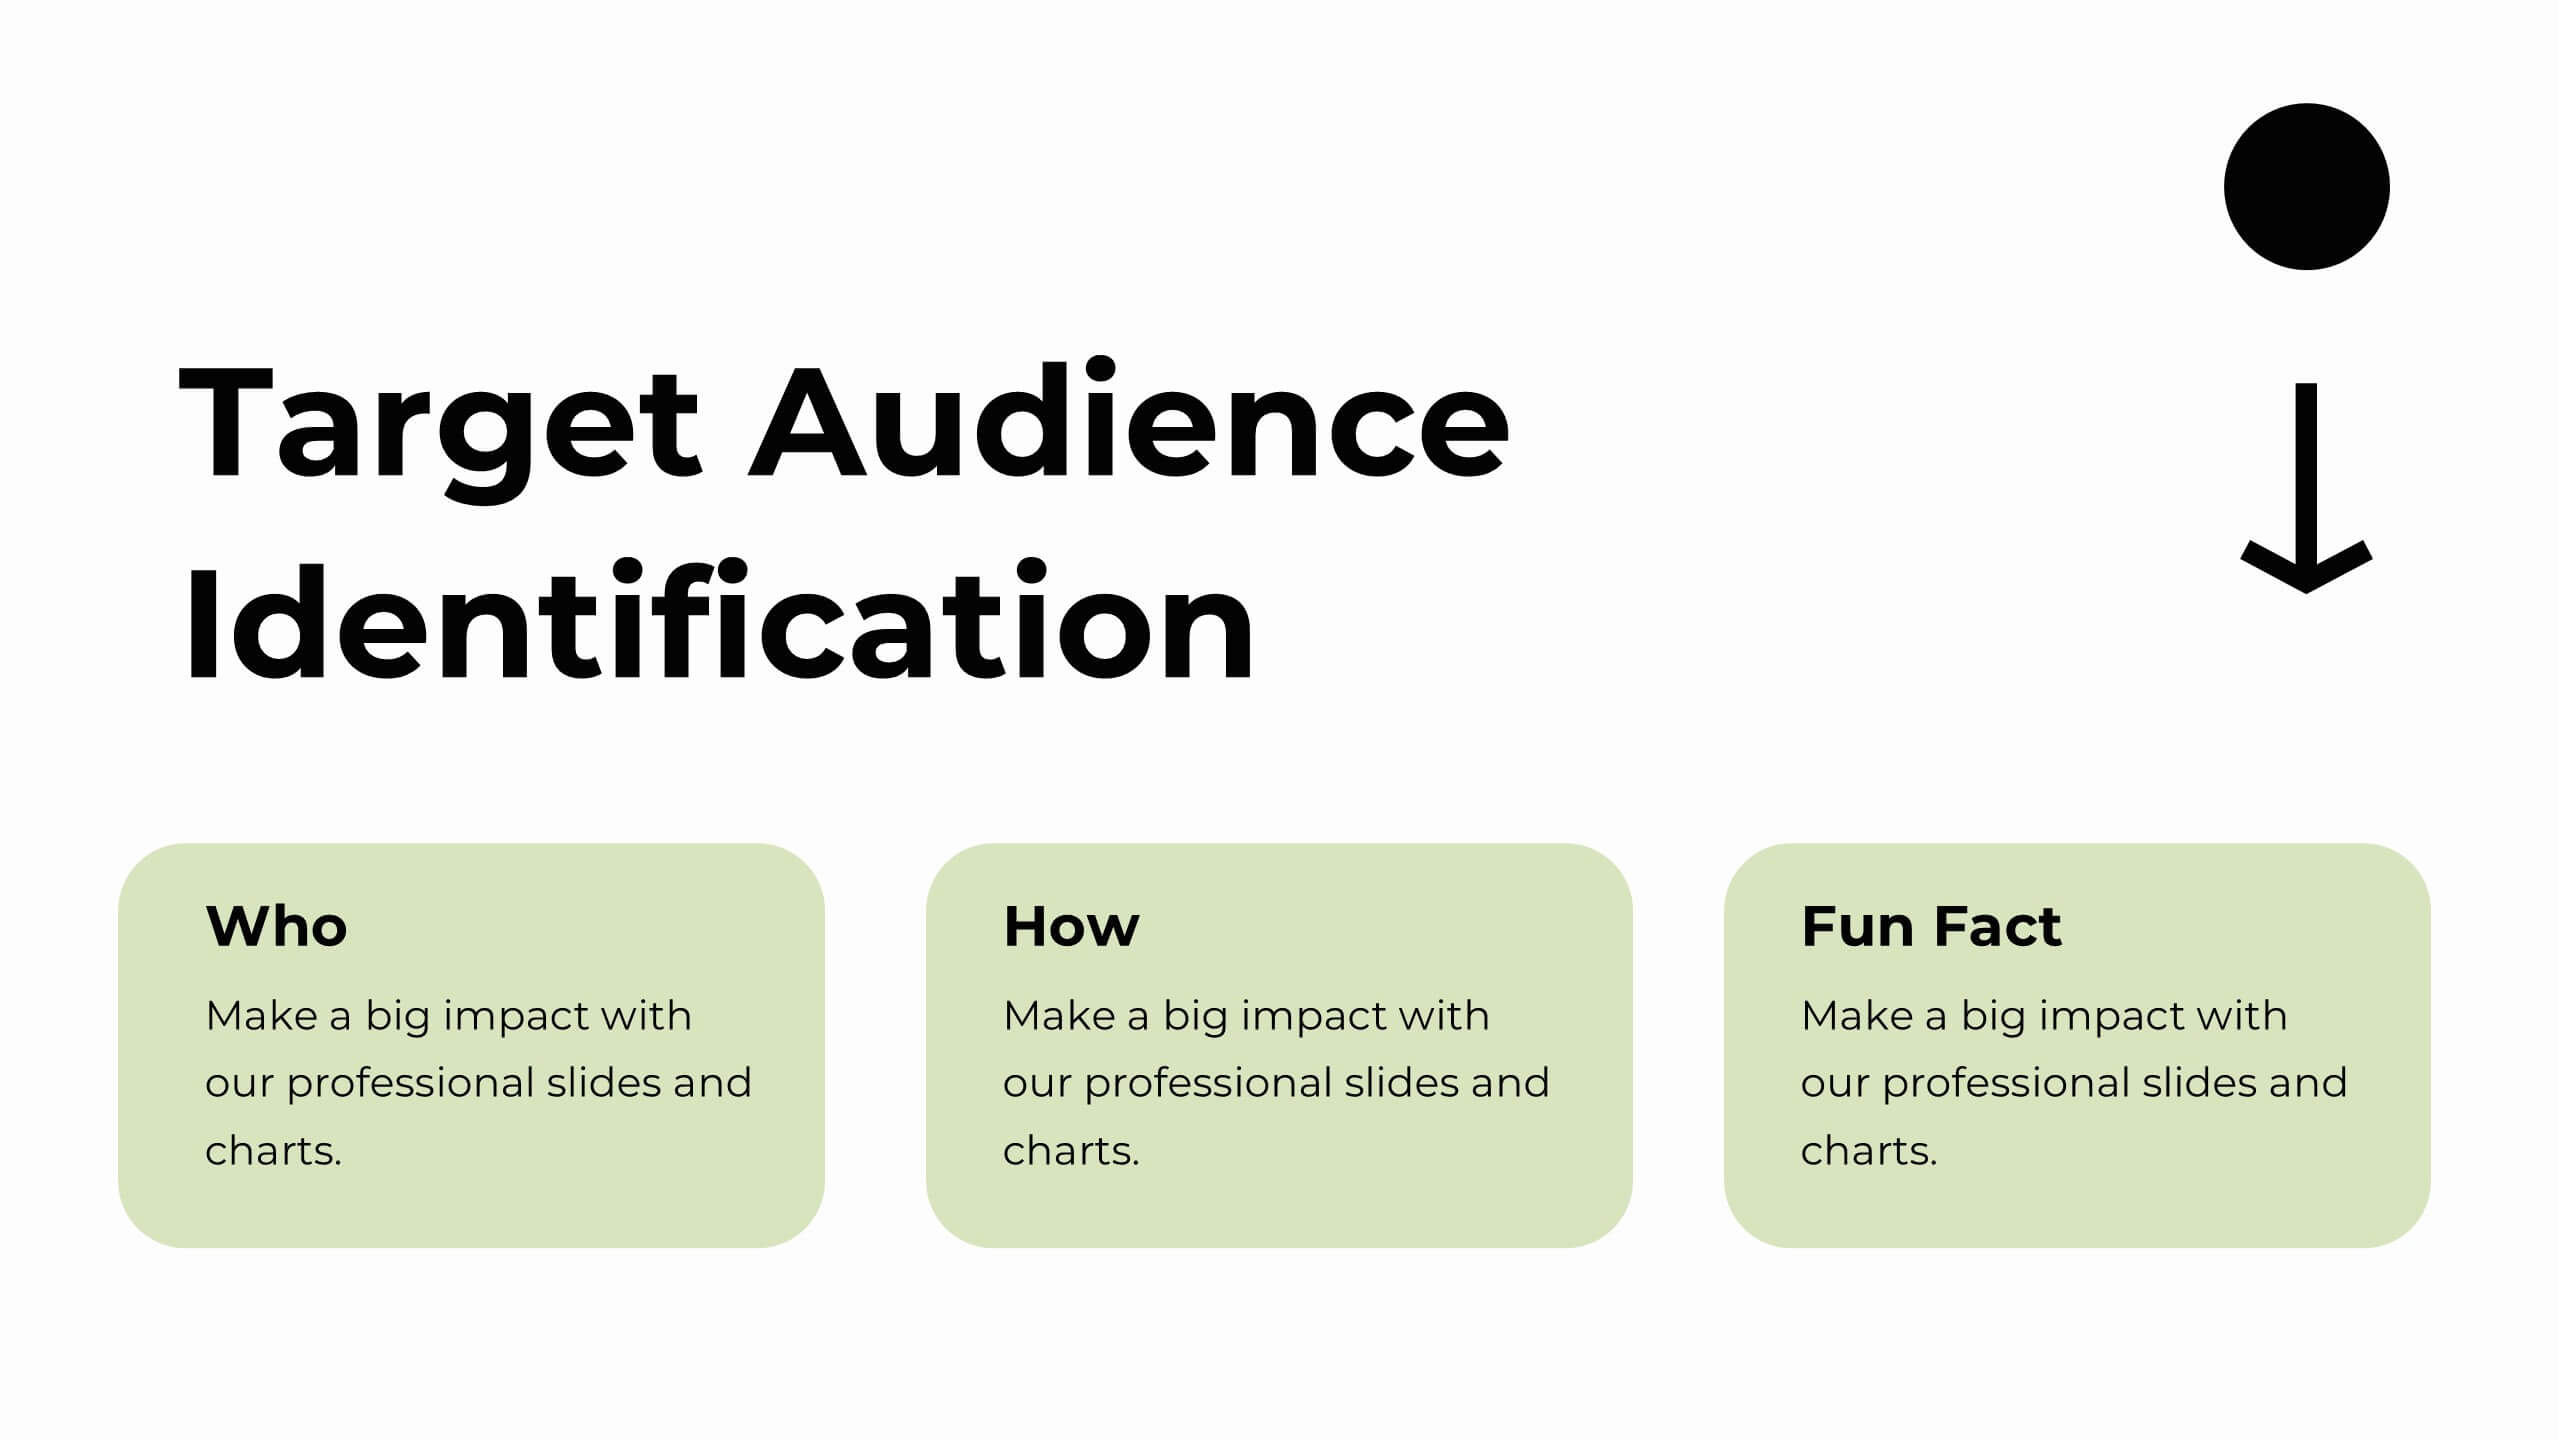
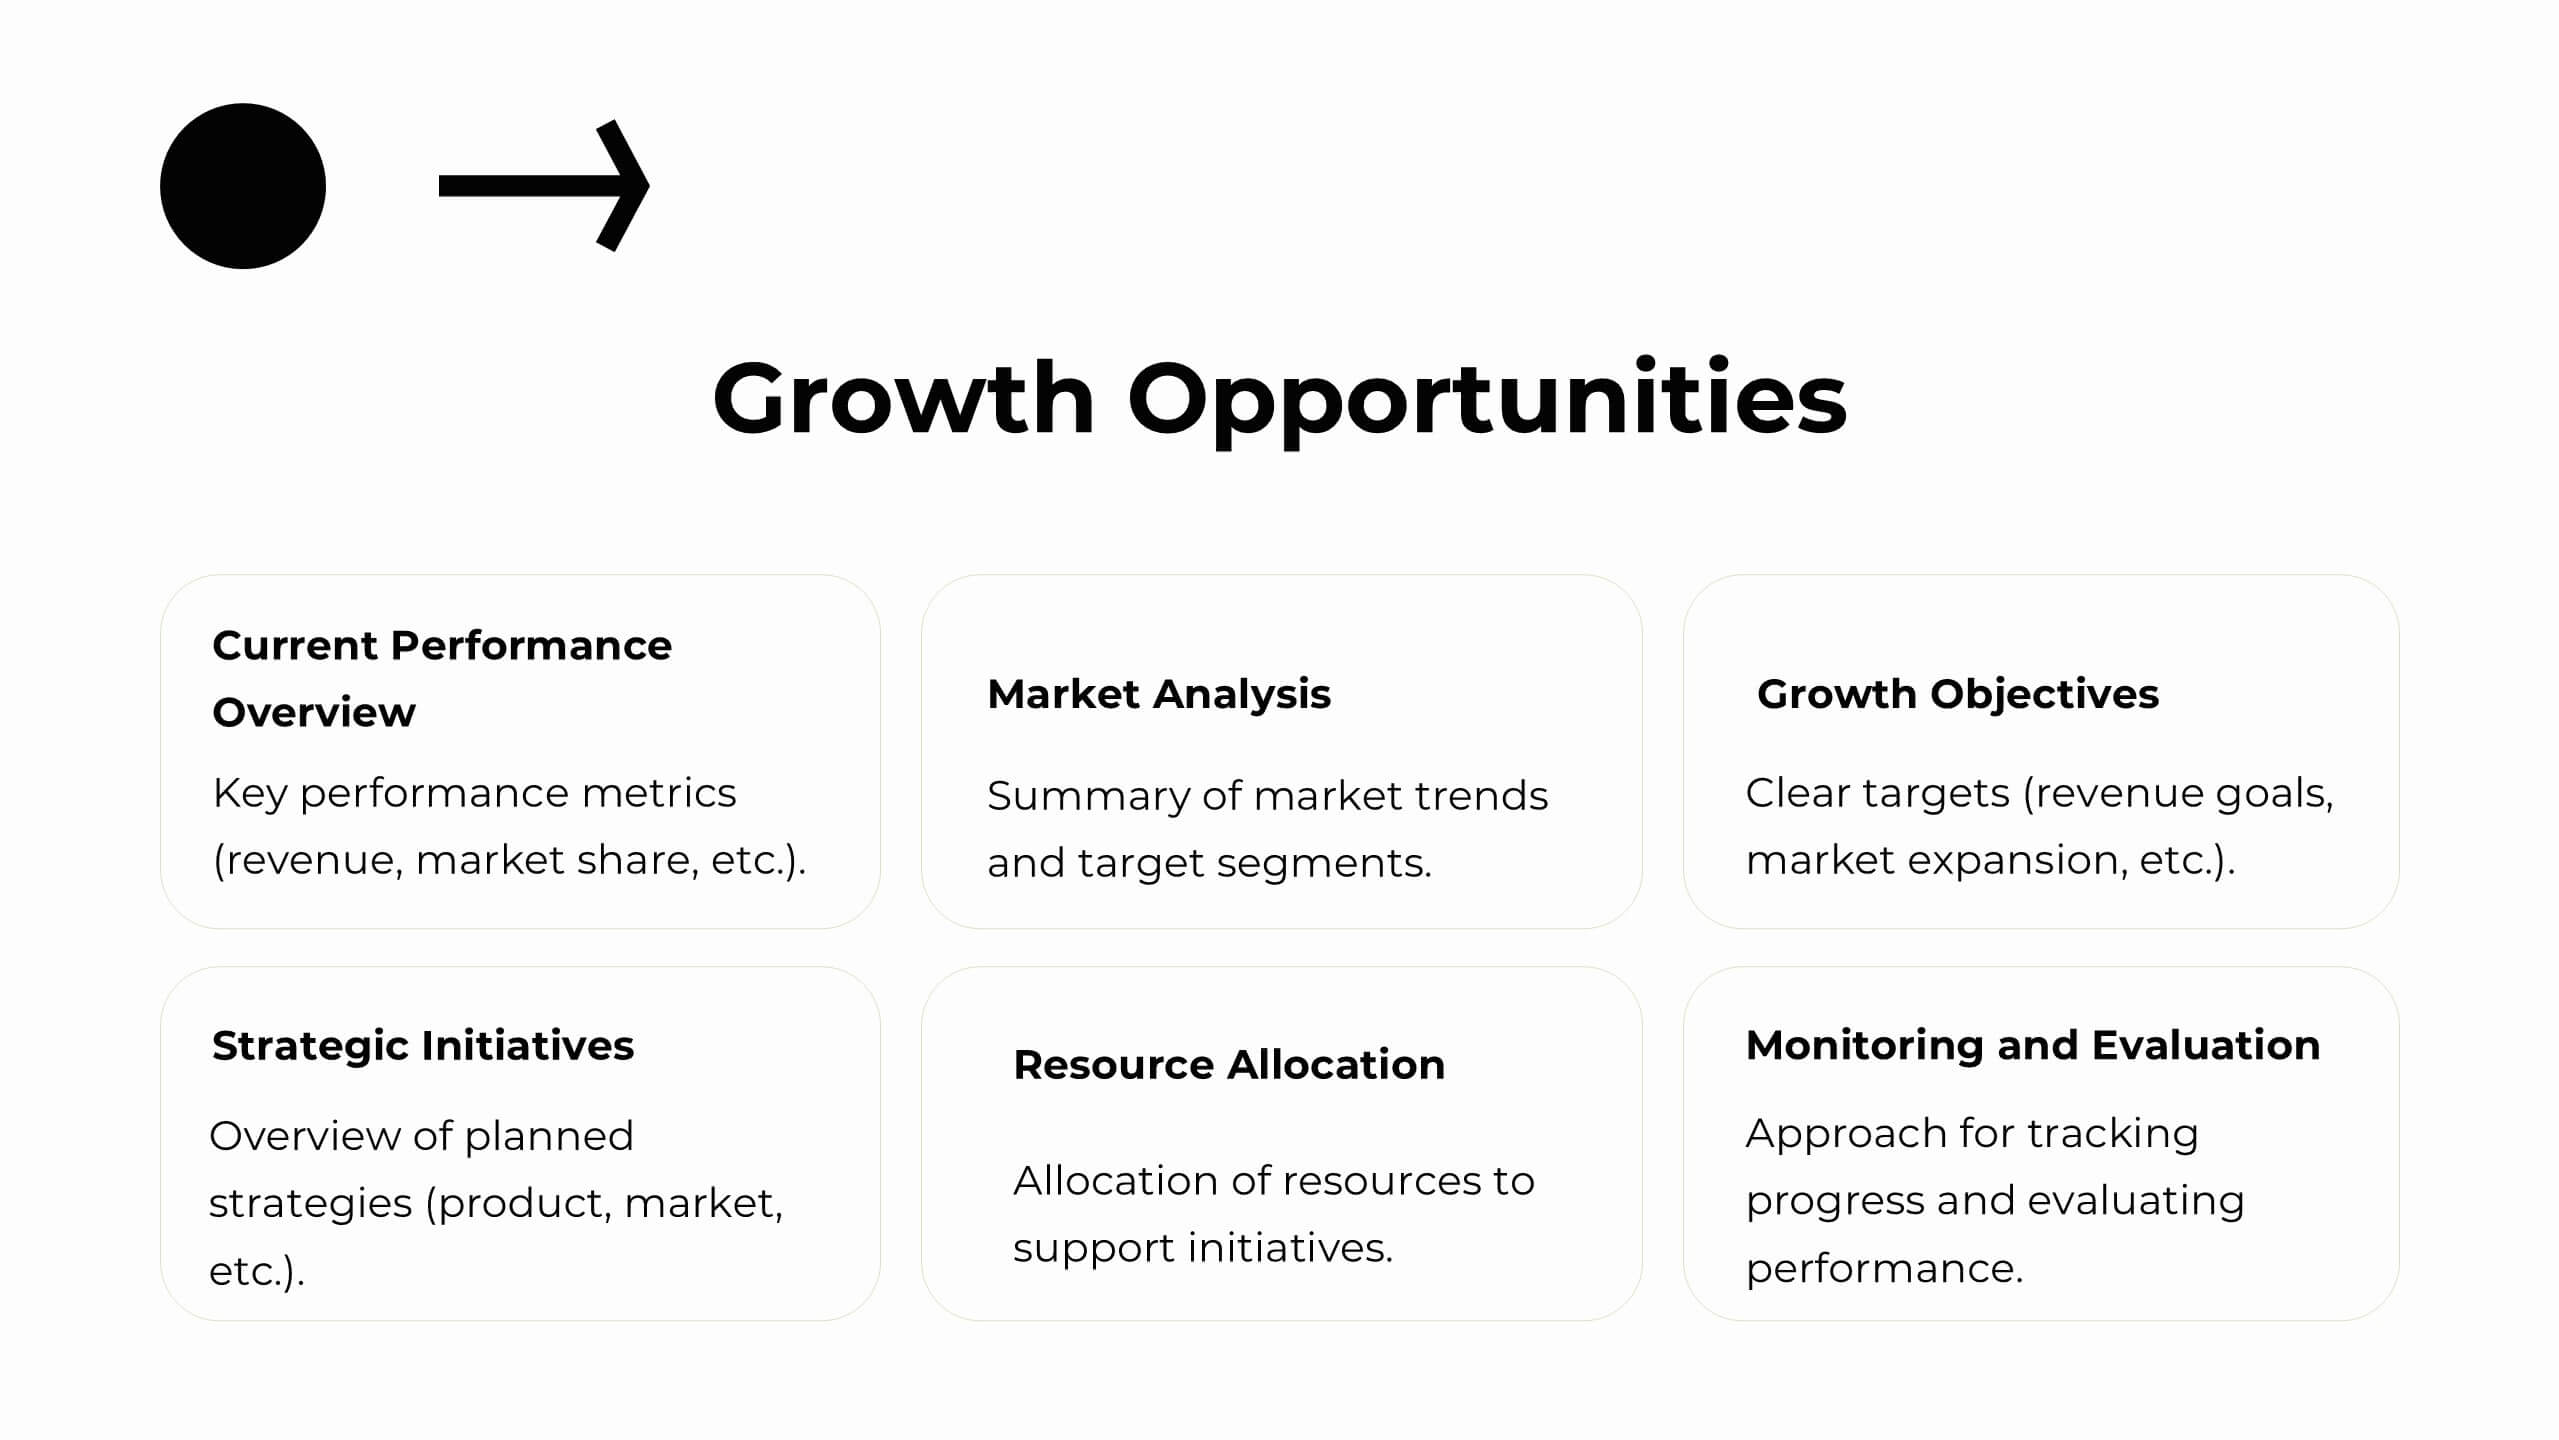
Plan and present your strategies with precision using this comprehensive strategic planning report template! Designed for clear communication of goals, market trends, SWOT analysis, and growth opportunities, it’s perfect for aligning team objectives and driving success. Fully customizable and compatible with PowerPoint, Keynote, and Google Slides, this template is ideal for strategic initiatives and performance reviews.


5 slides
Population Segmentation by Demographic Factors Presentation
Break down audience demographics with this segmented infographic slide. Featuring a vertical figure illustration divided into color-coded percentage bars, it’s ideal for showcasing traits like age, gender, or location. This layout offers a clear visual summary, making it perfect for reports, marketing briefs, or investor presentations. Fully editable in Canva.


7 slides
Venn Diagram Infographic Presentation Template
A Venn diagram is a type of chart that uses circles to show the similarities and differences between two or more sets of items. The circles overlap in the areas where the items have something in common, and the non-overlapping areas show the items that are unique to each set. This template is perfect for showing how different things are alike and different. This template includes lots of diagrams with circles that you can customize to show all the similarities between your different information. You can also add pictures and charts to make it look more appealing with your personal data.


7 slides
International Finance Infographic
International finance is a branch of economics and financial studies that deals with monetary interactions that occur between two or more countries. Dive into the intricate world of finance with our visually captivating international finance infographic. This template is your passport to understanding the complexities and opportunities in the global financial landscape. With this template you will be able to analyze the dynamics of exchange rates, foreign investment, and how these factors influence global economics. This infographic is crafted to provide a holistic view of the world of finance.


5 slides
Medical Technology Infographics
Medical Technology refers to the use of innovative technologies, devices, and systems in healthcare to improve patient care, diagnosis, treatment, and overall healthcare delivery. These infographics are comprehensive and visually appealing designs that allow you to showcase the advancements and impact of medical technology in the healthcare industry. This template is perfect for presentations, reports, or educational materials related to medical technology. The template includes various vertical infographic elements that allow you to highlight the benefits, applications, and advancements in medical technology.


7 slides
Data Analysis Research Infographic
A Data Analysis Research infographic is a visual representation of the key findings of a research study that used data analysis techniques. The purpose of this template is to provide a clear summary of the research study's most important results, making it easier for your viewers to understand and interpret the findings. This infographic include visualizations such as charts, graphs, icons, and tables that present key data points in a visually compelling way. This template is designed to highlight differences between groups or subgroups, or show how various factors are related to one another.


4 slides
3-Tier Hierarchical Pyramid Breakdown
Simplify your strategy presentation with the 3-Tier Hierarchical Pyramid Breakdown Presentation. This clear and modern slide features a three-level pyramid with horizontal progress bars and percentage indicators—perfect for visualizing goals, KPIs, or organizational layers. Each tier includes editable text boxes for quick customization. Works seamlessly in PowerPoint, Keynote, and Google Slides.


5 slides
Monthly Sales Report Infographics
A monthly sales report is a document that provides an overview of a company's sales performance during a specific month. These infographic templates are perfect for sales managers, business owners, or analysts who want to present monthly sales performance and trends to stakeholders, team members, or clients. This is an effective tool for presenting sales data in a visually engaging and comprehensive way. With these templates, you can create professional and impactful sales reports that effectively convey the story behind the numbers. Compatible with Powerpoint, Keynote, and Google Slides.


4 slides
AIDA Marketing Model Breakdown Presentation
Visualize your marketing funnel with this sleek AIDA breakdown slide. Each stage—Attention, Interest, Desire, and Action—is clearly illustrated with bold arrow graphics and space for strategic insights. Ideal for marketing teams, business pitches, or campaign planning. Fully customizable in PowerPoint, Keynote, and Google Slides.


3 slides
Agricultural Business Plan Presentation
Showcase your farming strategies with this agricultural business plan template, featuring plant growth visuals and clean, modern layouts. Ideal for agribusiness proposals, sustainability reports, and agricultural project planning. Fully editable in Canva, PowerPoint, and Google Slides, allowing you to customize text, icons, and colors to match your brand identity.


3 slides
Visual Breakdown with Tree Diagram Format Presentation
Illustrate growth stages, concepts, or layered development with the Visual Breakdown with Tree Diagram Format Presentation. This creative design uses three tree icons—seedling, sapling, and mature tree—to represent progression or hierarchy. Ideal for timelines, product evolution, or strategic planning. Fully editable in PowerPoint, Keynote, and Google Slides.


7 slides
Union Venn Diagram Infographic
Venn Diagrams are a great way to display your data in an organized, aesthetically pleasing way. This infographic template is perfect for any presentation that requires a Venn Diagram. This template is designed to visually demonstrate the impact of your company's efforts. Use this to show how different teams work to achieve goals, or how different departments work together to create something new. Compatible with Powerpoint, Keynote, and Google Slides. This infographic uses a cool, bold color scheme and fun imagery to show the relationship between two or more sets of data in a way that will help you easily explain it to your target audience.


7 slides
Business People Infographic Presentation Template
This Business People infographic template is perfect for a business handbook, corporate presentation and briefing. This template is designed with subtle colors and textures, the clean layout makes it easy to highlight important data and the many components that can be used for different purposes. This is a great, clean and simple way for you to display all the information about your business. This infographic can effectively communicate complex information in a simple and easy-to-understand format, making it an ideal medium for exploring the topic of business people and the business world.