


Features
- 5 Unique slides
- Fully editable and easy to edit in Microsoft Powerpoint, Keynote and Google Slides
- 16:9 widescreen layout
- Clean and professional designs
- Export to JPG, PDF or send by email


Do you have any questions?
Recommend


21 slides
Sylvan Research Findings Report Presentation
The Research Findings Report Presentation Template features 21 modern slides designed to highlight key achievements, competitor insights, and actionable recommendations. Perfect for presenting performance metrics, market trends, and team productivity. Fully customizable and compatible with PowerPoint, Keynote, and Google Slides, it ensures clarity and professionalism for business reports and strategy reviews.


6 slides
Business Ethics and Governance Presentation
Navigate the complexities of ethical decision-making with our Business Ethics and Governance Presentation template. This visually engaging tool highlights key aspects of corporate ethics and governance, ideal for workshops and training sessions. Compatible with PowerPoint, Keynote, and Google Slides, it's designed to facilitate clear and effective discussions.


26 slides
Griffin Rebranding Project Plan Presentation
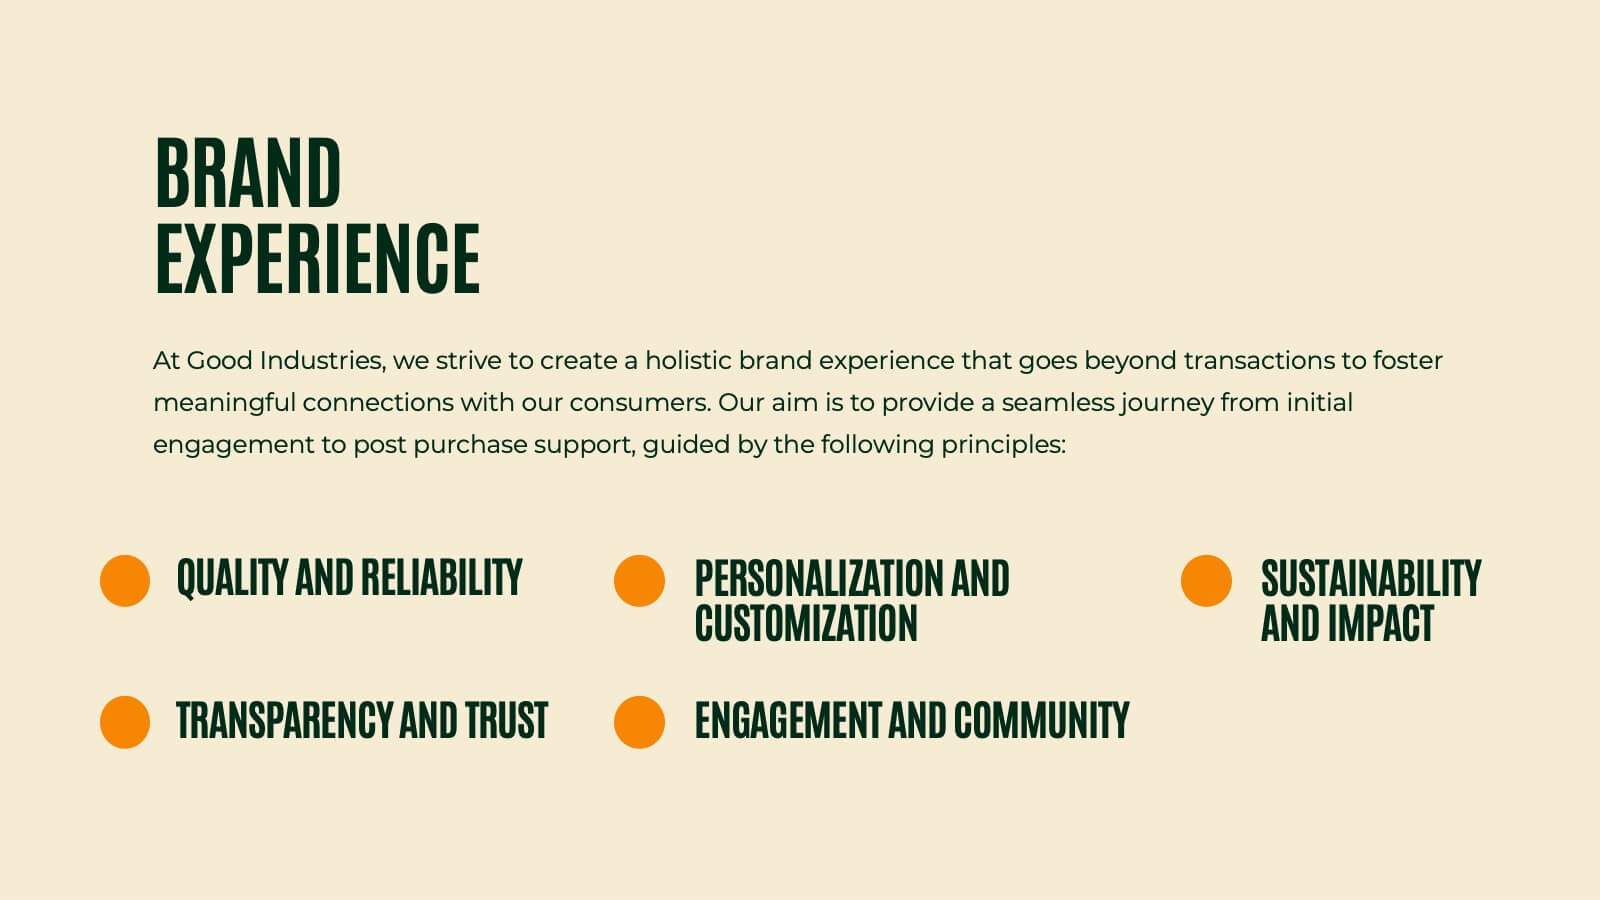
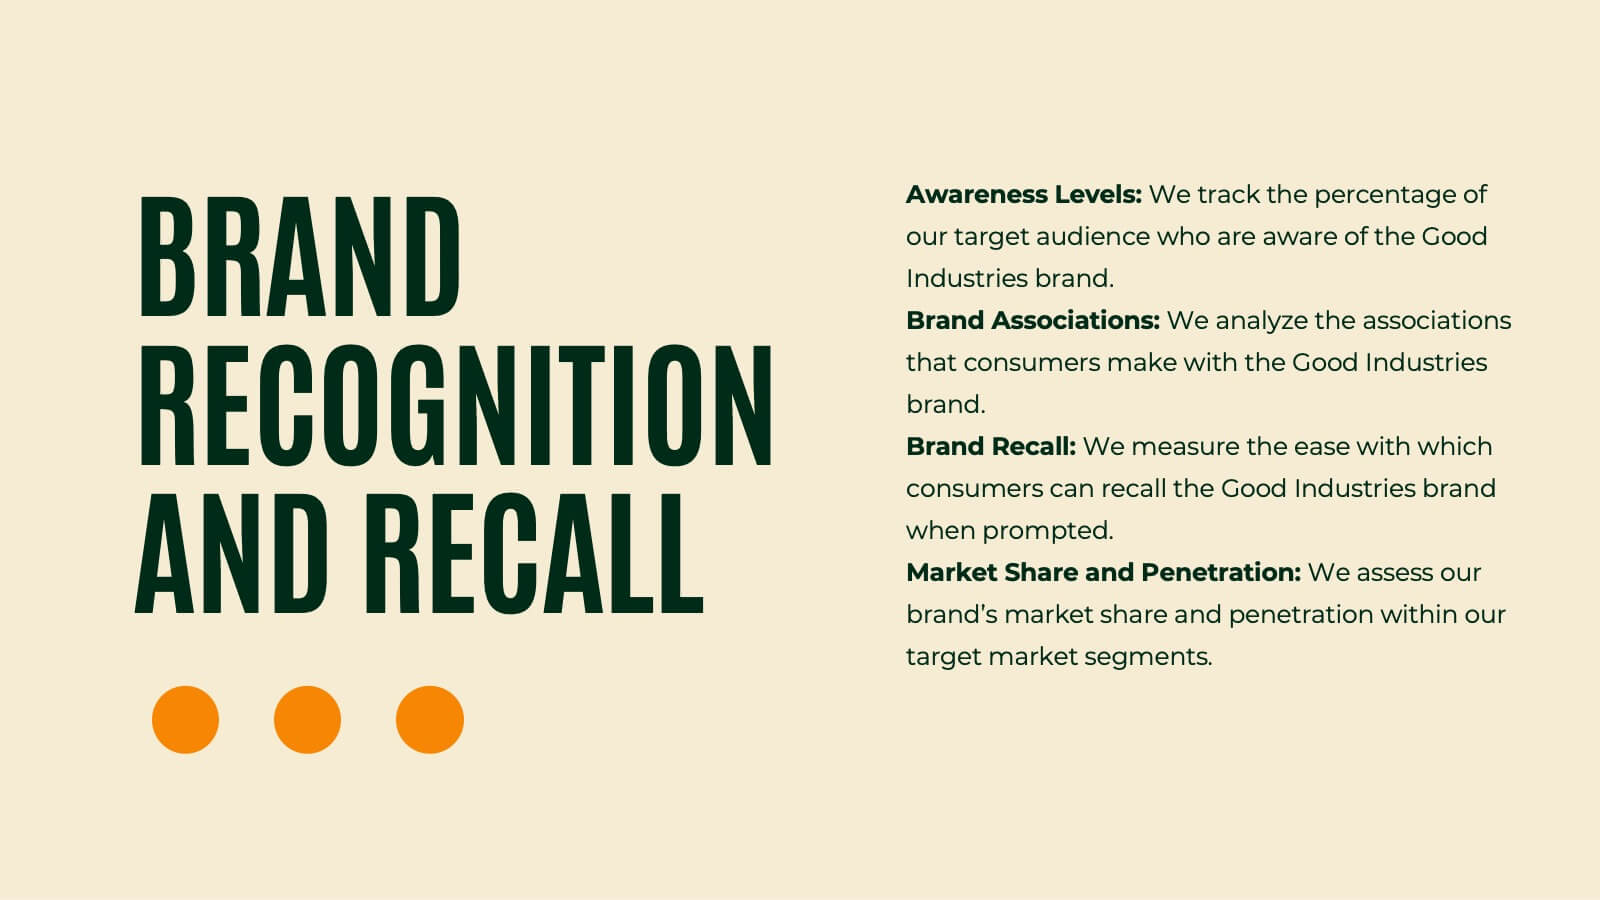
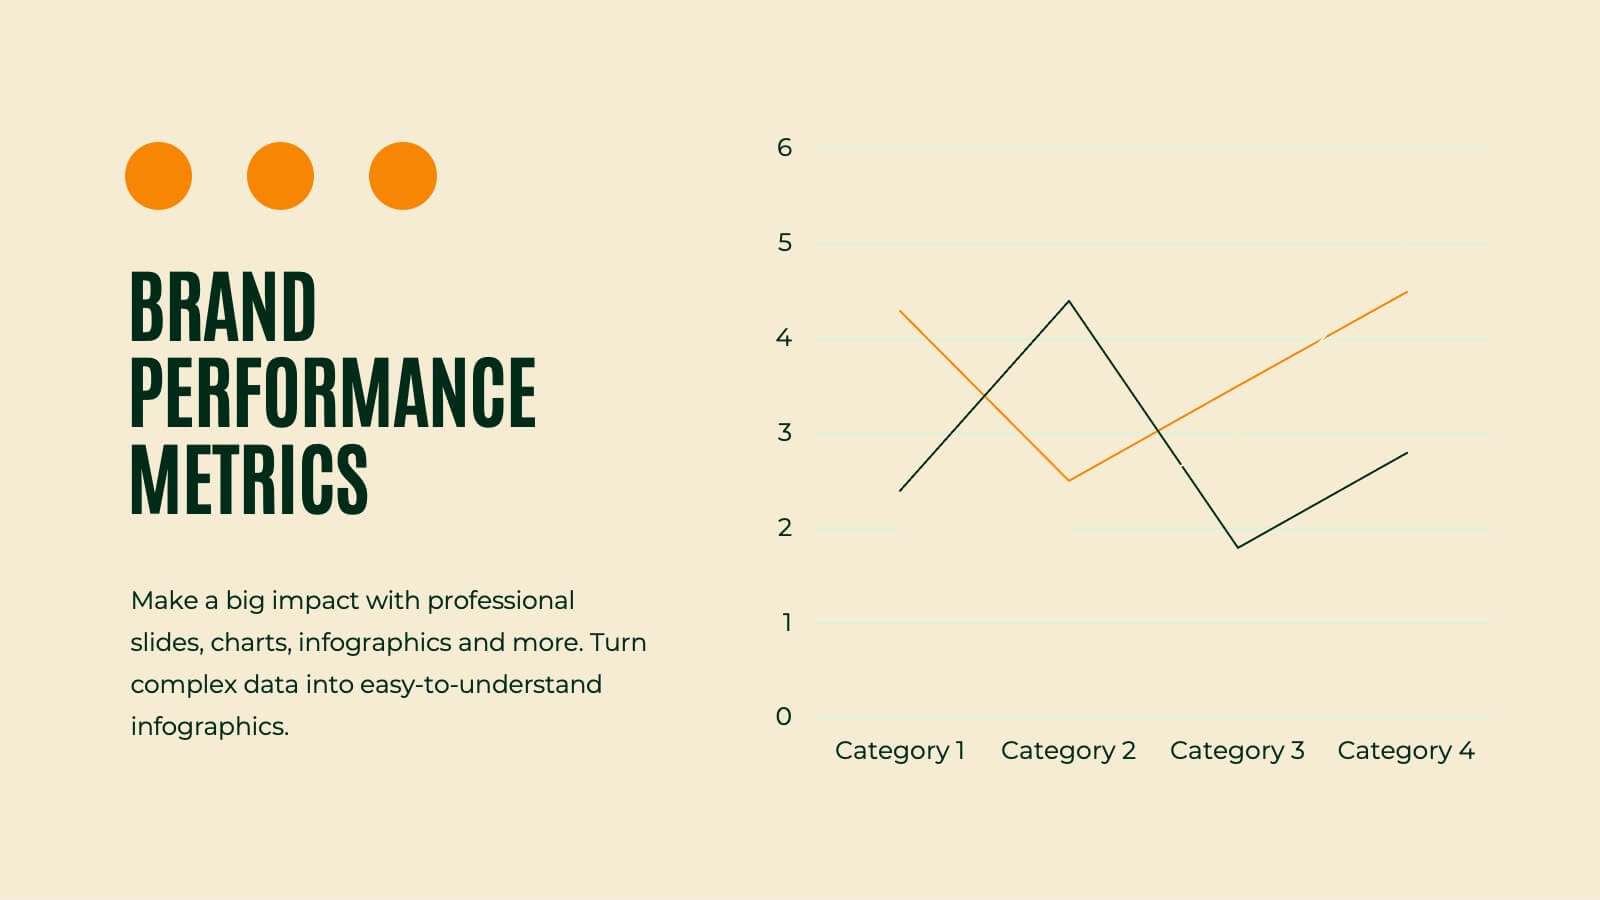
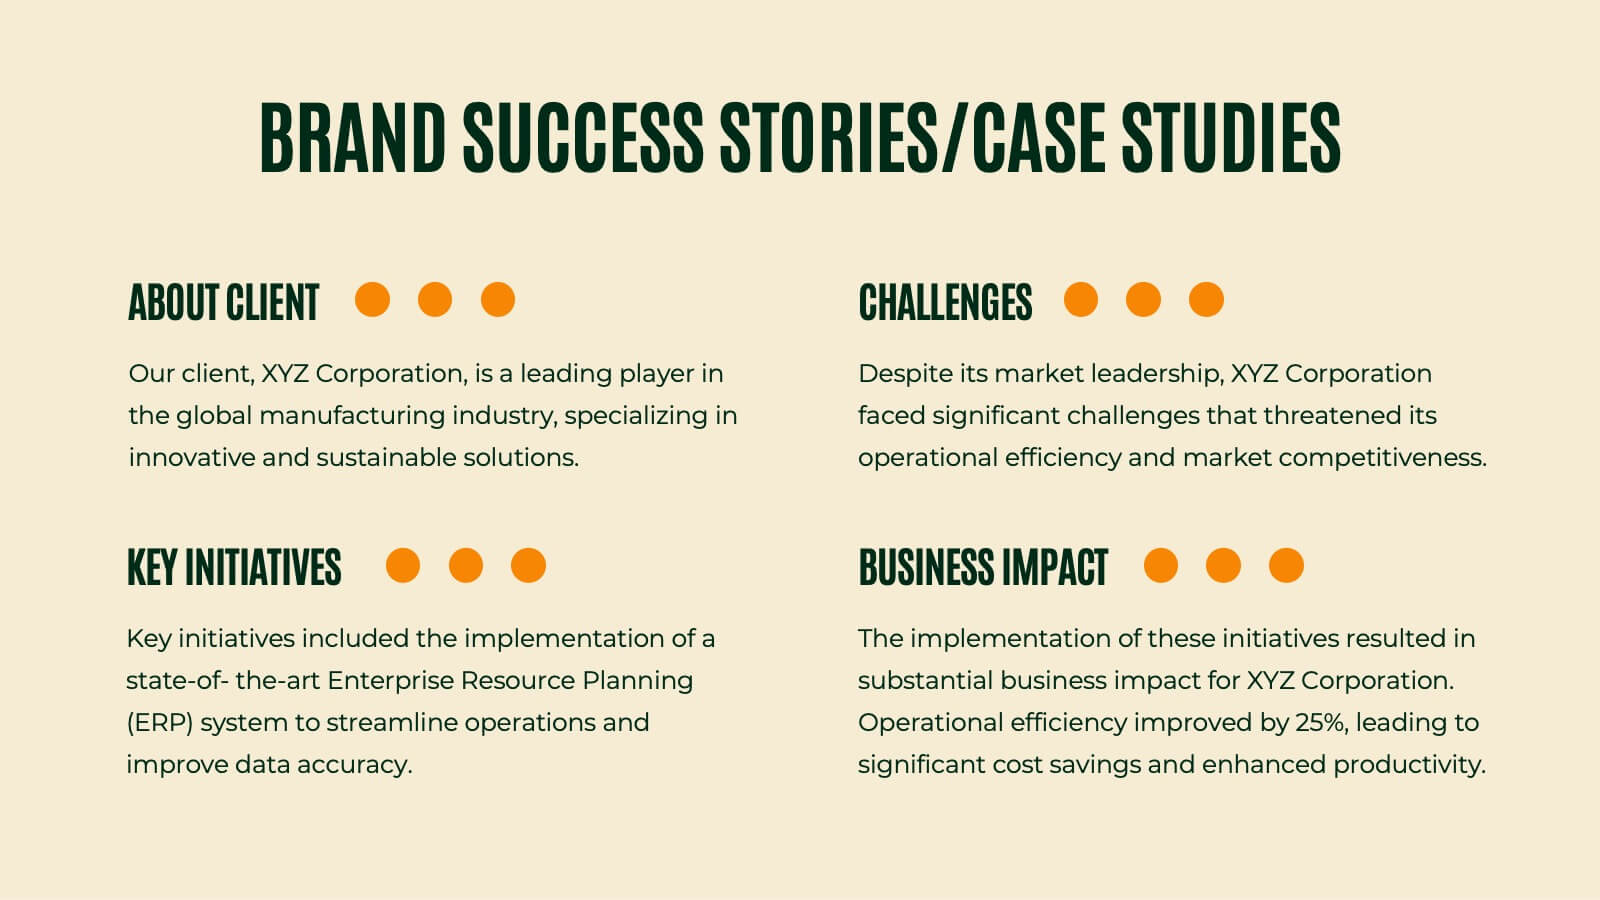
Unleash the power of branding with this vibrant presentation template! This tool guides you through essential brand elements like identity, voice, and strategy. Perfect for marketers and brand managers aiming to make a memorable impact. Compatible with PowerPoint, Keynote, and Google Slides, it's a must-have for any branding project.


6 slides
Business Revenue and Growth Model Presentation
Visualize your business's revenue trajectory and performance gains with this modern Growth Model presentation template. Designed to showcase incremental success, it features clean bar graphics with space for key milestones and KPIs across five growth stages. Perfect for financial reviews, investor updates, or strategy meetings. Compatible with PowerPoint, Keynote, and Google Slides.


7 slides
One-Page Startup Model Canvas
Launch and refine your business idea with clarity using the One-Page Startup Model Canvas Presentation. This slide presents all key startup elements—Partners, Activities, Value Propositions, Customer Segments, Revenue Streams, and more—in a smart puzzle-piece layout that simplifies complex planning. Perfect for founders and pitch decks. Fully customizable in PowerPoint, Keynote, and Google Slides.


7 slides
Social Hierarchy Infographics
A Social Hierarchy is a way of organizing and ranking individuals or groups within a society based on factors such as social status, wealth, power, and prestige. This template features a powerful message about the difference in power between different groups, a stylish design and is fully customizable. Designed for use in Powerpoint, Google Slides and Keynote. Use this template to make your point clear in a meaningful way that really sticks with your audience. This hierarchy themed infographic is best suited for presentations about company structure, business hierarchies and office politics.


5 slides
Topic Web Mind Mapping
Visualize your ideas with clarity and structure using the Topic Web Mind Mapping Presentation. Perfect for brainstorming, educational planning, or strategic thinking, this layout helps you centralize a core concept and expand with five supporting branches. Customize easily in PowerPoint, Keynote, or Google Slides to fit any topic or audience.


8 slides
Legal Framework for Corporations
Visualize corporate compliance and governance structures with this balanced legal framework slide. Featuring a scale diagram with adjustable sections, it’s perfect for explaining regulations, policies, and corporate ethics. Ideal for law firms, corporate teams, and compliance officers. Fully editable and compatible with PowerPoint, Keynote, and Google Slides.


6 slides
Market Trends and Risk Analysis with PESTEL Presentation
Present strategic insights with clarity using this Market Trends and Risk Analysis with PESTEL slide. Ideal for business consultants, marketers, and strategic planners, this slide helps dissect external factors—Political, Economic, Sociocultural, Technological, Environmental, and Legal—into clearly labeled segments using a modern hexagonal layout. Each section offers dedicated space for brief analysis or key data points, making it perfect for risk assessment, market evaluation, and forecasting discussions. Easily customizable in PowerPoint, Keynote, and Google Slides.


6 slides
User Experience Rating System Presentation
Evaluate user satisfaction with this user experience rating system template! Designed to visually represent feedback levels, this structured layout helps businesses analyze customer experiences, identify strengths, and address pain points. Perfect for UX research, surveys, and performance assessments. Fully customizable and compatible with PowerPoint, Keynote, and Google Slides


6 slides
SEO Services Infographic
Search Engine Optimization services are specialized strategies and practices aimed at improving a website's visibility and ranking in search engine results pages. The goal of SEO is to increase organic traffic to a website by optimizing various elements, such as content, keywords, website structure, and more. This template is designed to provide an overview of the different aspects of SEO that the agency specializes in. This Infographic is a valuable tool for SEO agencies to showcase their expertise, services, and track record to potential clients. This template is compatible with Powerpoint, Keynote, and Google Slides.


7 slides
Europe Population Infographic Presentation
A Europe Map infographic is a visual representation of the European continent, highlighting its geographic features, population, culture, history, and other relevant information. This template is a perfect graphic representation of Europe that combines text, data, and images in a fun and engaging way. This pre-designed template allows users to modify or customize the map to suit their specific needs. This includes a map of Europe with its countries, major cities, and geographic features, along with additional information and visuals related to the topic or purpose of the infographic.


5 slides
HIV Treatment & Awareness Infographics
Explore the critical realms of healthcare with our HIV treatment & awareness infographics. Rendered in striking shades of red and blue, this vertical, informative, and creatively designed template serves as a profound educational tool. It's intricately crafted for healthcare professionals, awareness campaign coordinators, and community health educators, providing a visual journey through the complexities of HIV understanding. This infographic includes compelling graphics and relevant icons, making it indispensable for those seeking to inform, prevent, and empower communities about HIV. Elevate awareness with clarity and a deep sense of humanity, one fact at a time.


6 slides
Decision Flow Diagram Presentation
Make complex decisions easier to follow with the Decision Flow Diagram Presentation. This clean and logical layout breaks down two main options and guides viewers through possible outcomes using a visual tree structure. Featuring checkmark and X icons to clearly denote decisions, this template is ideal for strategic planning, operations, or troubleshooting. Includes light and dark modes, editable in PowerPoint, Keynote, and Google Slides.


5 slides
Mental Health Counseling Infographics
Mental health counseling is a form of therapy that focuses on helping individuals improve their mental and emotional well-being. These infographic templates are designed to raise awareness about mental health counseling and its benefits. This aims to educate and inform individuals about the importance of seeking professional help for mental health concerns and highlights the various aspects of mental health counseling. Use these to present your next educational presentation on mental health or online platforms, this provides essential information and visual aids to encourage the benefits of seeking counseling.


5 slides
Renewable Natural Energy Resources Infographics
Renewable natural energy resources, also known as renewable energy sources, are energy sources that are replenished naturally and sustainably. These vertical infographics serve as educational tools to promote awareness and understanding of renewable energy sources. They can be used in presentations, workshops, educational materials, or sustainability initiatives to inspire individuals, organizations, and communities to embrace and invest in renewable energy for a greener and more sustainable future. They are fully customizable and compatible with Powerpoint, Keynote, and Google Slides.


3 slides
Business Self-Introduction
Make a memorable first impression with this clean, skill-focused introduction slide. Ideal for presenting professional backgrounds, role highlights, and expertise levels. Great for resumes, team intros, or portfolio decks. Fully editable in PowerPoint, Keynote, and Google Slides.