


Features
- 4 Unique slides
- Fully editable and easy to edit in Microsoft Powerpoint, Keynote and Google Slides
- 16:9 widescreen layout
- Clean and professional designs
- Export to JPG, PDF or send by email


Do you have any questions?
Recommend


7 slides
Digital KPI Dashboard Infographic
A KPI Dashboard is a visual representation of the most important performance metrics or KPIs that track the progress of an organization or business activities. This infographic template is designed to showcase the KPIs and metrics that are crucial for evaluating the success of digital marketing efforts. This template provides an overview of various digital marketing KPIs in an easy-to-understand format. The template utilizes eye-catching charts, graphs, and diagrams to present digital marketing data in a visually appealing way. Bar graphs, line charts, pie charts, and other visual elements make it easy to grasp the performance trends at a glance.


5 slides
Iceberg Chart Template Infographics
Navigate the depths beneath the surface with the iceberg chart template infographics. This resource, bathed in varying shades of blue, captures the essence of uncovering hidden data, much like an iceberg reveals only a fraction of its mass above water. Professionals across diverse sectors, including business analysts and educators, will find value in this creative, ice-themed vertical template. It's especially beneficial for presentations aiming to explore beneath-the-surface dynamics, or unseen risks. The template is complete with customizable graphics, icons, and image placeholders, structured to visually break down complex concepts into digestible information.


24 slides
Petricor UX Strategy Plan Presentation
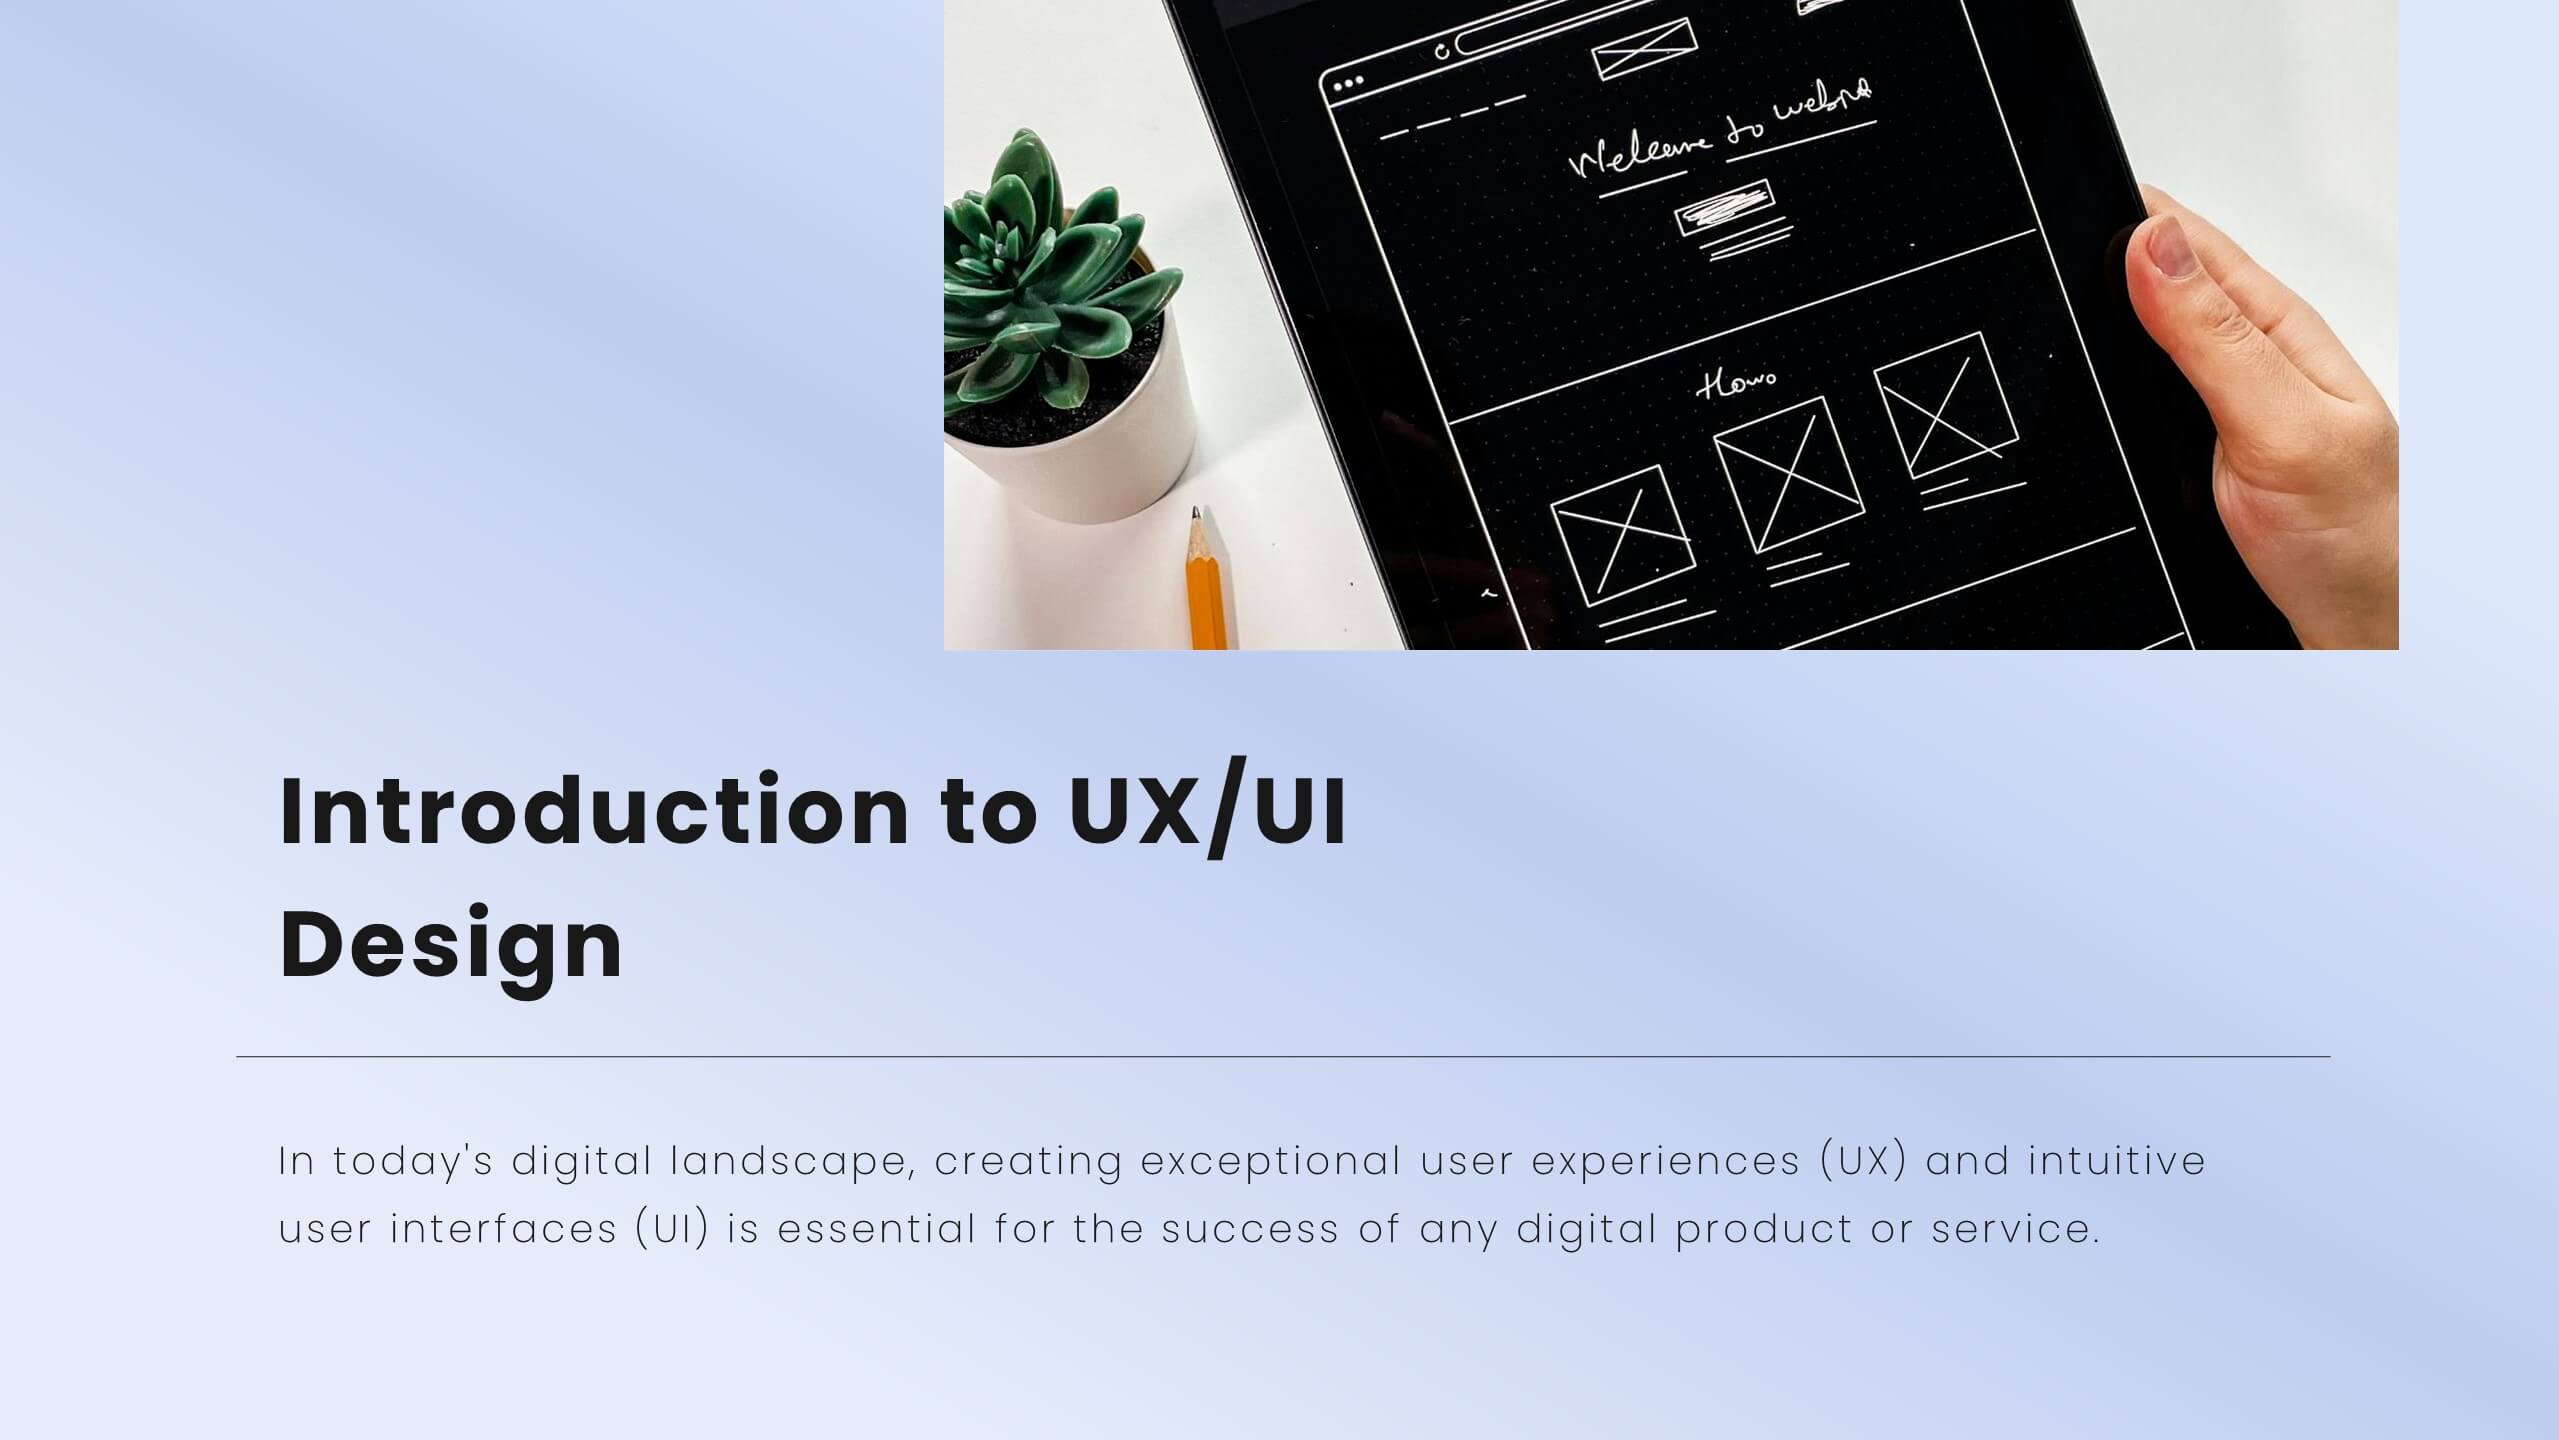
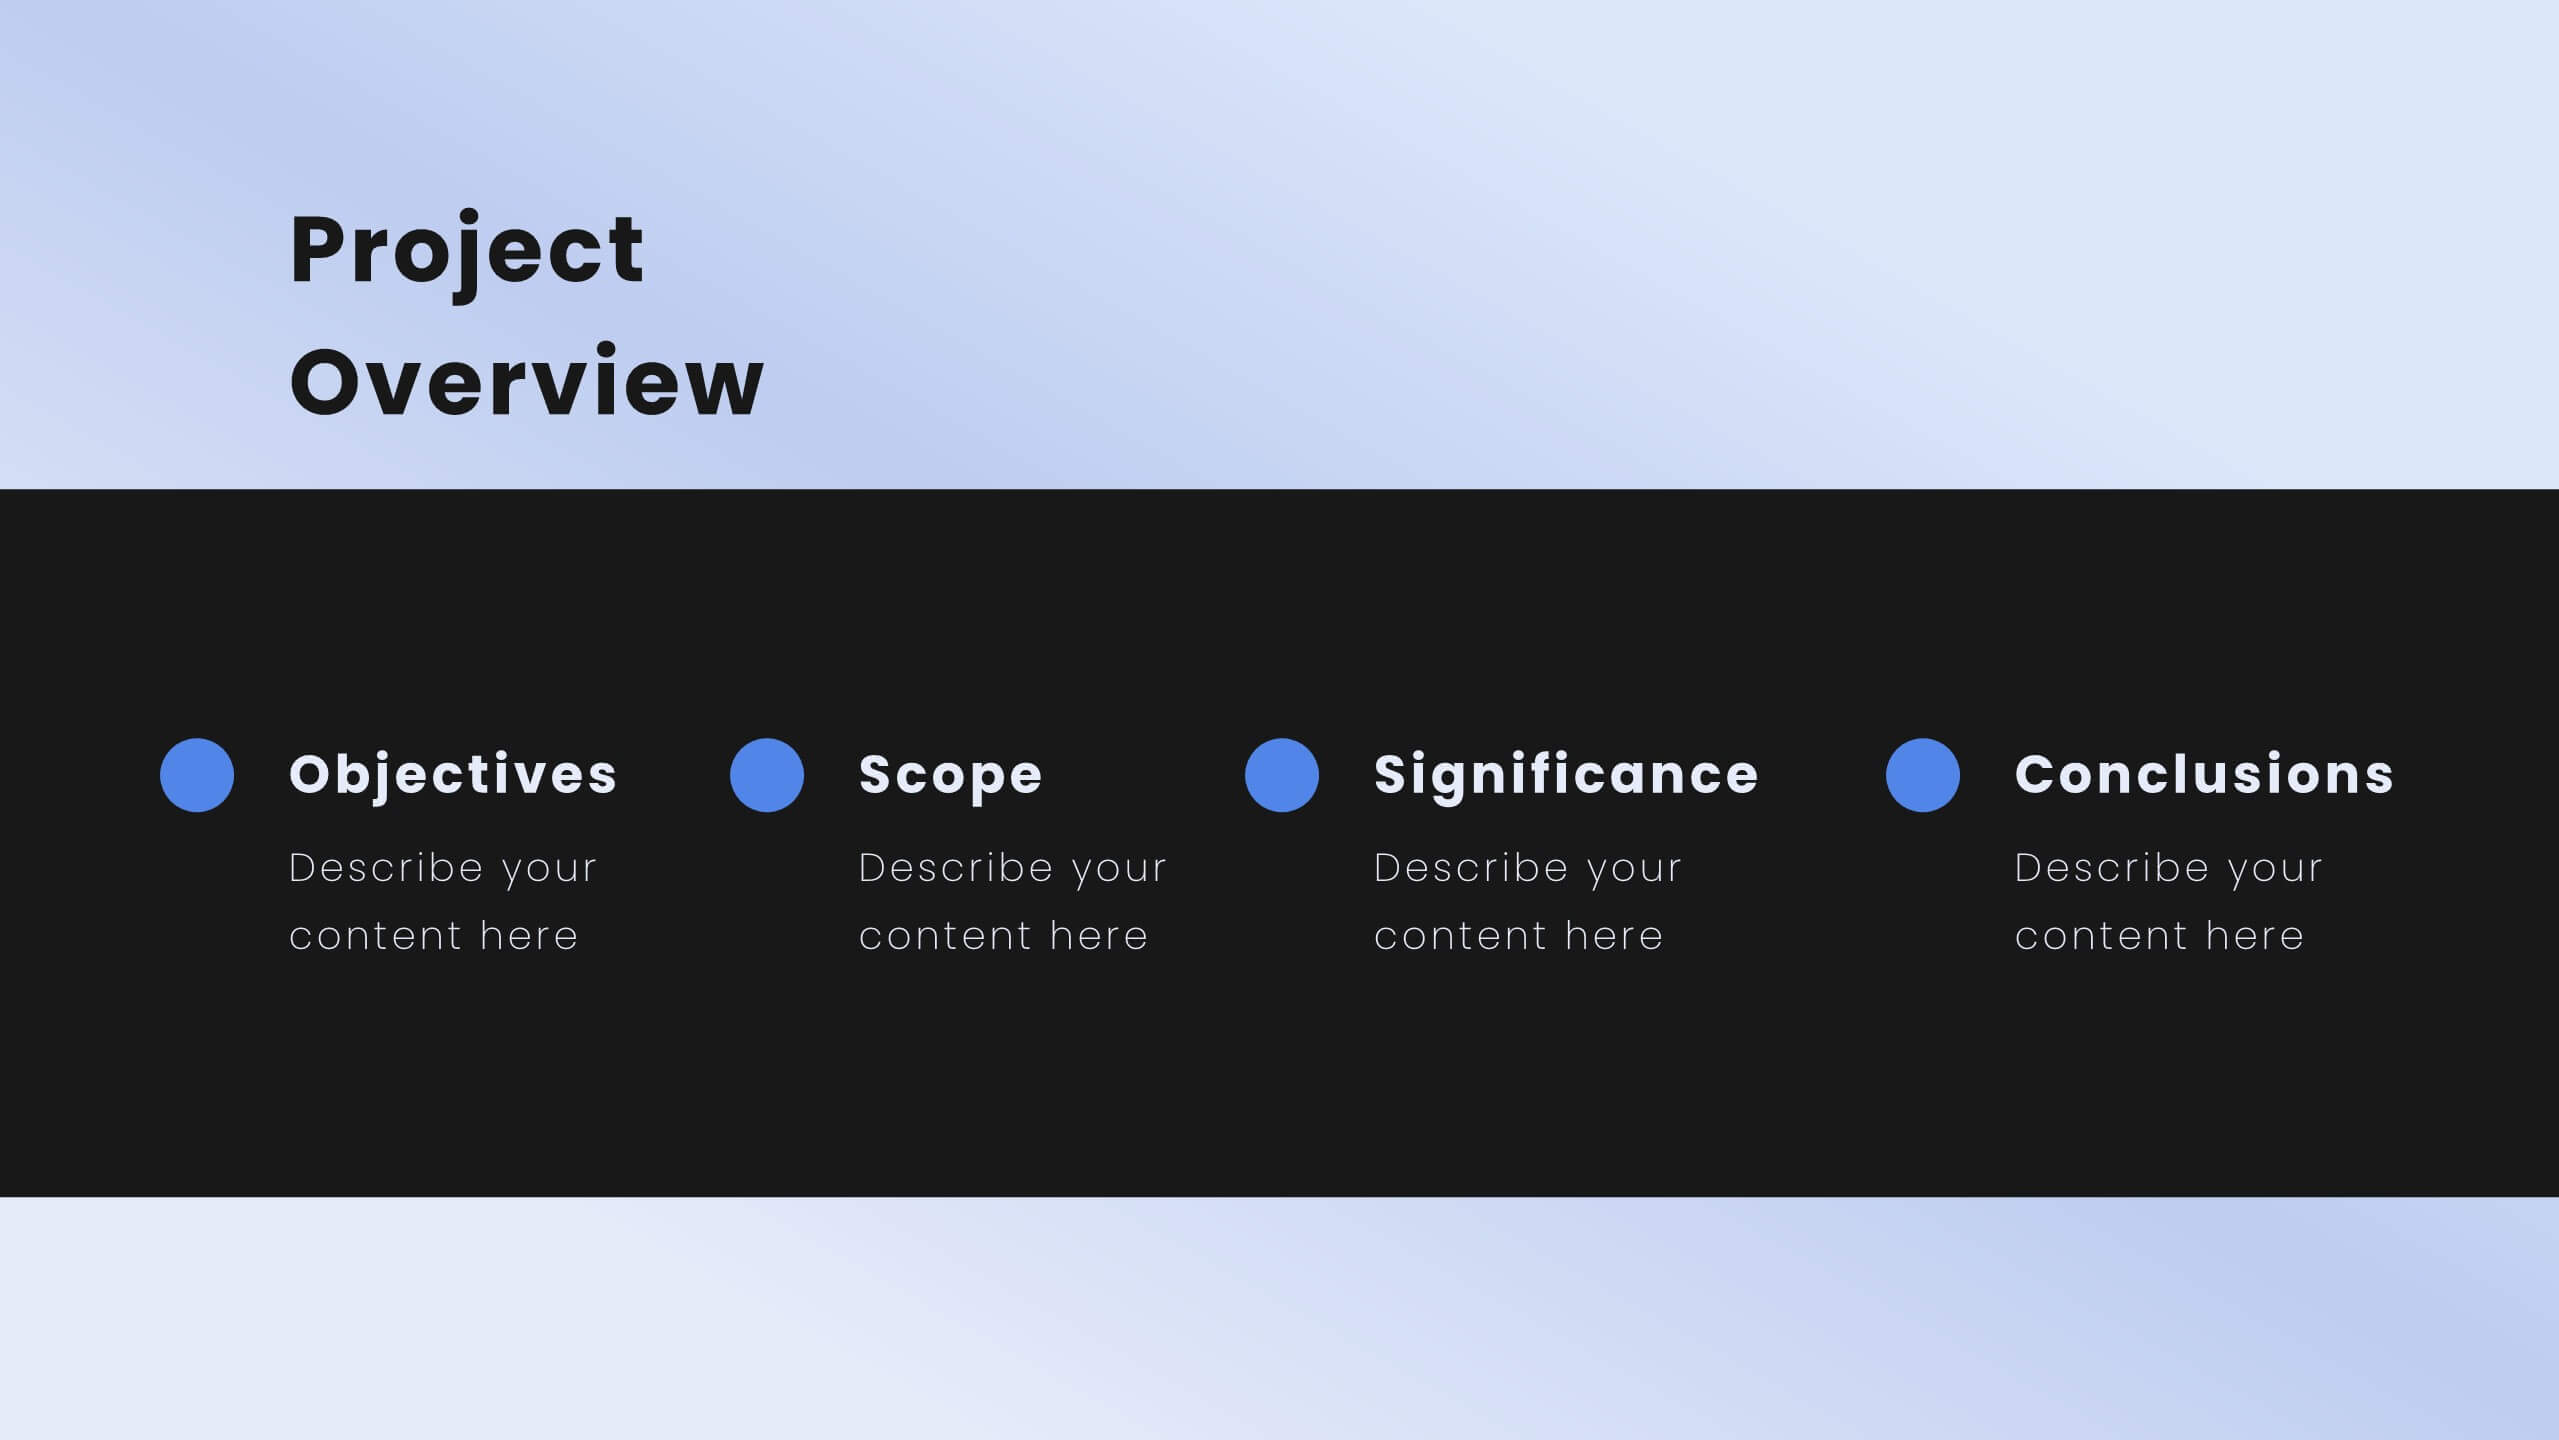
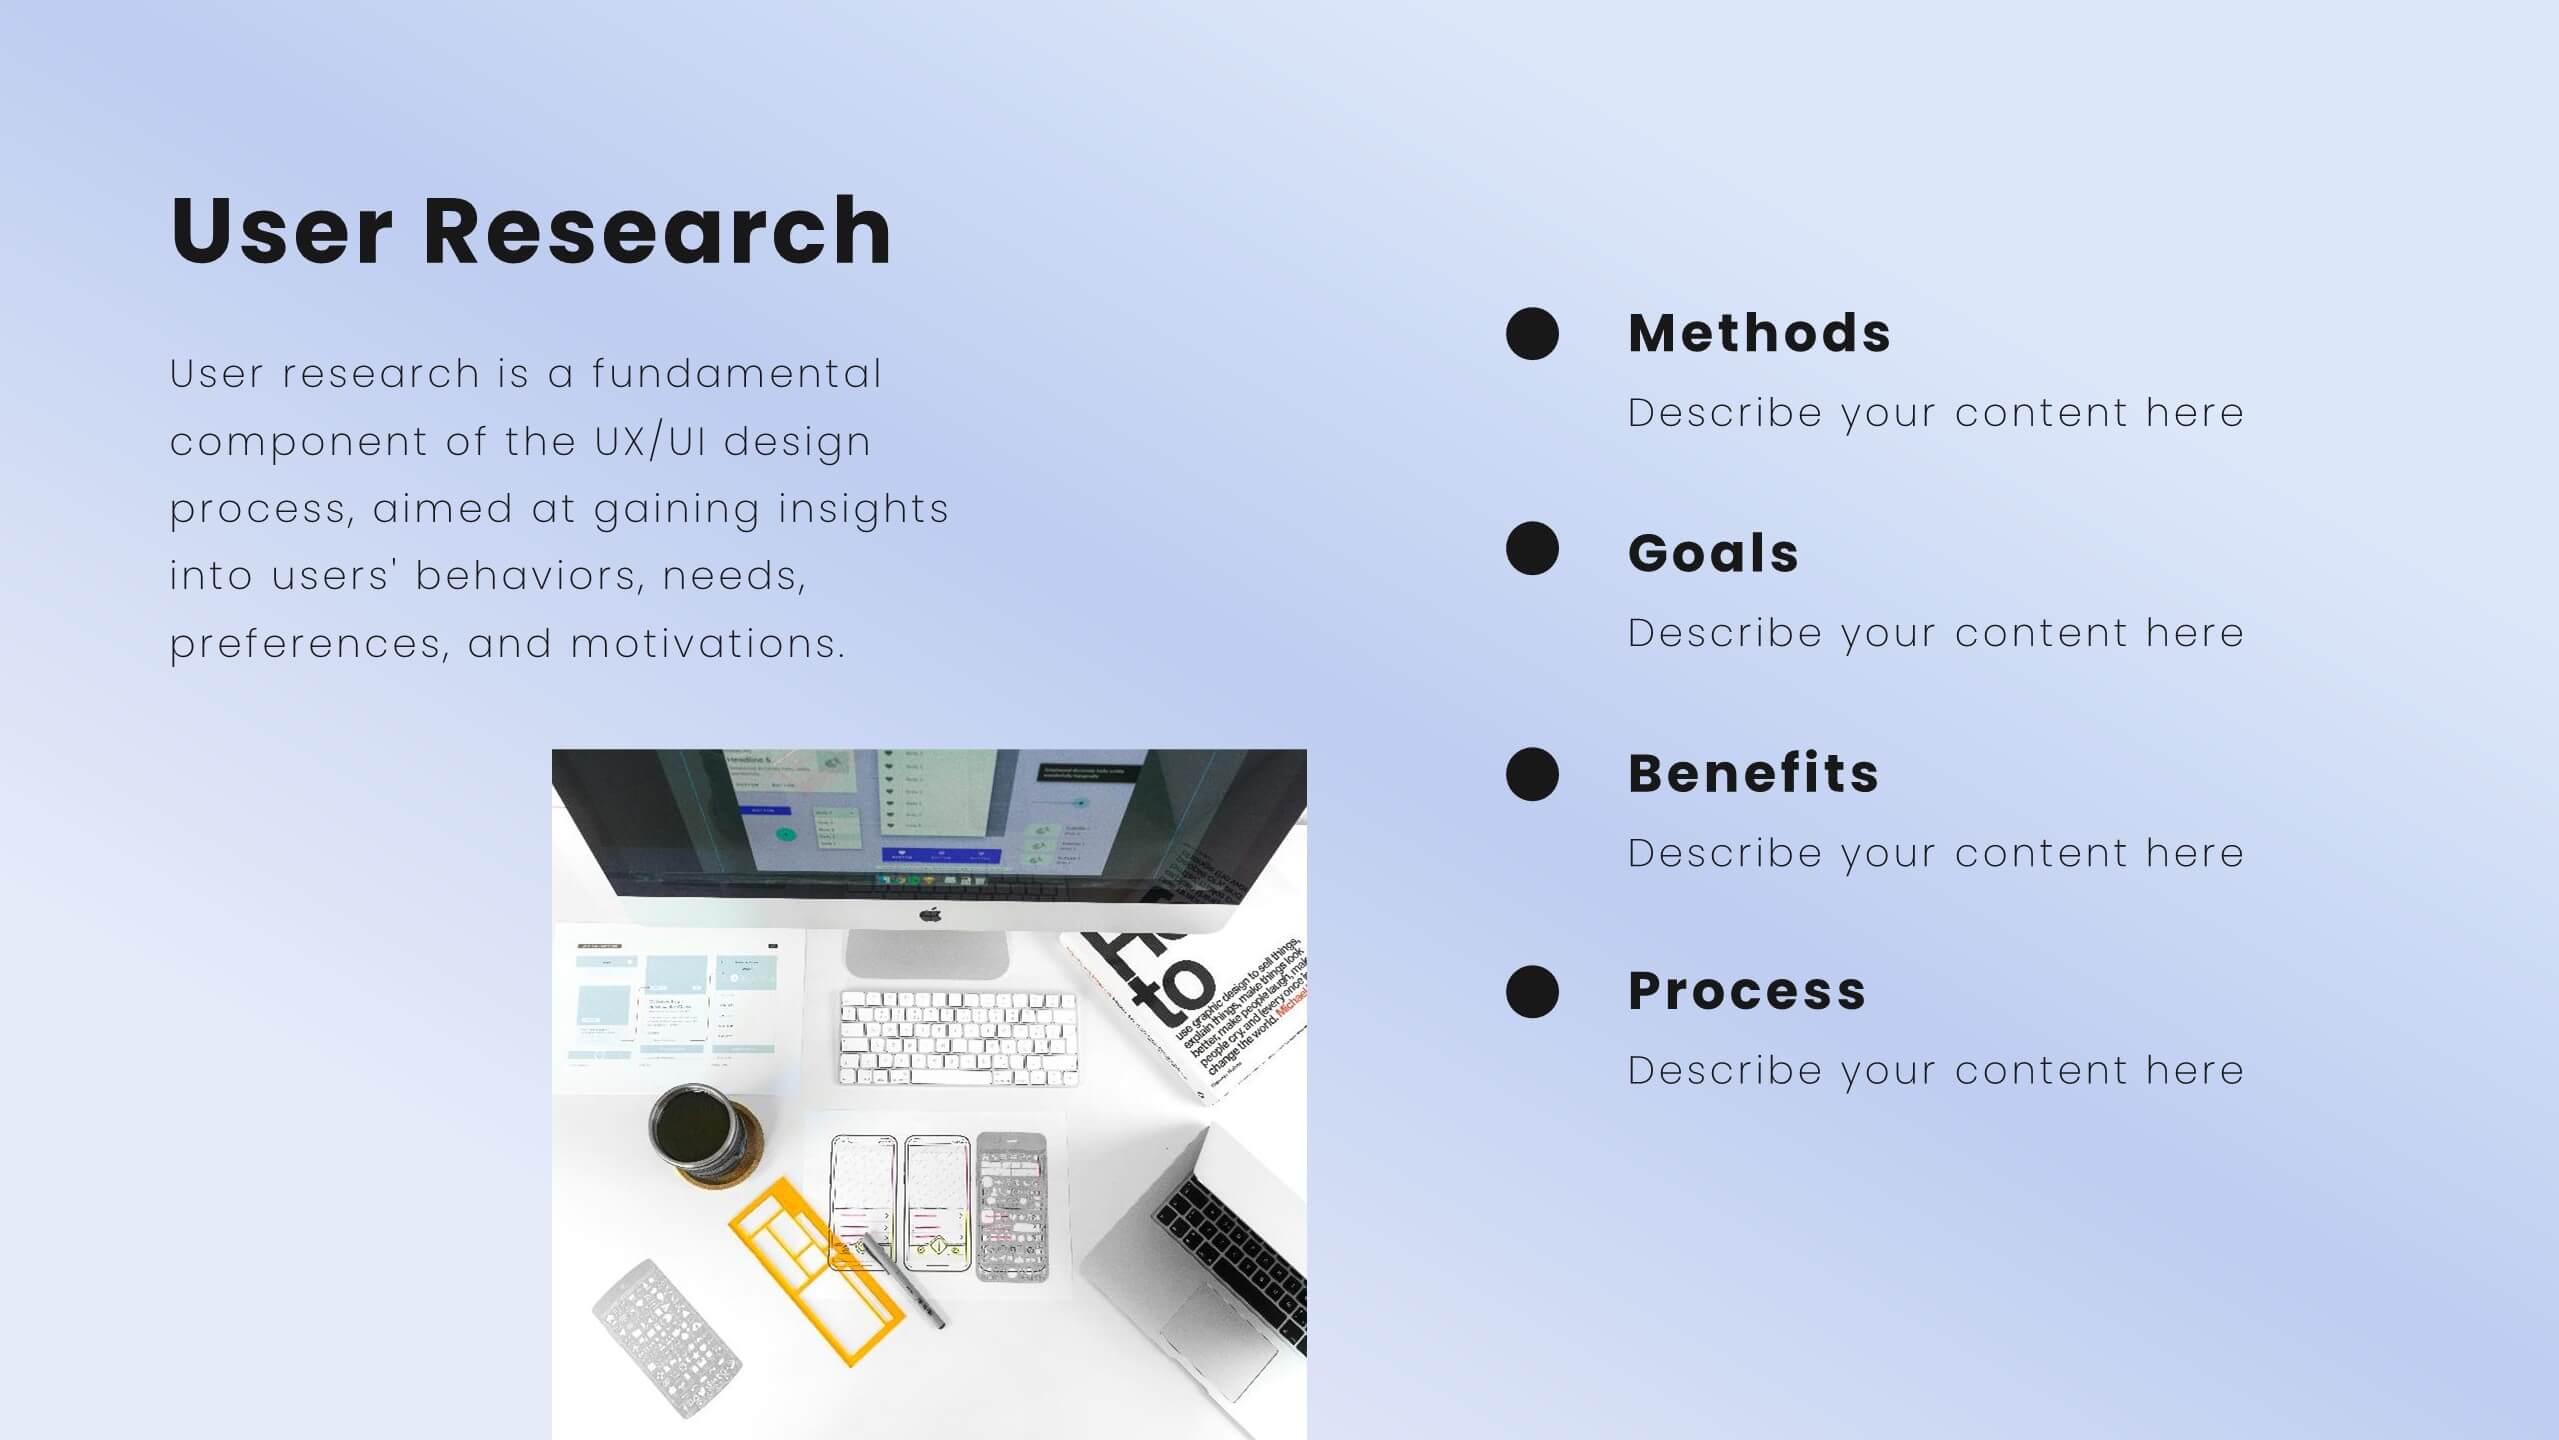
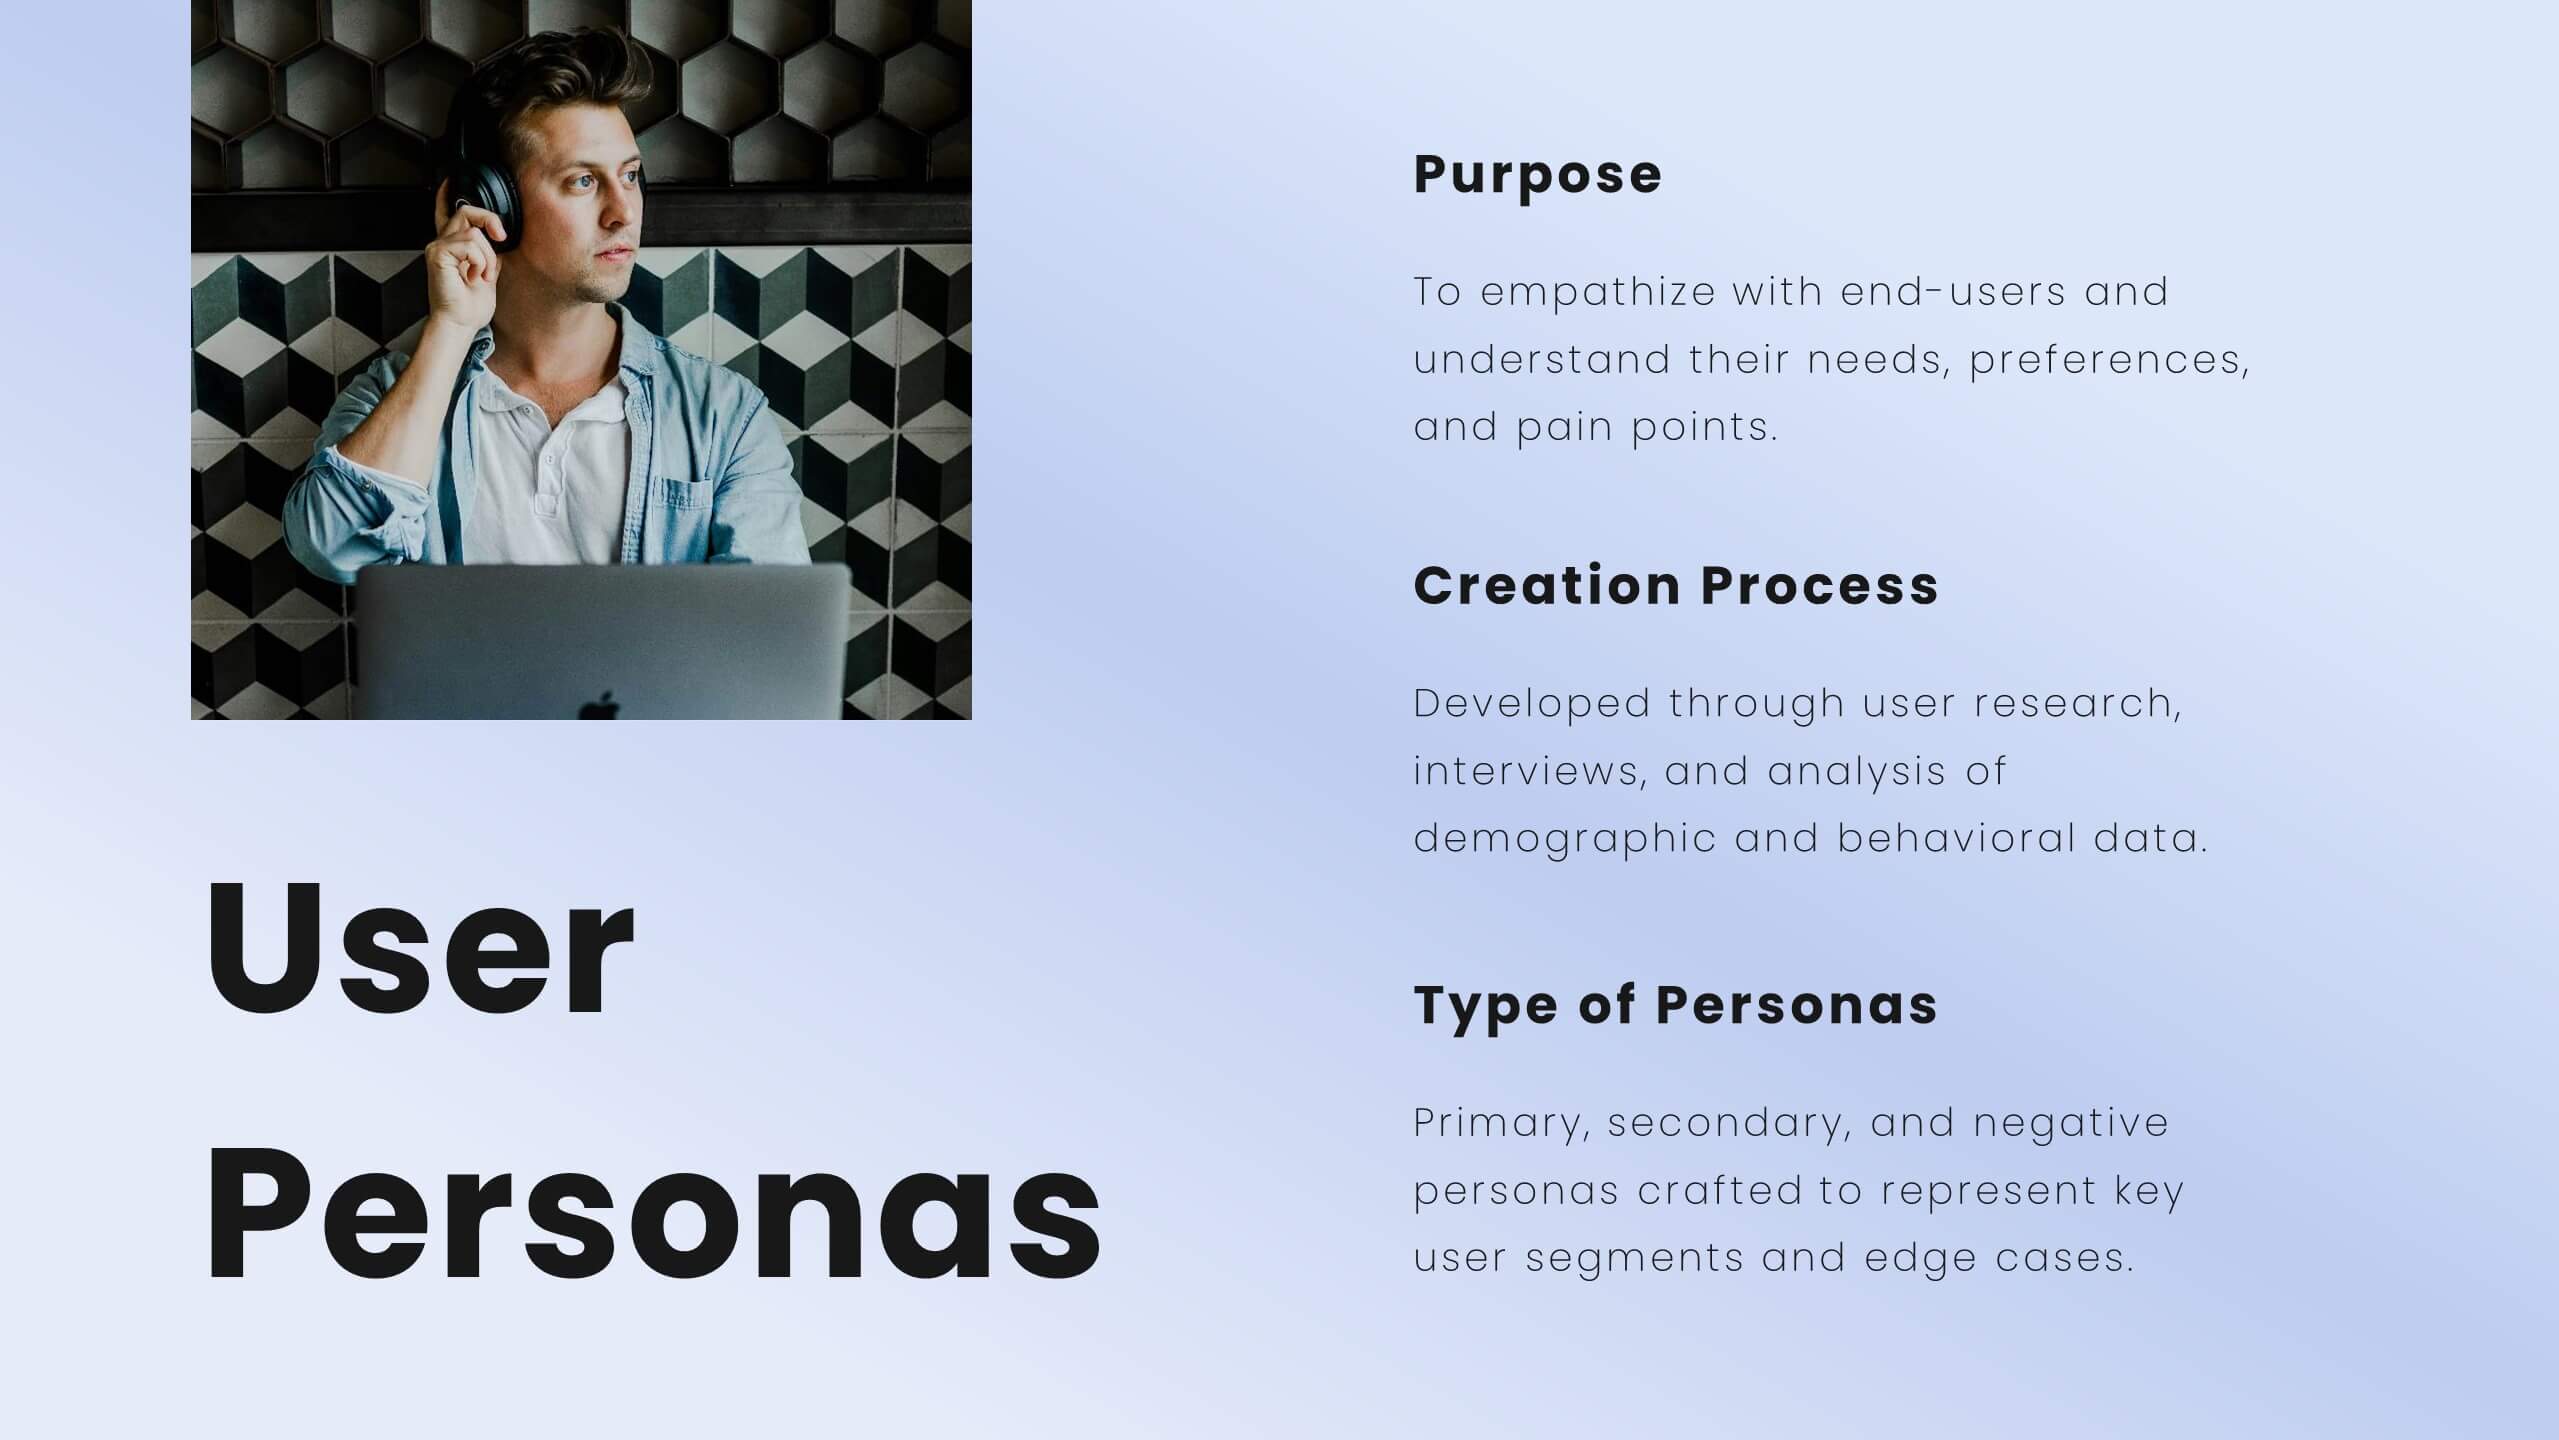
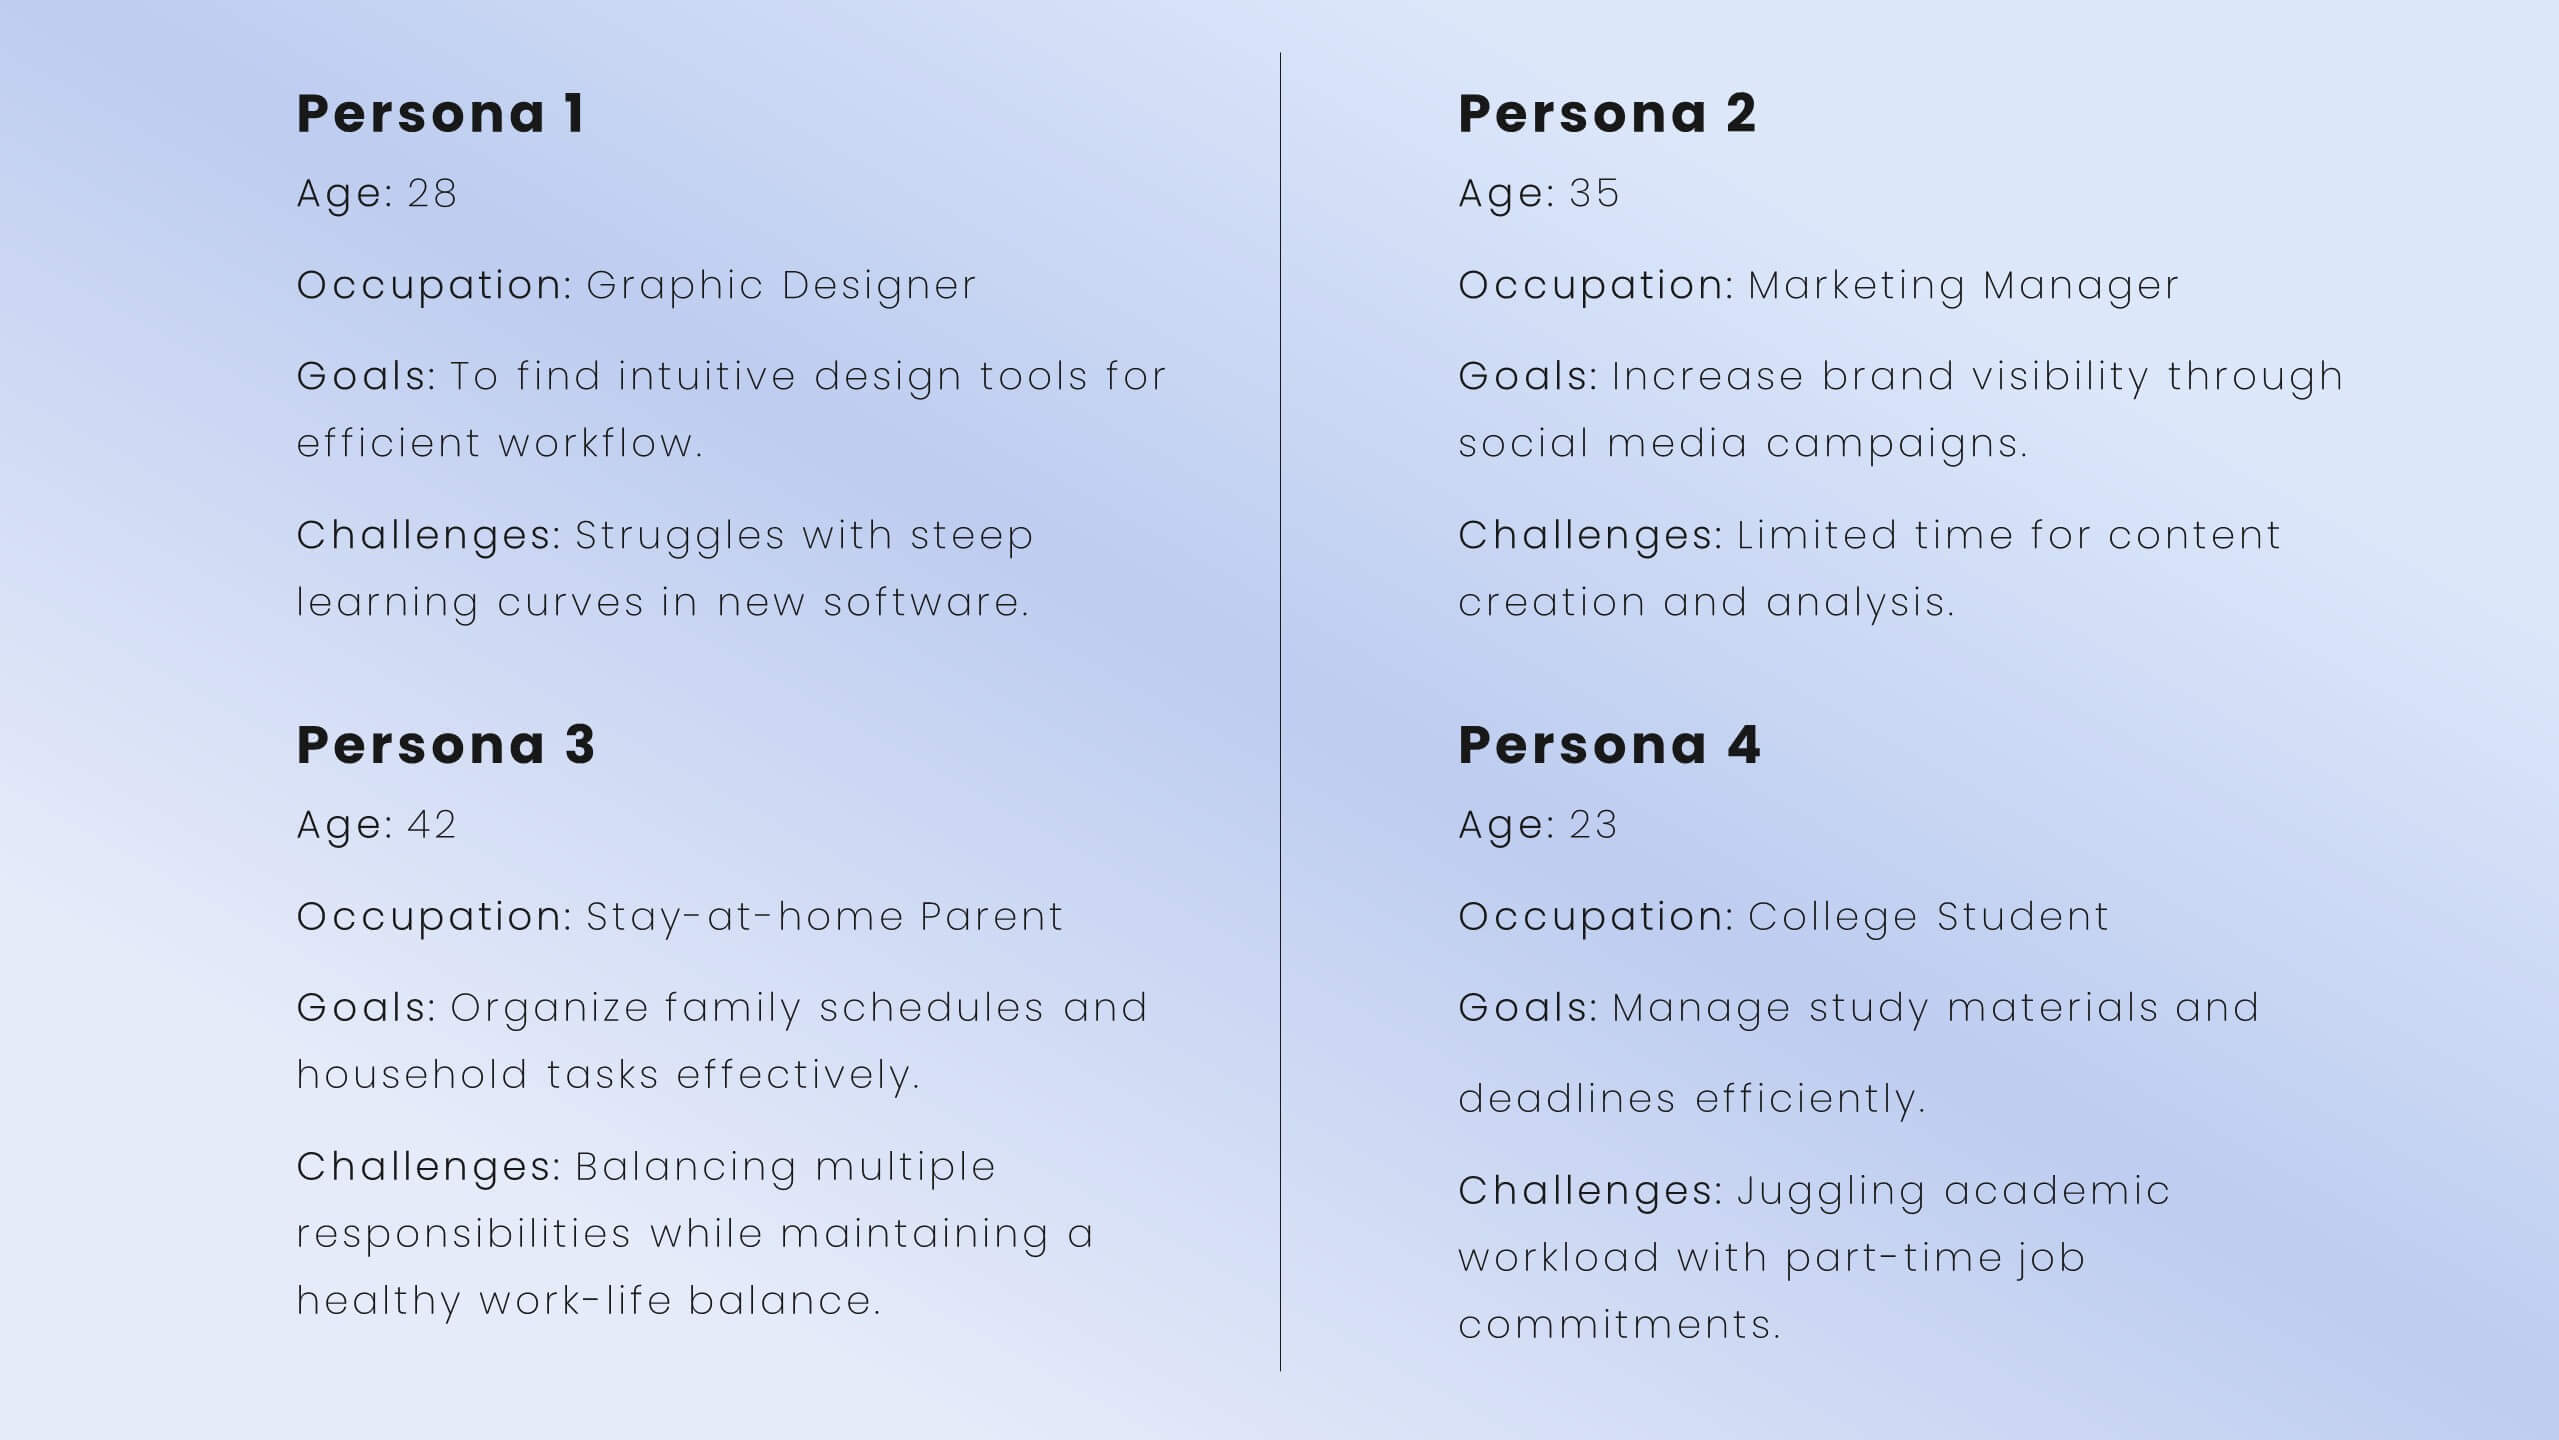
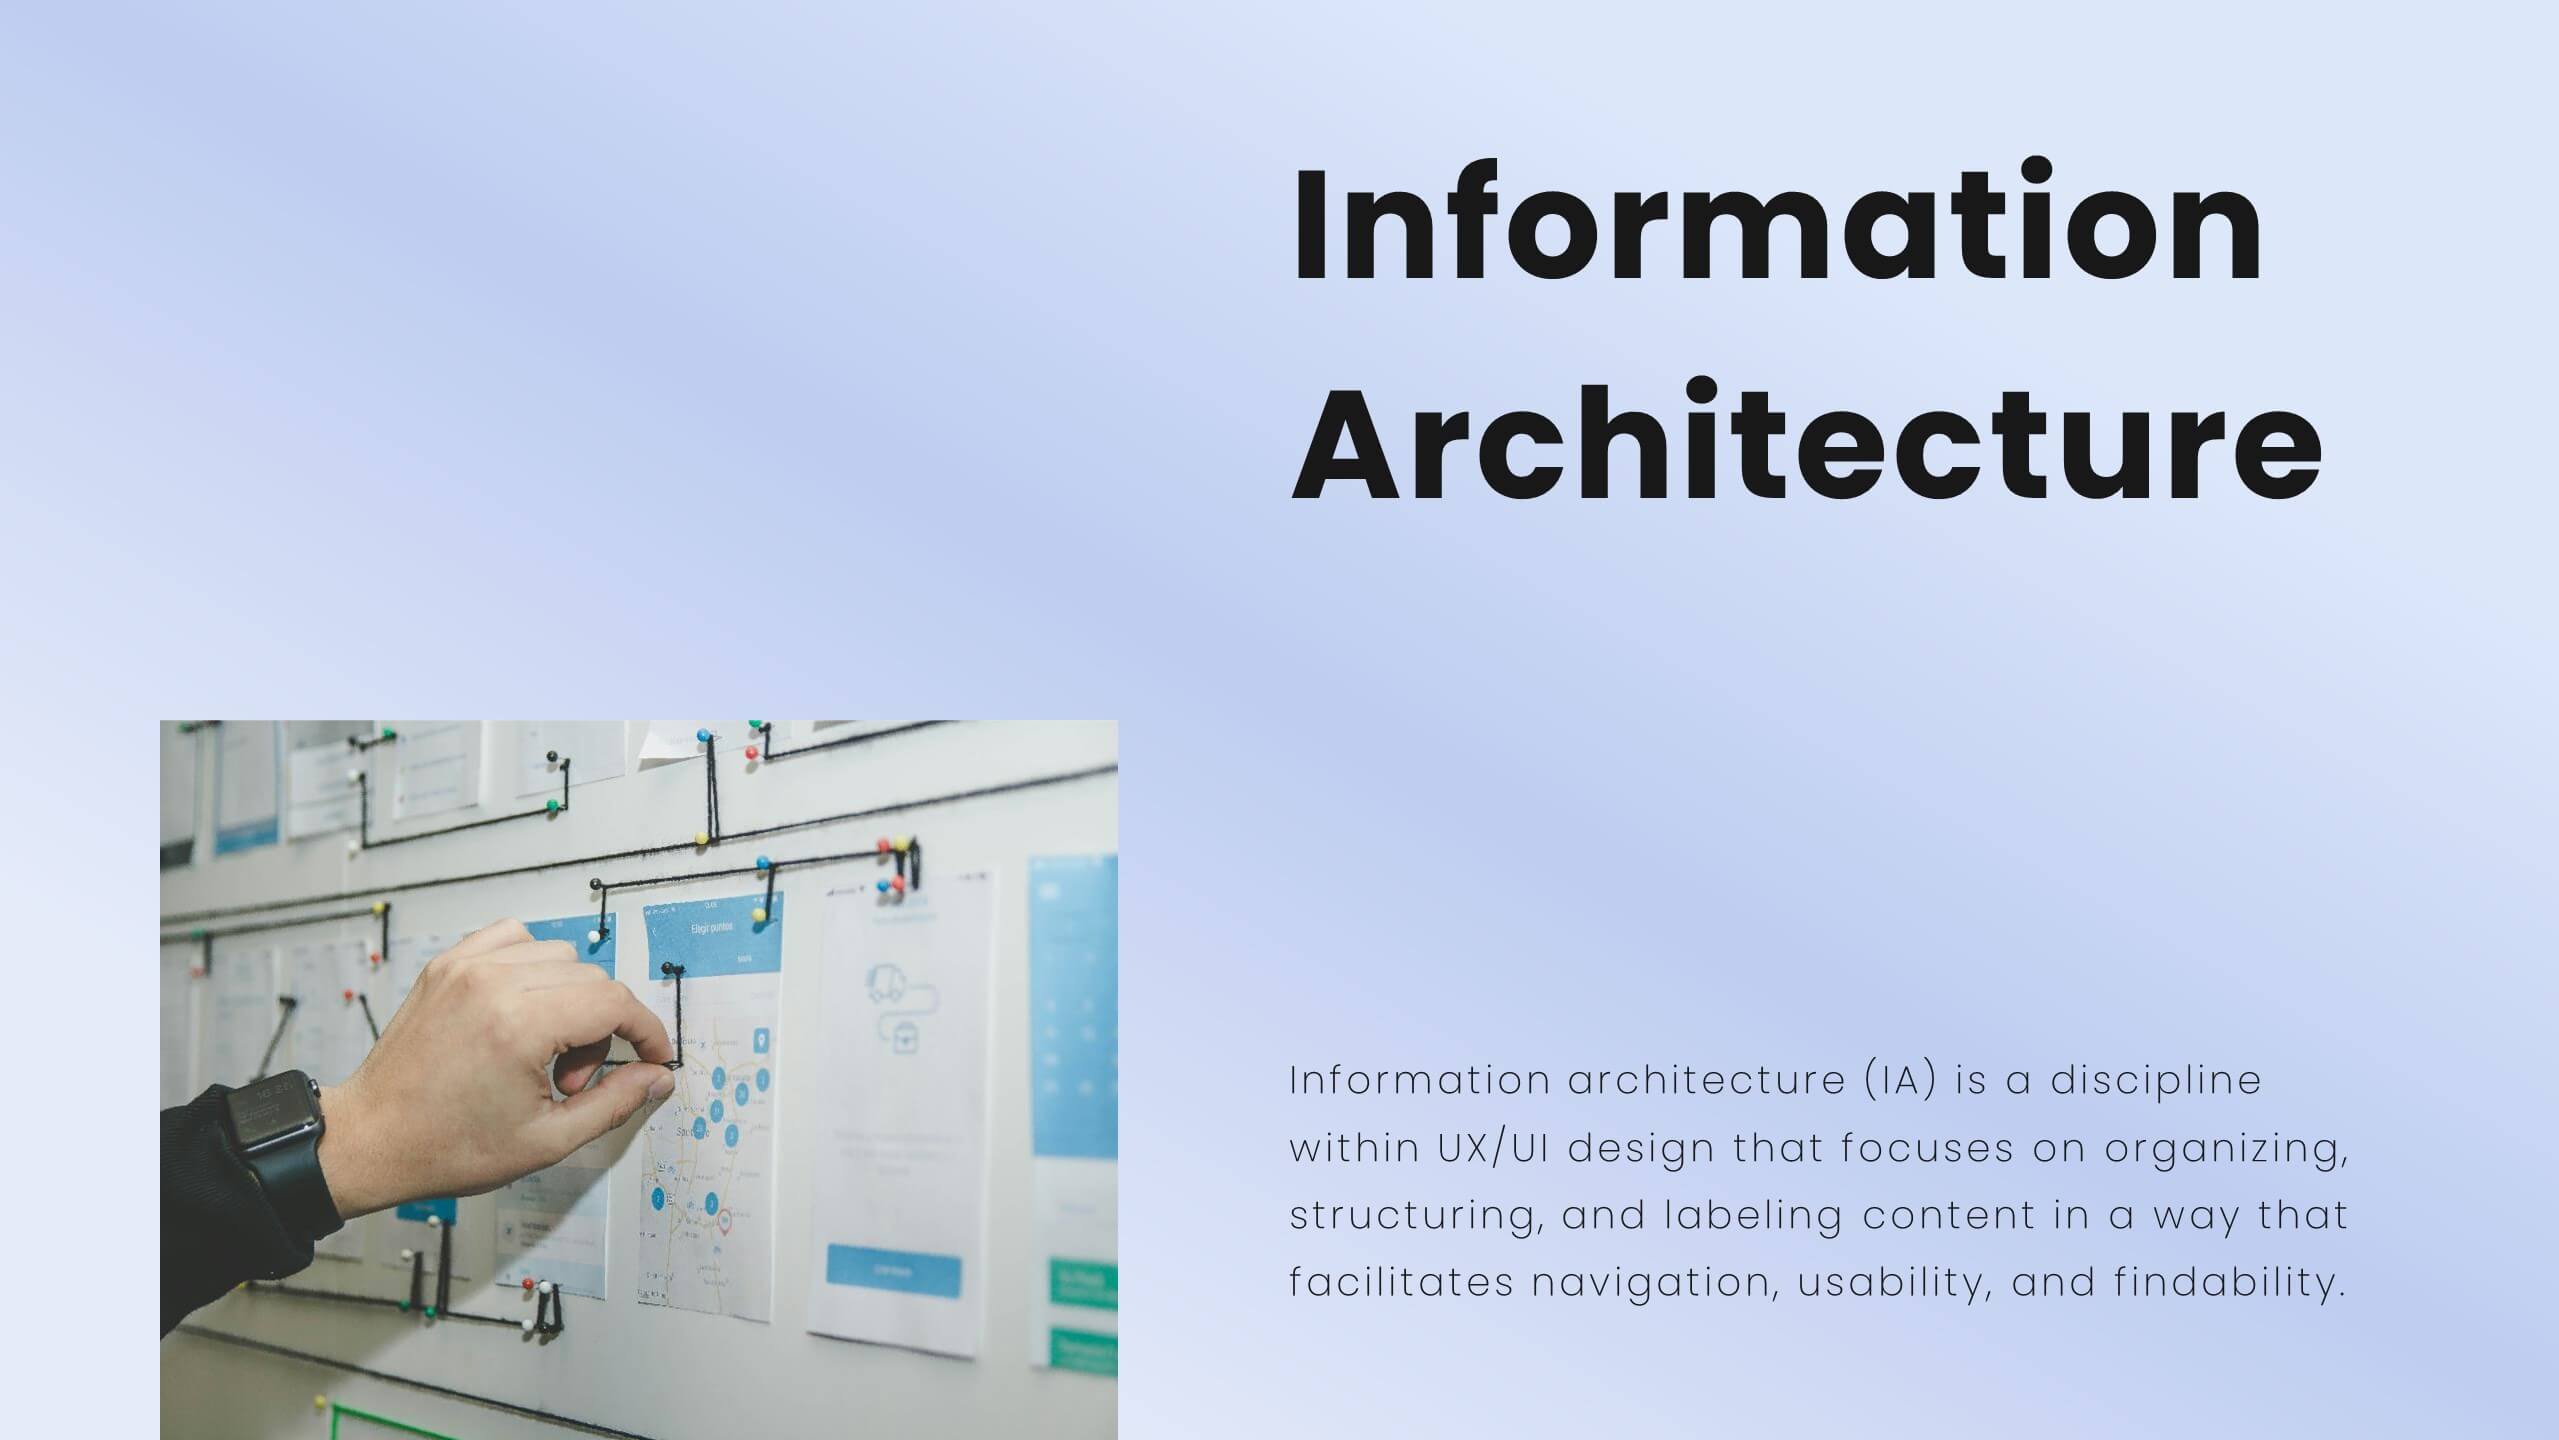
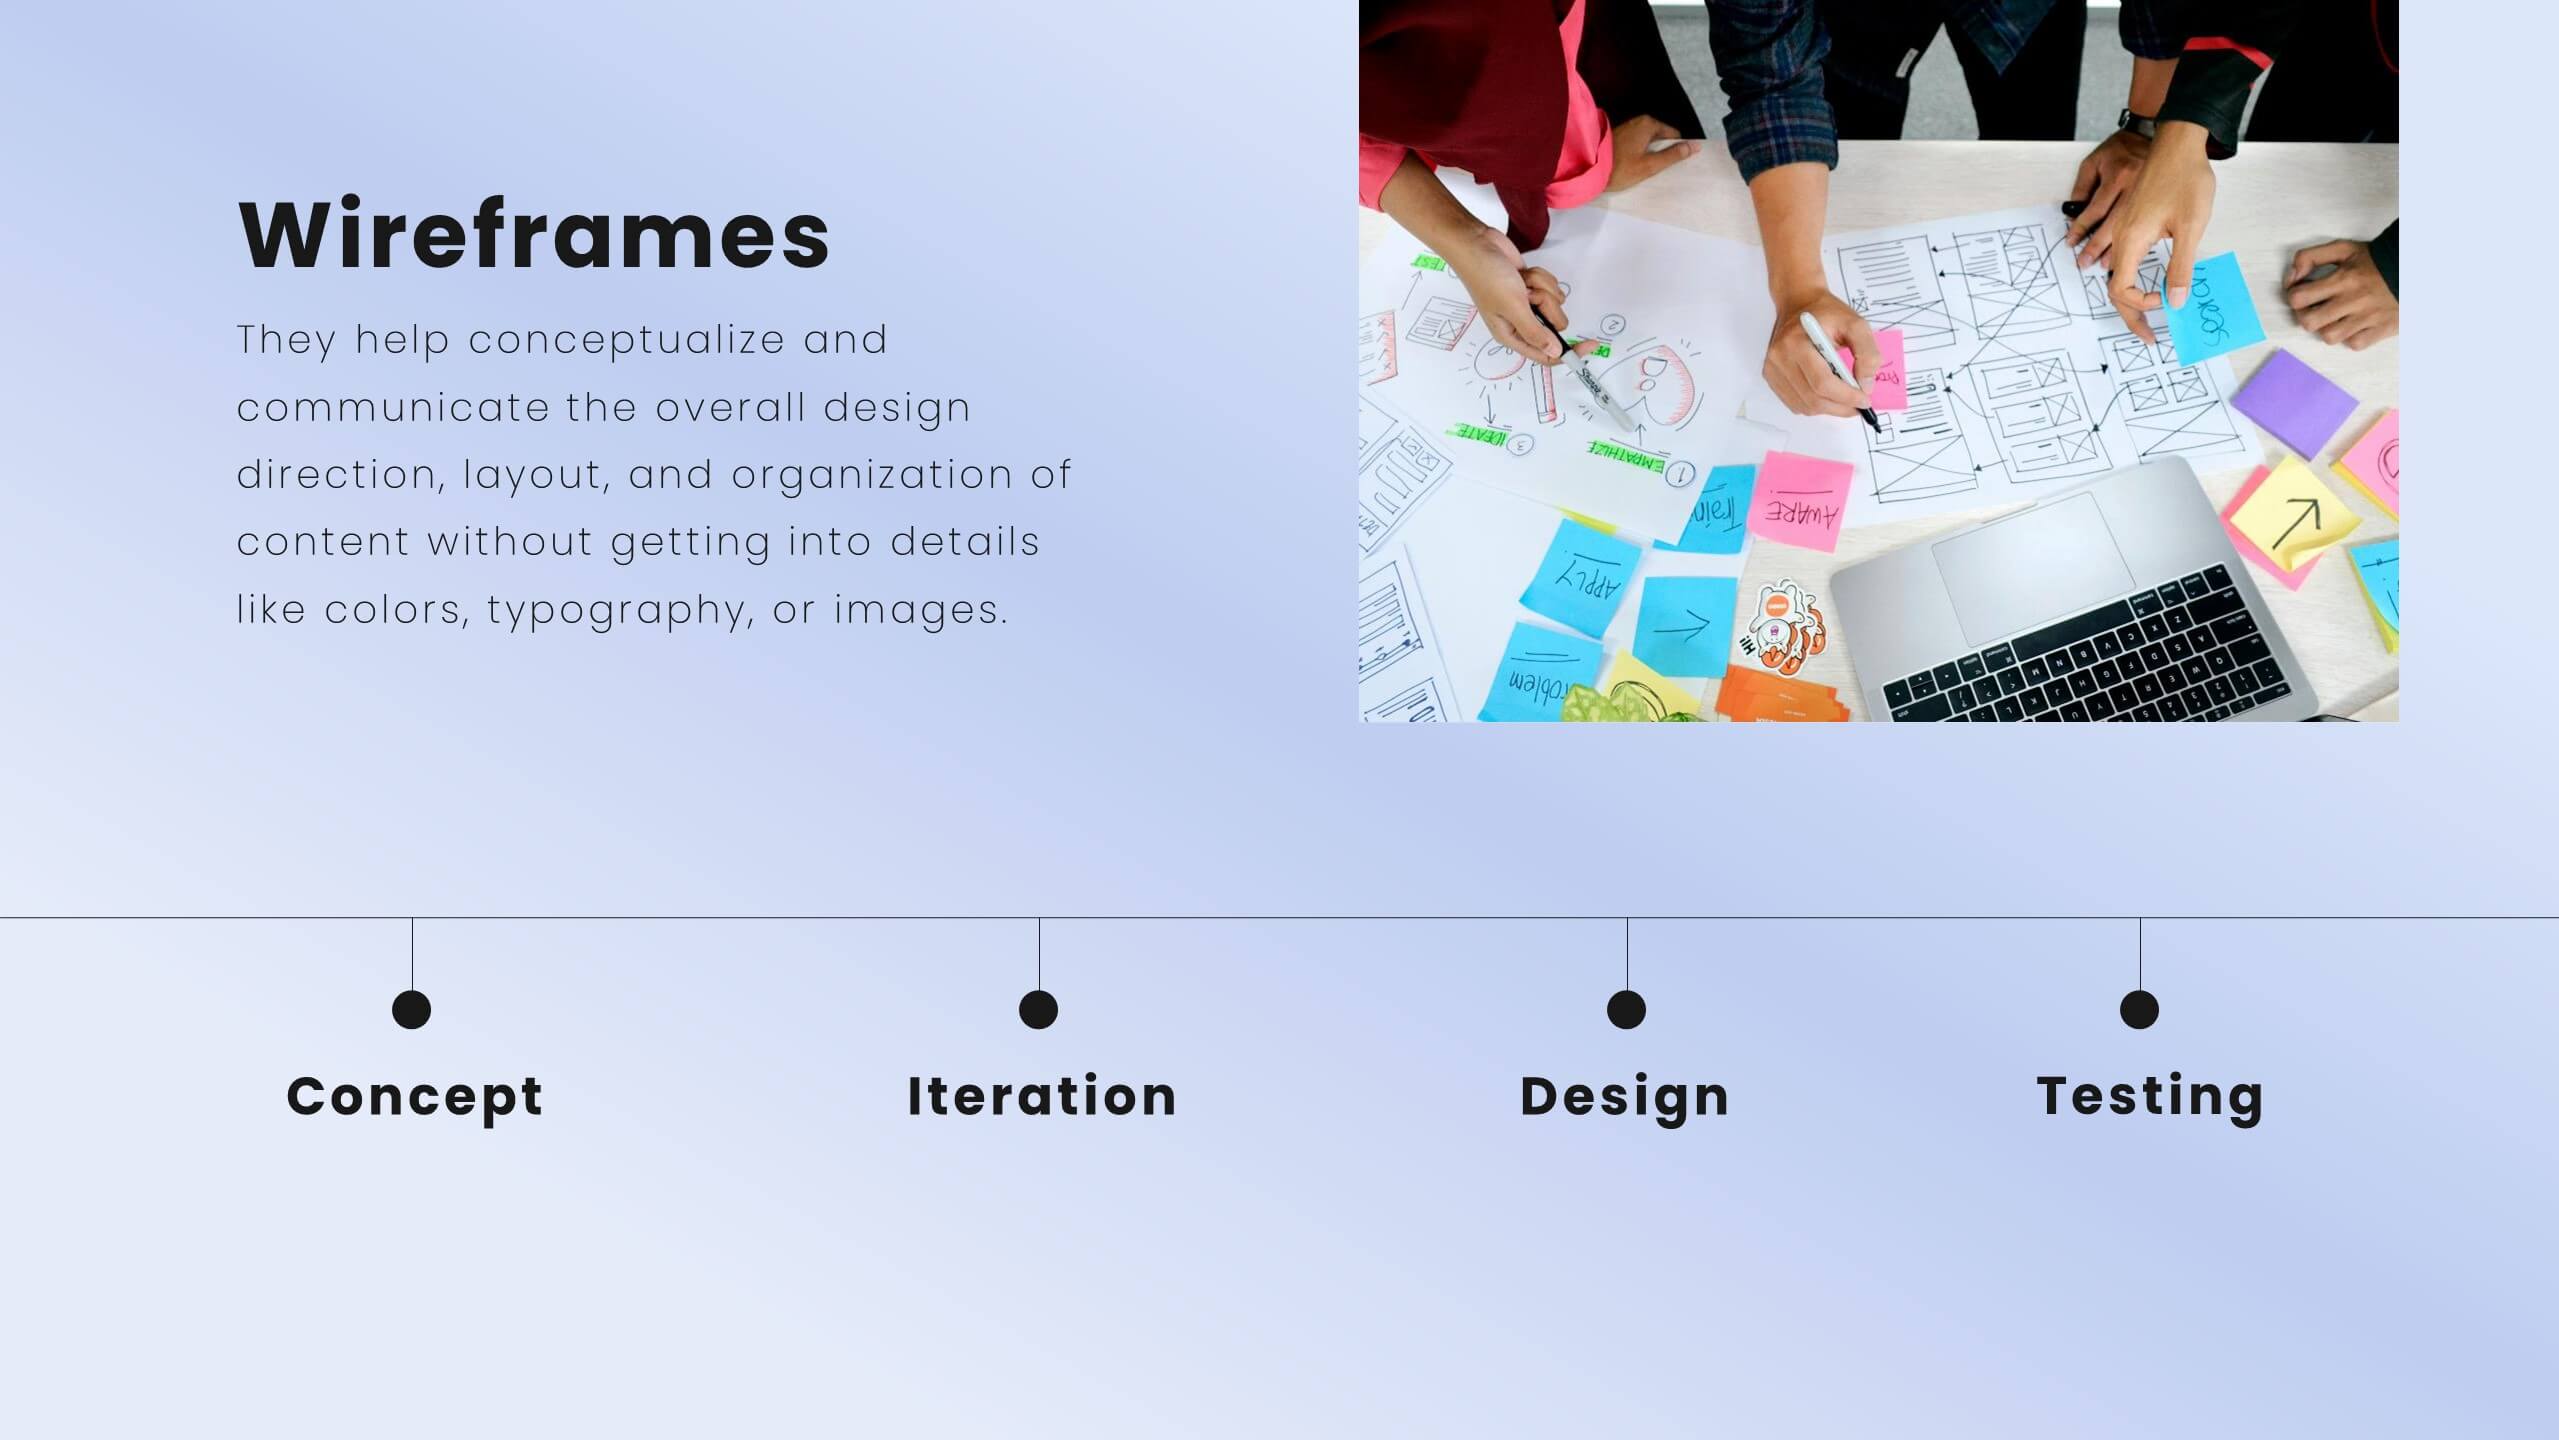
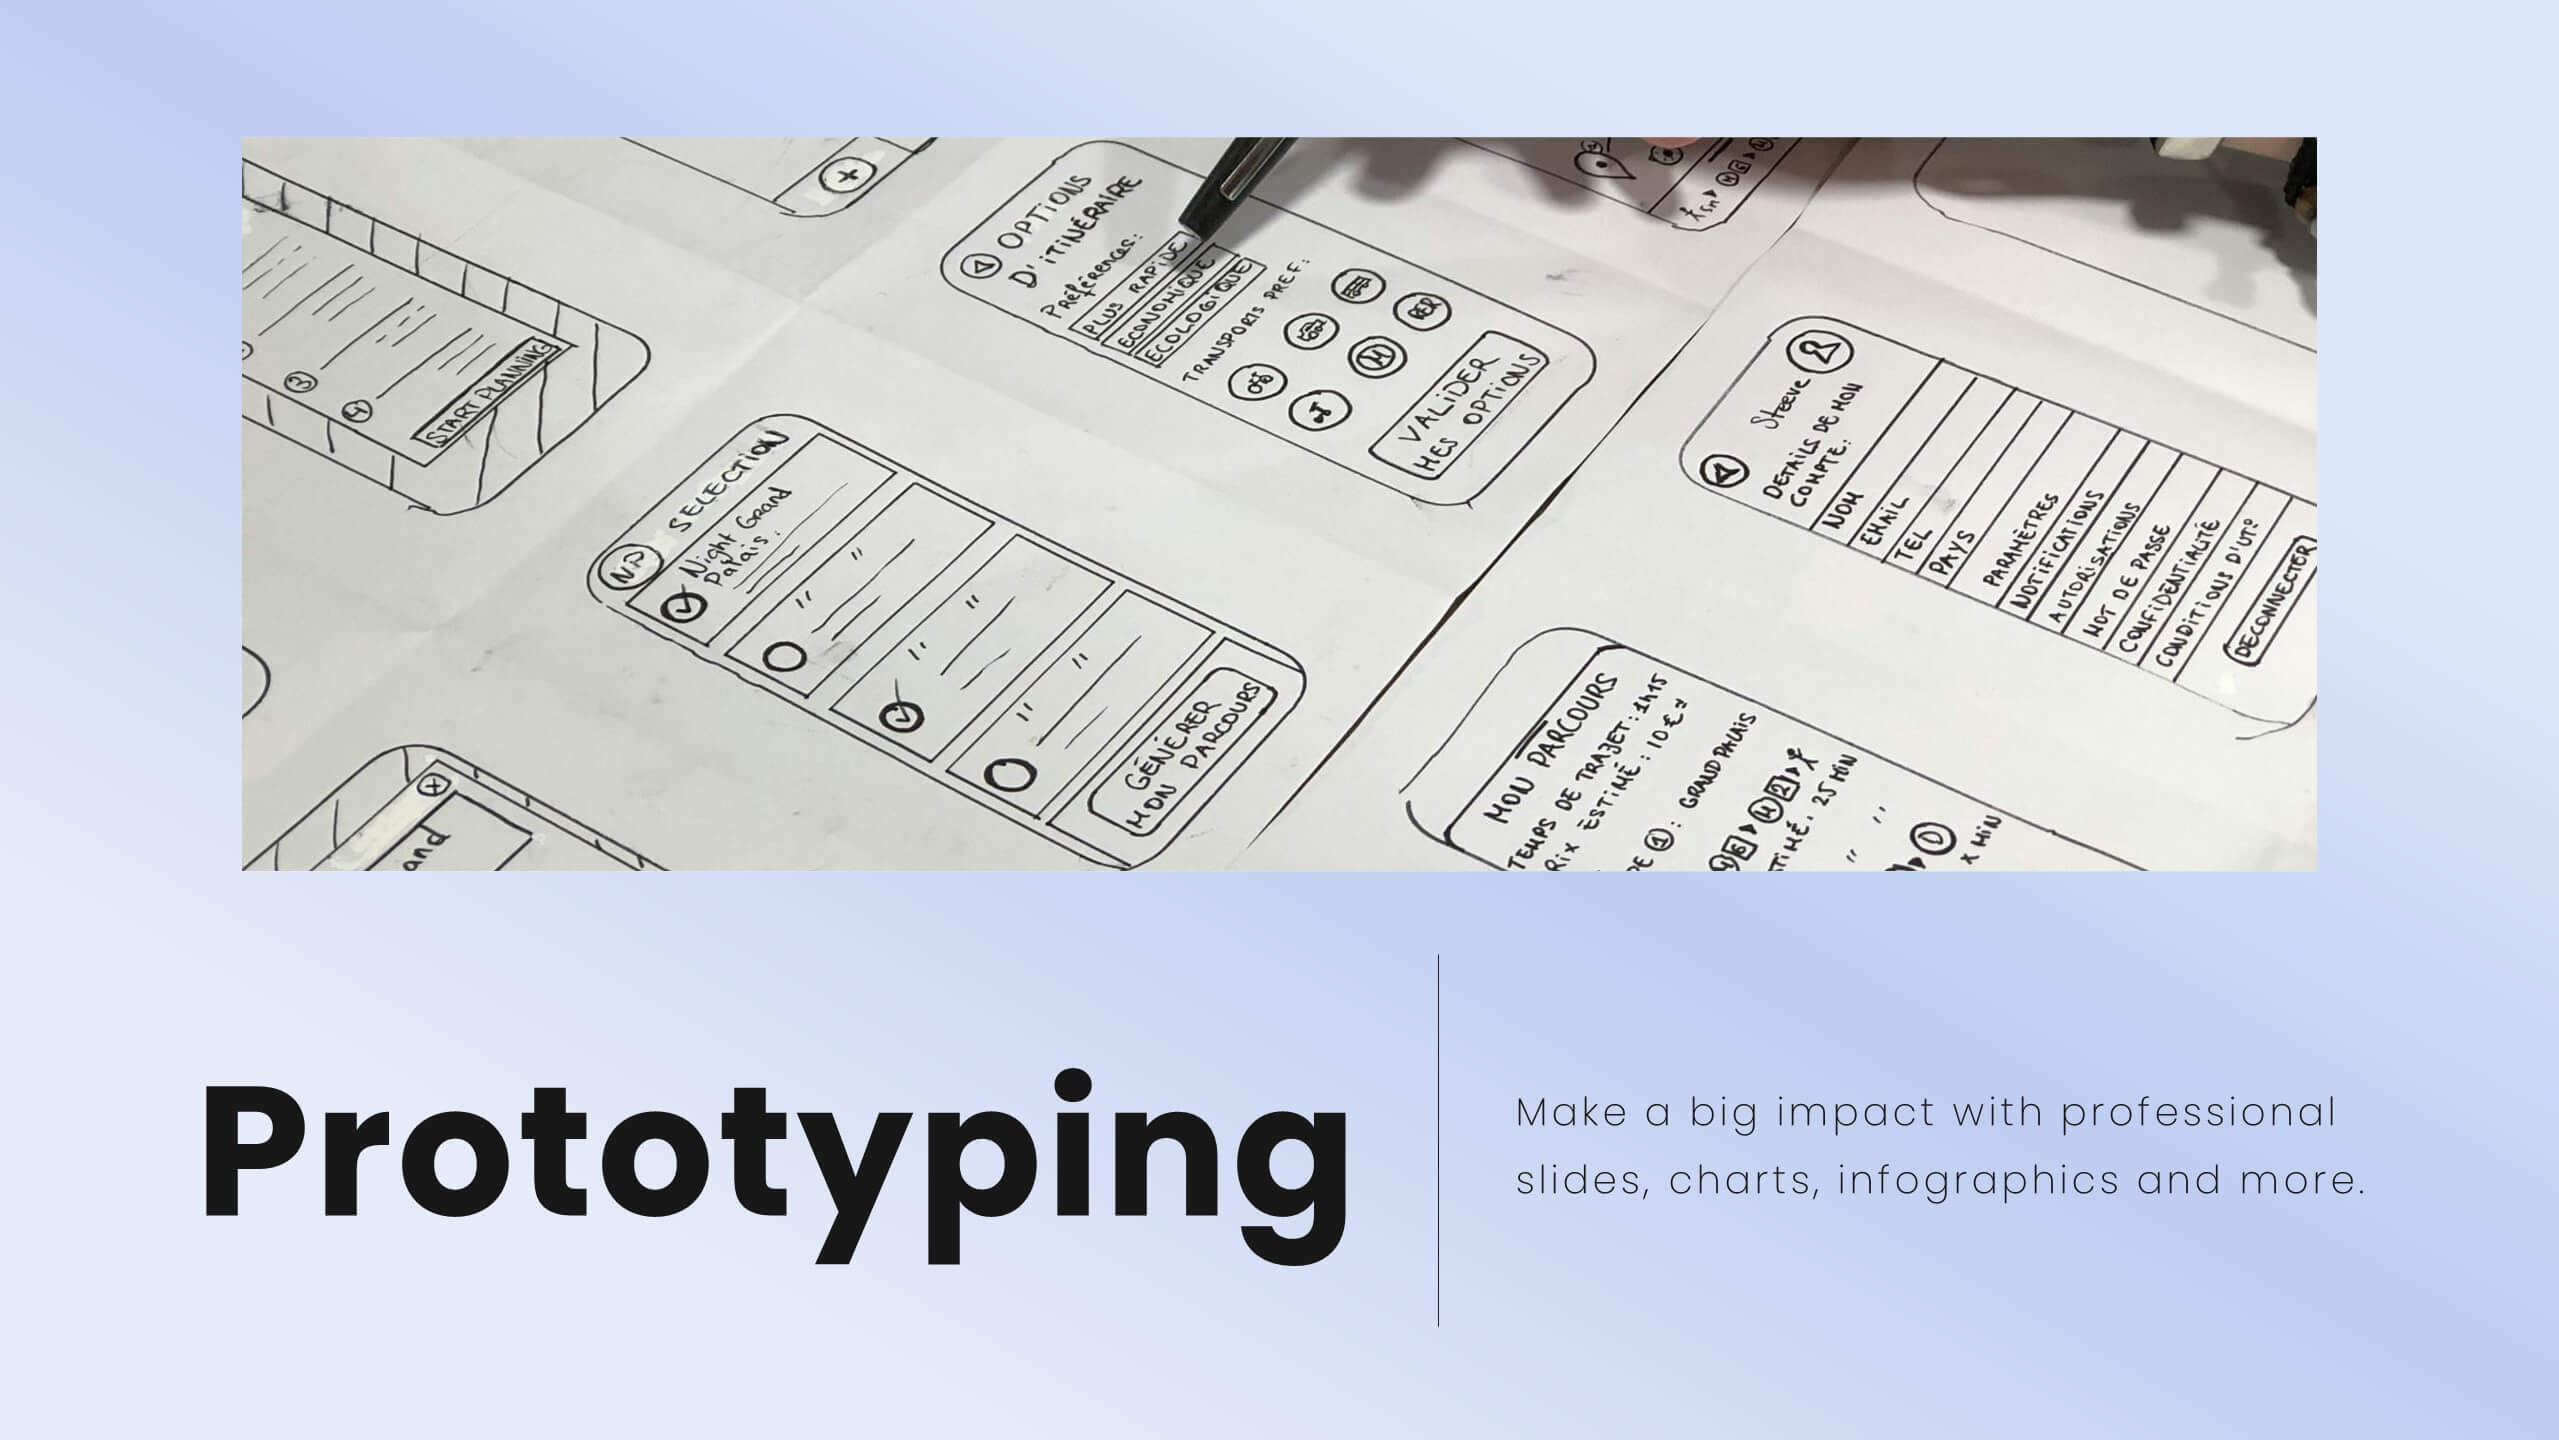
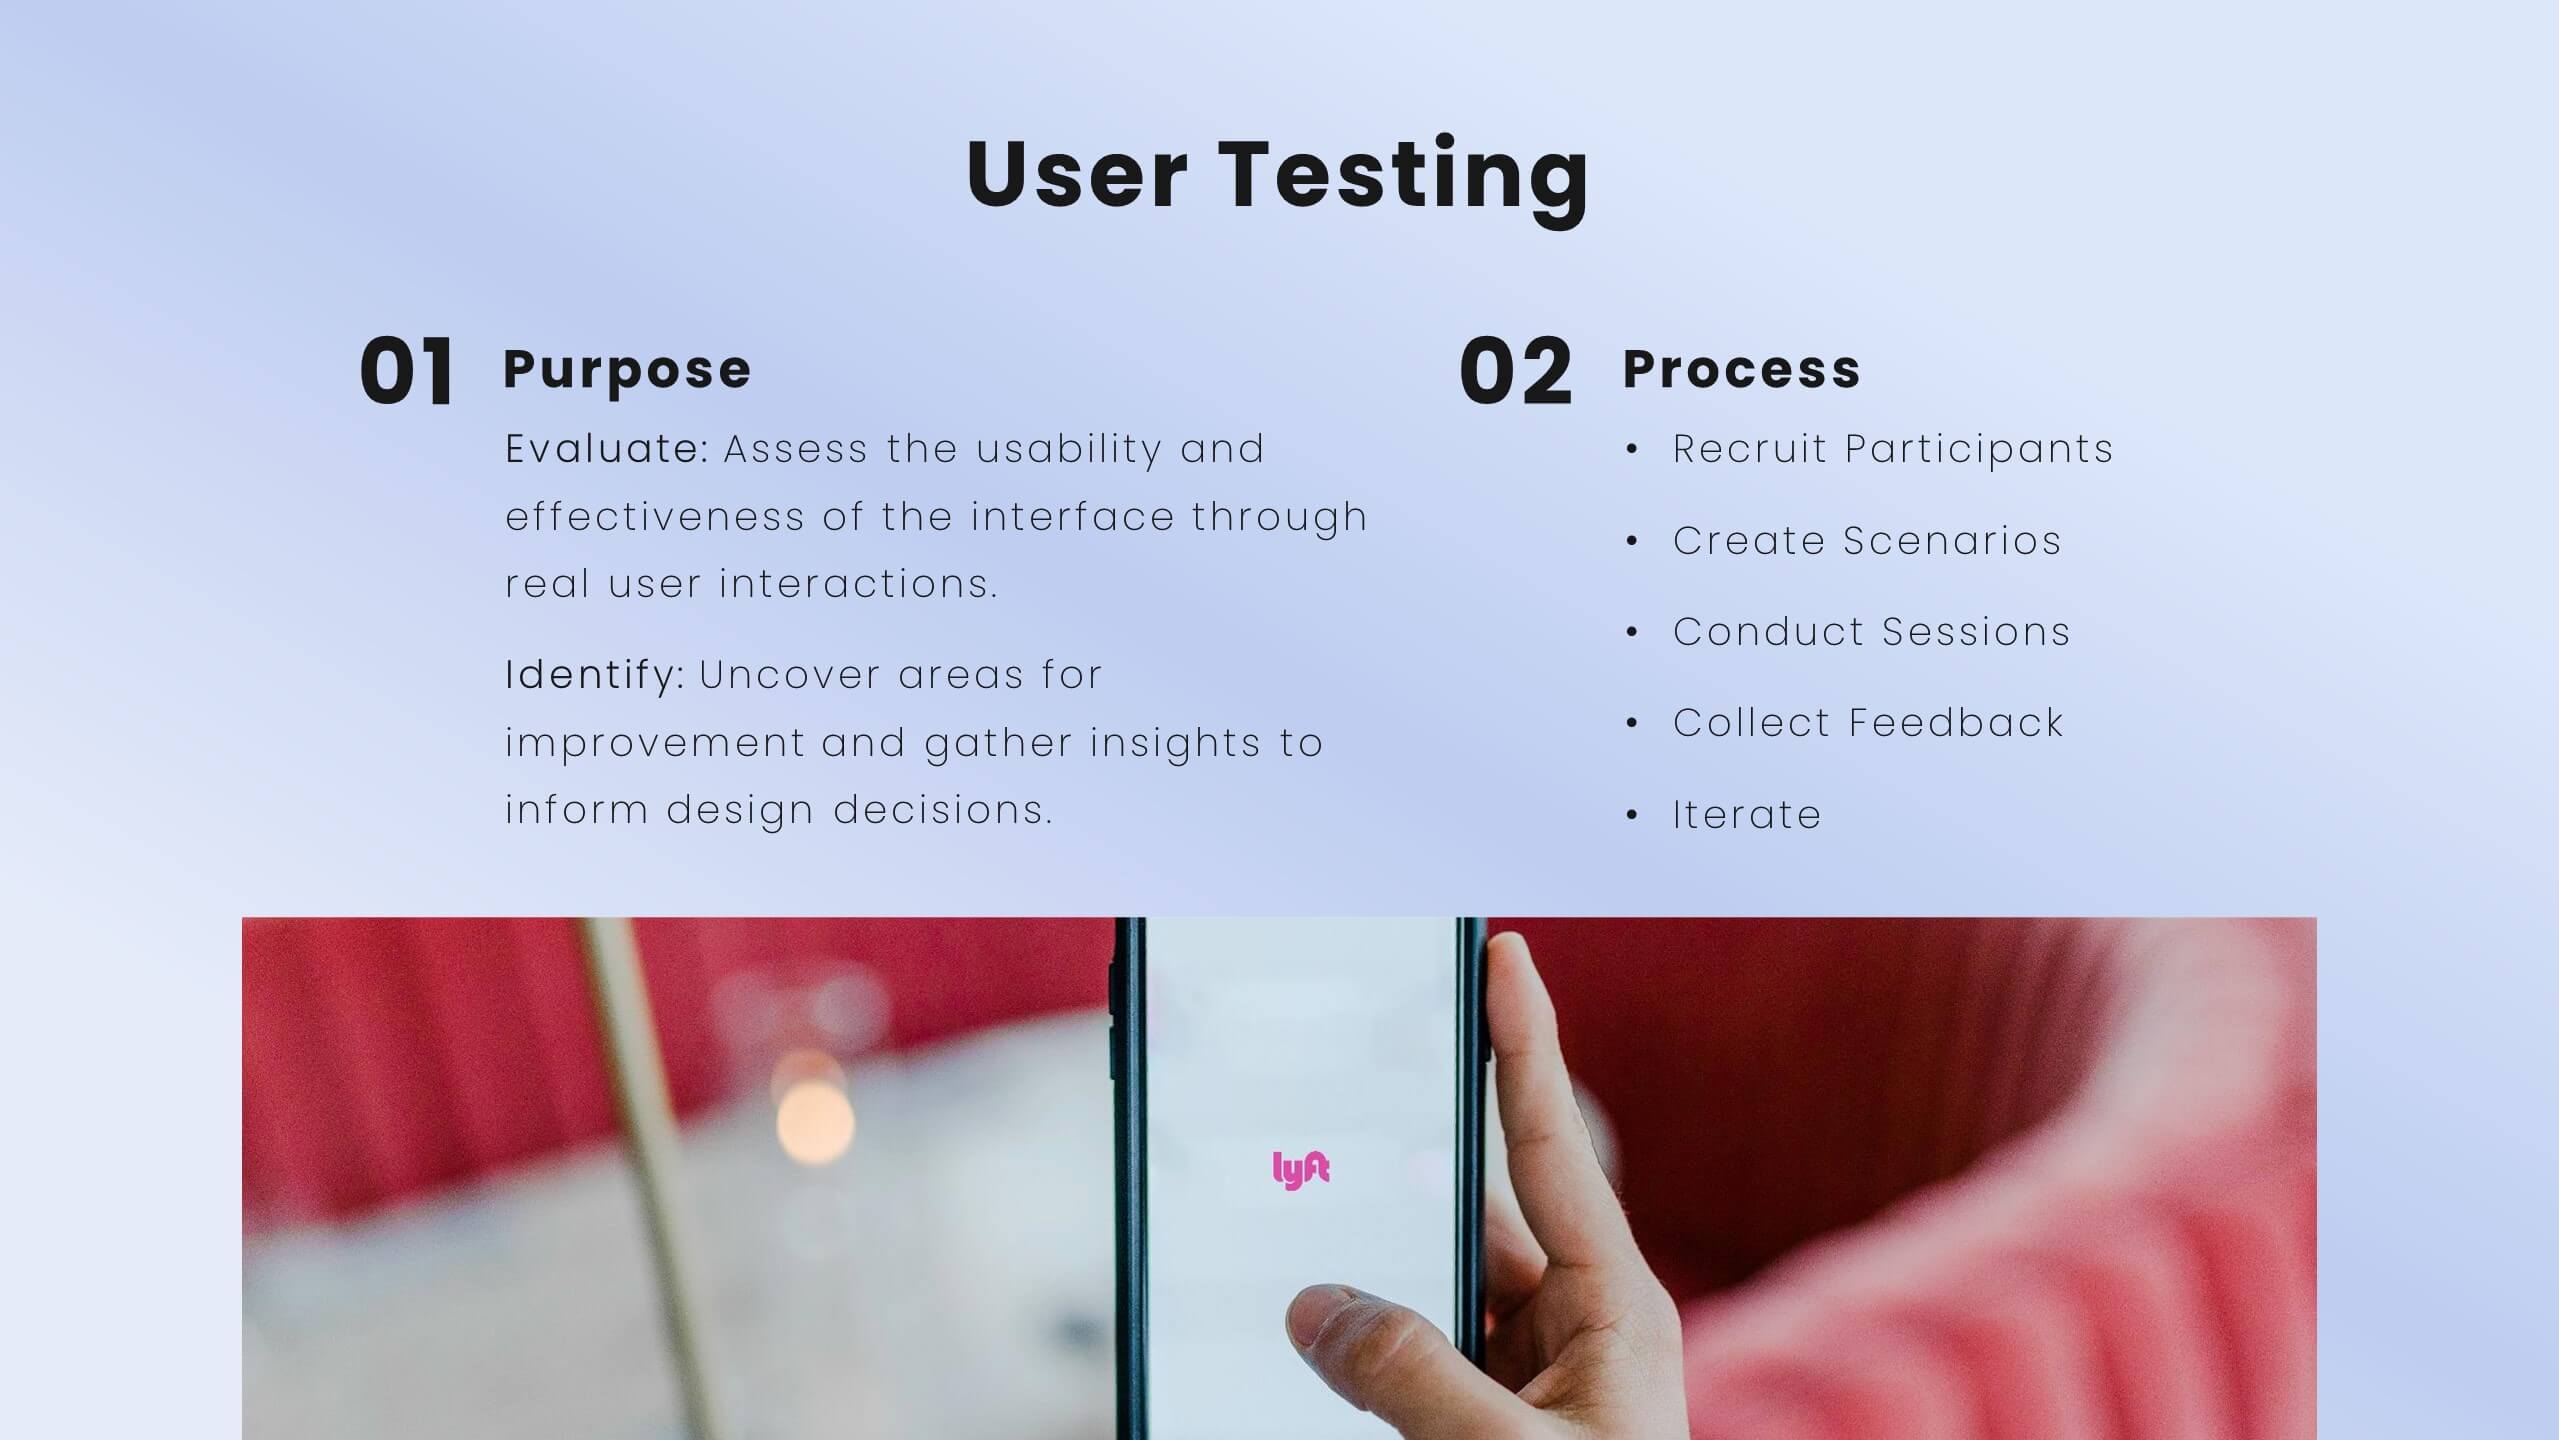
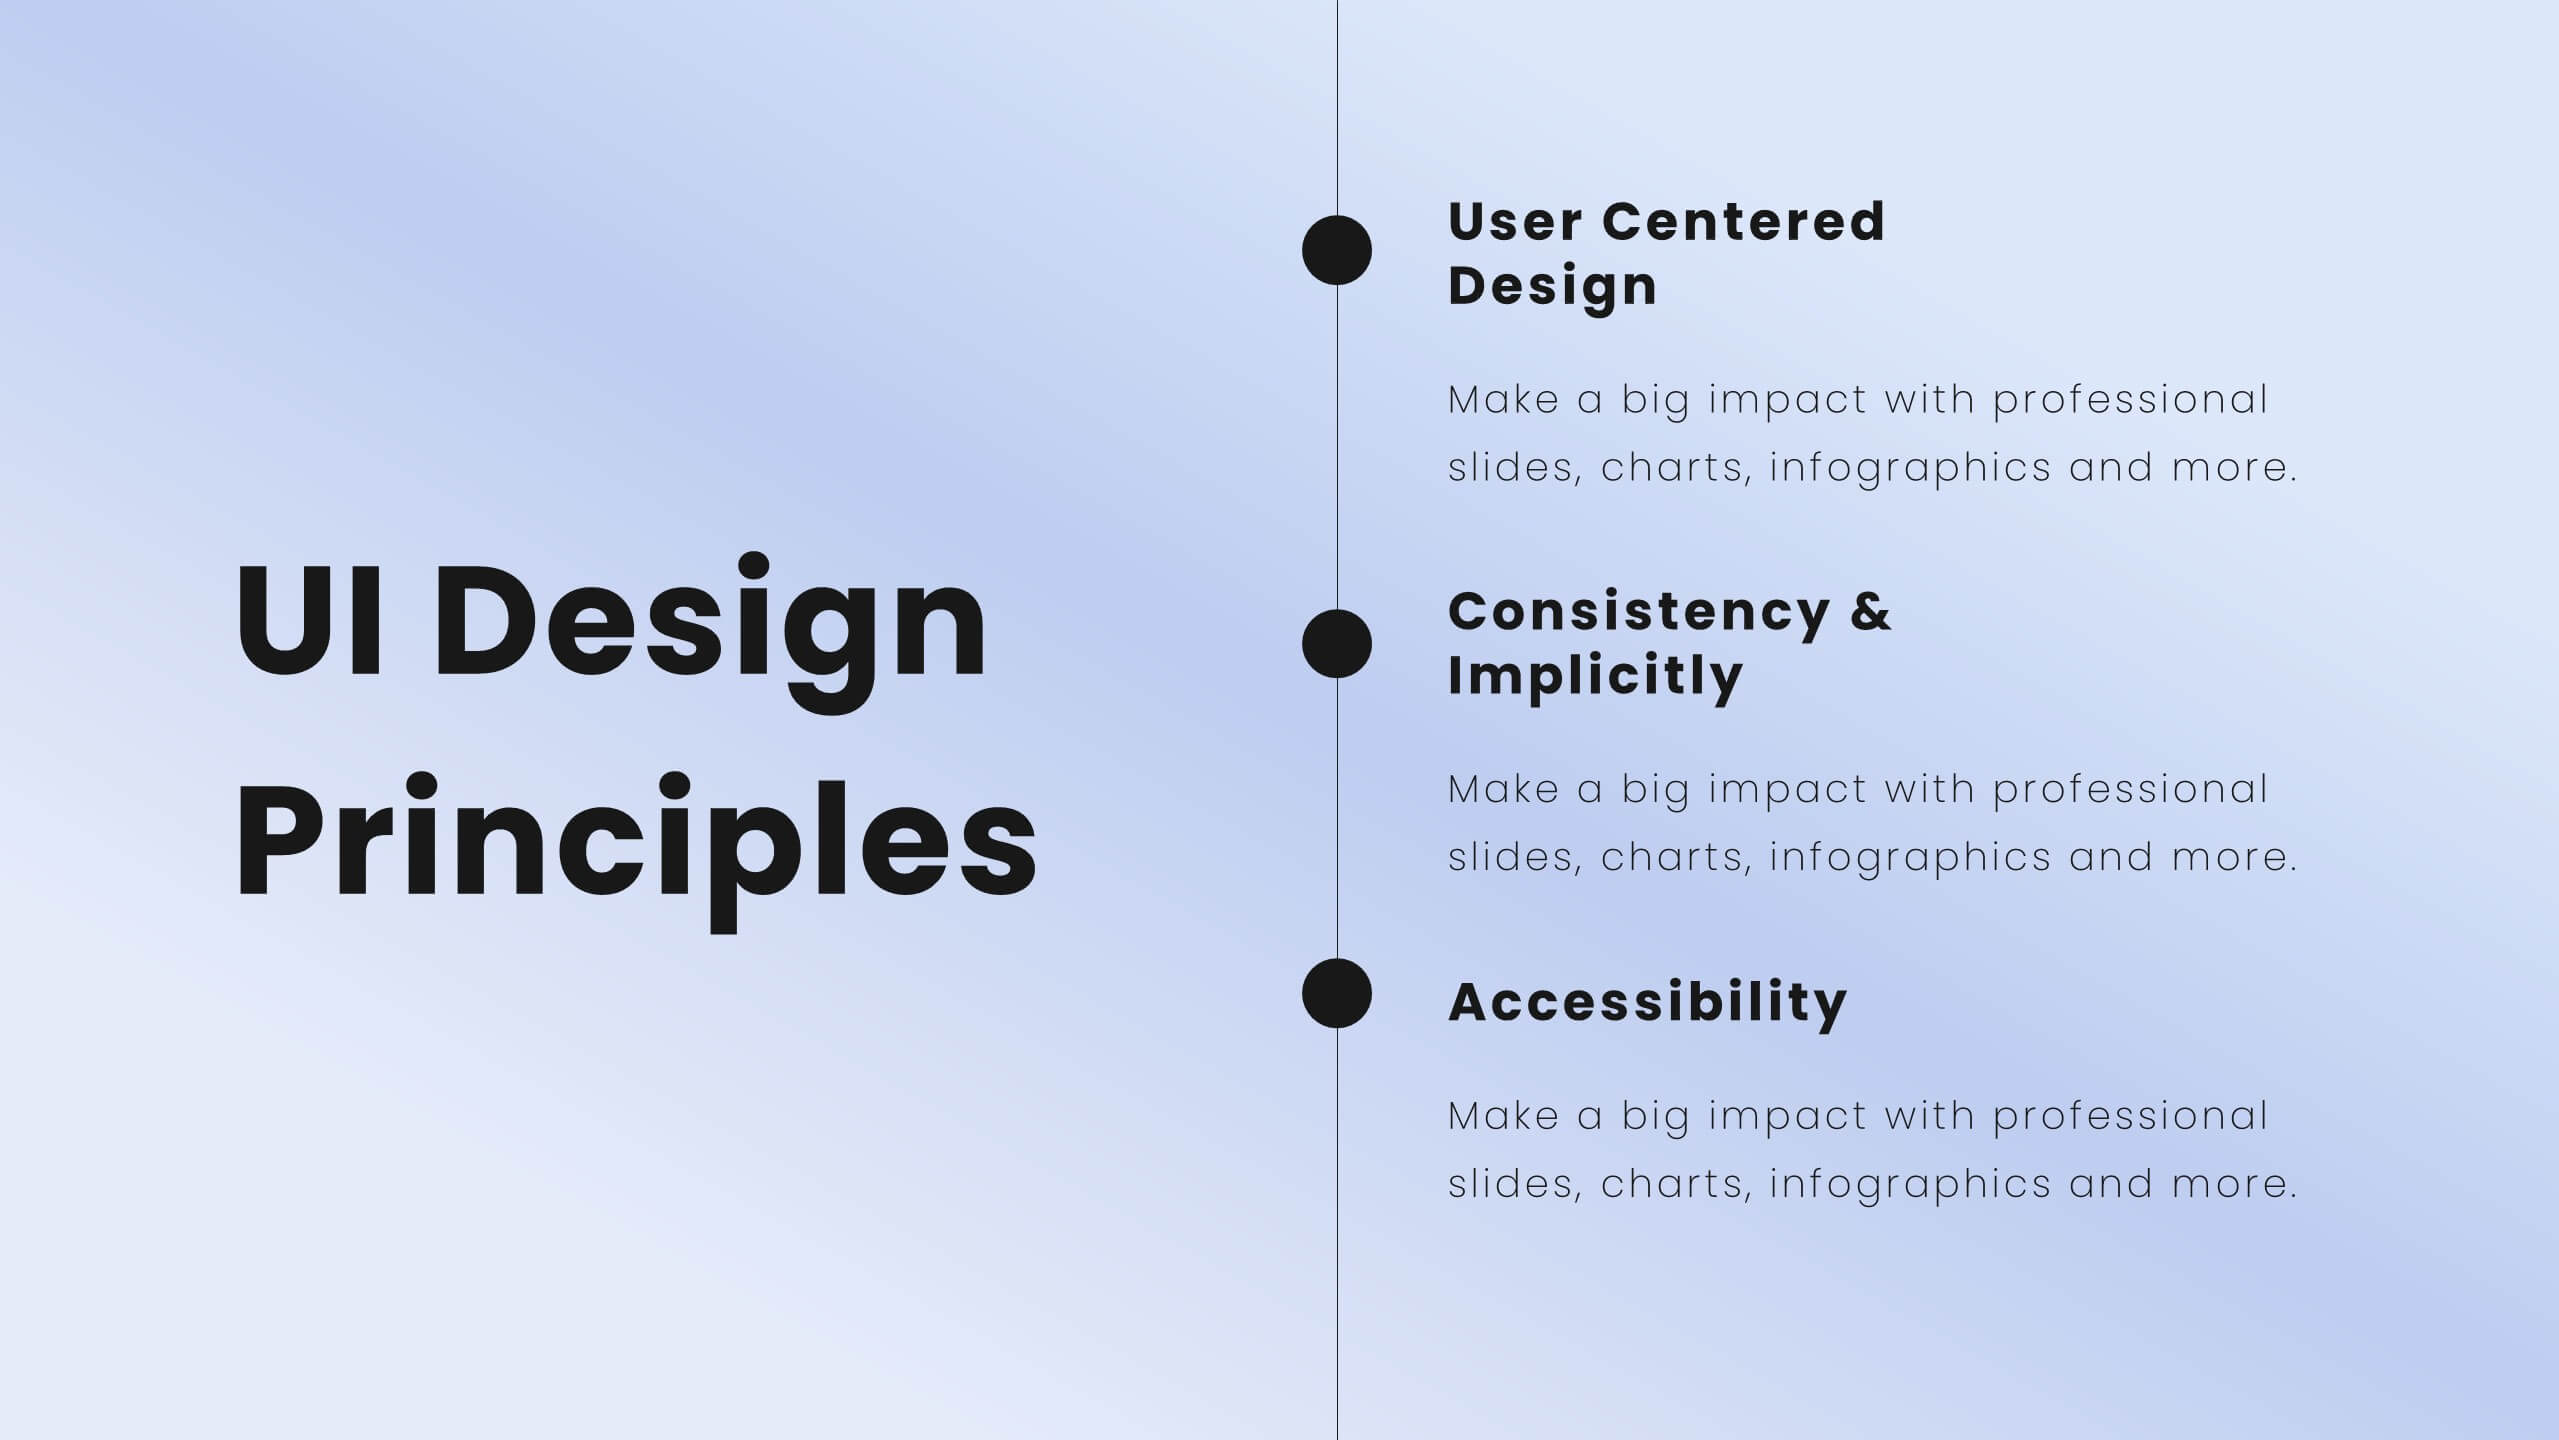
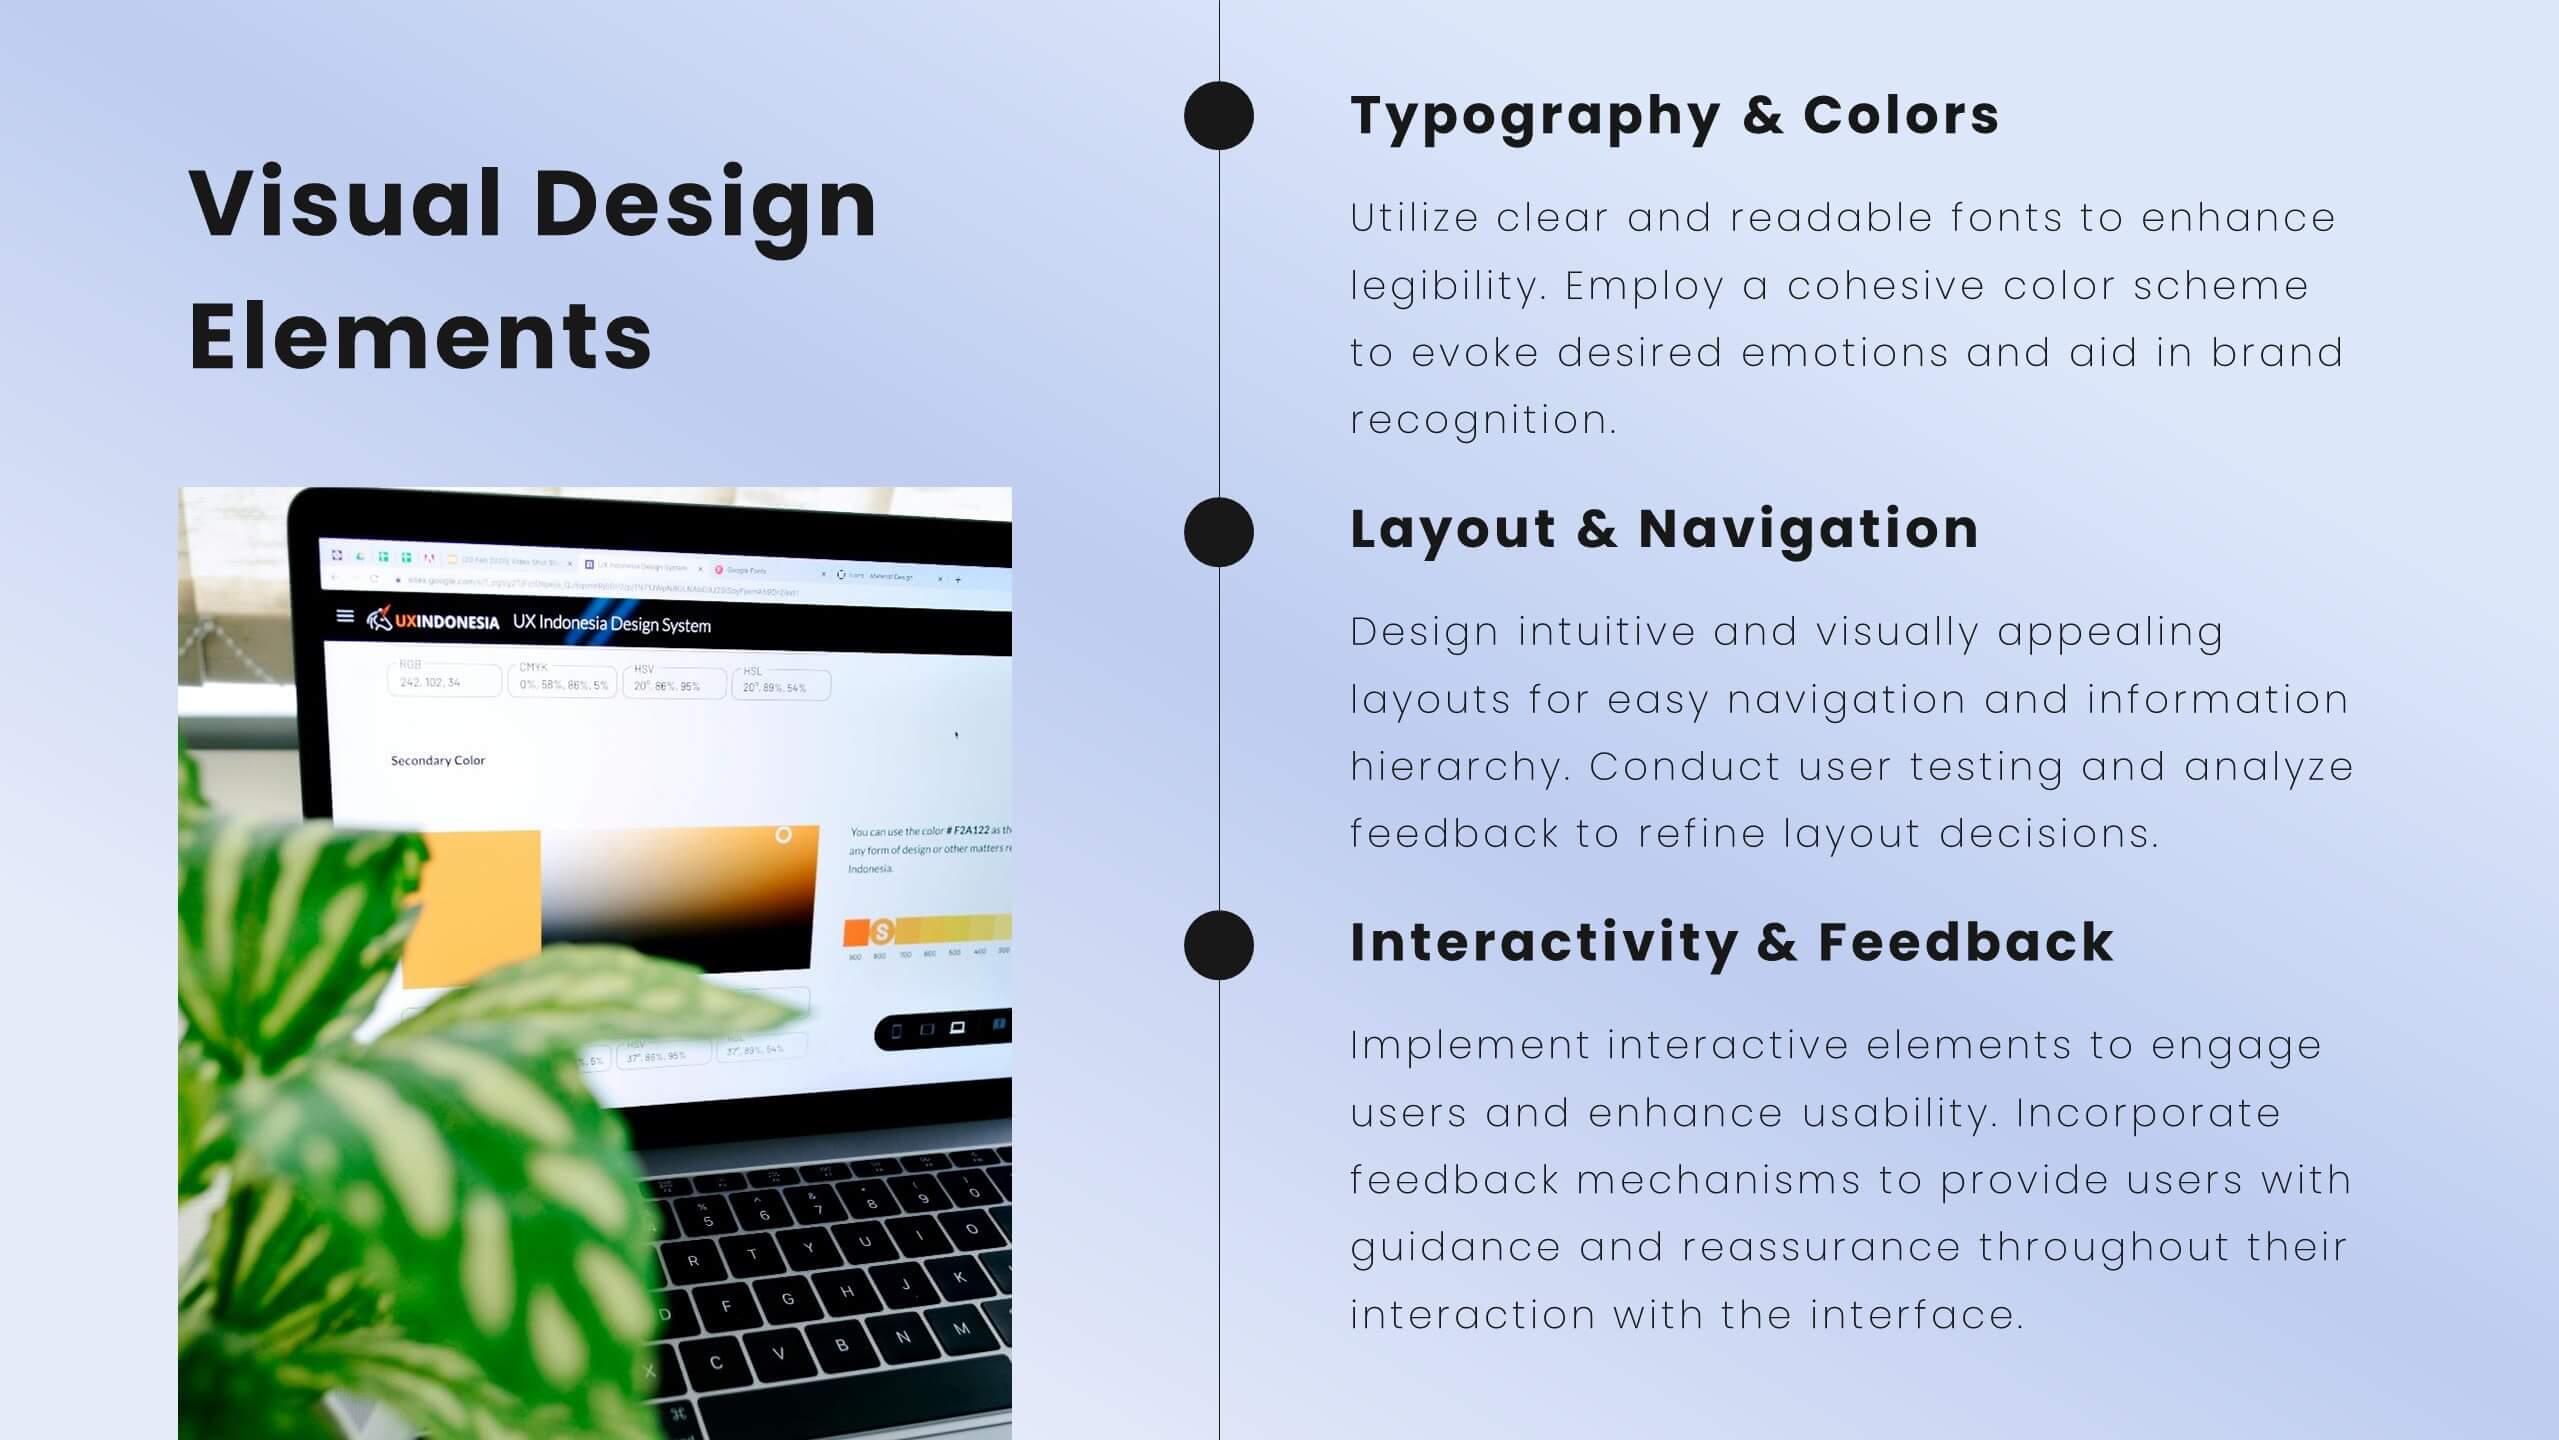
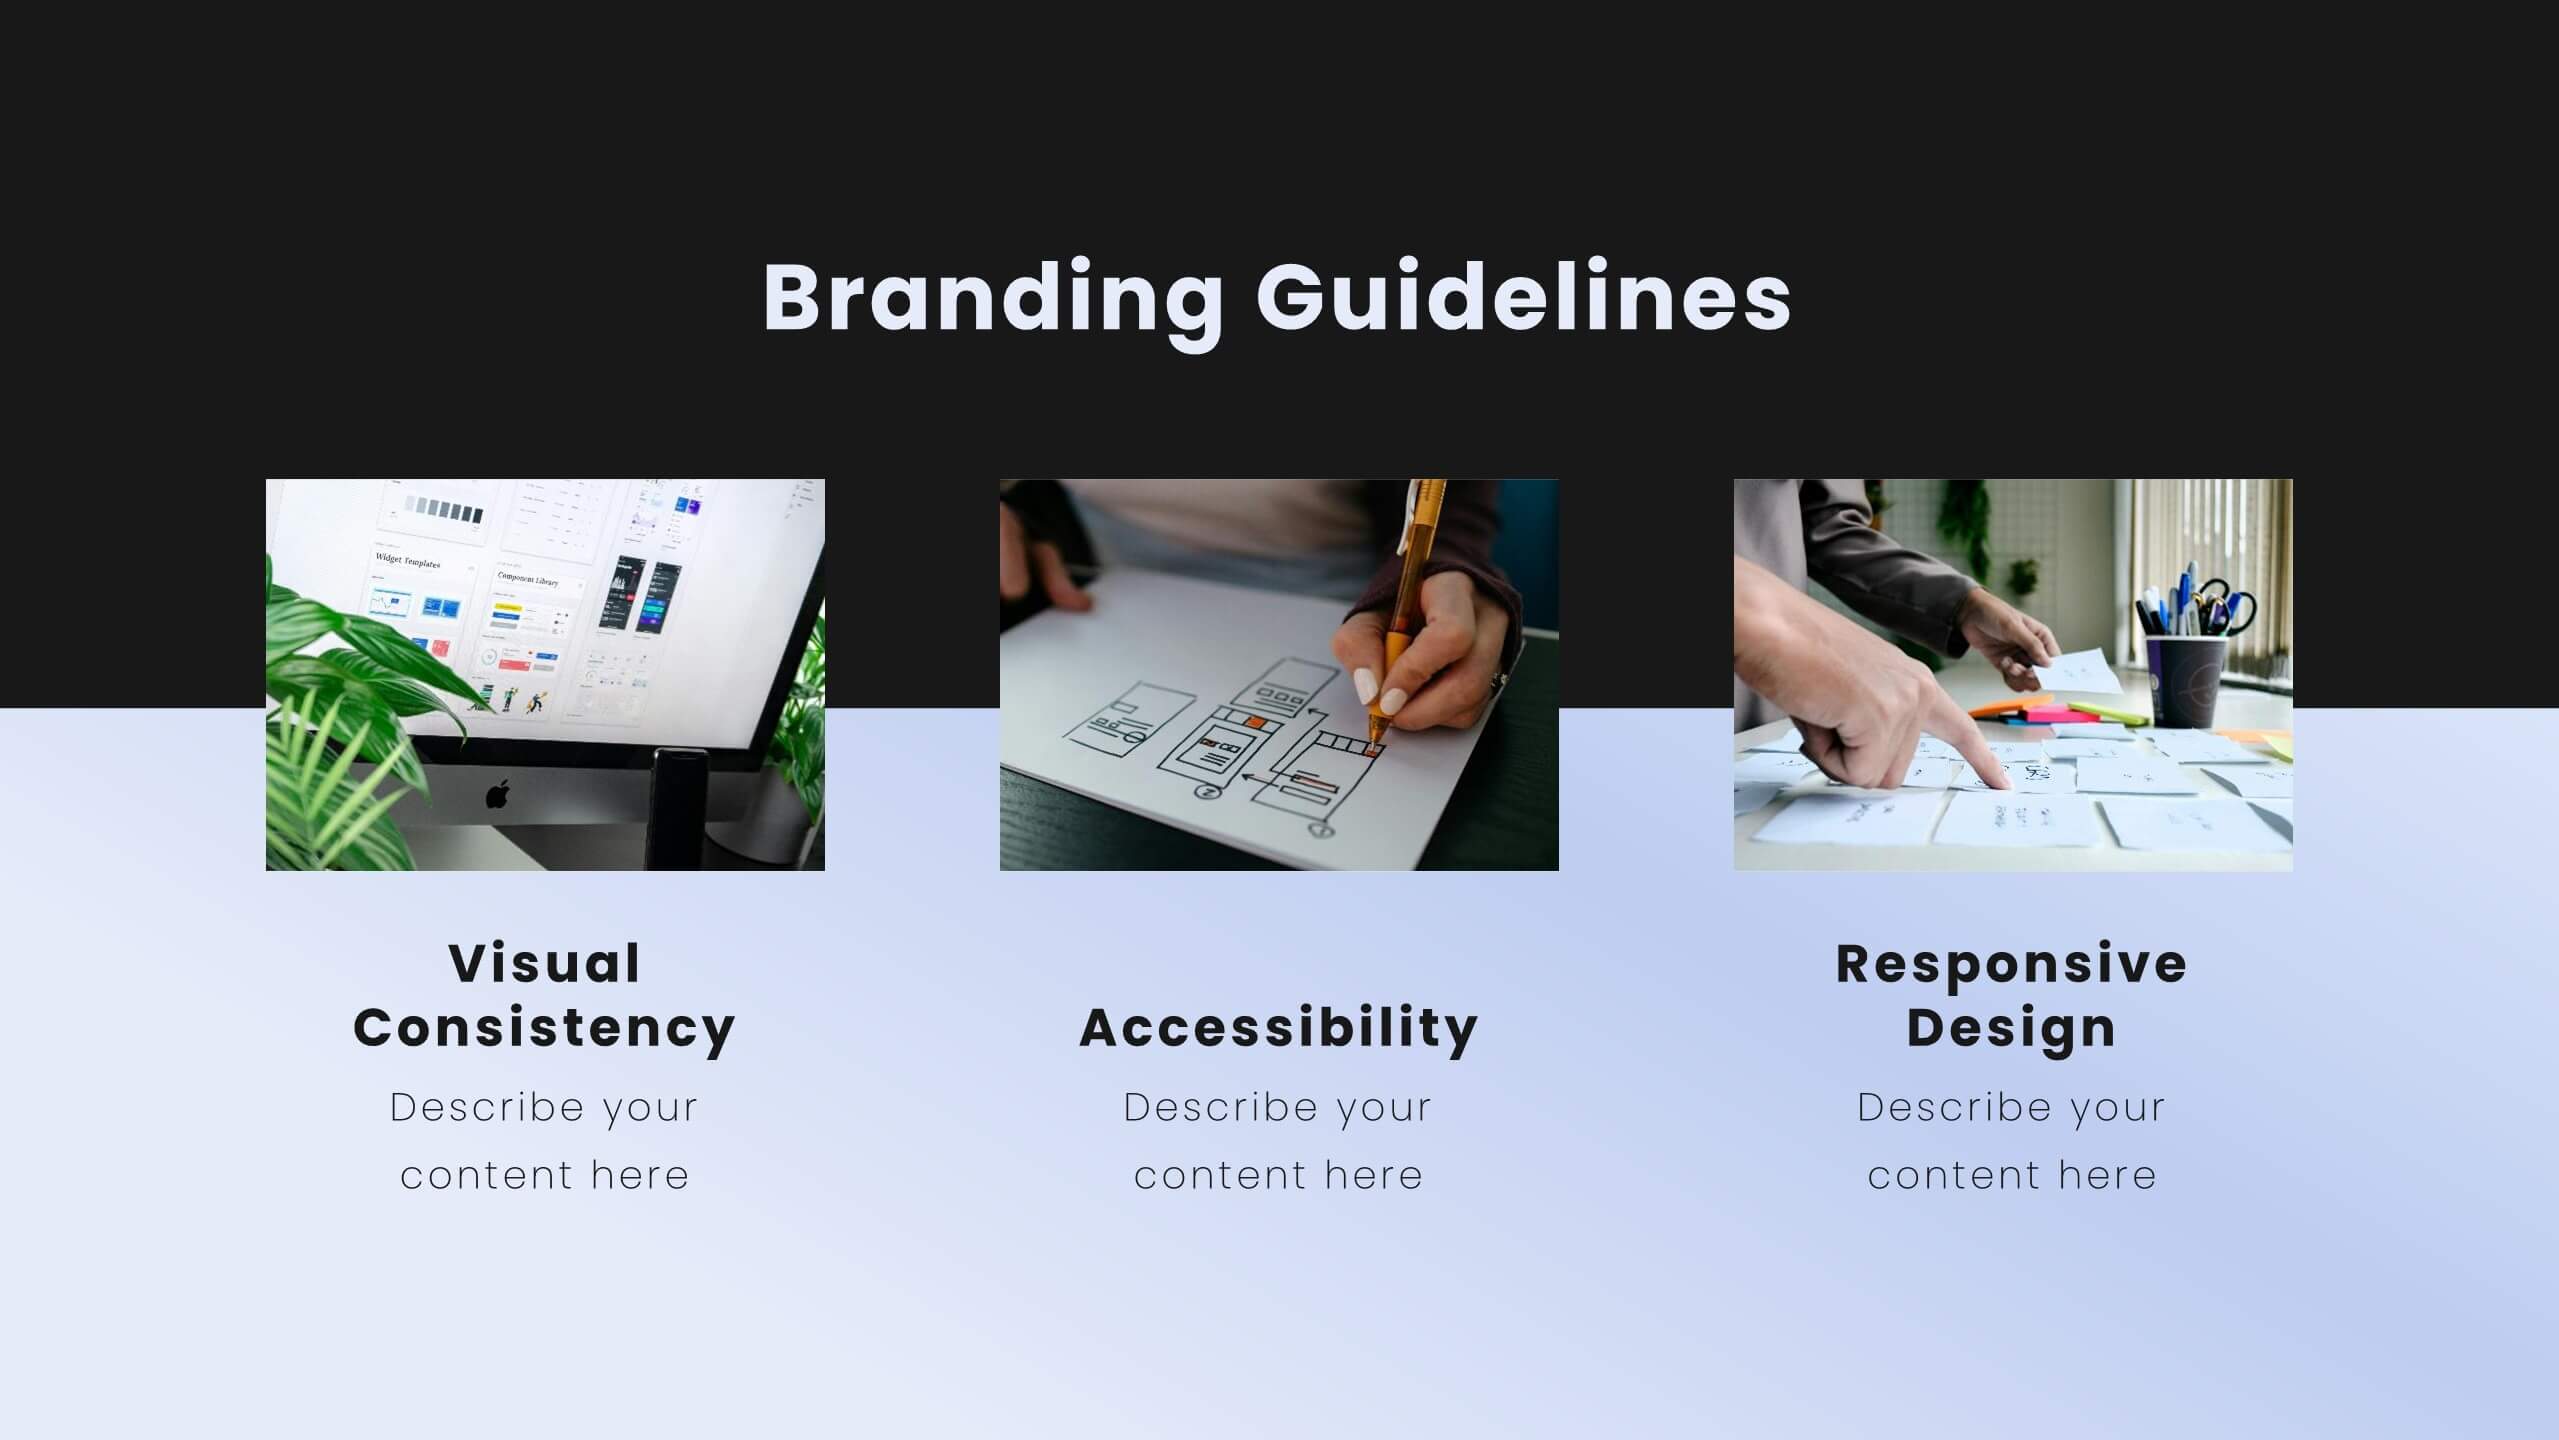
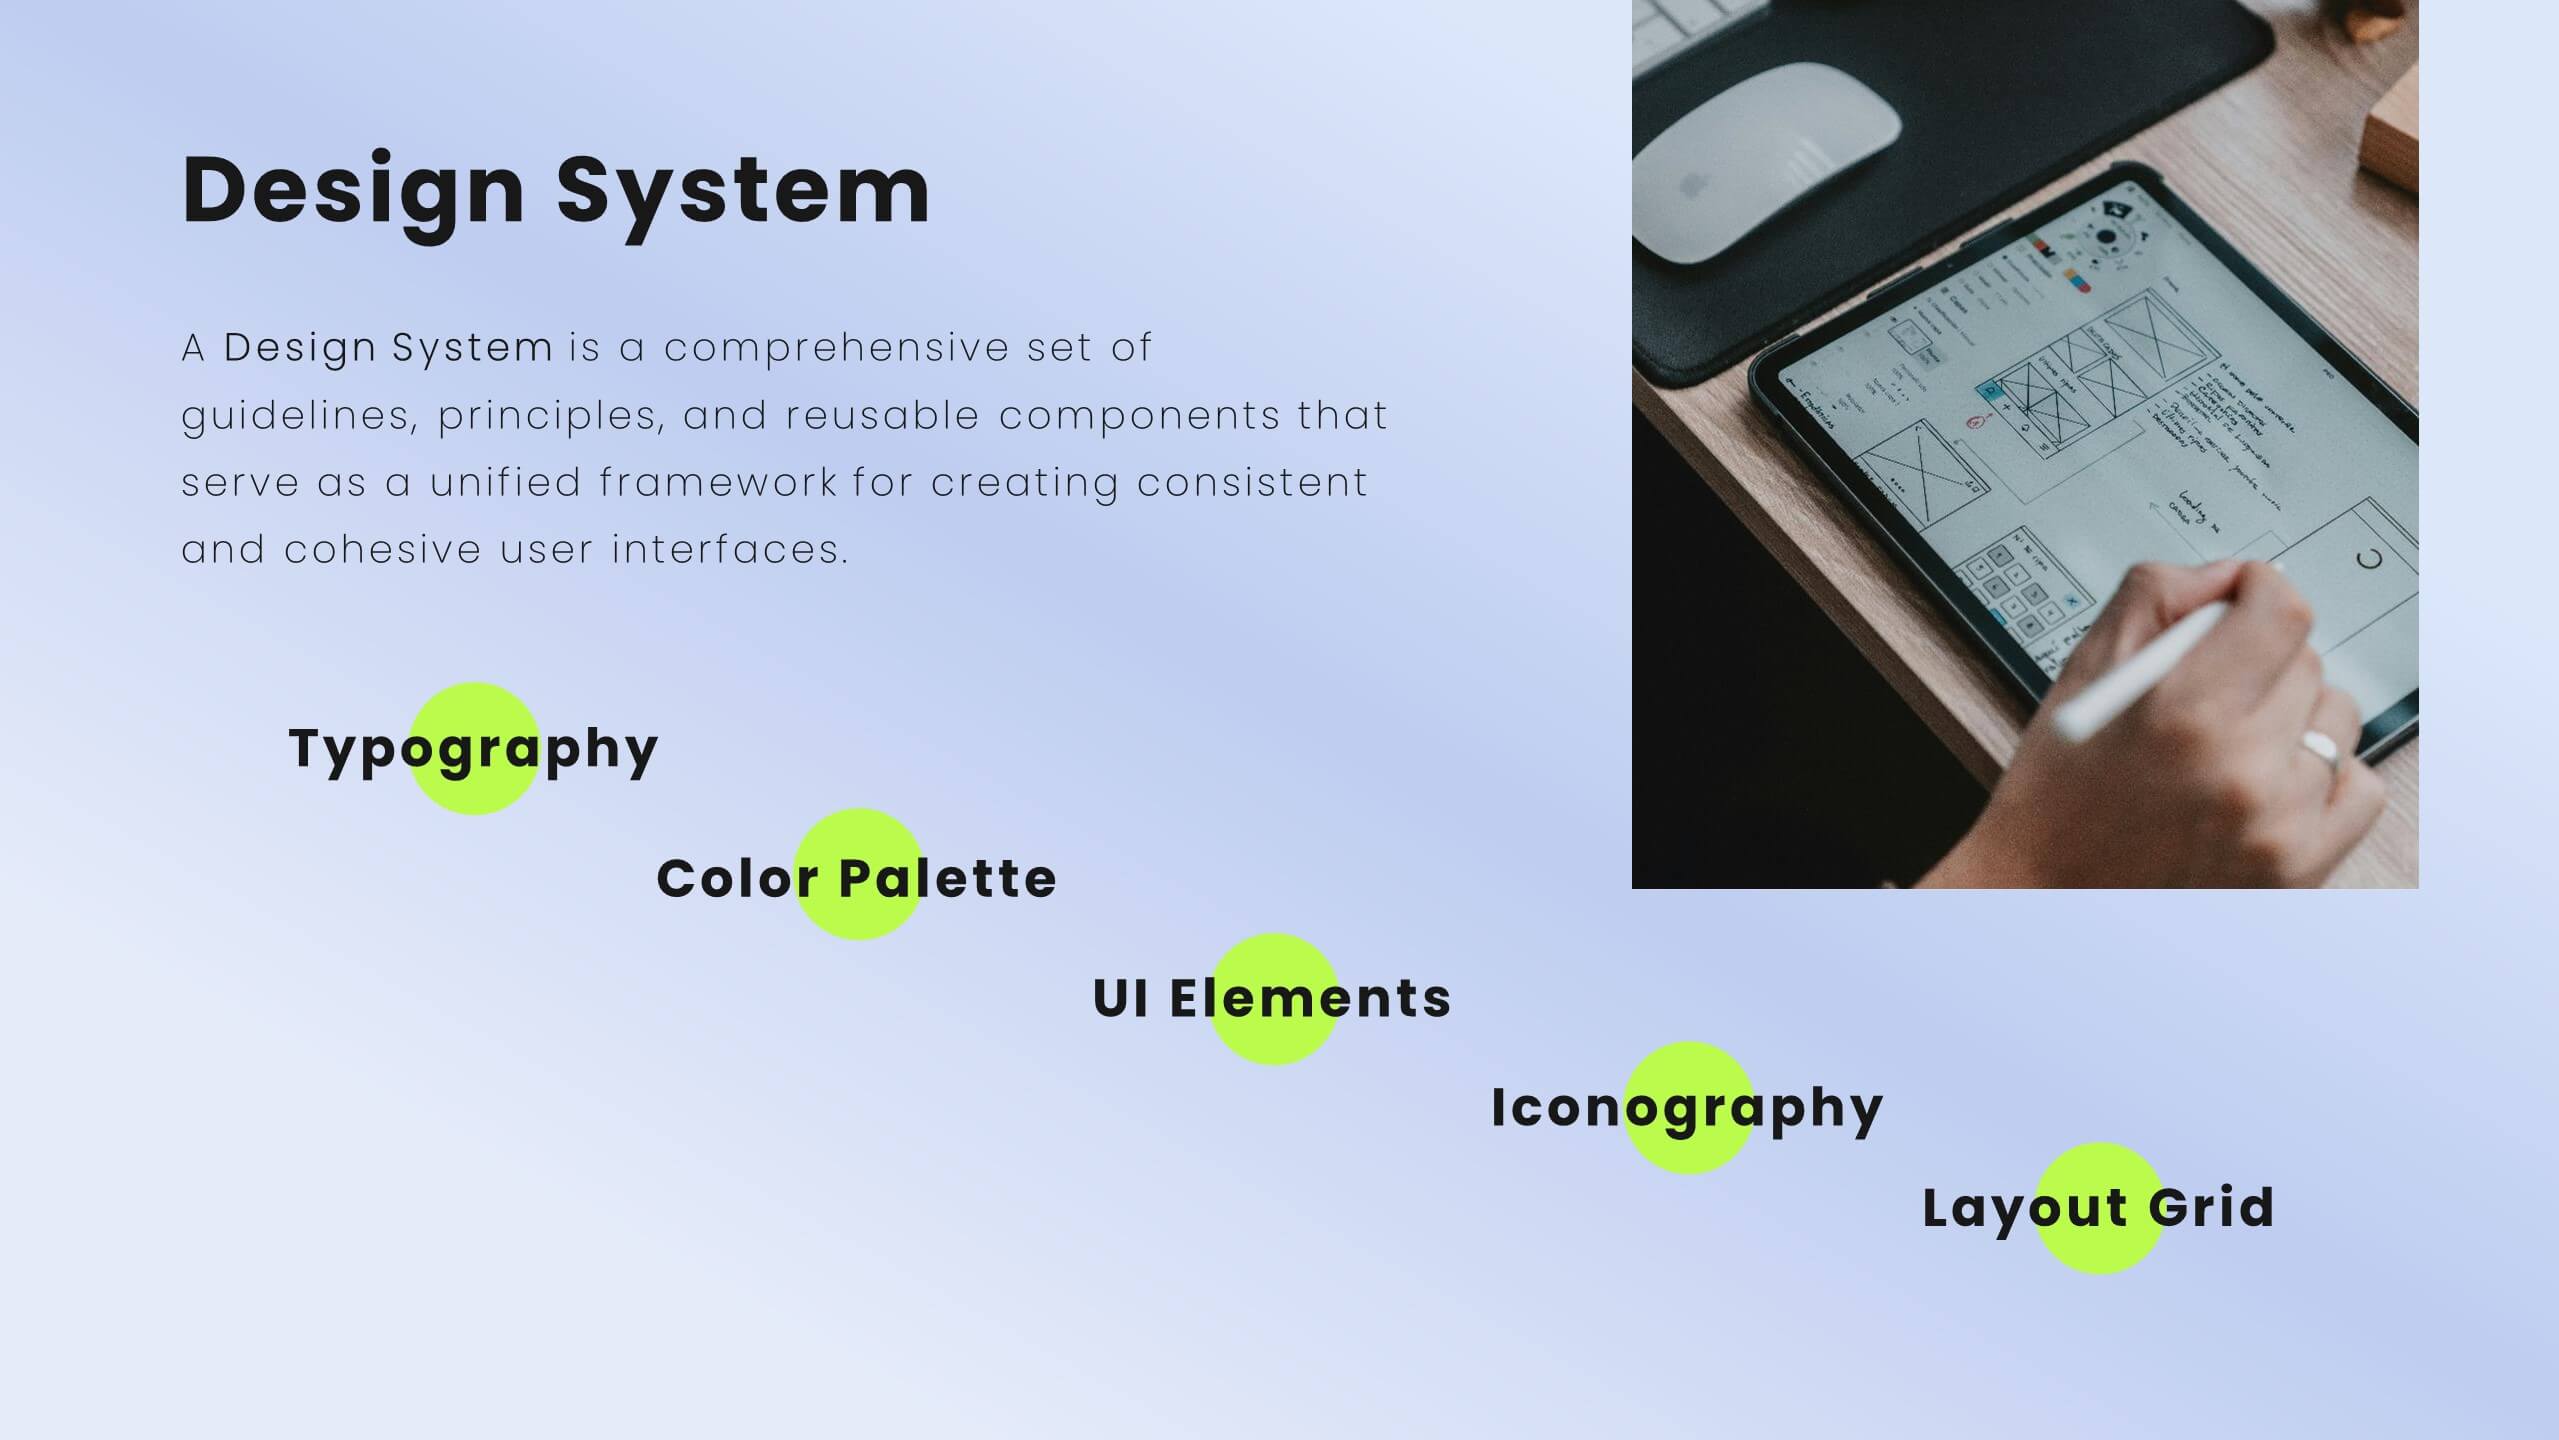
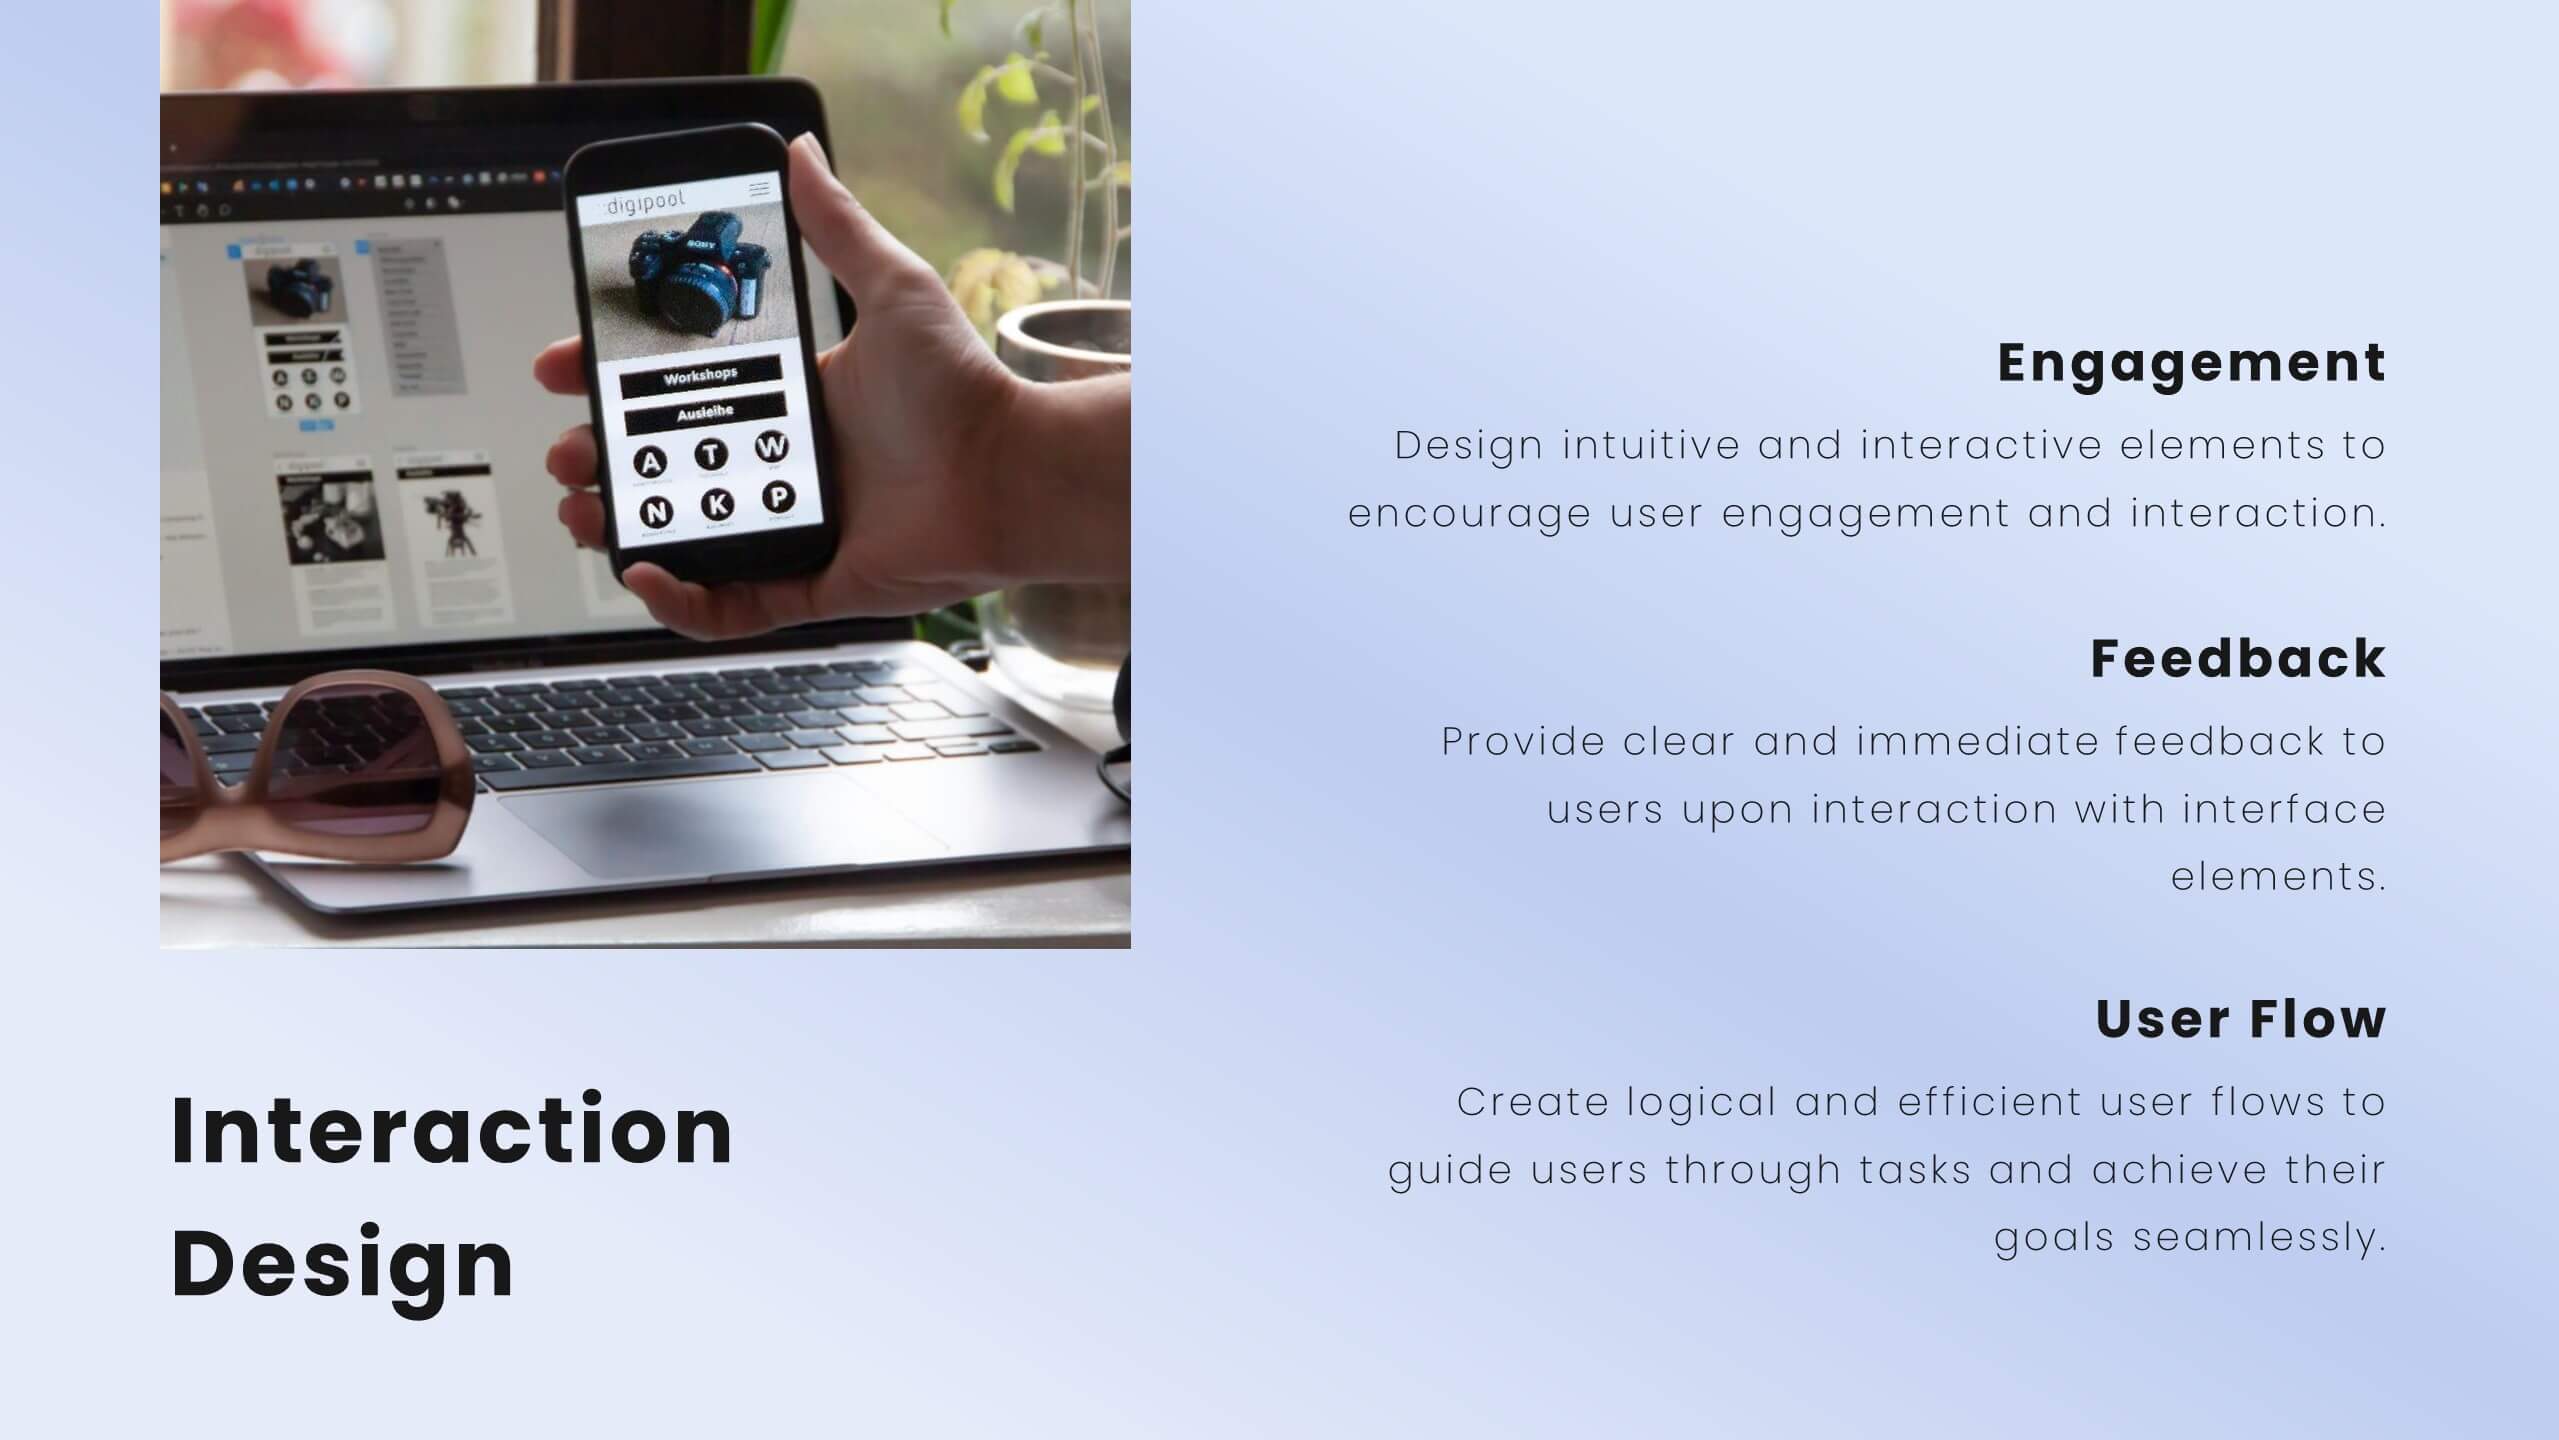
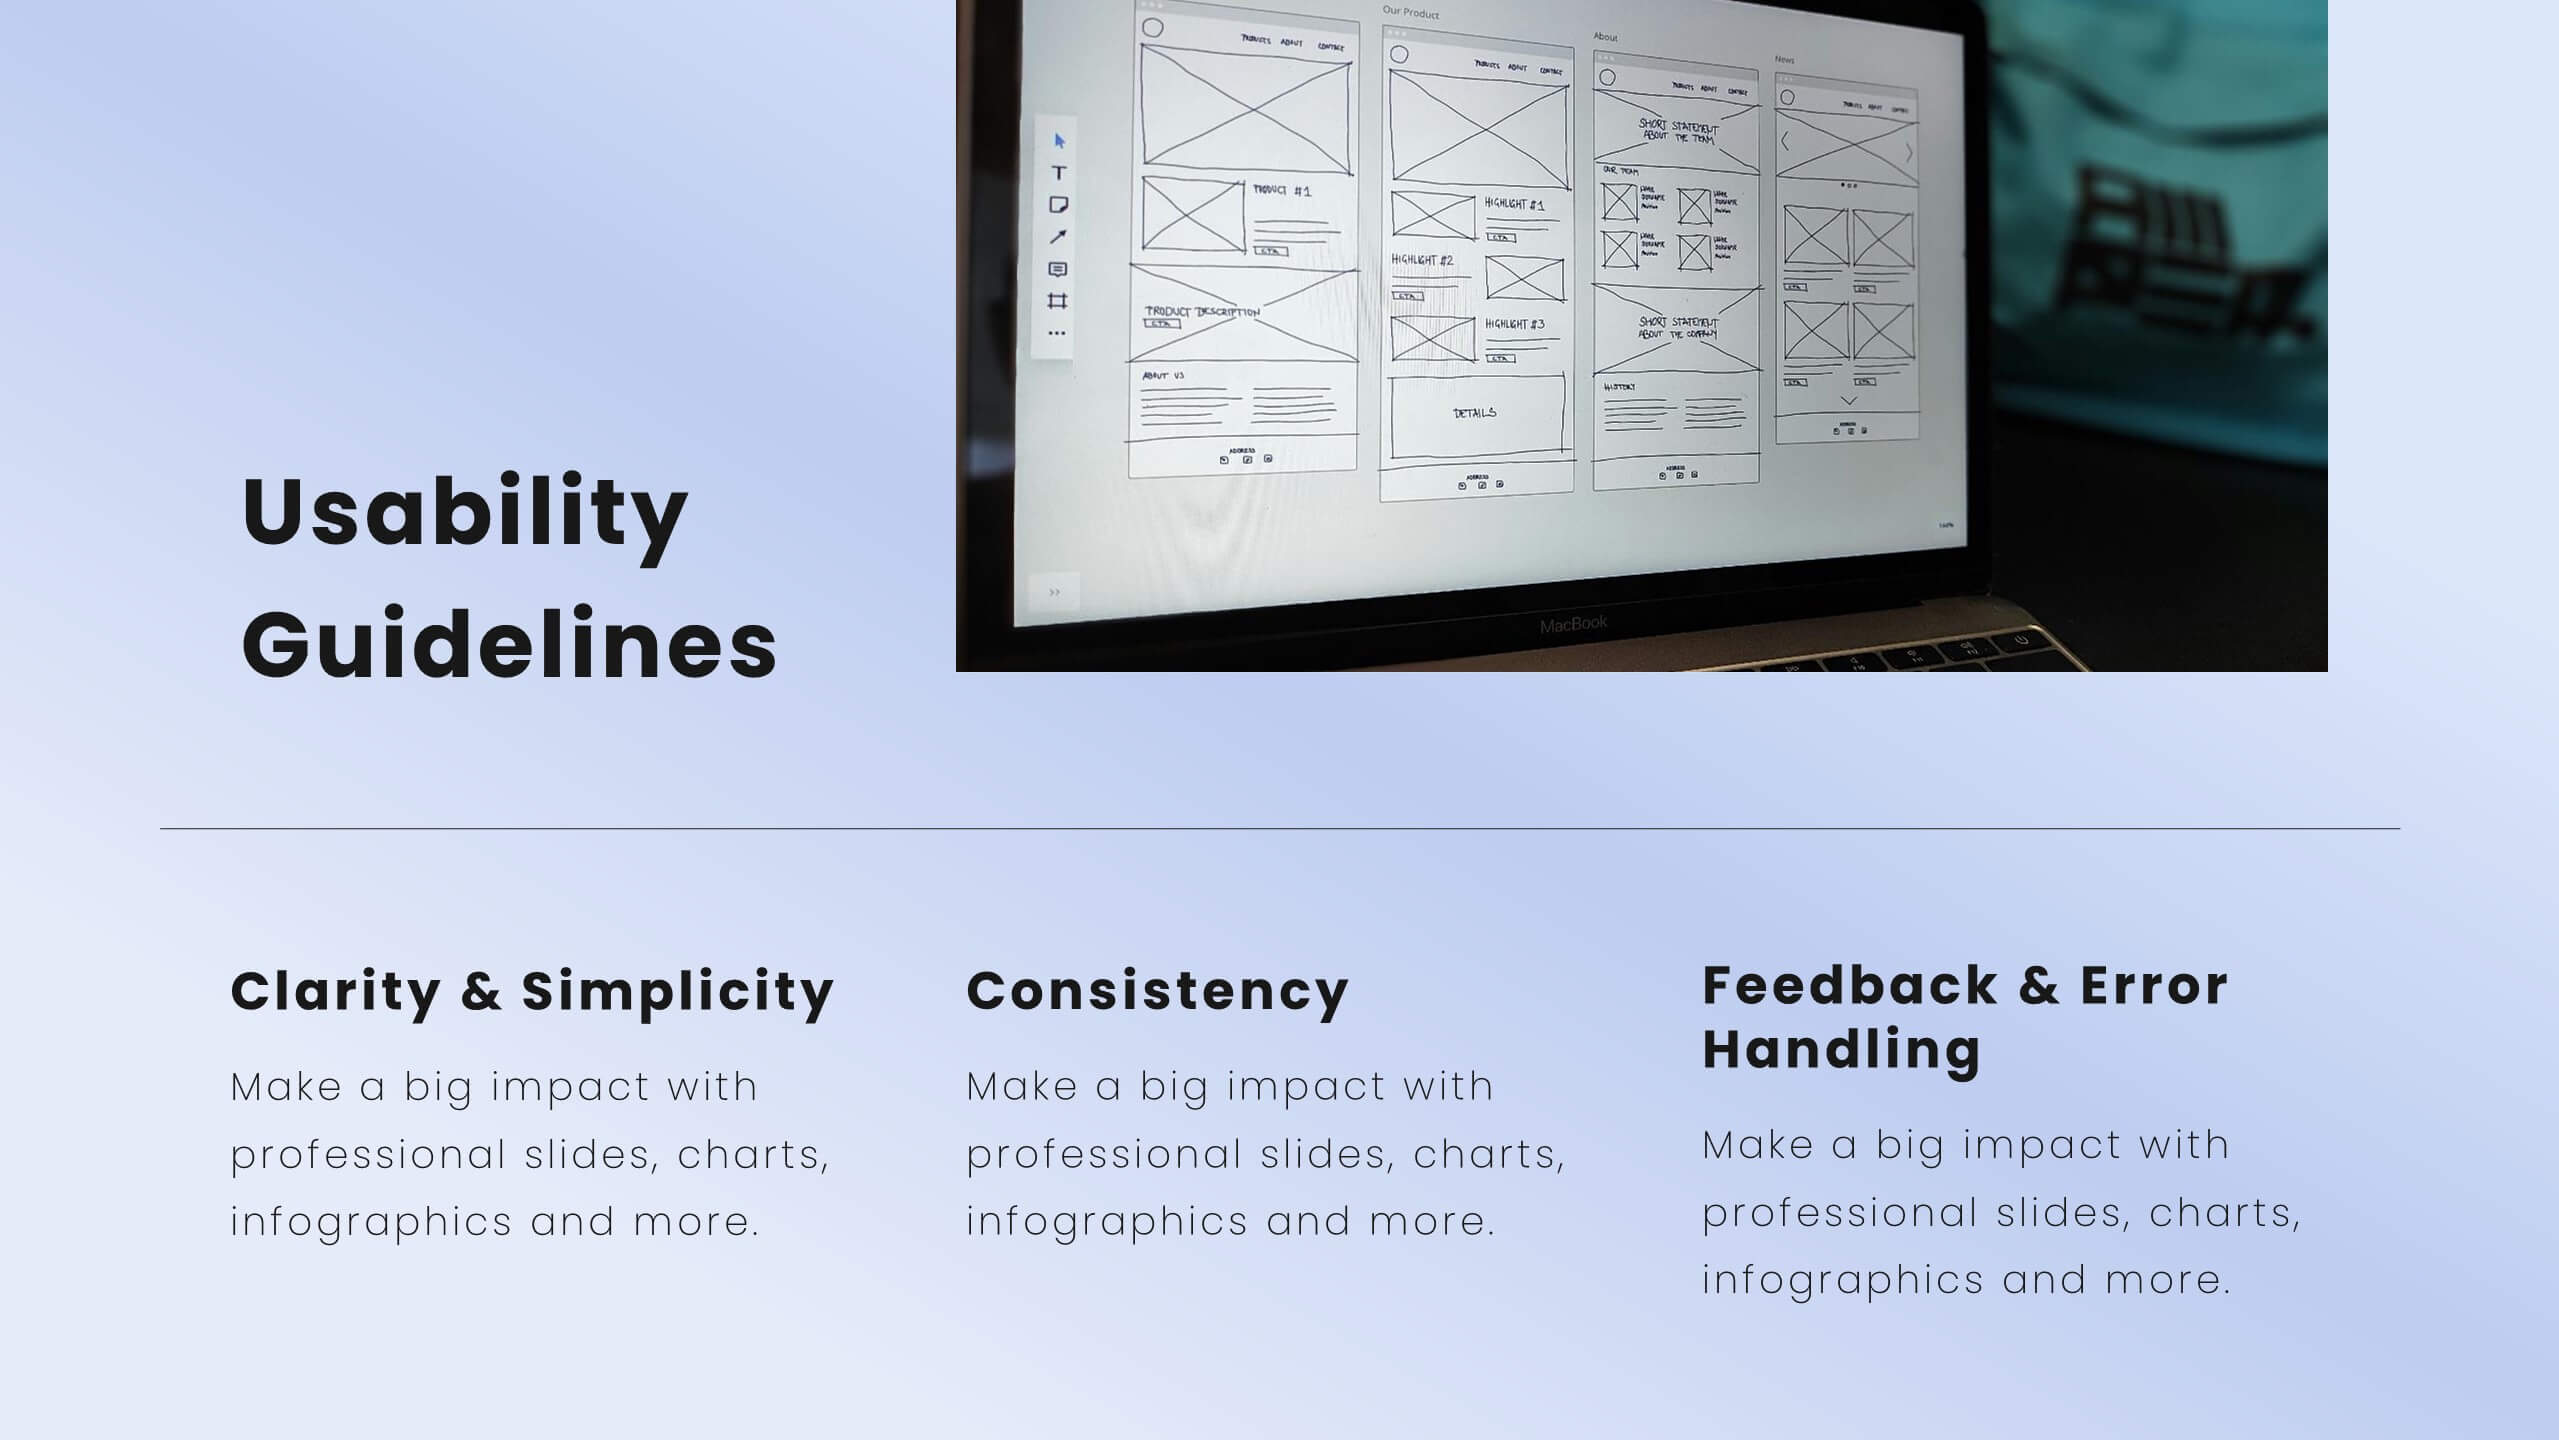
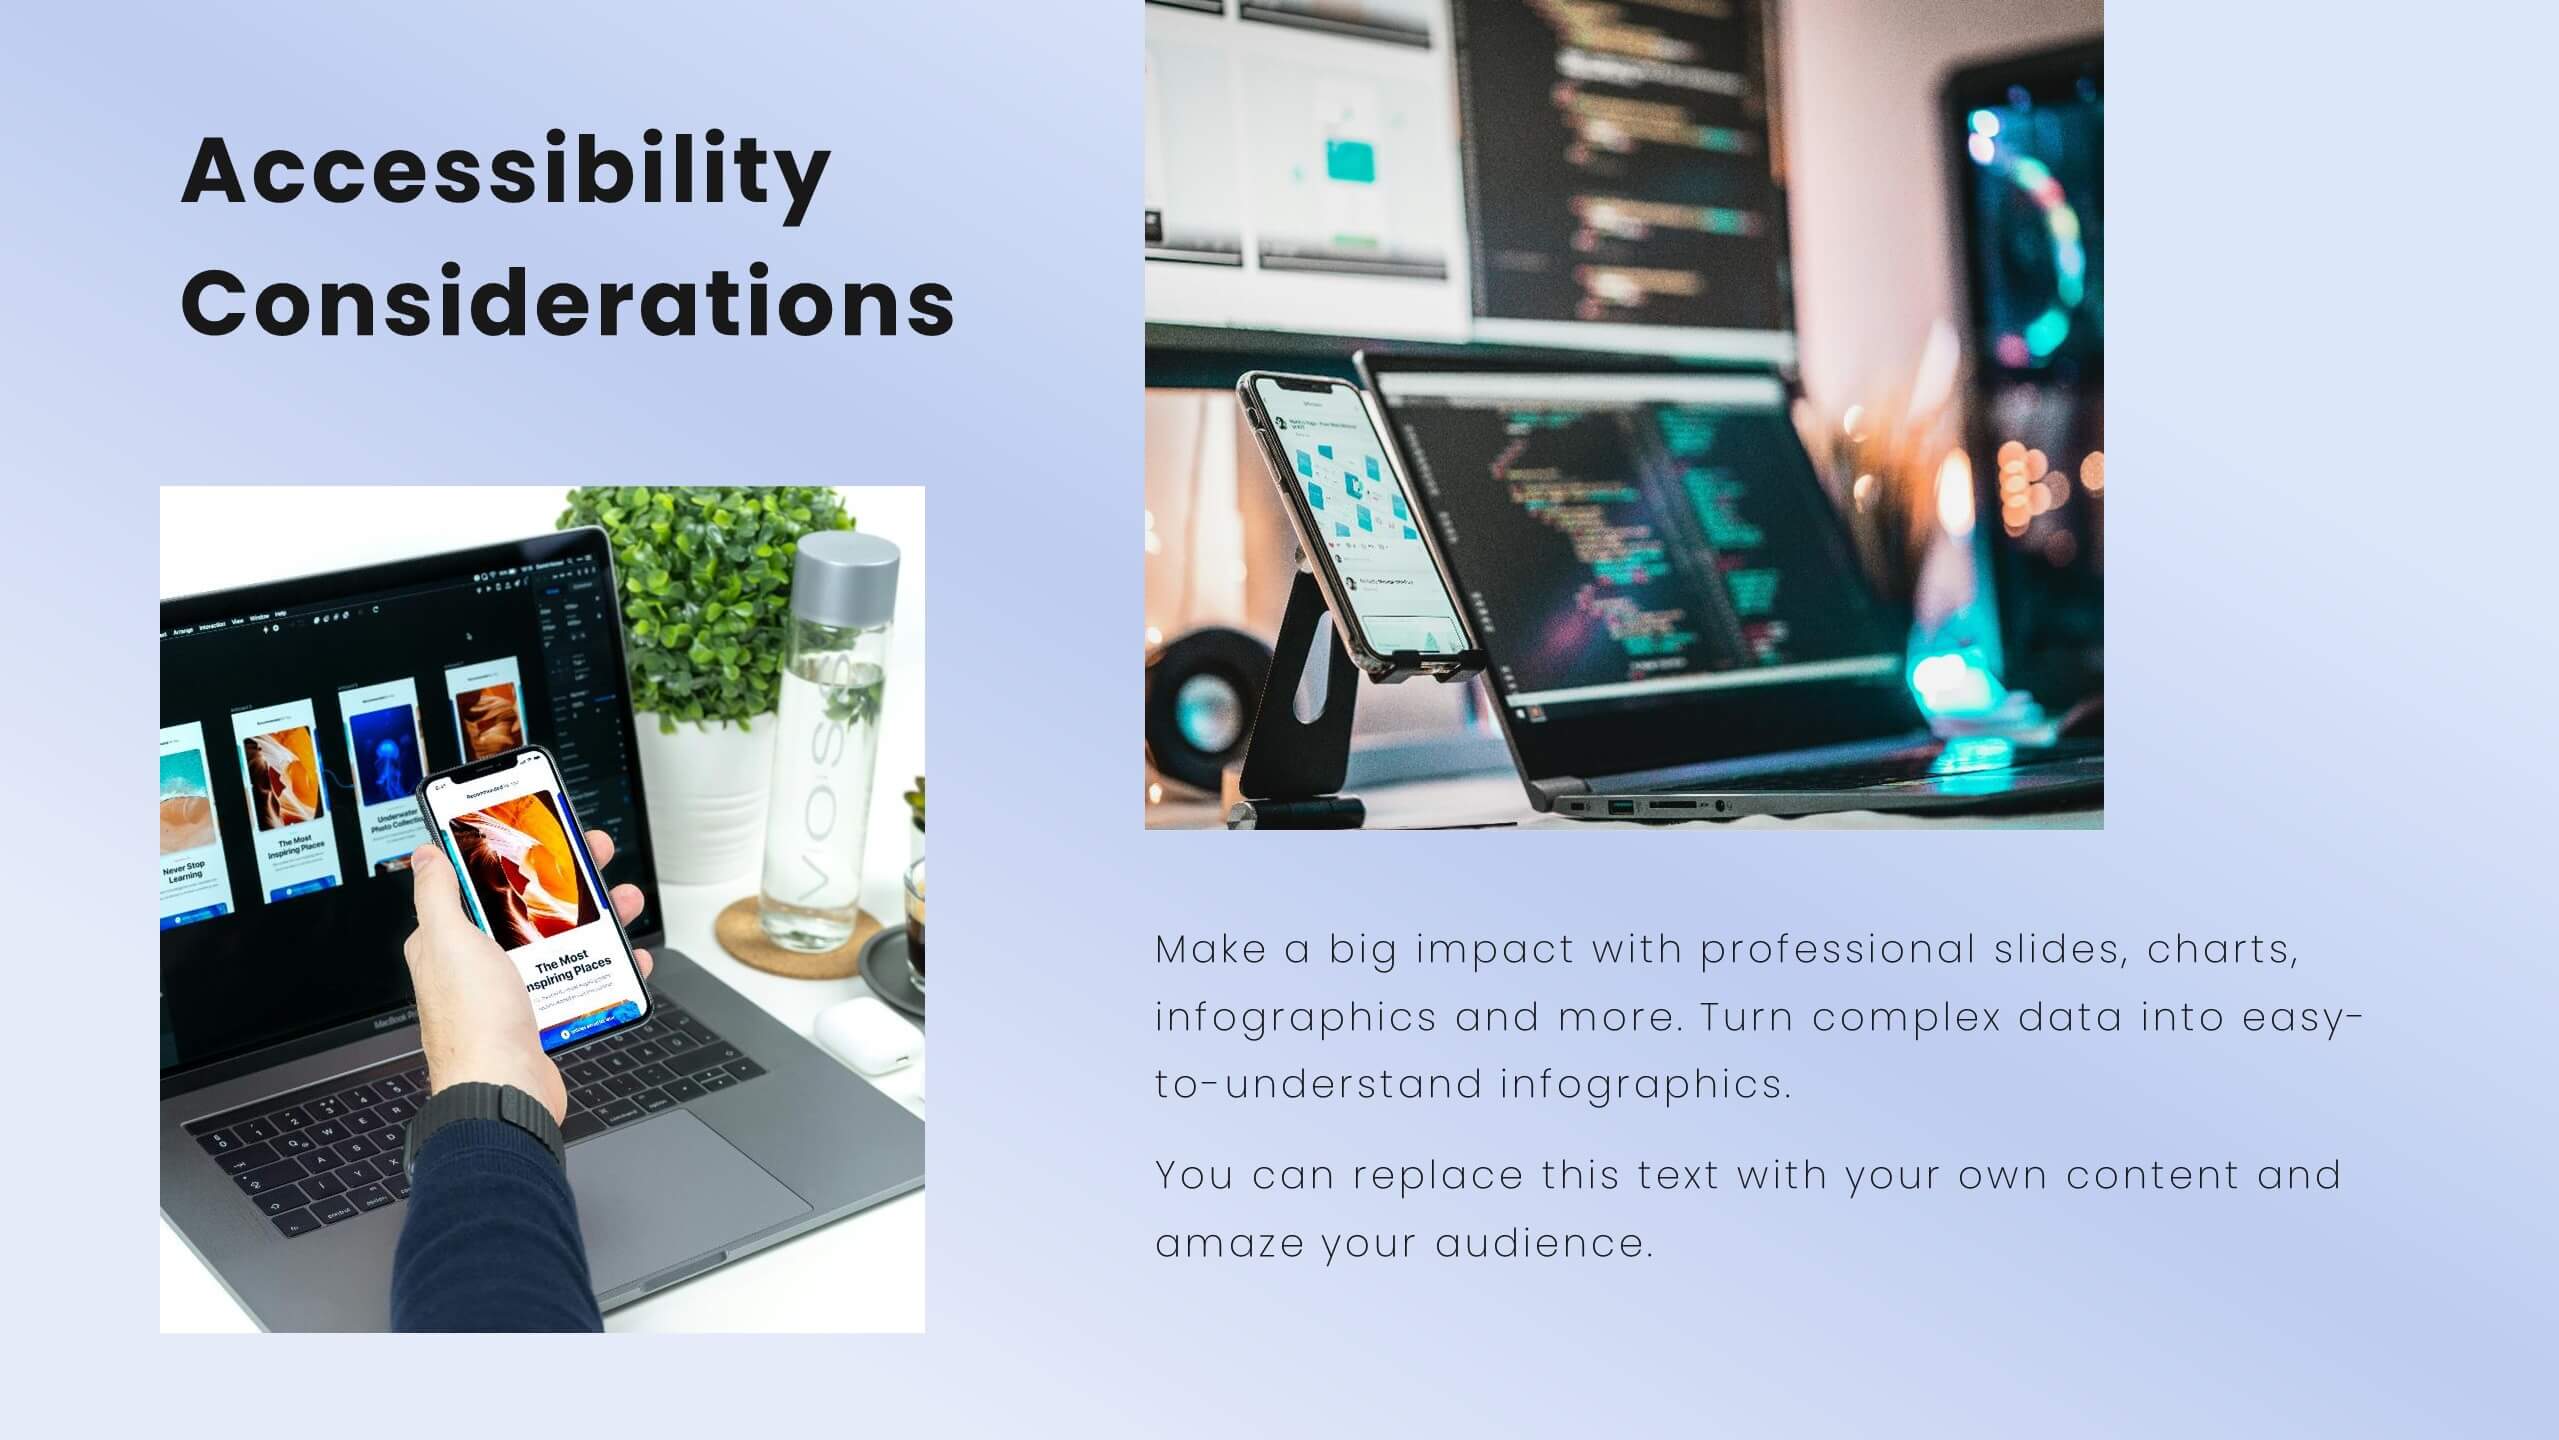
This UX Strategy Presentation offers a structured approach to user experience design, covering key aspects such as user research, wireframing, prototyping, and usability guidelines. With sections on branding, responsive design, and accessibility, this template is ideal for UX professionals. Fully editable and compatible with PowerPoint, Keynote, and Google Slides.


4 slides
Gap Identification for Strategic Planning Presentation
Bridge the gap between where you are and where you want to be with this clean and practical layout. Ideal for outlining current challenges, action plans, and future goals, this presentation template helps visualize strategic progress with clarity. Fully compatible with PowerPoint, Keynote, and Google Slides.


12 slides
Sales Metrics Dashboard Presentation
Unlock a sharper view of your sales story with a clean, data-driven layout that highlights performance trends at a glance. This presentation organizes KPIs, charts, and progress indicators into an easy-to-follow dashboard that supports smarter decision-making. Fully compatible with PowerPoint, Keynote, and Google Slides.


7 slides
Buyer Persona Guide Infographic
Elevate your marketing strategy with our Buyer Persona Guide Infographic Template, designed to distill complex customer data into stunning, easy-to-understand visual profiles. This template is a canvas for creativity, allowing marketers to paint detailed portraits of their ideal customers using a mix of vibrant colors, engaging layouts, and succinct text. Craft each persona with care, detailing demographics, preferences, behaviors, and needs, all laid out in an aesthetically pleasing format that makes data pop off the page. Whether you're presenting to stakeholders, guiding your content strategy, or training your sales team, these visuals serve as your roadmap to deeper customer connections. Fully customizable to reflect your brand's unique voice and style, this template adapts seamlessly to your needs, ensuring that every insight into your audience is not just informative but also visually captivating. It's an essential tool for anyone looking to enhance their understanding of their market and refine their approach to meet customer demands.


4 slides
Breast Cancer Awareness Campaign Presentation
Raise awareness with impact using the Breast Cancer Awareness Campaign Presentation. This visually engaging design uses symbolic visuals to highlight key messages, educate audiences, and inspire action. Perfect for nonprofit initiatives, educational sessions, or health campaigns. Fully editable in PowerPoint, Google Slides, Keynote, and Canva for easy customization.


5 slides
Buyer Persona Strategy Presentation
Enhance Customer Understanding! The Buyer Persona Strategy Presentation template helps analyze customer behaviors, goals, and frustrations to create targeted marketing strategies. Fully editable and compatible with PowerPoint, Keynote, and Google Slides, it’s perfect for marketers and strategists looking to optimize engagement with a modern, professional, and visually compelling layout.


6 slides
Product Development Cycles Presentation
A great product starts with a clear, engaging story—this presentation brings that journey to life. It outlines each stage of the development cycle in a simple, visual flow that helps teams communicate progress, milestones, and next steps. Perfect for strategy, planning, and updates. Fully compatible with PowerPoint, Keynote, and Google Slides.


5 slides
Green Business Sustainability Strategy
Showcase your eco-conscious roadmap with this Green Business Sustainability Strategy presentation. Featuring a 5-step, curved timeline design with nature-inspired icons, it’s perfect for environmental initiatives, CSR planning, or ESG strategy. Easily adaptable in PowerPoint, Keynote, or Google Slides for a polished, professional message.


4 slides
Decision-Making Options Presentation
Make confident choices with the Decision-Making Options template. This structured layout helps visualize various decision paths, making it ideal for strategic planning, leadership discussions, and risk assessment. Fully customizable and designed for clarity, this template works seamlessly with PowerPoint, Keynote, and Google Slides for effortless presentation and collaboration.


20 slides
Vivid Product Development Plan Presentation
Develop your product with confidence using this detailed product development plan template! Perfect for outlining features, market analysis, and competitive advantages. Ideal for product managers and teams. Compatible with PowerPoint, Keynote, and Google Slides, this template ensures your plan is clear, professional, and comprehensive. Achieve product success today!


6 slides
Funding Request Project Proposal
Visually communicate your project's financial needs using this tiered Funding Request Project Proposal slide. With a stacked layout ideal for outlining budget categories or funding stages, it’s perfect for grant applications, investor decks, or internal pitches. Fully customizable in PowerPoint, Keynote, and Google Slides.


5 slides
Financial Plan Infographics
A financial plan provides a roadmap for achieving financial goals, managing income and expenses, mitigating risks, building wealth, and preparing for the future. These infographic templates are designed to help individuals and businesses present their financial plans and strategies in a clear and concise manner. Use this to create a financial report, a business presentation, or to provide financial guidance, this template will help you communicate key financial information effectively. Compatible with Powerpoint, Keynote, and Google Slides, this makes is easy to customize with your information.


23 slides
Jigsaw User Experience Proposal Presentation
Enhance user experience with this comprehensive UX proposal template! Perfect for outlining user research, personas, and design principles. Ideal for UX/UI designers aiming to present their strategies and solutions. Compatible with PowerPoint, Keynote, and Google Slides, this template ensures your UX proposals are clear, professional, and impactful. Create exceptional user experiences today!


5 slides
Task Management and Scheduling
Stay organized and efficient with this clear task management and scheduling layout. This presentation makes it easy to prioritize assignments, allocate time slots, and track progress using a visual clock-based design. Perfect for business operations, project coordination, workflow planning, and productivity meetings. Fully customizable and compatible with PowerPoint, Keynote, and Google Slides.


7 slides
Investment Bank Infographic Presentation
An investment infographic helps investors understand complex investment concepts by presenting information in a clear and concise manner. This is a professional Investment template with all the elements you need to make a great impact. Use this presentation to help you explain a new investment opportunity, or show the benefits of your product or service. Designed for use in PowerPoint, Keynote and Google Slides, it is easy to customize and fully editable, making it a perfect starting point for any investor or financial pitch. You can change the texts, image and shapes as you wish!