


Features
- 8 Unique slides
- Fully editable and easy to edit in Microsoft Powerpoint, Keynote and Google Slides
- 16:9 widescreen layout
- Clean and professional designs
- Export to JPG, PDF or send by email


Do you have any questions?
Recommend


7 slides
Job Title Infographic
The slides displayed offer a range of stylish and clear title designs for various business and creative presentations, ideal for introducing key concepts and sections within a professional document or presentation. Each slide is crafted to represent themes such as annual reports, digital strategies, and project retrospectives, as well as specialized areas like web design, strategic planning, and SEO. The designs incorporate modern aesthetics with clean lines, bold color palettes, and minimalist graphic elements, ensuring that the titles are not only eye-catching but also effectively convey the subject matter. This variety allows presenters to choose a slide that best fits the tone and topic of their presentation, making each section distinct and engaging for the audience. These slides are perfect for professionals looking to present complex information in an accessible and visually appealing format.


5 slides
Fitness Benefits Infographics
Fitness Benefits refer to the positive effects that physical activity and exercise can have on a person's health and well-being. This Infographic is a visual representation of the benefits that people can derive from regular exercise and physical activity. It is a great tool to educate people about the importance of staying fit and active, as well as inspire them to start or continue their fitness journey. Include additional information, such as tips for staying motivated, ideas for different types of exercise, and resources for further learning or support. This template can be a powerful tool to promote the importance of fitness and motivate people.


5 slides
Visual Data Representation Bubble Map
Display complex data in a clean, engaging format with this Visual Data Representation Bubble Map. Ideal for highlighting key points, data clusters, or relationships, each bubble can be customized to match your topic. Perfect for presentations in business, research, or strategy—fully editable in PowerPoint, Keynote, and Google Slides.


8 slides
Business Gap Analysis Framework Presentation
Identify key business gaps with this Business Gap Analysis Framework presentation template! Featuring a structured layout that highlights the current state, desired state, and actionable steps to bridge the gap, this template is perfect for strategic planning, performance reviews, and business growth discussions. Fully customizable and compatible with PowerPoint, Keynote, and Google Slides.


6 slides
USA Market Reach Heatmap Presentation
Showcase your geographic impact with this USA Market Reach Heatmap template. Ideal for visualizing regional data, customer density, or sales performance. Features pinpoint markers, editable callouts, and a clean U.S. map layout. Fully customizable in PowerPoint, Keynote, and Google Slides—perfect for marketing, sales, or expansion strategy presentations.


7 slides
Project Management Tools Infographic
Project management is the discipline of planning, organizing, securing, and managing resources to achieve specific goals within a defined time frame and budget. This visually appealing and informative template allows you to represent project lifecycles, key milestones, team roles, and more, making complex project data easily digestible. Fully customizable and compatible with Powerpoint, Keynote, and Google Slides. Illustrate the project lifecycle from initiation to completion for a comprehensive understanding. Utilize this template to effectively show project progress and objectives, ensuring your audience is informed throughout the project's lifecycle.


5 slides
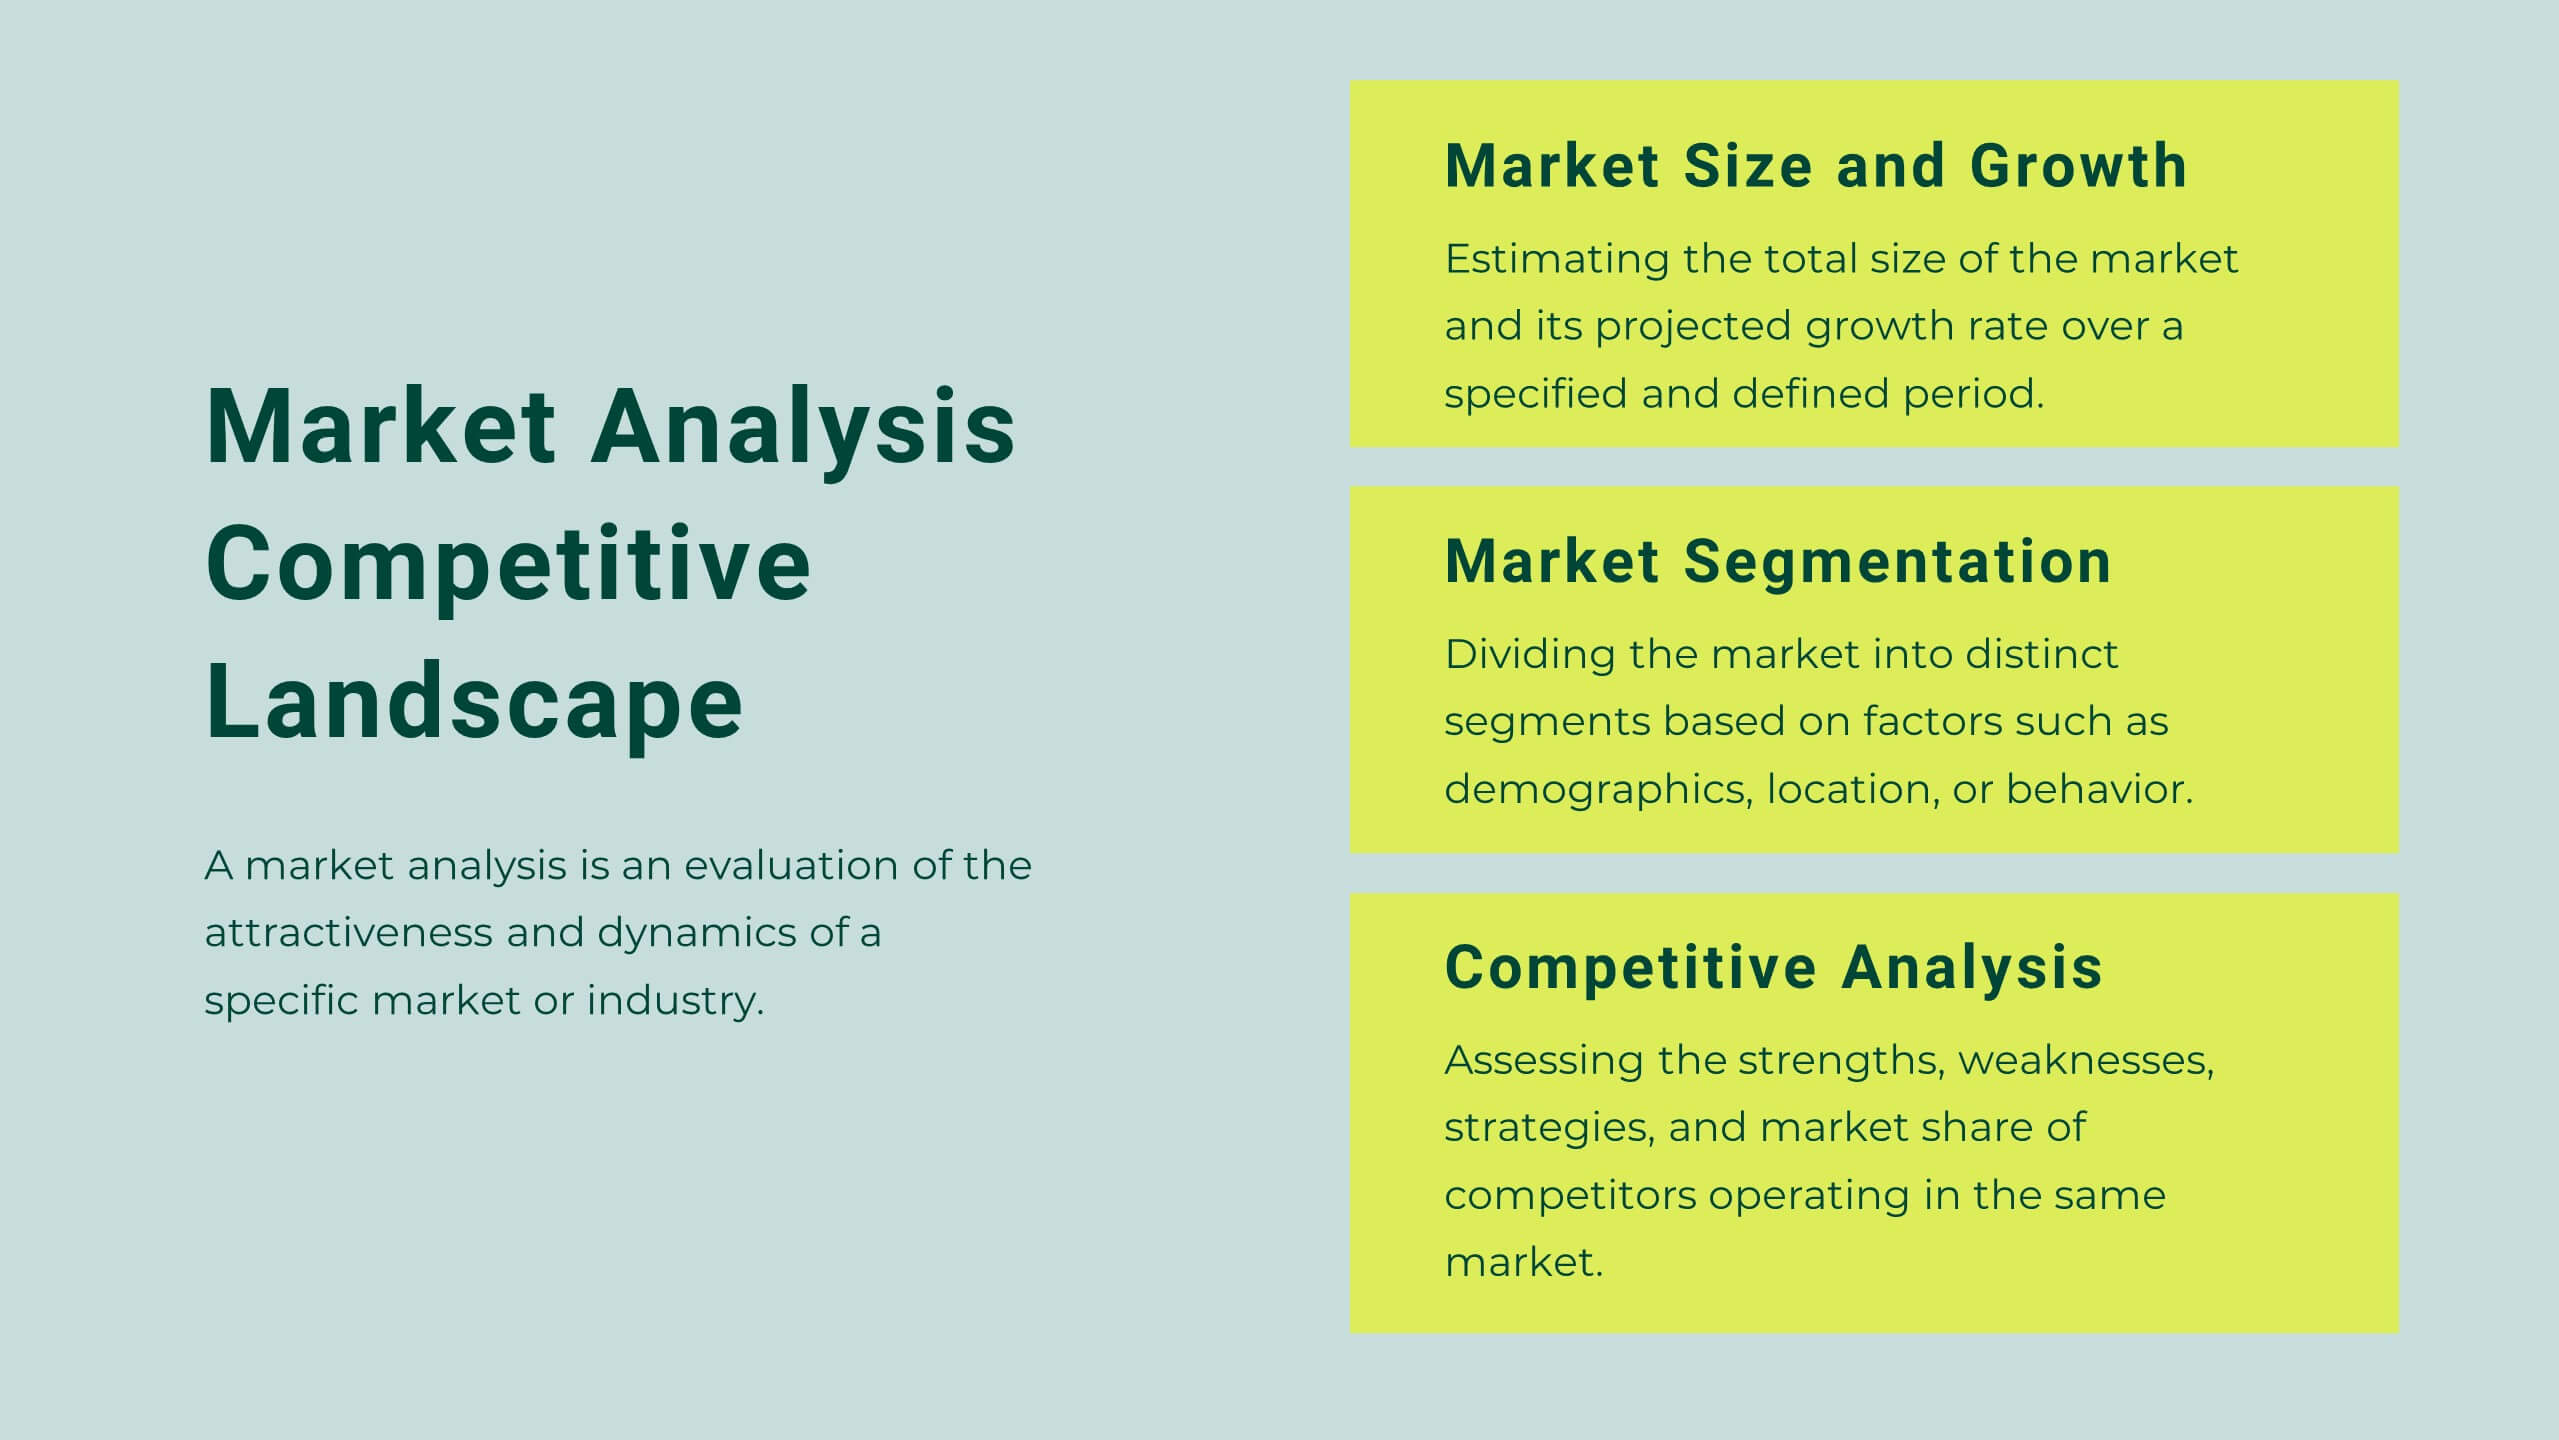
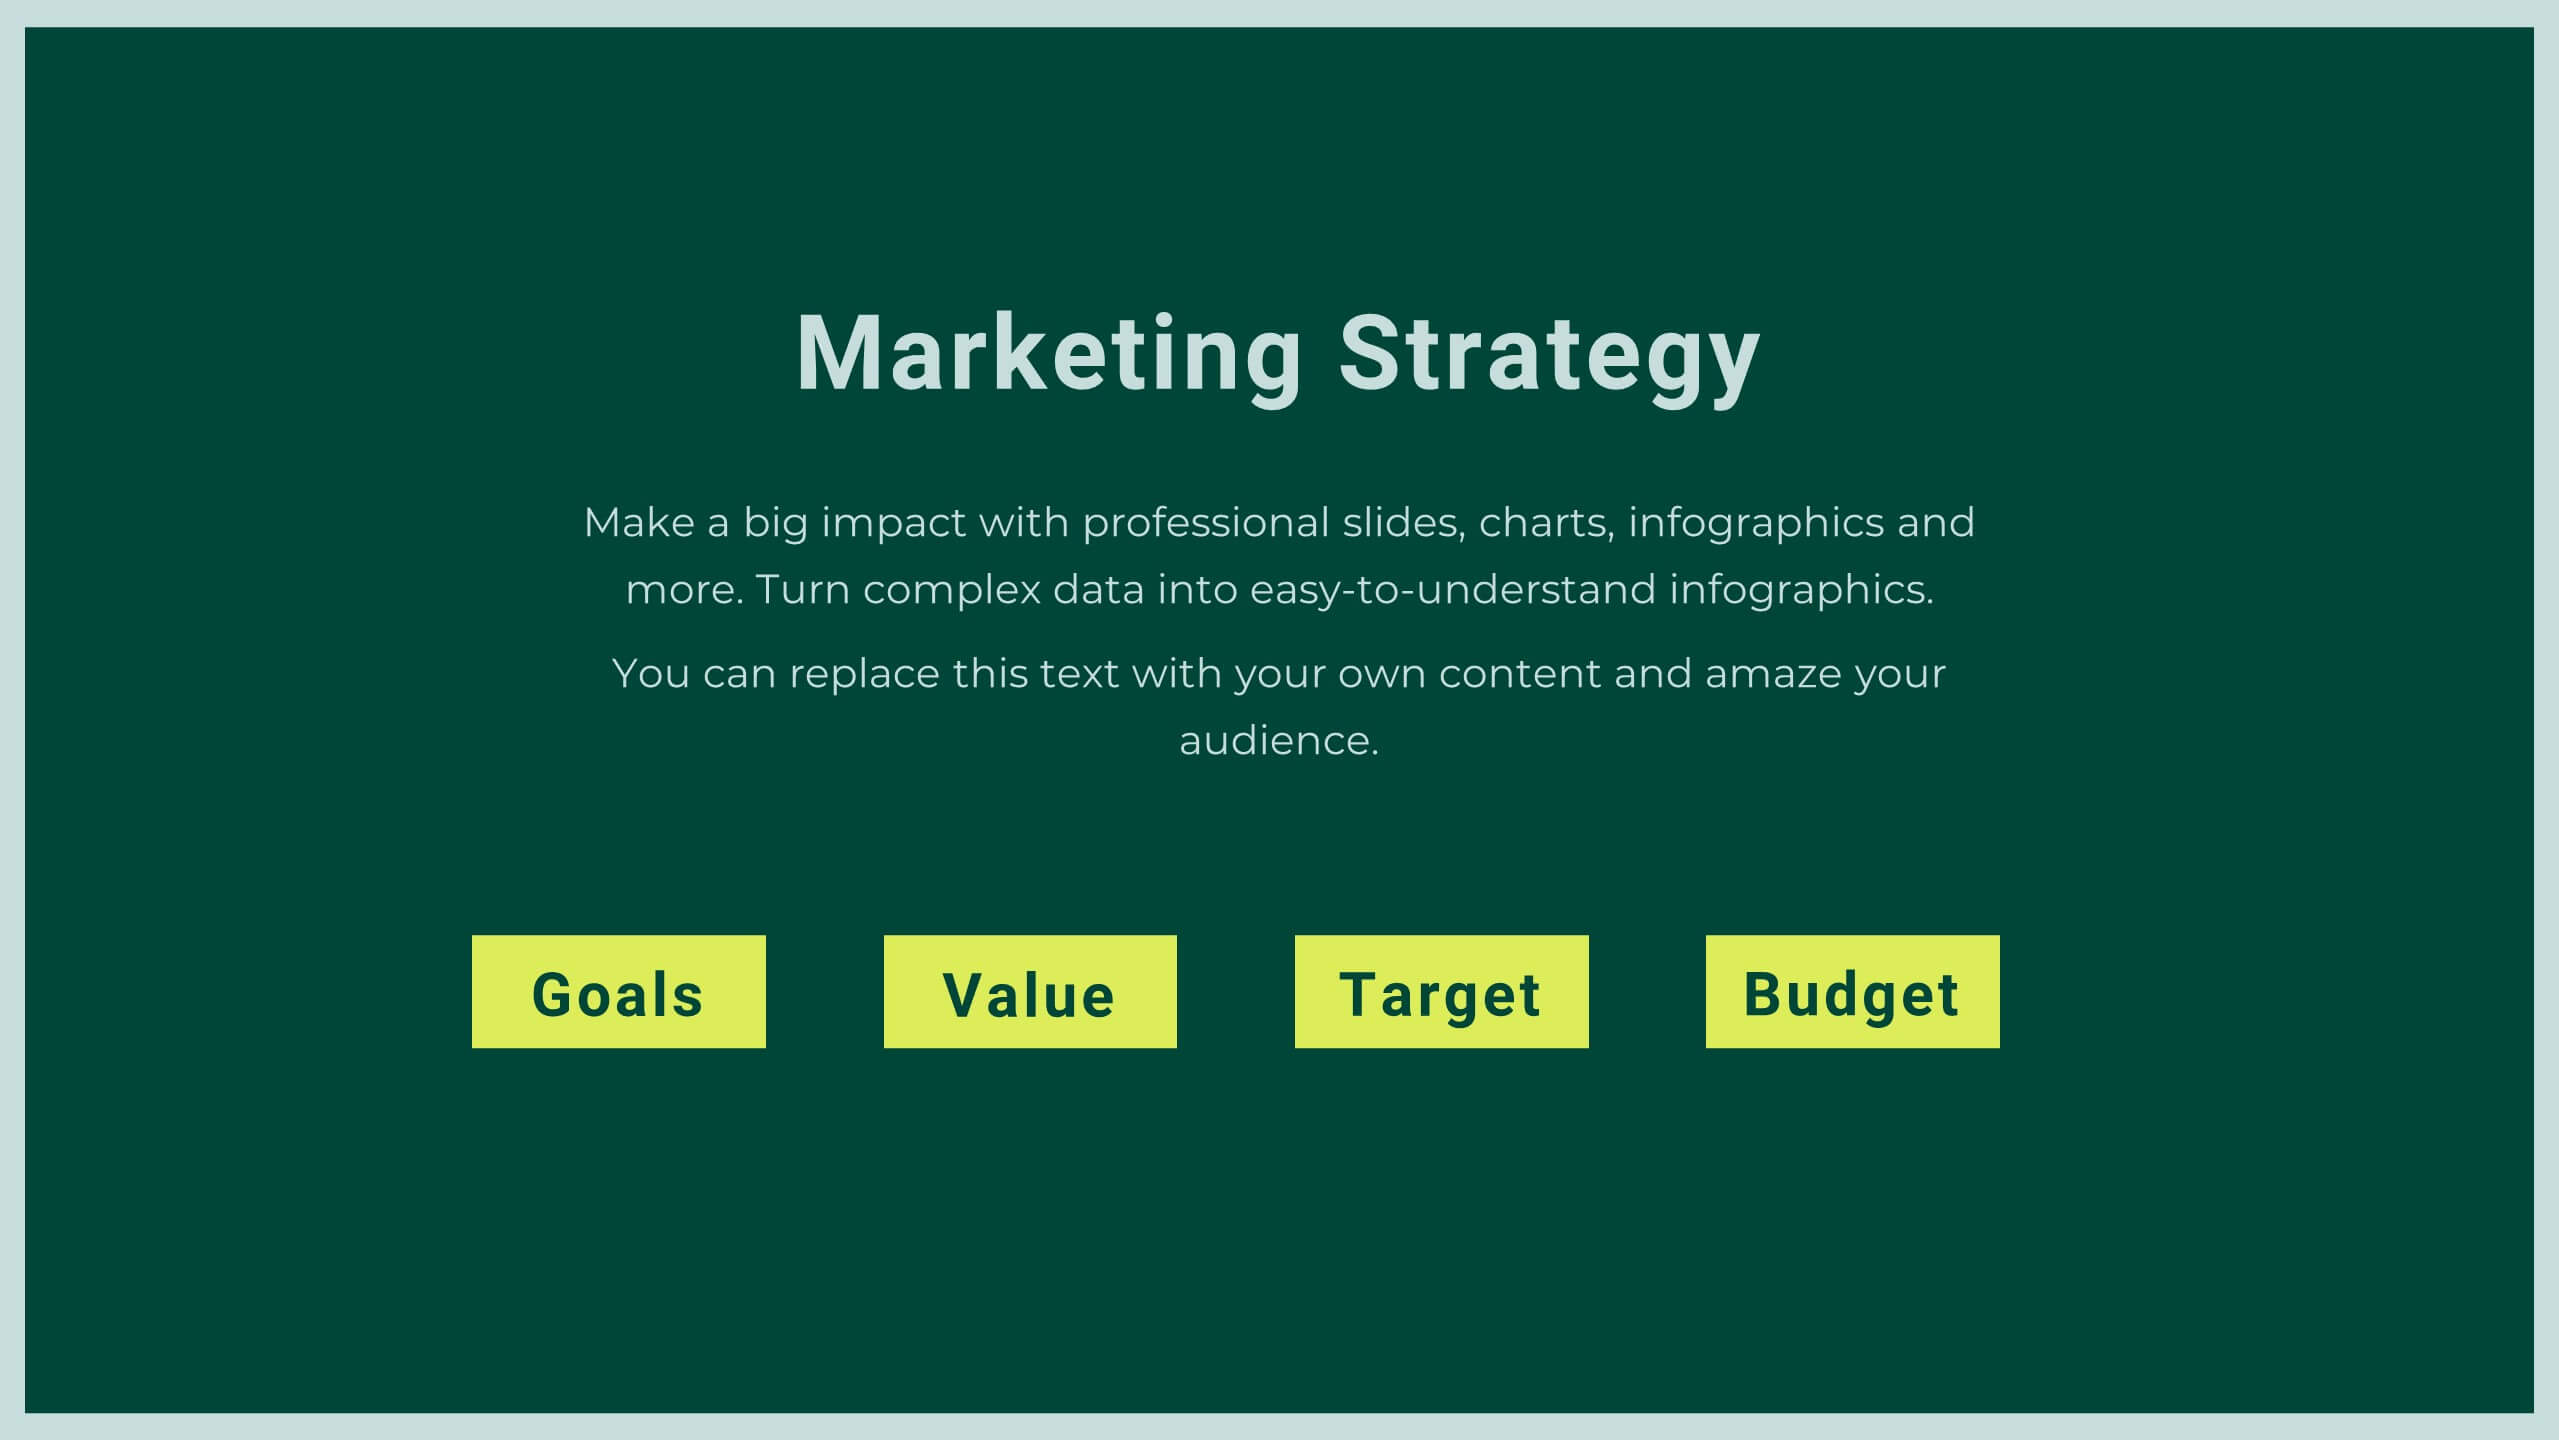
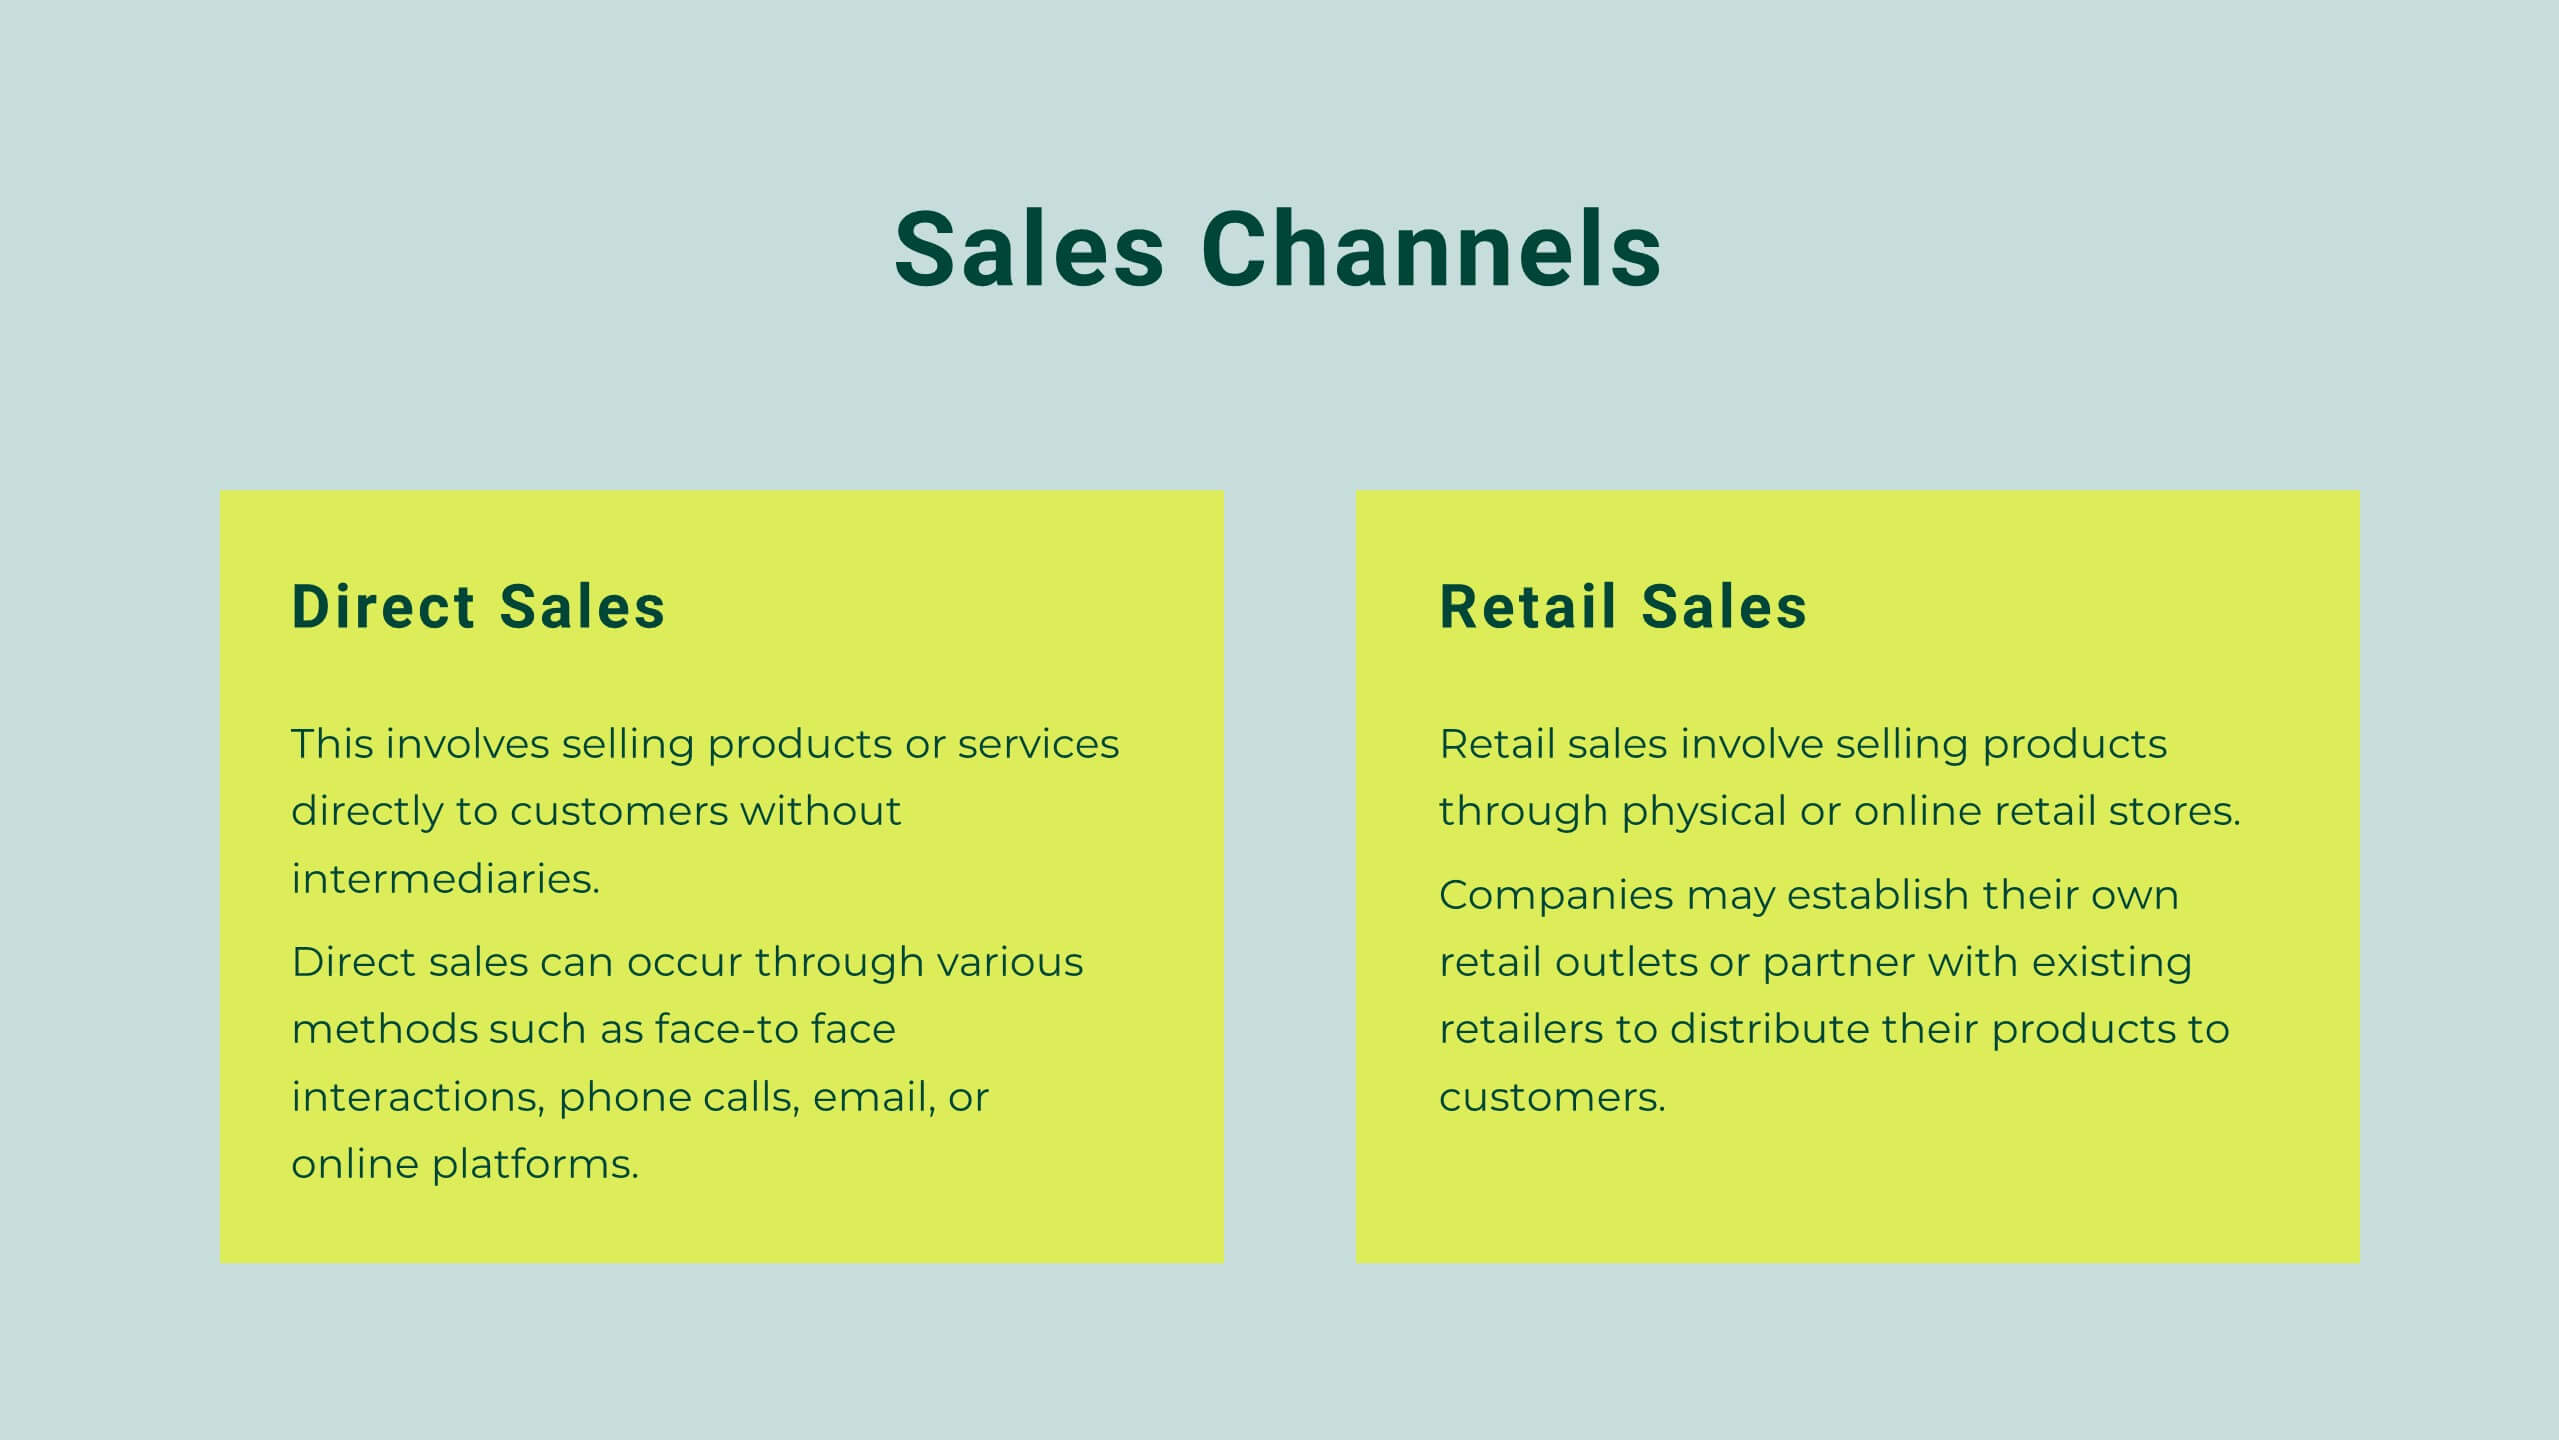
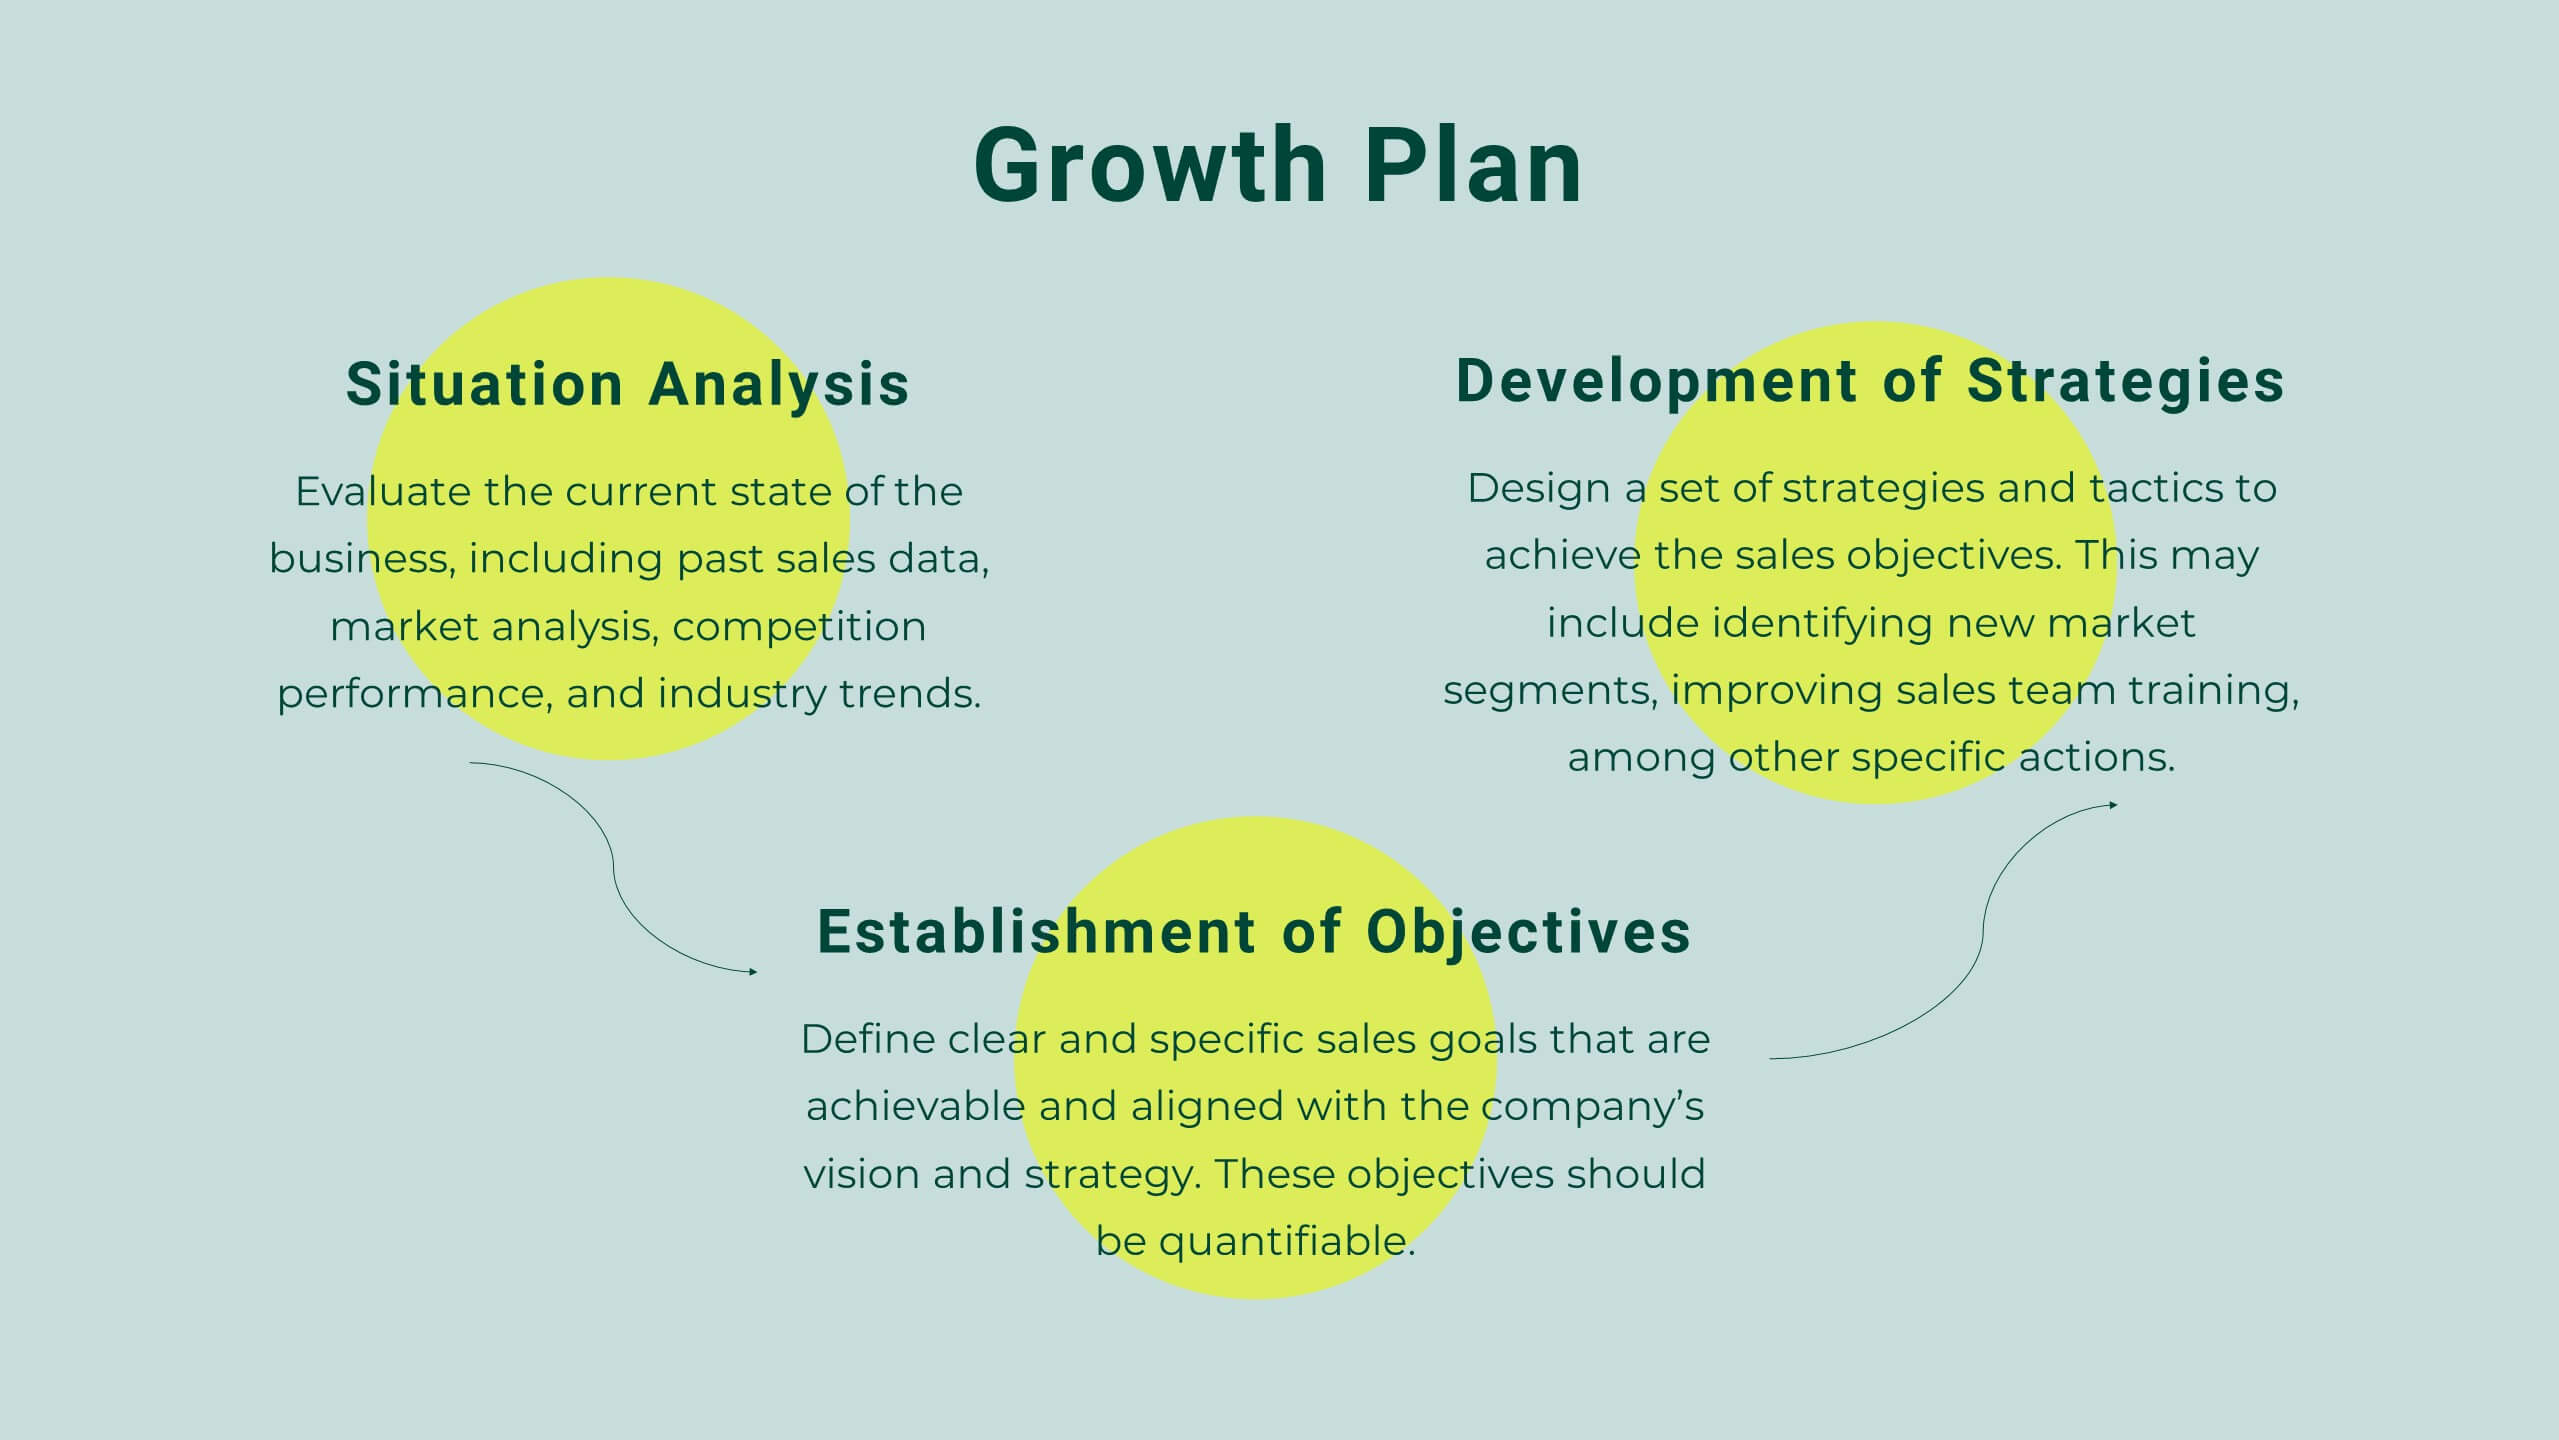
Market Growth Strategy
Break down your strategic growth roadmap with this layered Market Growth Strategy template. Each stack represents a phase in your market expansion journey—ideal for illustrating plans, KPIs, or product scaling. Fully editable and compatible with PowerPoint, Keynote, and Google Slides for seamless use across platforms.


4 slides
Food Business Concept Pitch Presentation
Bring your culinary vision to life with the Food Business Concept Pitch Presentation. This unique avocado-shaped layout helps you outline up to four key ideas—from menu innovation to service strategy. Perfect for chefs, restaurateurs, or food startups. Fully editable in PowerPoint, Canva, and Google Slides for easy customization.


6 slides
Strategic Planning Spider Diagram Presentation
Present your strategy with clarity using the Strategic Planning Spider Diagram Presentation. This template offers a bold, visual way to showcase performance across six core categories, helping teams align on goals and priorities. Easily customizable and compatible with PowerPoint, Keynote, and Google Slides. Ideal for executives and planners.


20 slides
Visionix Project Management Plan Presentation
Streamline your project planning with this clean and modern presentation template. Covering key aspects such as objectives, timeline, budget breakdown, and risk management, it helps you organize and communicate your project strategy effectively. Ideal for business teams and project managers. Compatible with PowerPoint, Keynote, and Google Slides for easy customization.


8 slides
Air Travel Safety and Operations Presentation
Capture your audience’s attention with this aviation window-inspired layout, designed to visualize safety protocols or operational steps in air travel. Featuring four distinct segments arranged like a view through a plane window, it’s ideal for airline safety briefings, operational workflows, or compliance overviews. Fully editable in PowerPoint, Keynote, and Google Slides.


4 slides
Blue Ocean Innovation Approach Presentation
The Blue Ocean Innovation Approach Presentation offers a clear and modern layout for visualizing strategic innovation. Featuring layered diamond shapes representing Cost, Value Innovation, and Buyer Value, this slide helps explain how businesses can move beyond competition by creating new market spaces. Each section includes editable titles and text boxes, ideal for outlining strategies, key concepts, or benefits. Designed for consultants, strategists, and business leaders, the template is fully customizable in PowerPoint, Keynote, and Google Slides. Perfect for presenting blue ocean thinking in a polished, professional format.


22 slides
Quantum Scientific Research Presentation
Present your scientific research with this comprehensive and professional template! Perfect for detailing research objectives, methodology, and key findings. Ideal for researchers and academics aiming to share their work clearly and effectively. Compatible with PowerPoint, Keynote, and Google Slides, this template ensures your scientific presentations are thorough, engaging, and visually appealing.


21 slides
Nimbus Startup Growth Plan Presentation
Supercharge your startup's growth with this vibrant presentation template! Ideal for outlining your business plan, it includes slides for mission, market analysis, and financial overview. Capture investor attention with clear visuals and compelling content. Compatible with PowerPoint, Keynote, and Google Slides for a seamless presentation experience on any platform.


8 slides
Professional Title Slide Presentation
Start your presentation with impact using a bold, modern cover design that captures attention instantly. Perfect for introducing reports, creative projects, or business pitches, this layout combines professional typography with clean visuals for a polished first impression. Fully editable in PowerPoint, Keynote, and Google Slides for seamless customization.


7 slides
Operational Risk Management Infographic
Dive into the methodical domain of risk management with our sleek risk management infographic. Cloaked in varying blue tones, our template embodies the serenity and stability that effective risk management brings to operations. Enhanced with precise infographics, clear icons, and relevant image placeholders, it transforms complex risk analysis into easily comprehensible visual insights. Flawlessly crafted for Powerpoint, Keynote, or Google Slides. A pivotal tool for business strategists, operations managers, financial analysts, or any organization aiming to fortify its operational resilience. Strategize with clarity; let every slide be a shield against potential pitfalls.


5 slides
Elegant Abstract Watercolor Layout Presentation
Add artistic flair to your message with the Elegant Abstract Watercolor Layout Presentation. Featuring hand-drawn brush elements and delicate color drops, this design blends creativity with clarity. Ideal for storytelling, brand values, or conceptual visuals. Fully editable in PowerPoint, Keynote, and Google Slides for stylish and customizable presentations.