


Features
- 4 Unique slides
- Fully editable and easy to edit in Microsoft Powerpoint, Keynote and Google Slides
- 16:9 widescreen layout
- Clean and professional designs
- Export to JPG, PDF or send by email


Do you have any questions?
Recommend


6 slides
Business RAPID Model Diagram Presentation
Turn decision-making into a visual story with this bold, professional diagram that highlights each stage of responsibility and collaboration. Designed to simplify complex workflows, it’s perfect for outlining business strategies, performance reviews, or team structures. Fully compatible with PowerPoint, Keynote, and Google Slides for easy editing and presentation.


5 slides
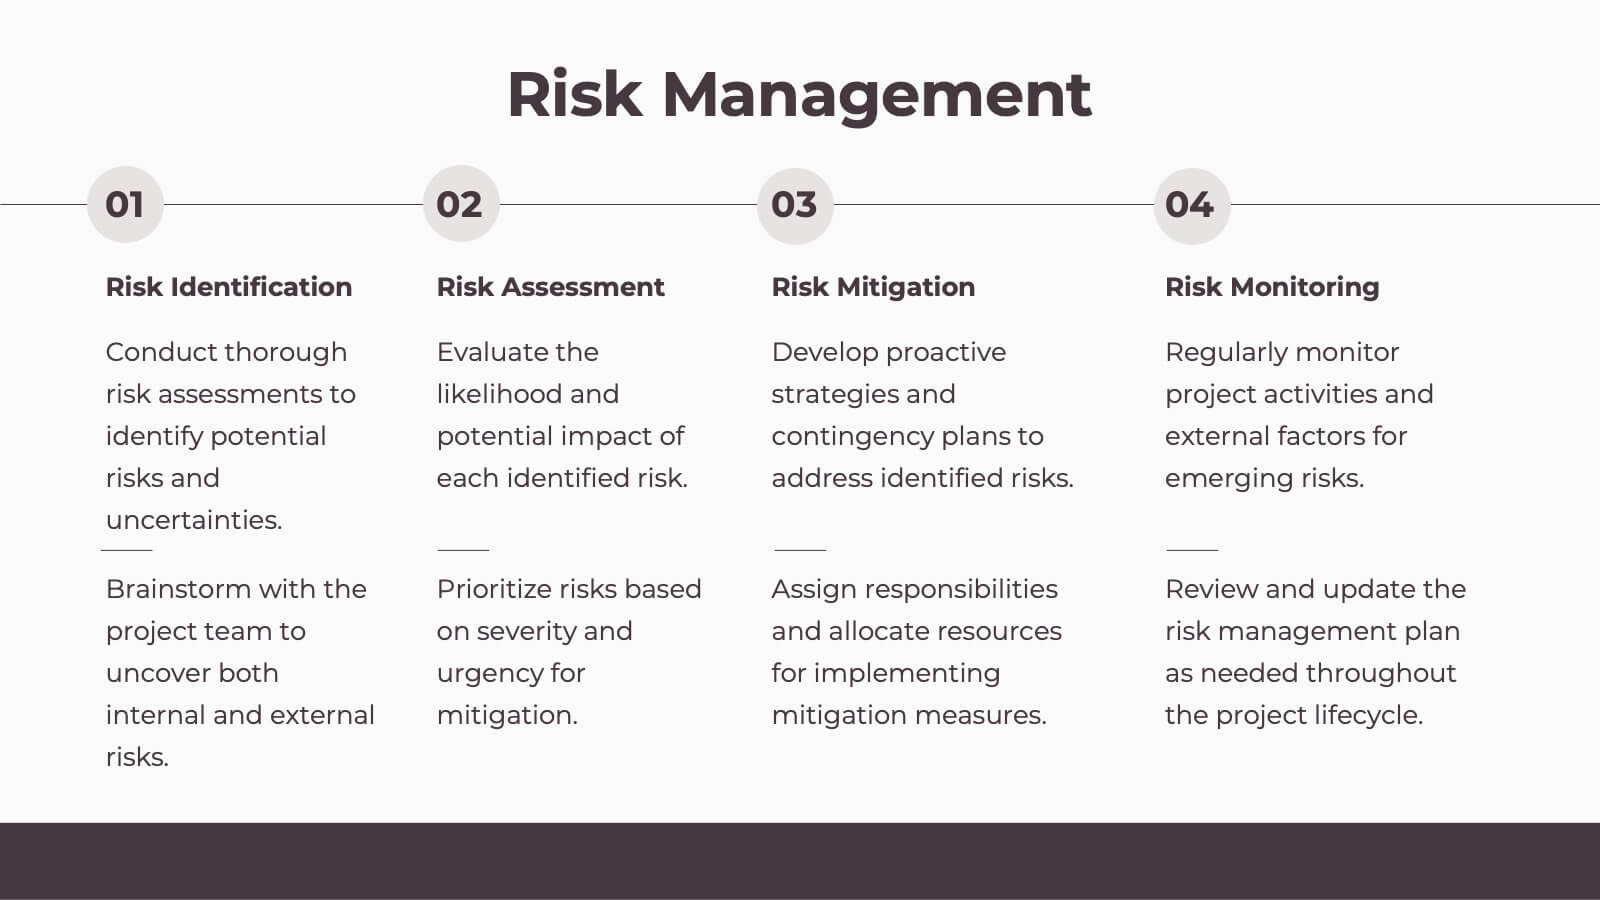
Cybersecurity Risk Management Presentation
Simplify your security strategy with this clean, lock-themed visual. This layout organizes five key points with corresponding icons, perfect for presenting IT safeguards, data protection plans, or risk response actions. The vertical structure ensures clarity, while the design remains professional and editable in PowerPoint, Keynote, and Google Slides.


5 slides
Residential Market Trends Overview Presentation
Track market insights with clarity using the Residential Market Trends Overview Presentation. Featuring a clean, linear layout with four content points and a central house icon, this slide is ideal for showcasing housing data, price trends, investment insights, or neighborhood developments. Fully editable in Canva, PowerPoint, Keynote, and Google Slides—perfect for real estate pros, analysts, or urban planners.


7 slides
Mind-Brain Concept Diagram Presentation
Visualize cognitive processes with the Mind-Brain Concept Diagram. This engaging infographic presents six key elements surrounding a central brain illustration, making it ideal for psychology, neuroscience, or decision-making presentations. Fully editable with customizable text, colors, and icons. Compatible with PowerPoint, Keynote, and Google Slides for seamless integration.


5 slides
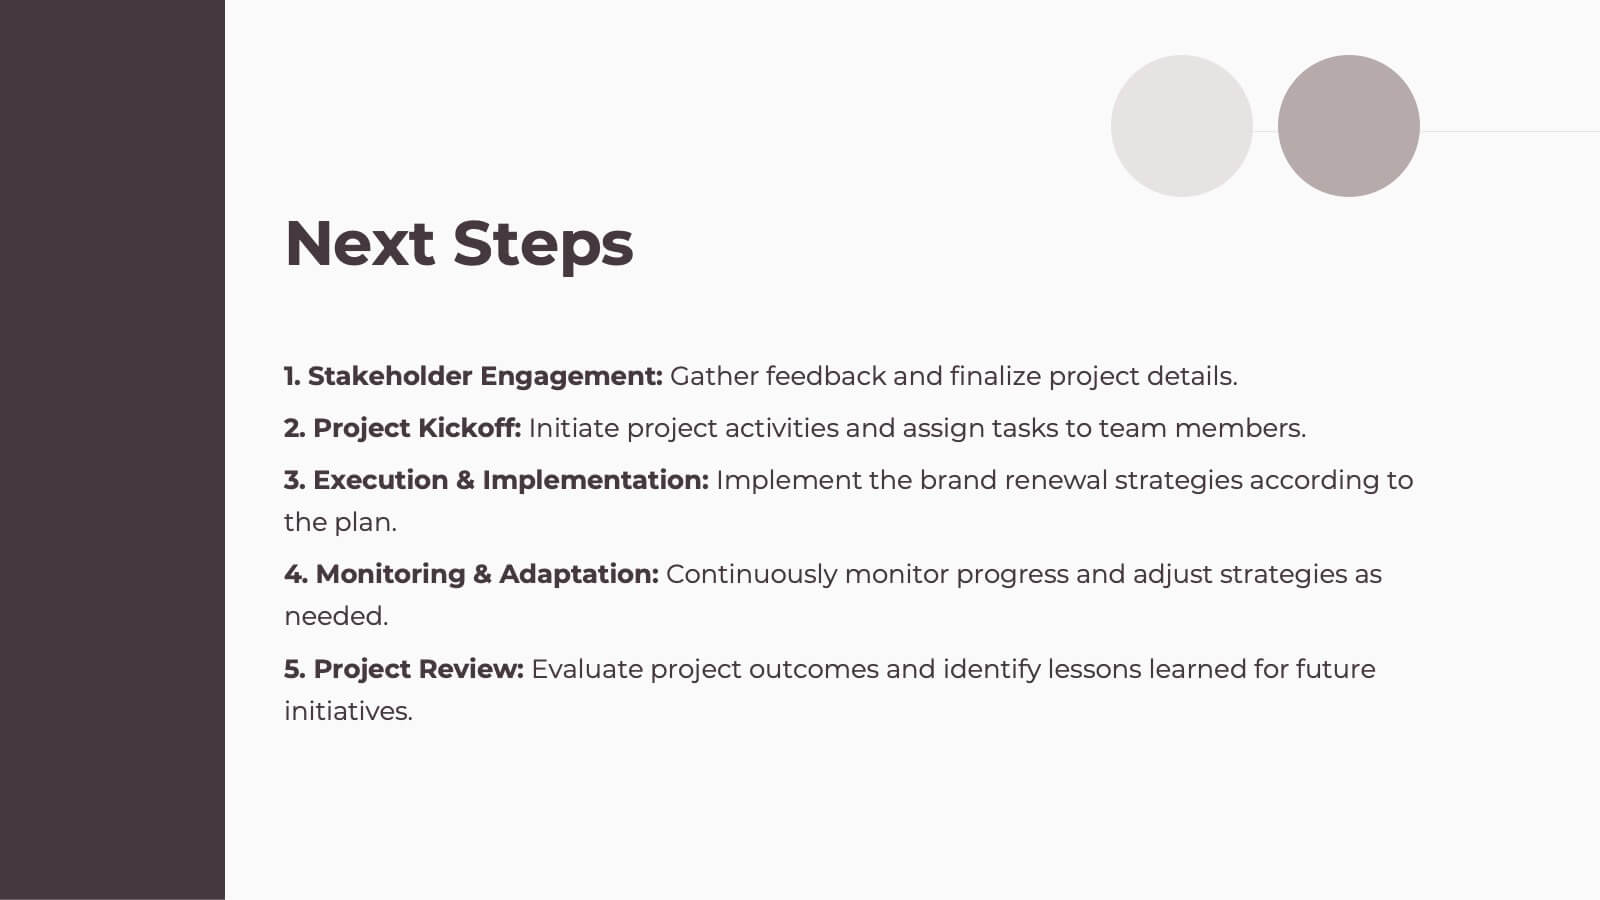
Project Execution Next Steps Presentation
Streamline your workflow with the Project Execution Next Steps Presentation template. Designed for project managers and teams, this visual slide helps break down execution phases into clear, actionable steps. The connected chain layout ensures smooth project tracking, making it easy to communicate progress and responsibilities. Fully customizable in PowerPoint, Keynote, and Google Slides for seamless project planning and execution.


7 slides
TAM SAM SOM Analysis Infographic Presentation
A TAM SAM SOM Infographic is a visual representation of a business concept that is used to describe a company's potential market size and growth opportunities. TAM stands for Total Addressable Market, SAM stands for Serviceable Addressable Market, and SOM stands for Serviceable Obtainable Market. This template includes a series of concentric circles, rectangles, and other shapes with the TAM being the largest circle, followed by the SAM and SOM. This infographic also includes text, icons, and other graphic elements to help illustrate key points and communicate your growth strategy.

1 slide
Professional Presentation Cover Slide Presentation
Make a bold first impression with this sleek and modern cover slide designed to introduce your presentation with confidence. Its clean layout and striking geometric shapes create a polished look while giving viewers a clear sense of professionalism. Perfect for business, marketing, or project presentations, and fully compatible with PowerPoint, Keynote, and Google Slides.


21 slides
Spectrum Project Timeline Presentation
Plan and execute your projects with precision using this detailed project plan template! Perfect for outlining objectives, timelines, and resource allocation. Ideal for project managers and teams aiming to ensure successful project delivery. Compatible with PowerPoint, Keynote, and Google Slides, this template keeps your project organized, clear, and on track. Ensure project success!


6 slides
Investment Trust Infographic
An investment trust, also known as a closed-end fund, is a type of collective investment vehicle that pools funds from multiple investors to invest in a diversified portfolio of assets. This Infographic template visually communicates key information about investment trusts, which are financial vehicles from multiple investors to invest in a diversified portfolio of assets. This template highlights different types of investment, such as trusts, fixed-income trusts, or sector-specific trusts. The icons and images are included to represent each type. This infographic is fully customizable and compatible with Powerpoint, Keynote, and Google Slides.


26 slides
Operational Efficiency Tips Purple Presentation
Optimize your team's workflow and showcase your strategies for improved performance with this operational efficiency template. The vibrant purples and dynamic design invite viewers into a world where streamlined processes and clear objectives lead to success. Lay out the steps of your action plan, from the CEO's vision to the team's execution, with a variety of slides designed for clear communication. Charts and diagrams turn complex data into easy-to-follow visuals, while mockups provide a real-world view of your tools and platforms. Tailored for use in popular presentation software, this set of slides is an excellent aid for managers and consultants aiming to present plans that boost productivity and cut down waste. It’s all about making the complex simple and achieving more with less, helping your audience see the path to a leaner and more effective operation.


5 slides
Business Growth Cycle Presentation
Illustrate your company’s journey with the Business Growth Cycle slide. This dynamic layout features four sleek arrow segments that represent each phase of growth—from initiation to expansion. Color-coded steps and minimalist icons help guide the audience through your strategy clearly and efficiently. Ideal for outlining roadmaps, business stages, or workflow transitions. Fully editable and compatible with PowerPoint, Keynote, and Google Slides.


7 slides
Cycle Infographic Presentation Template
A cycle infographic is a visual representation of a repeating pattern of events. This template can be used to show the stages of a process or the sequence of events that make up a cycle. The purpose of this cycle infographic is to provide a clear and easy-to-understand illustration of a repeating pattern, helping to clarify the steps involved and to show the interrelationships between different elements. This well-designed cycle infographic can help you identify areas for improvement, improve communication and collaboration, and support decision-making by providing a view of the cycle.


4 slides
Healthcare Procedure and Diagnosis Presentation
Simplify medical communication with the Healthcare Procedure and Diagnosis Presentation. Featuring clean visuals like syringes, hearts, and med kits, this layout is ideal for outlining treatment stages, clinical processes, or patient care steps. Perfect for hospitals, clinics, or healthcare startups. Fully editable in PowerPoint, Keynote, Google Slides, and Canva.


7 slides
Customer Journey Stages Infographic Presentation
A Customer Journey consists of a series of interactions that occur over time between your company and the customer. Our template uses a colorful color scheme and style to present a customer journey. This communicates how the customer moves through their process. The layout allows you to customize each text box with your own text. The stages are color coded, making it easy for you to identify them. This template is designed to provide the most up-to-date research and analytical data so you can effectively engage and connect with your audience. Capture your customer's journey with this template!


7 slides
Health Science Infographic
Dive deep into the realm of health science with our health science infographic. Merging the meticulousness of a laboratory with health, this infographic is crafted in pristine white complemented by refreshing green shades. The design captures the essence of both the clinical and nurturing facets of health science. Integrated within the template are tailored graphics symbolizing various aspects of health science. Compatible with PowerPoint, Keynote, and Google Slides. The icons are designed to convey complex scientific concepts with clarity, while the strategically placed image placeholders allow for the incorporation of real-life visuals or explanatory diagrams.


4 slides
Freight & Logistics Route Planning Presentation
Track every mile with this smart and stylish logistics flowchart. Visualize freight movement across air, sea, rail, and road using bold, intuitive icons and directional arrows. A great fit for supply chain managers and route optimization strategies. Easily customizable in PowerPoint, Keynote, and Google Slides.


5 slides
Nutrition & Health Infographics
Nutrition & Health are essential aspects of a person's well-being. Good nutrition habits provide the nutrients that the body needs to function optimally. These infographics are visual representations of information related to the relationship between diet, exercise, and overall health. They are designed to provide concise, easily digestible information that can help people make informed decisions about their diet and lifestyle choices. Nutrition and health infographics can serve as a valuable tool for individuals looking to improve their overall health and well-being through informed dietary choices.