


Features
- 7 Unique slides
- Fully editable and easy to edit in Microsoft Powerpoint, Keynote and Google Slides
- 16:9 widescreen layout
- Clean and professional designs
- Export to JPG, PDF or send by email


Do you have any questions?
Recommend


7 slides
Work From Home Jobs Infographic Presentation
Working from home provides businesses with increased flexibility and can help ensure continuity of operations during times of disruption. This template is a great way to create a infographic about work from home jobs, or if you want to market your own work at home business. This template is easy to customize and full of useful design elements and tools that make it very easy to create stunning presentations. It includes a title slide with vibrant background colors for each section and a clean layout design. This template will help you make your own unique presentation in just minutes!

20 slides
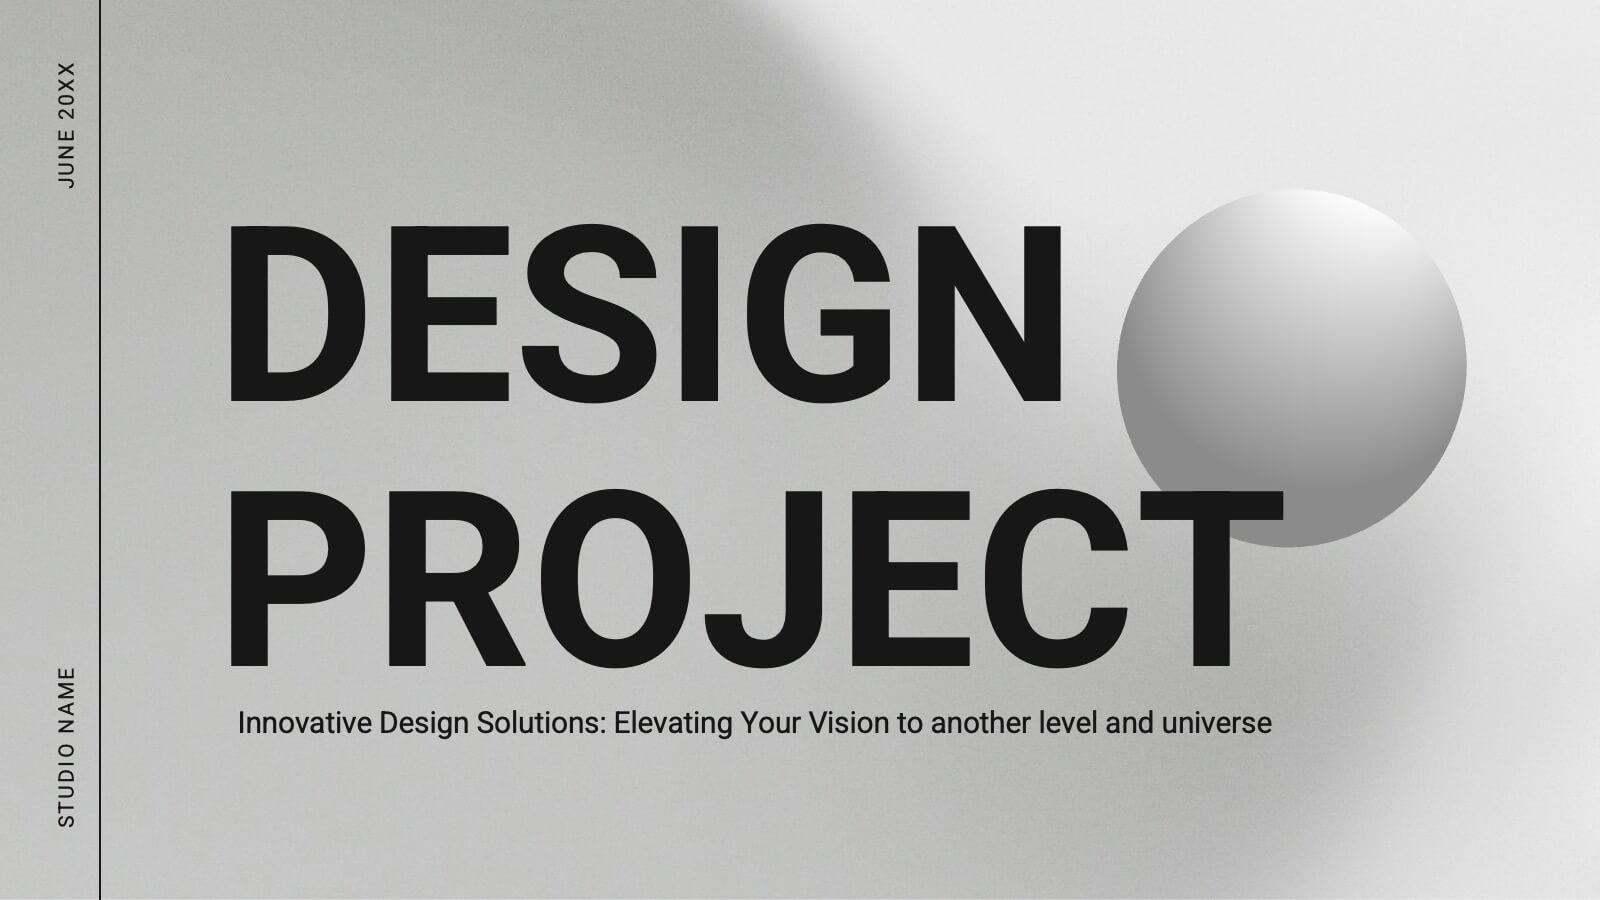
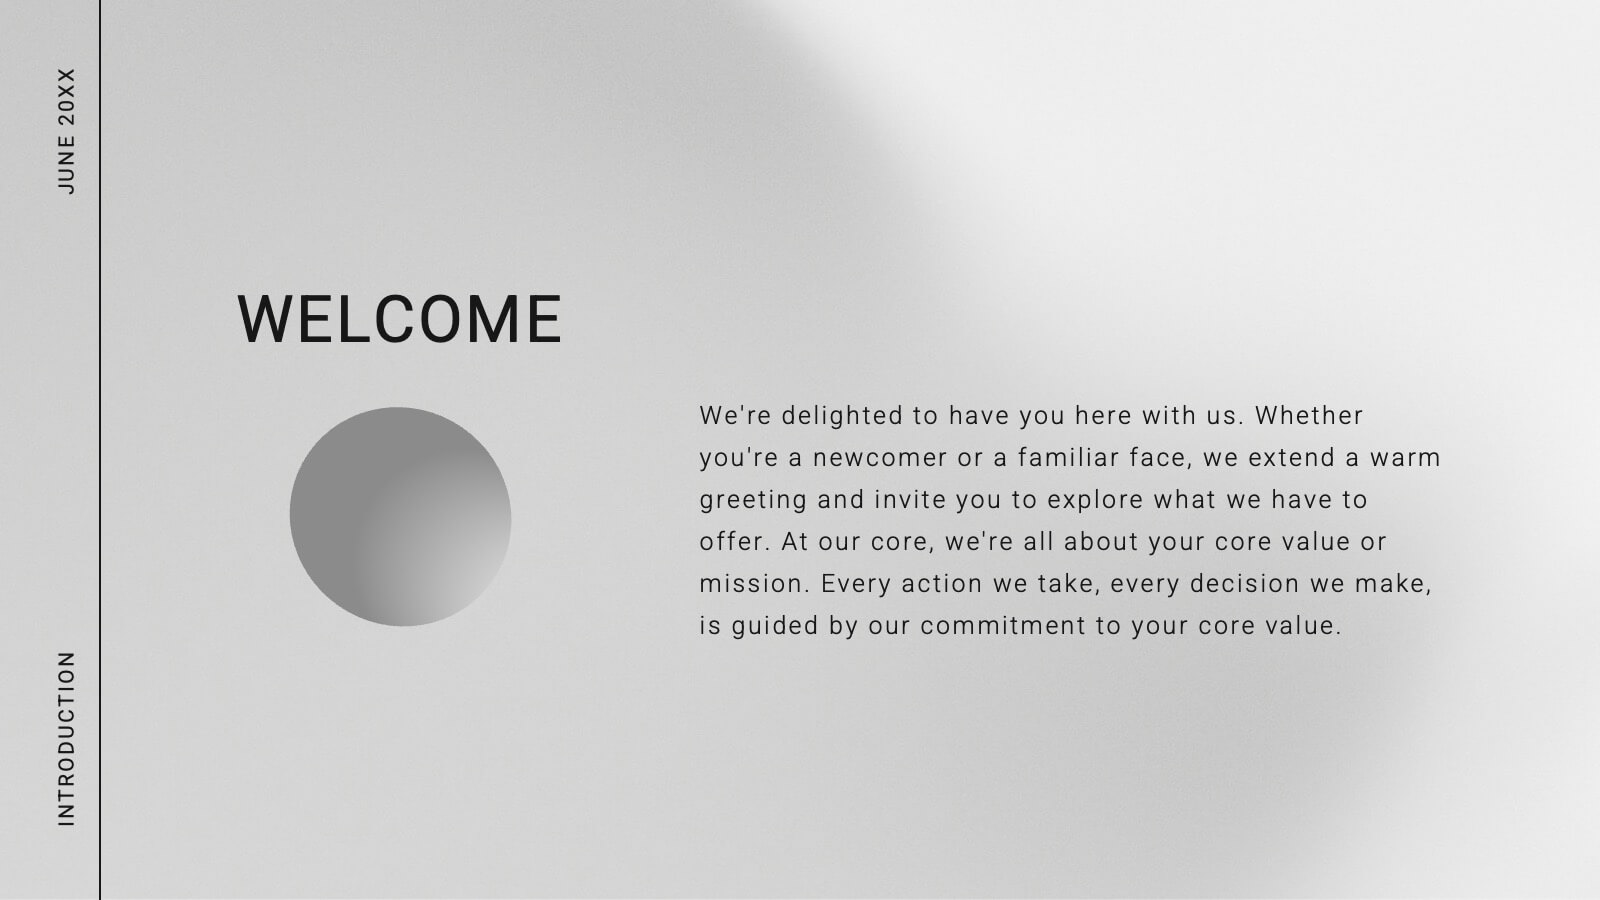
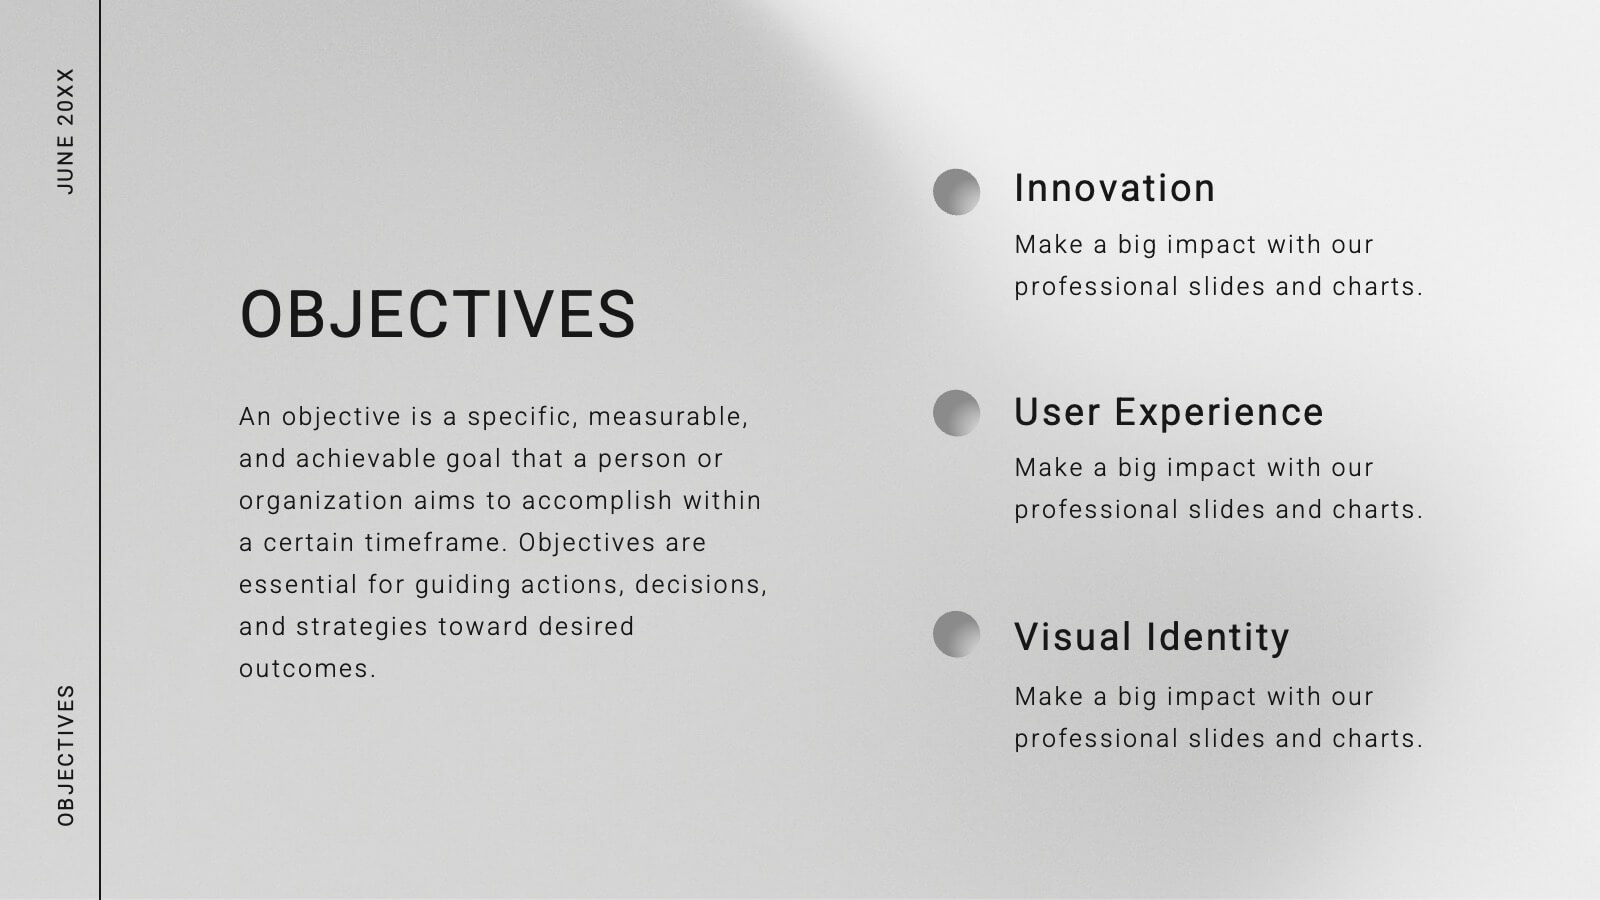
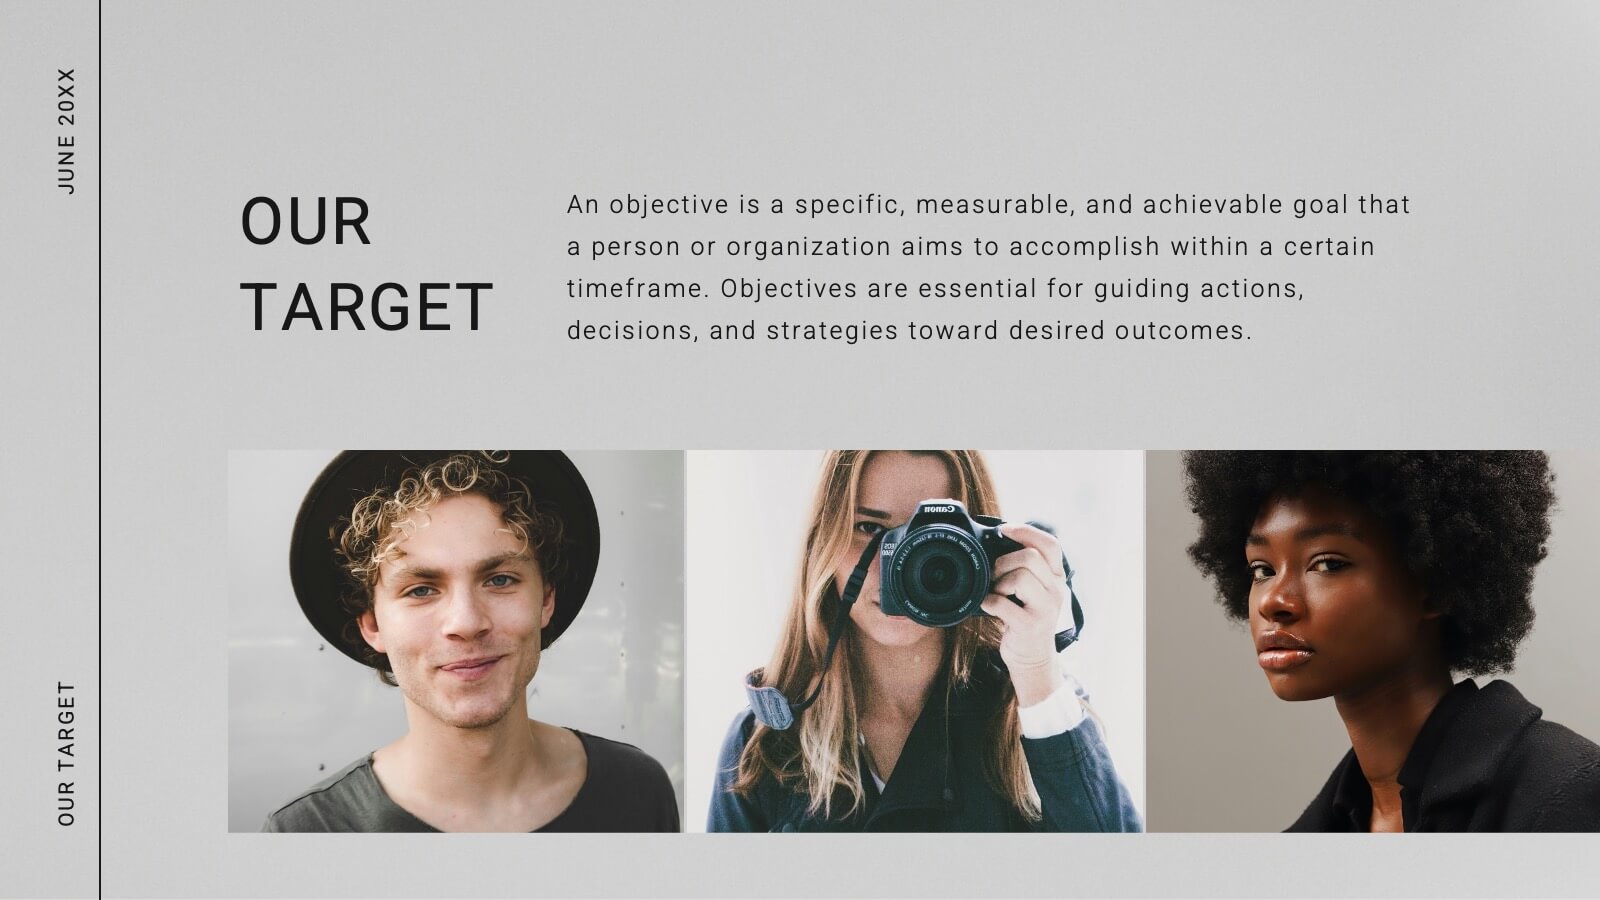
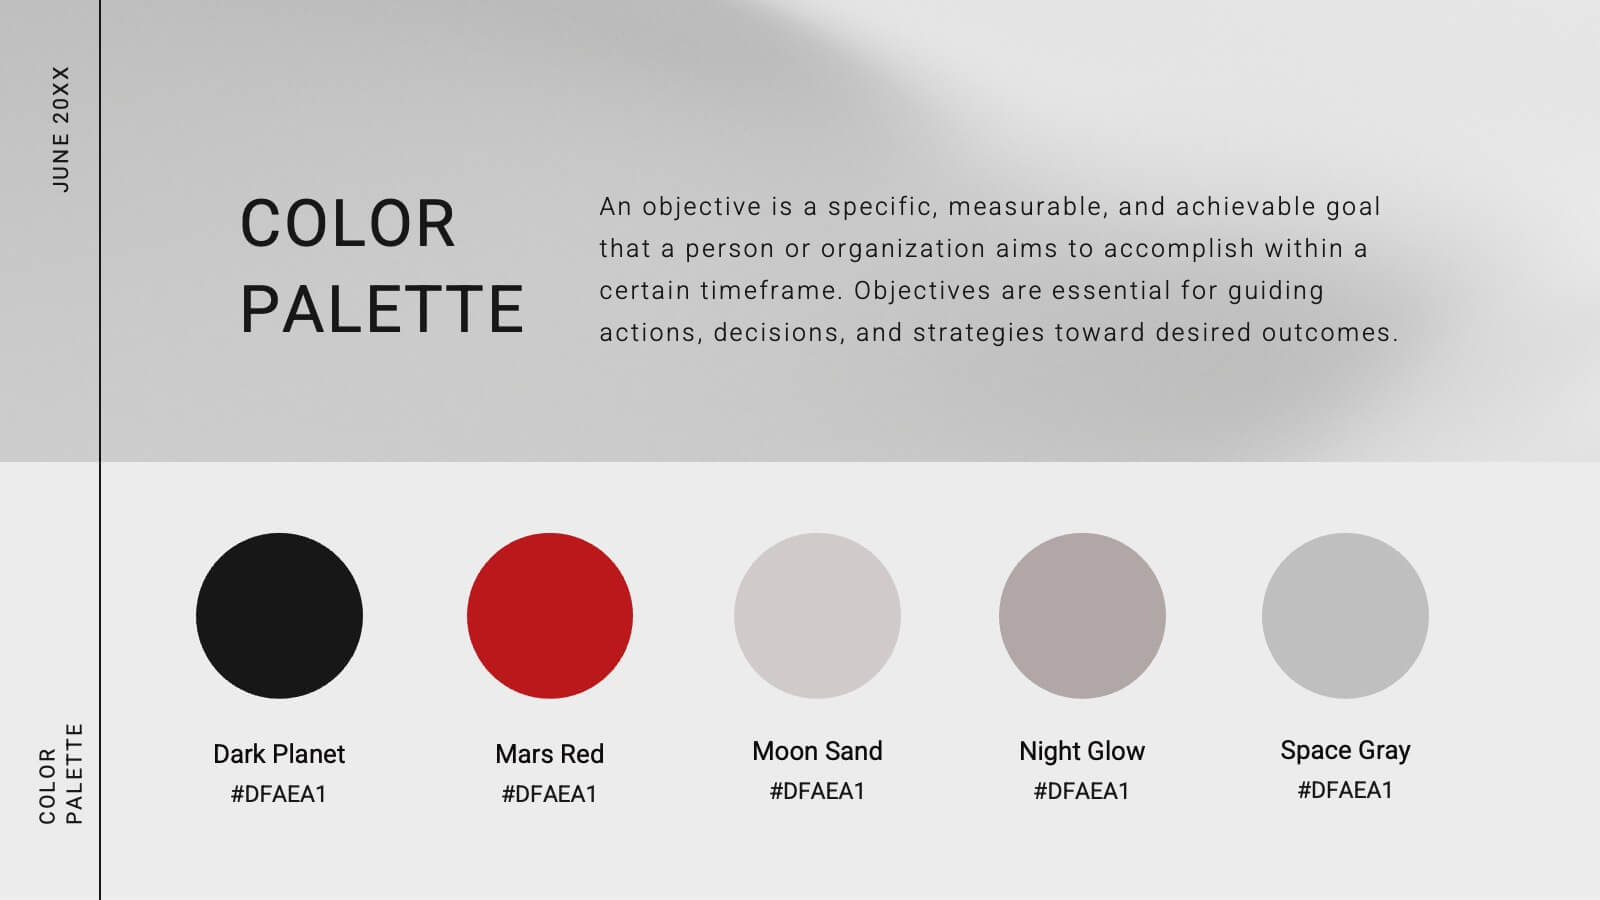
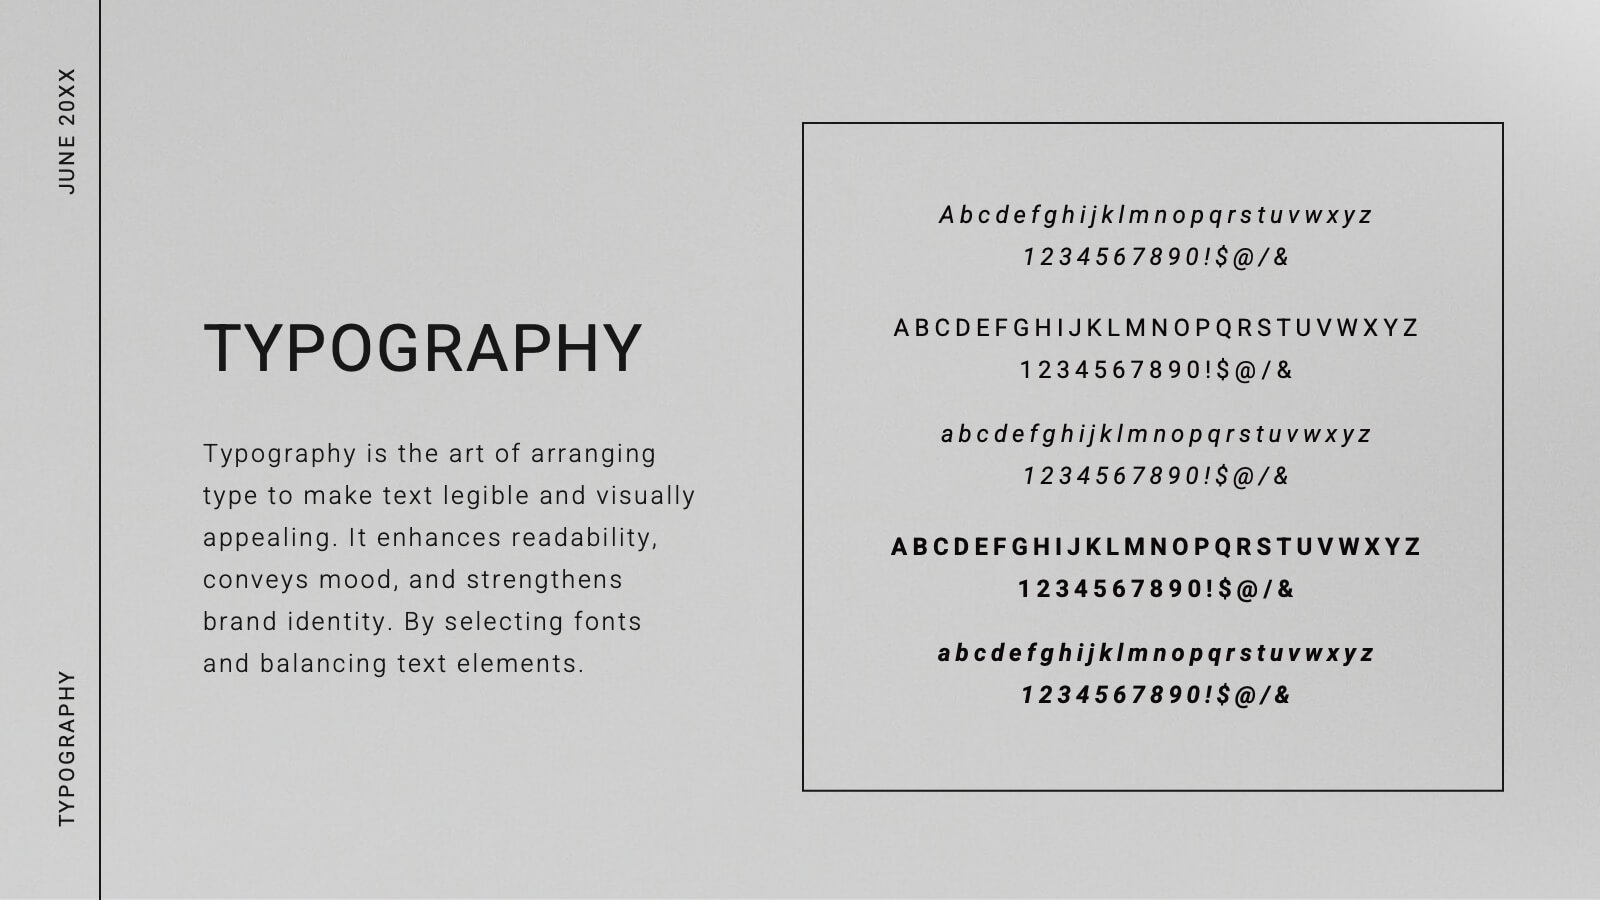
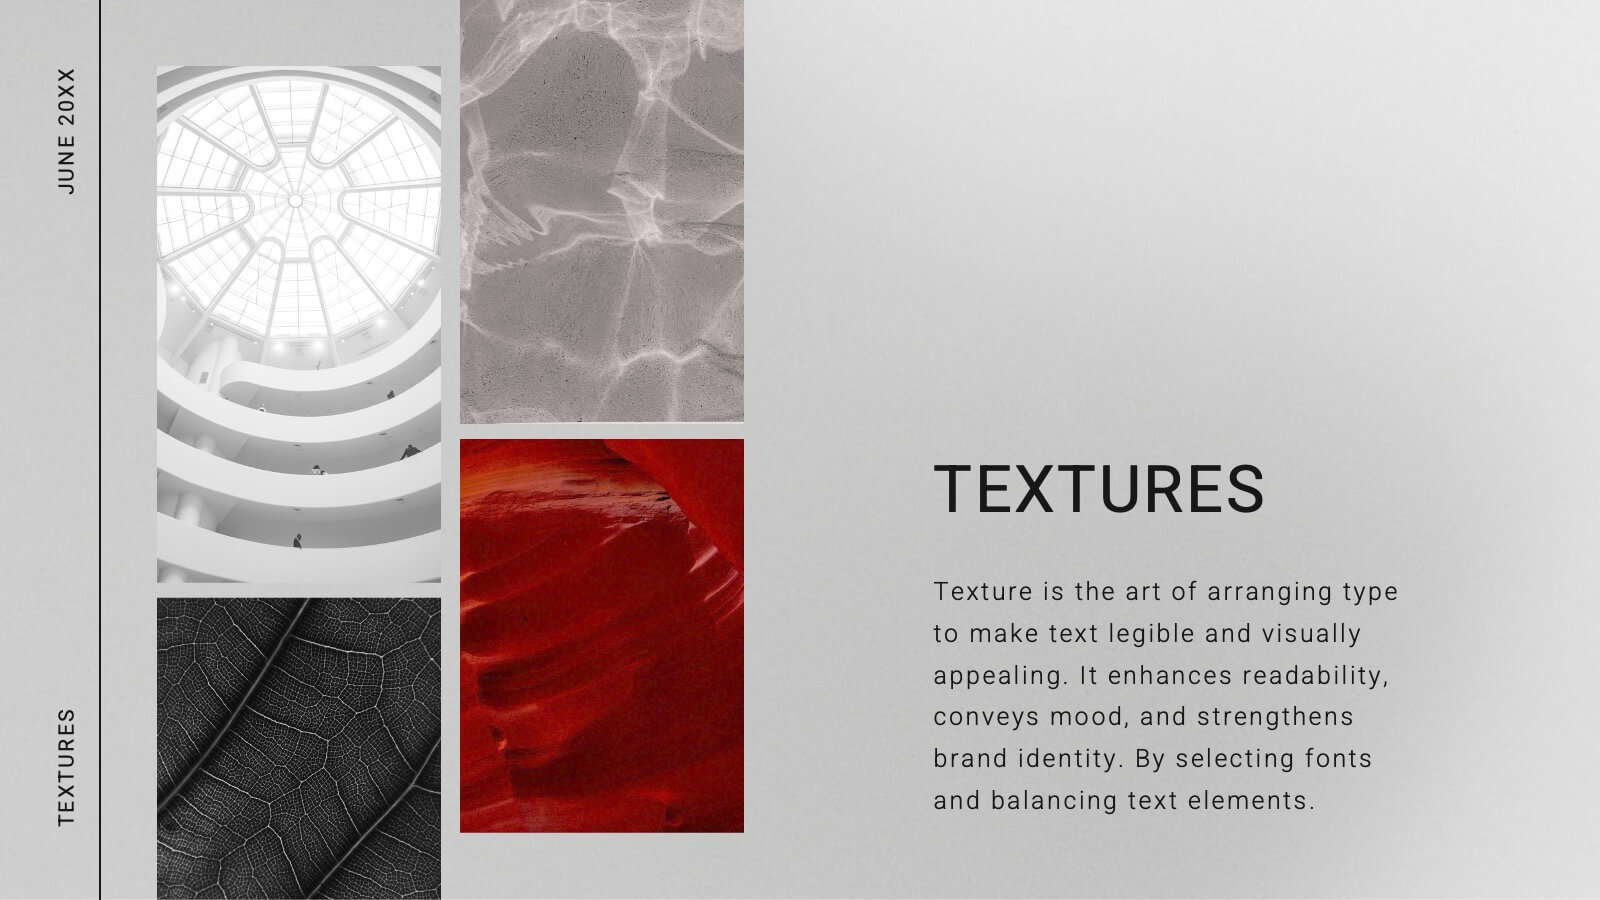
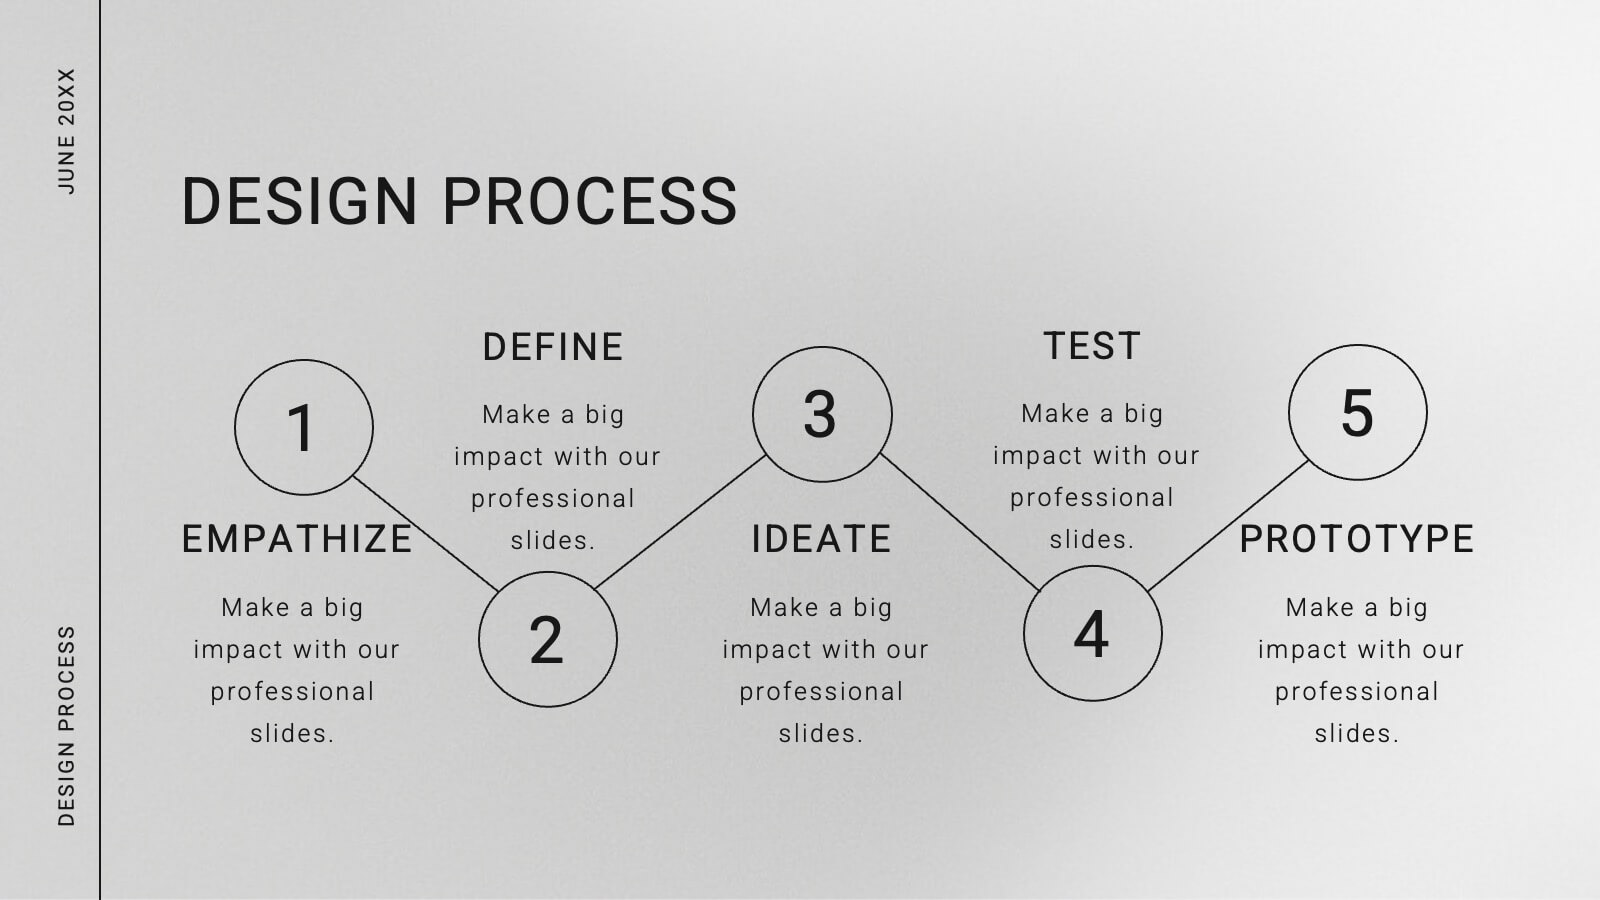
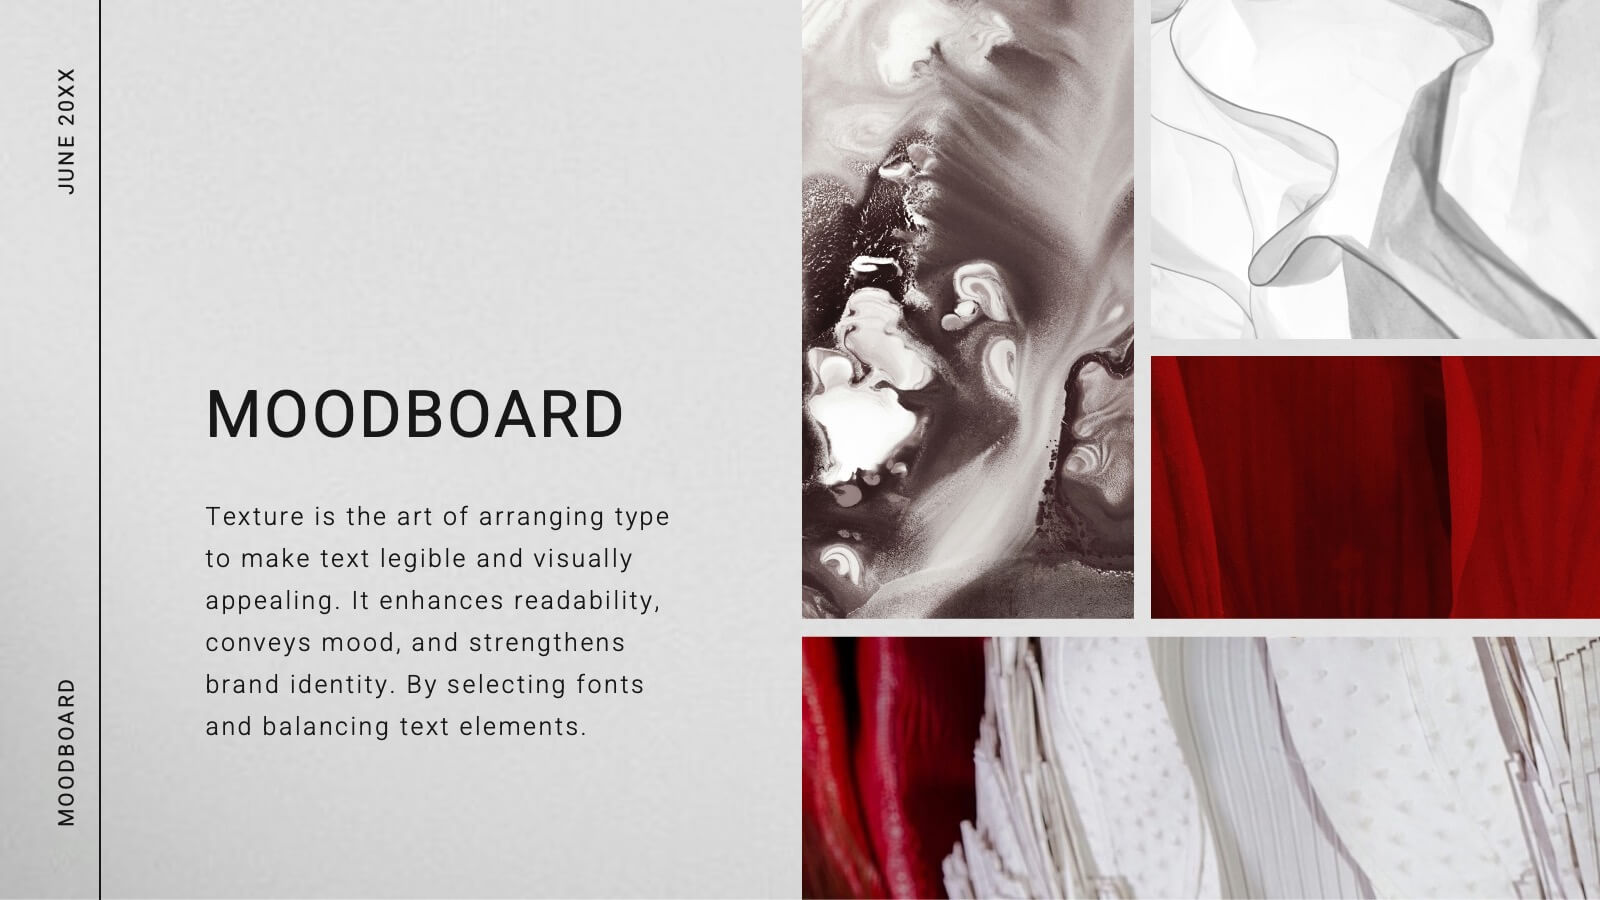
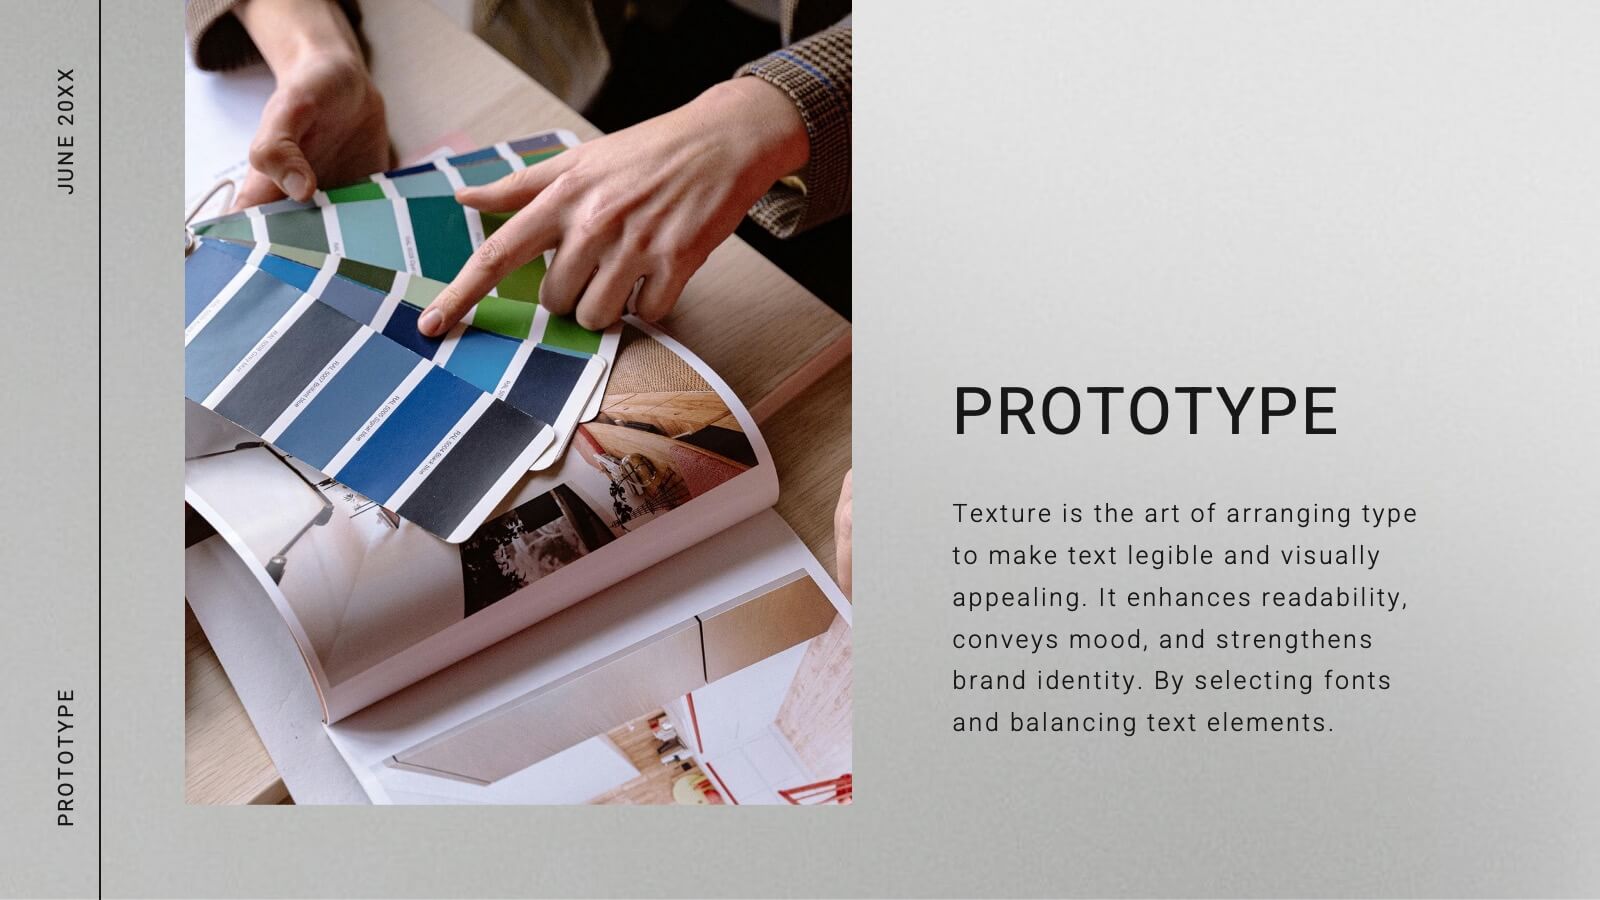
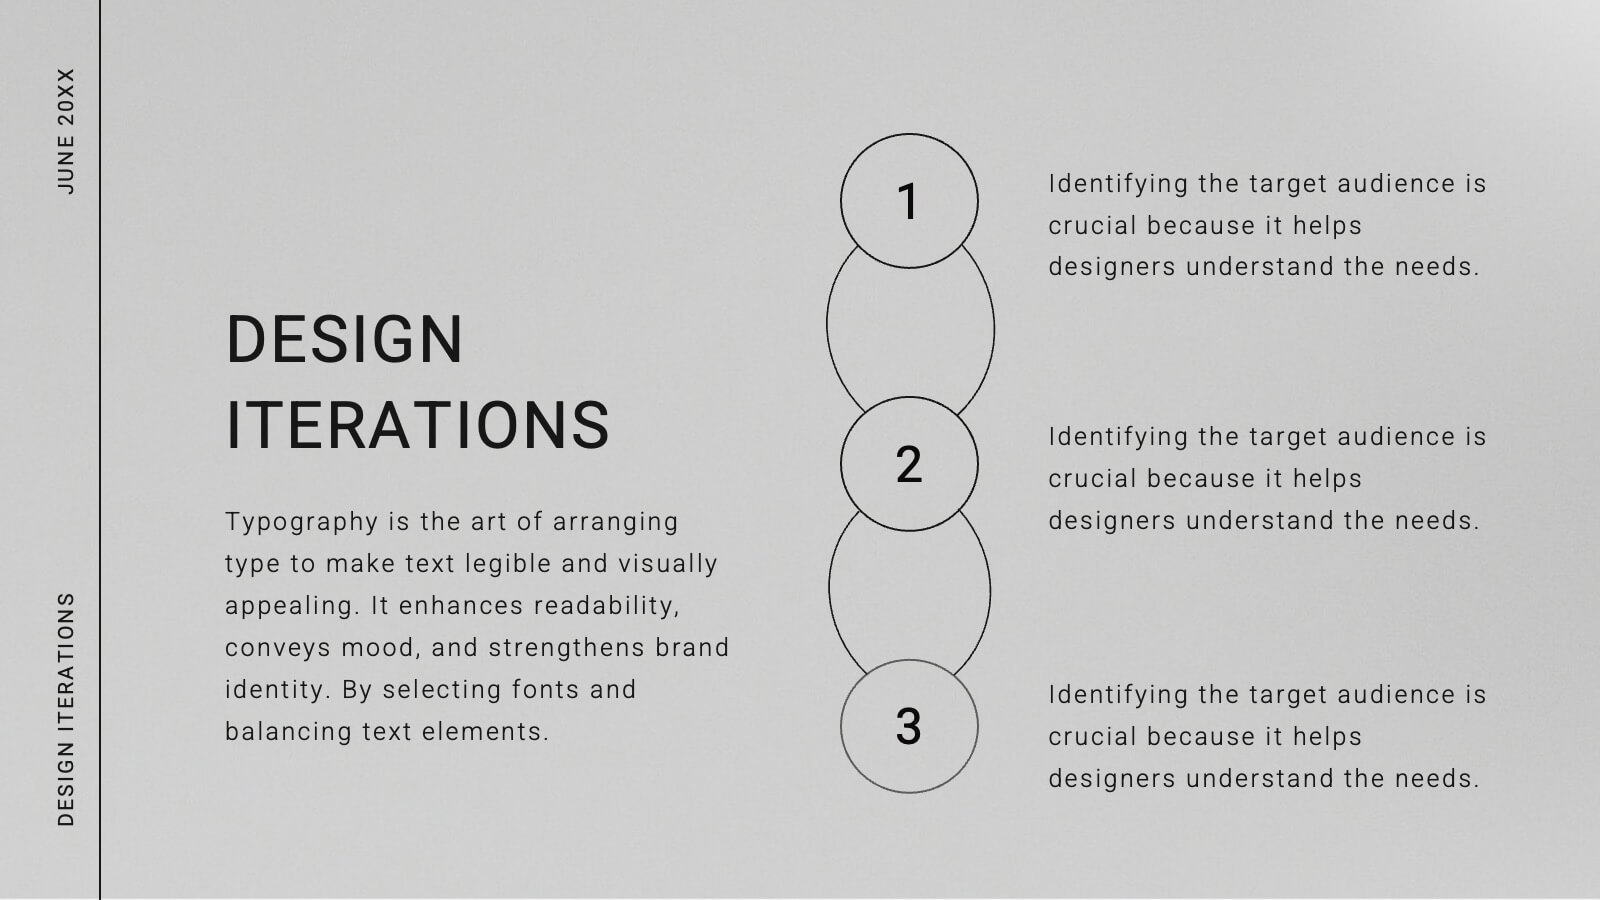
Comet Graphic Design Project Plan Presentation
Craft stunning design project presentations with this elegant template. Showcase objectives, processes, mood boards, and final designs effectively. Ideal for creative teams and clients. Fully compatible with PowerPoint, Keynote, and Google Slides.


8 slides
Total Addressable Market Strategy
Turn your market strategy into a visual story that’s easy to follow. This sleek infographic breaks down TAM, SAM, and SOM into concentric layers—perfect for highlighting growth potential and market focus. Fully customizable in PowerPoint, Keynote, and Google Slides to help you present complex data with clarity and confidence.


26 slides
Maev Presentation Template
Maev is a perfect modern template with a clean and professional feel. Maev was designed by professionals to help businesses connect with their audience. This template has a modern, chic aesthetic and very detailed look which is extremely appealing. The colors are fresh which help keep the look clean and easy to read. The theme comes packed with features to target your audience and help you get your message across. Charts, timelines and easy to edit text, this template is perfect for businesses seeking to make an impression on their audience. by demonstrating they are transparent and reliable.


8 slides
Corporate Mission Purpose Slide
Wave your flag of purpose with this bold, banner-inspired layout—ideal for communicating your corporate mission, core principles, and company values. Each section gives space to articulate what drives your business forward in a visually unified way. Fully compatible with PowerPoint, Keynote, and Google Slides.


20 slides
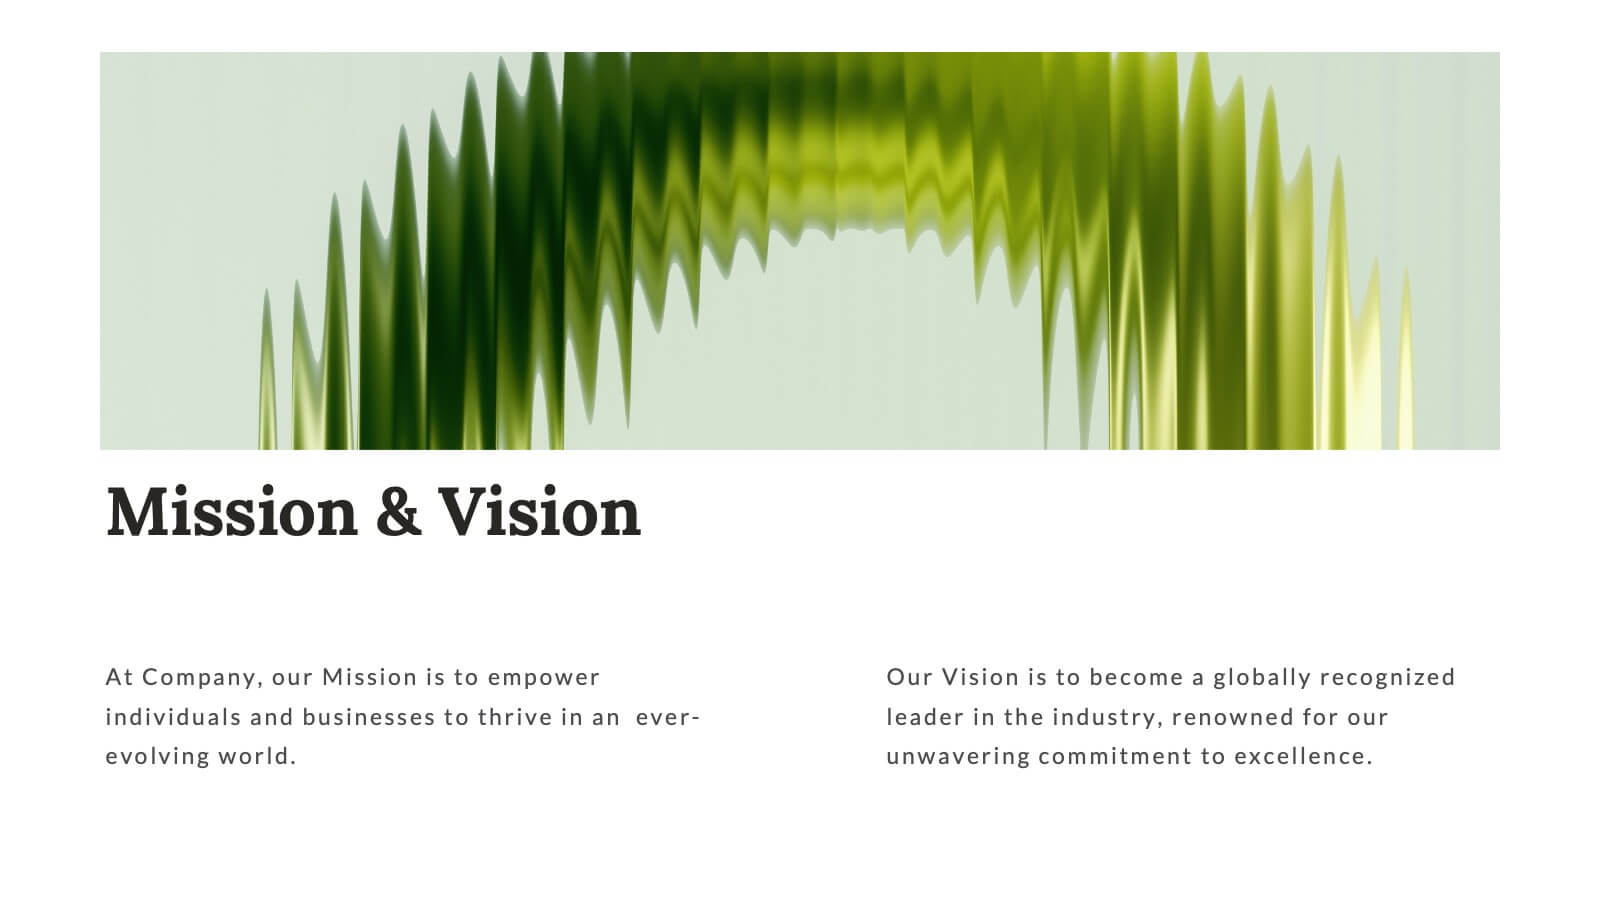
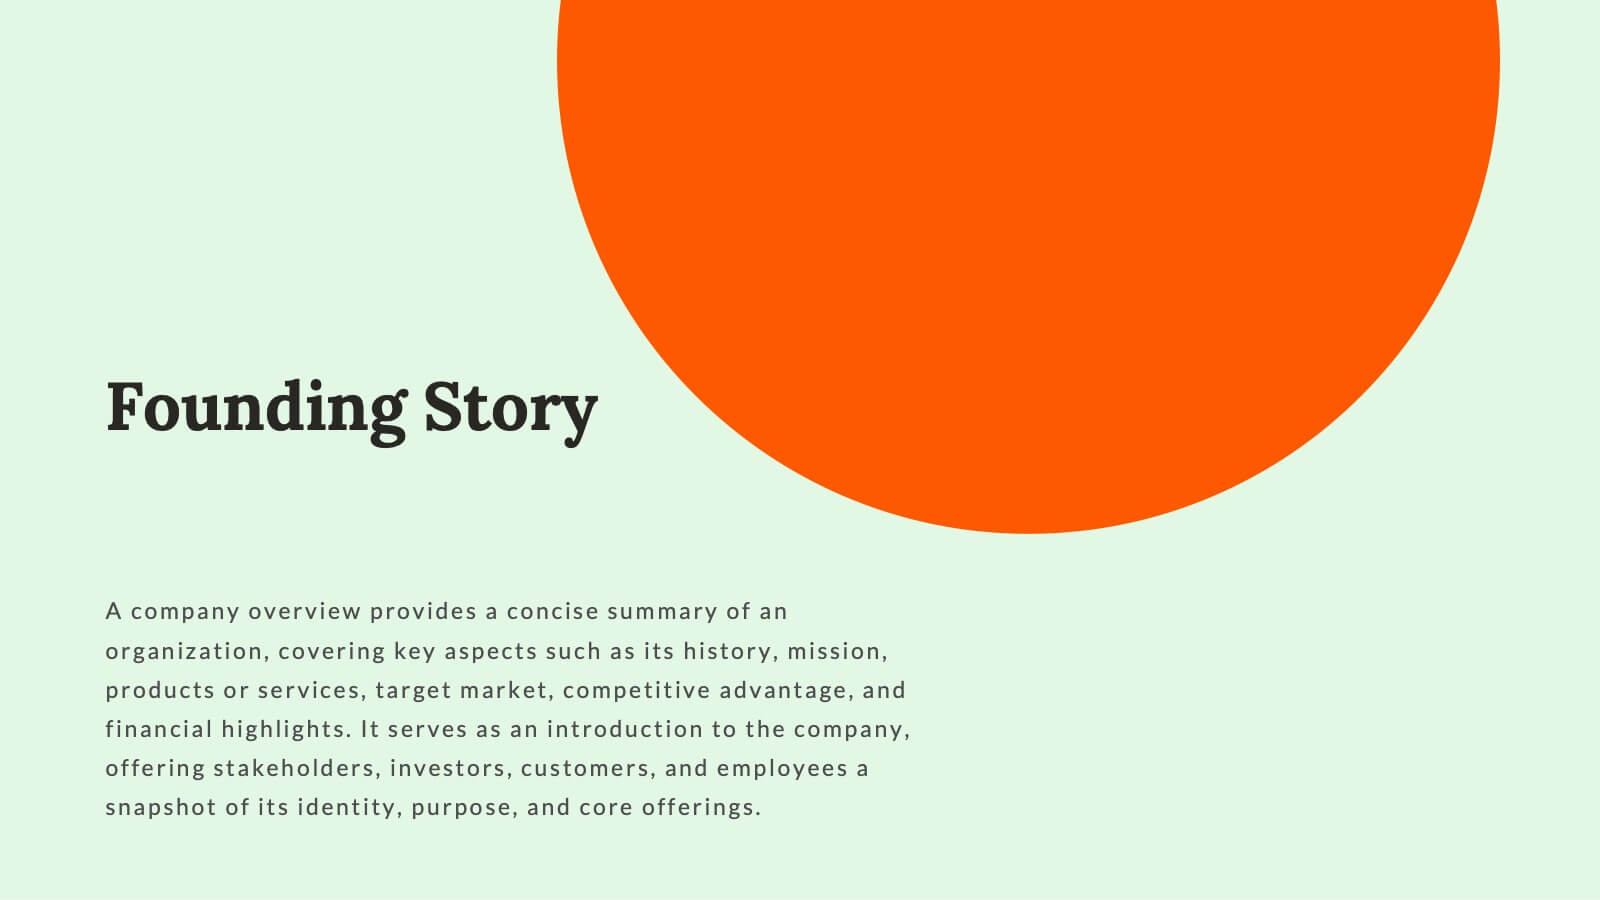
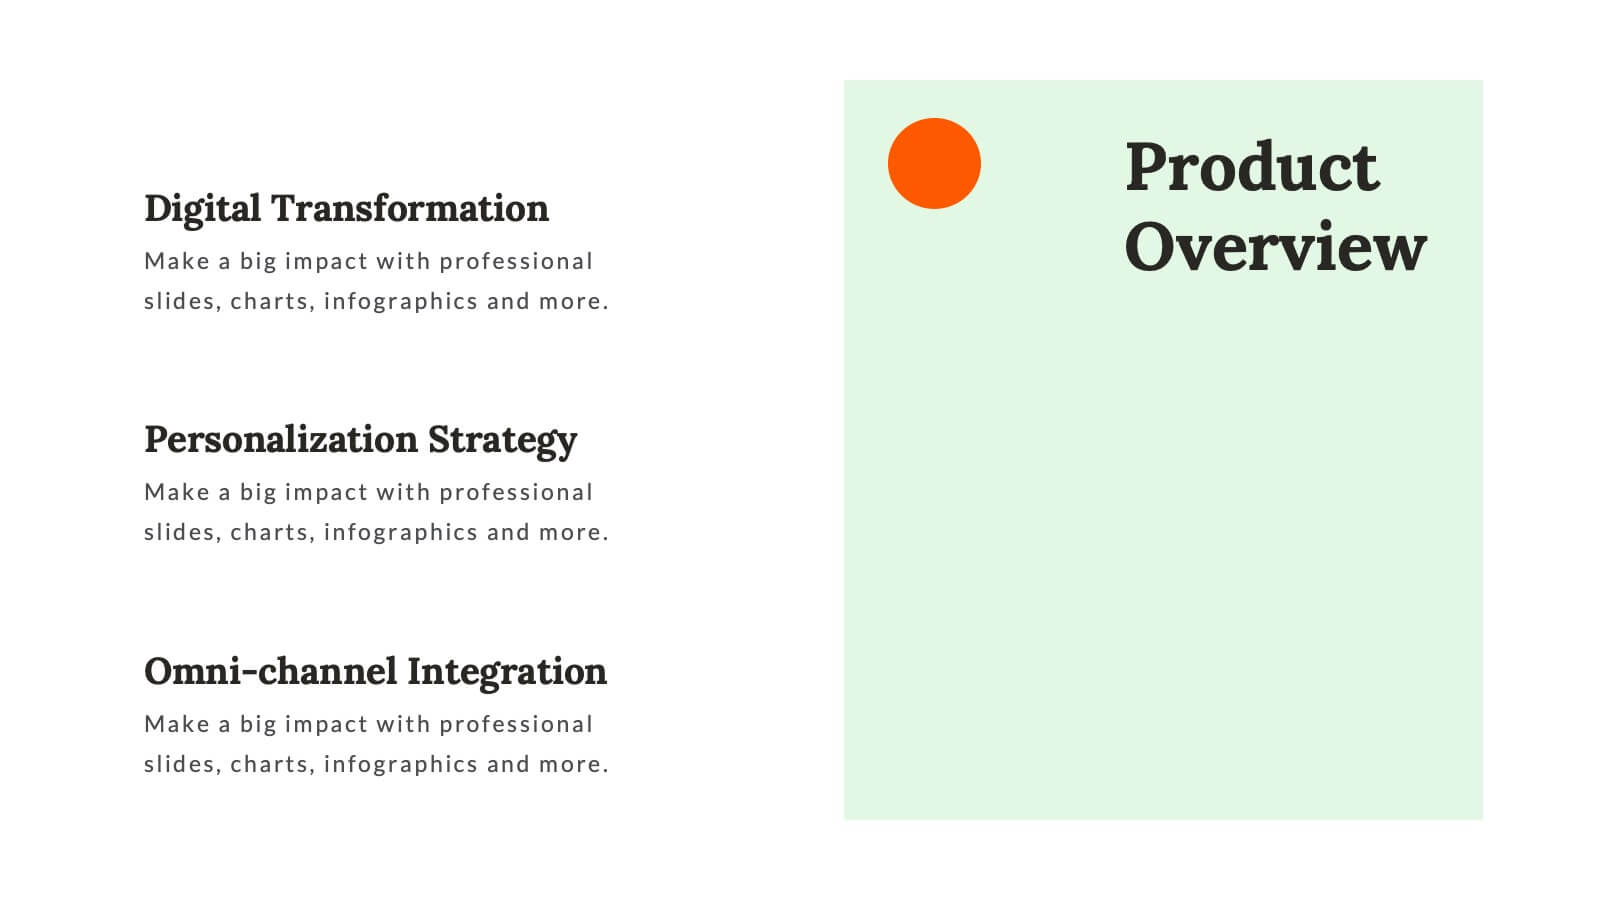
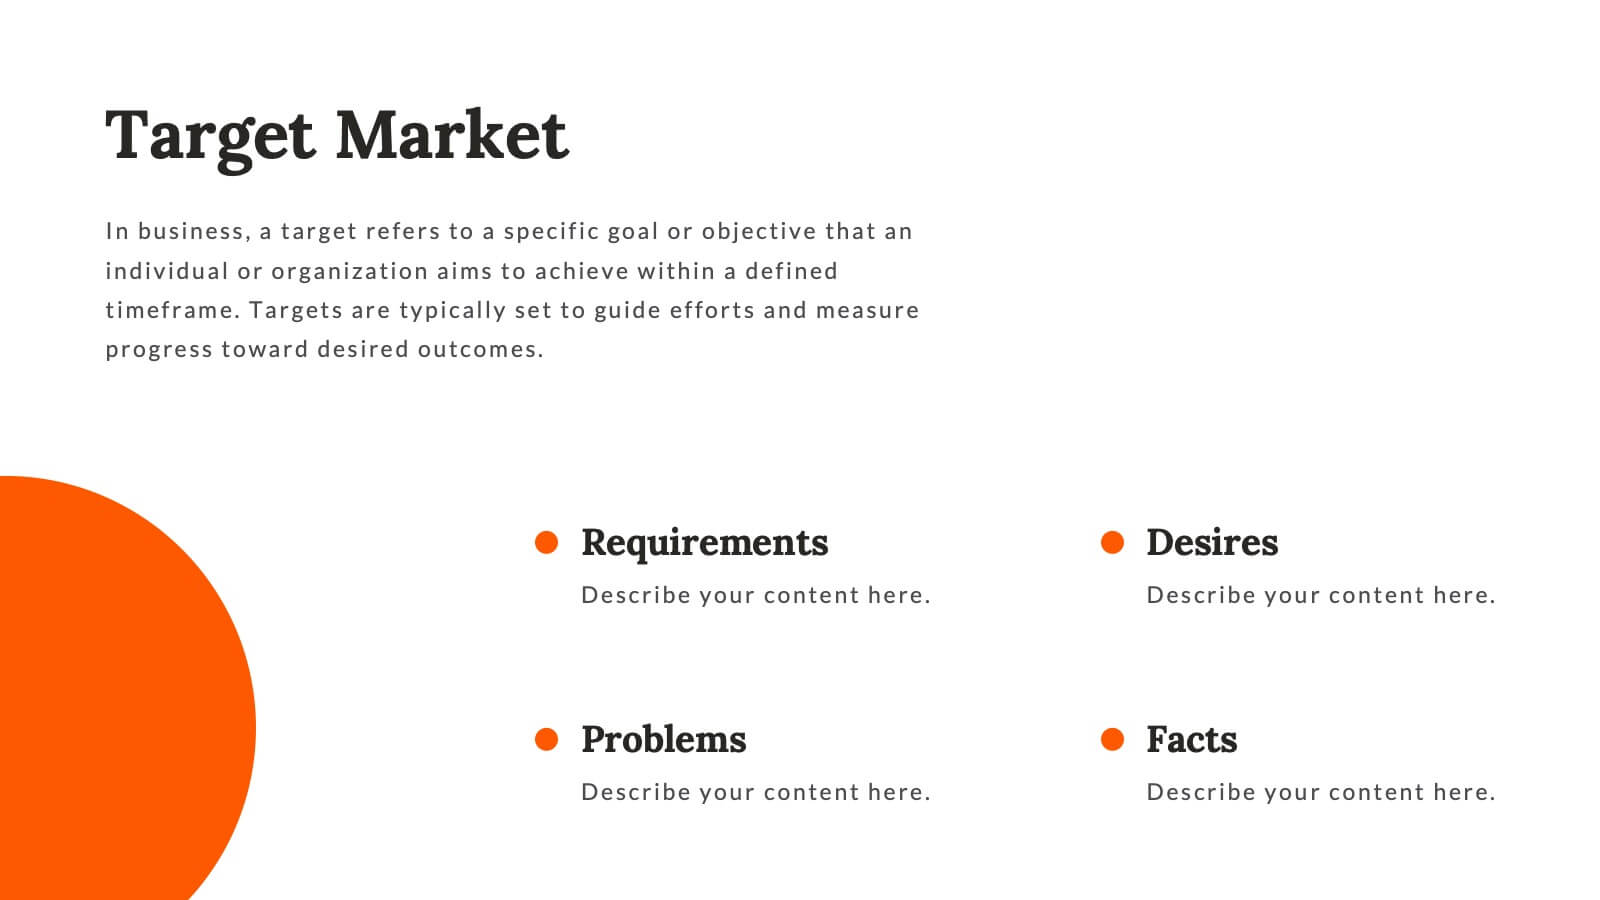
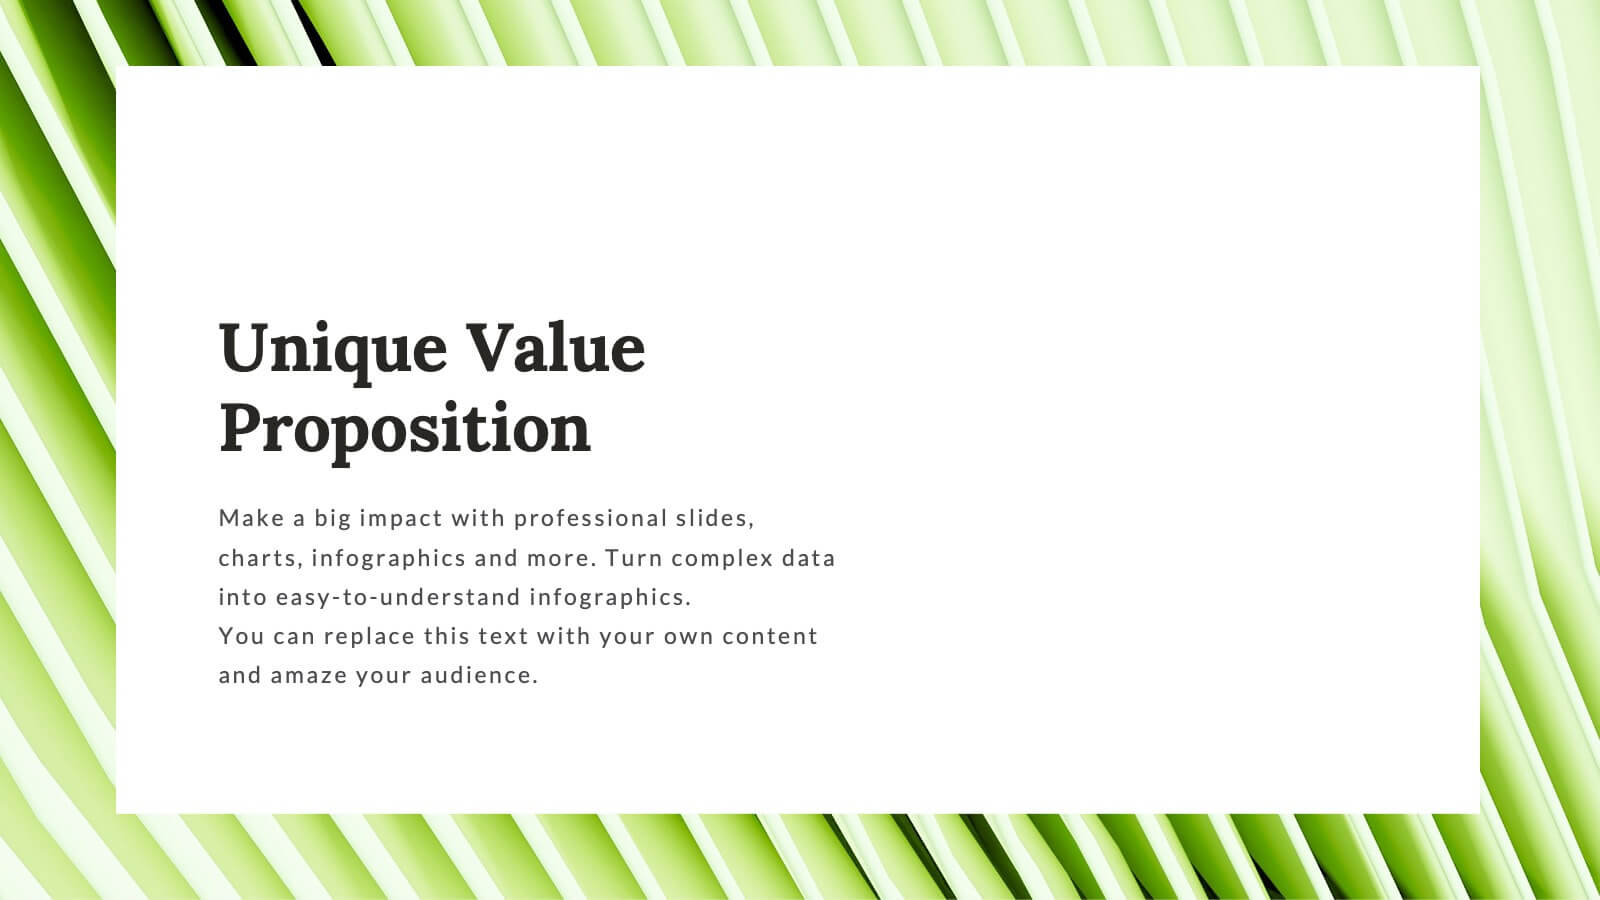
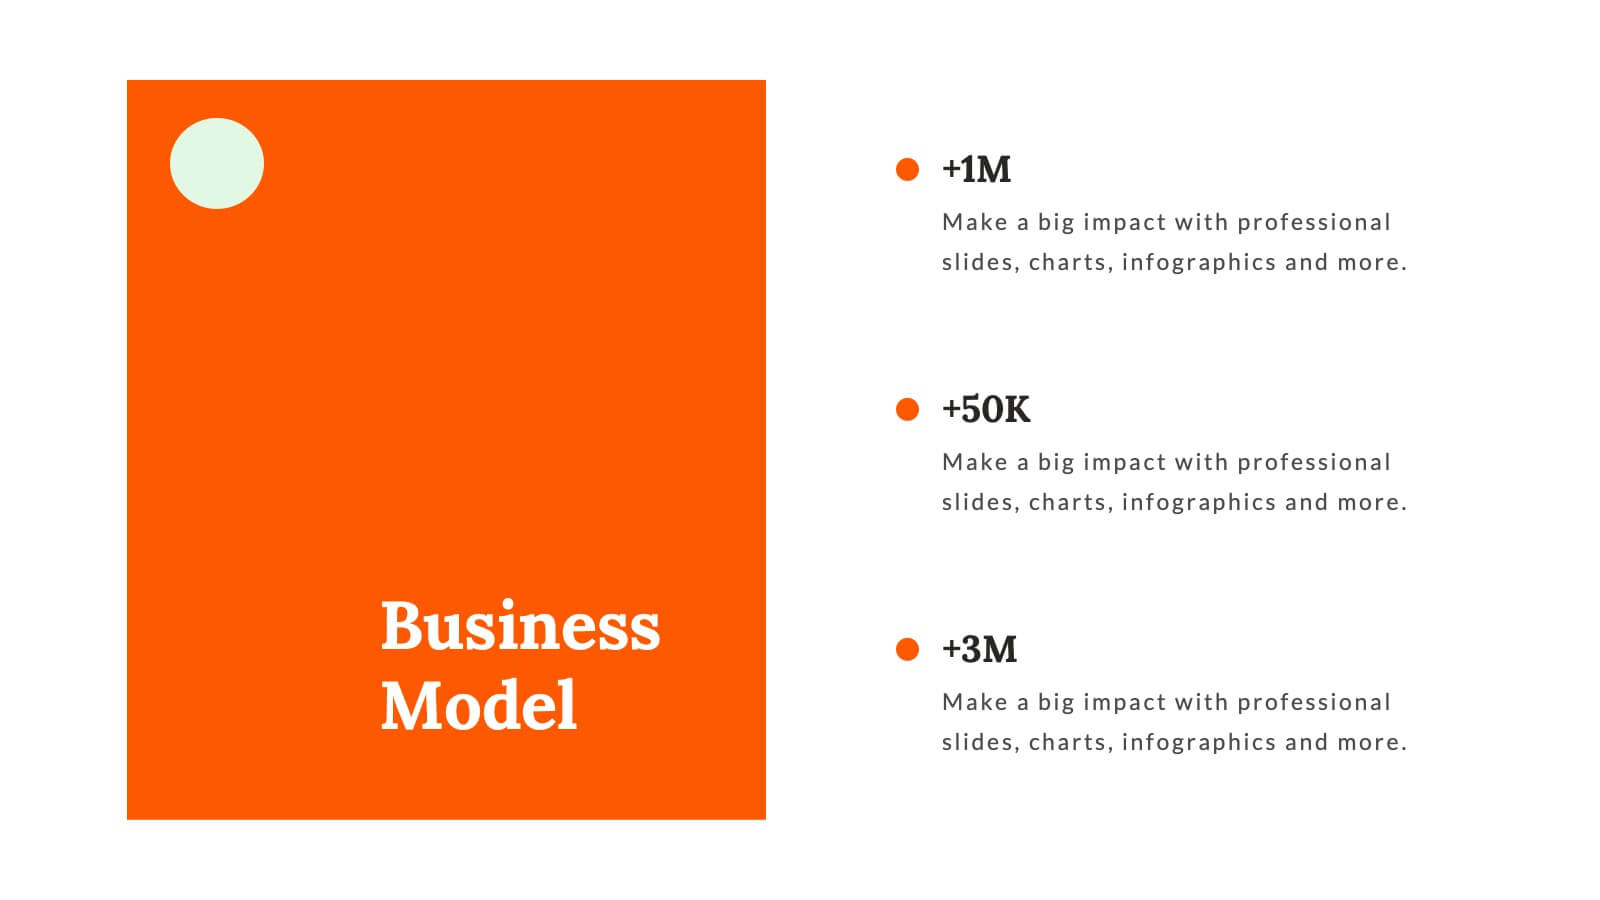
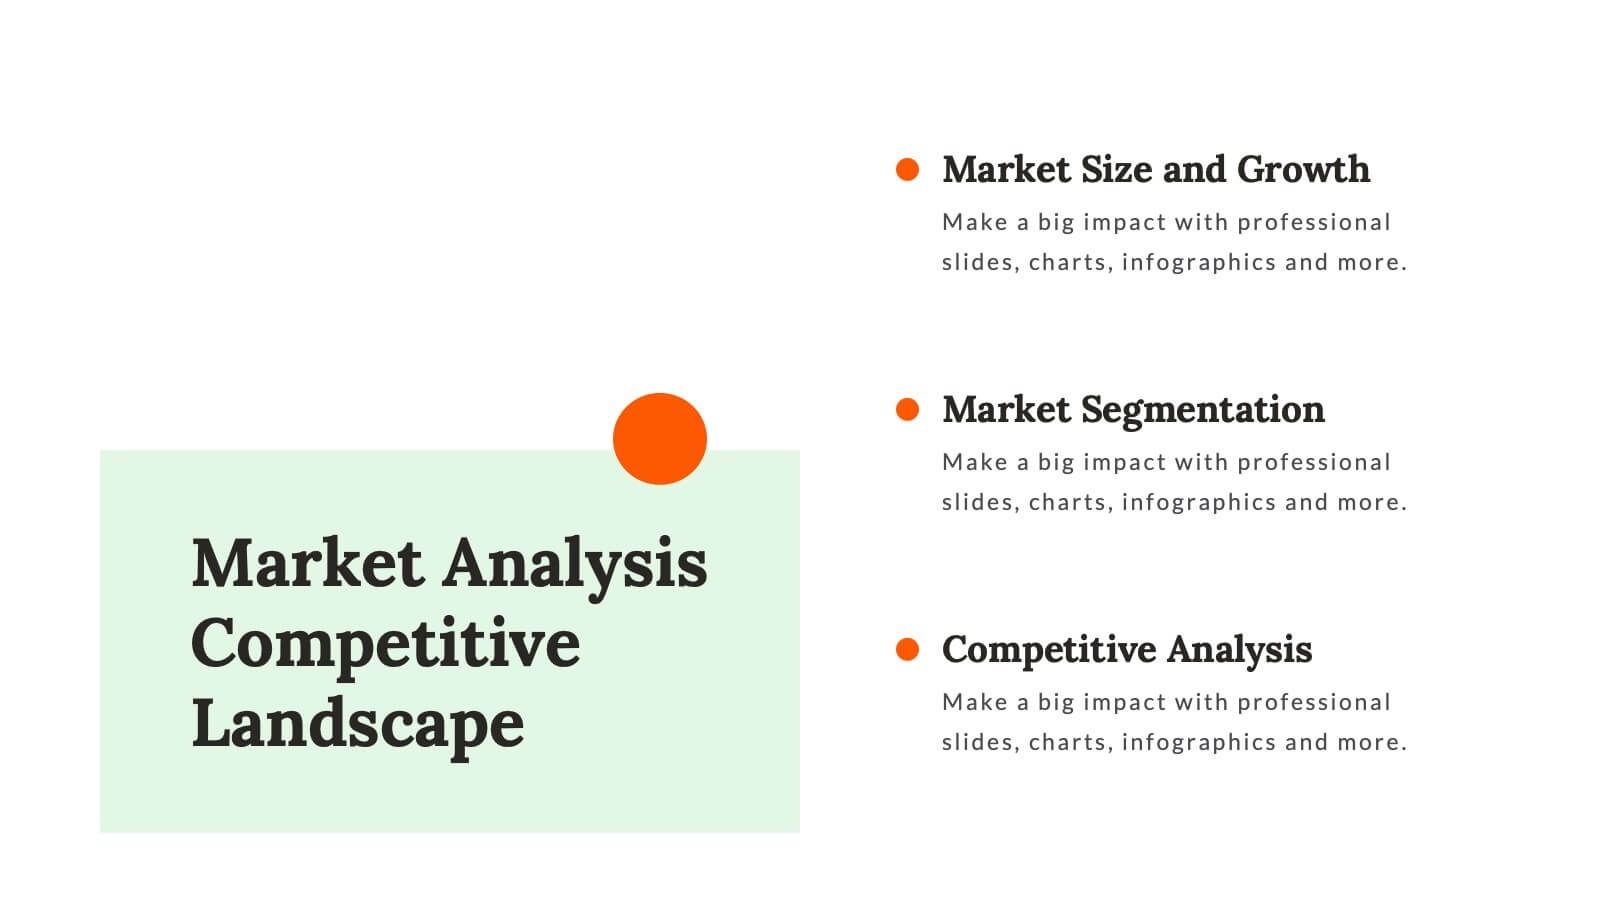
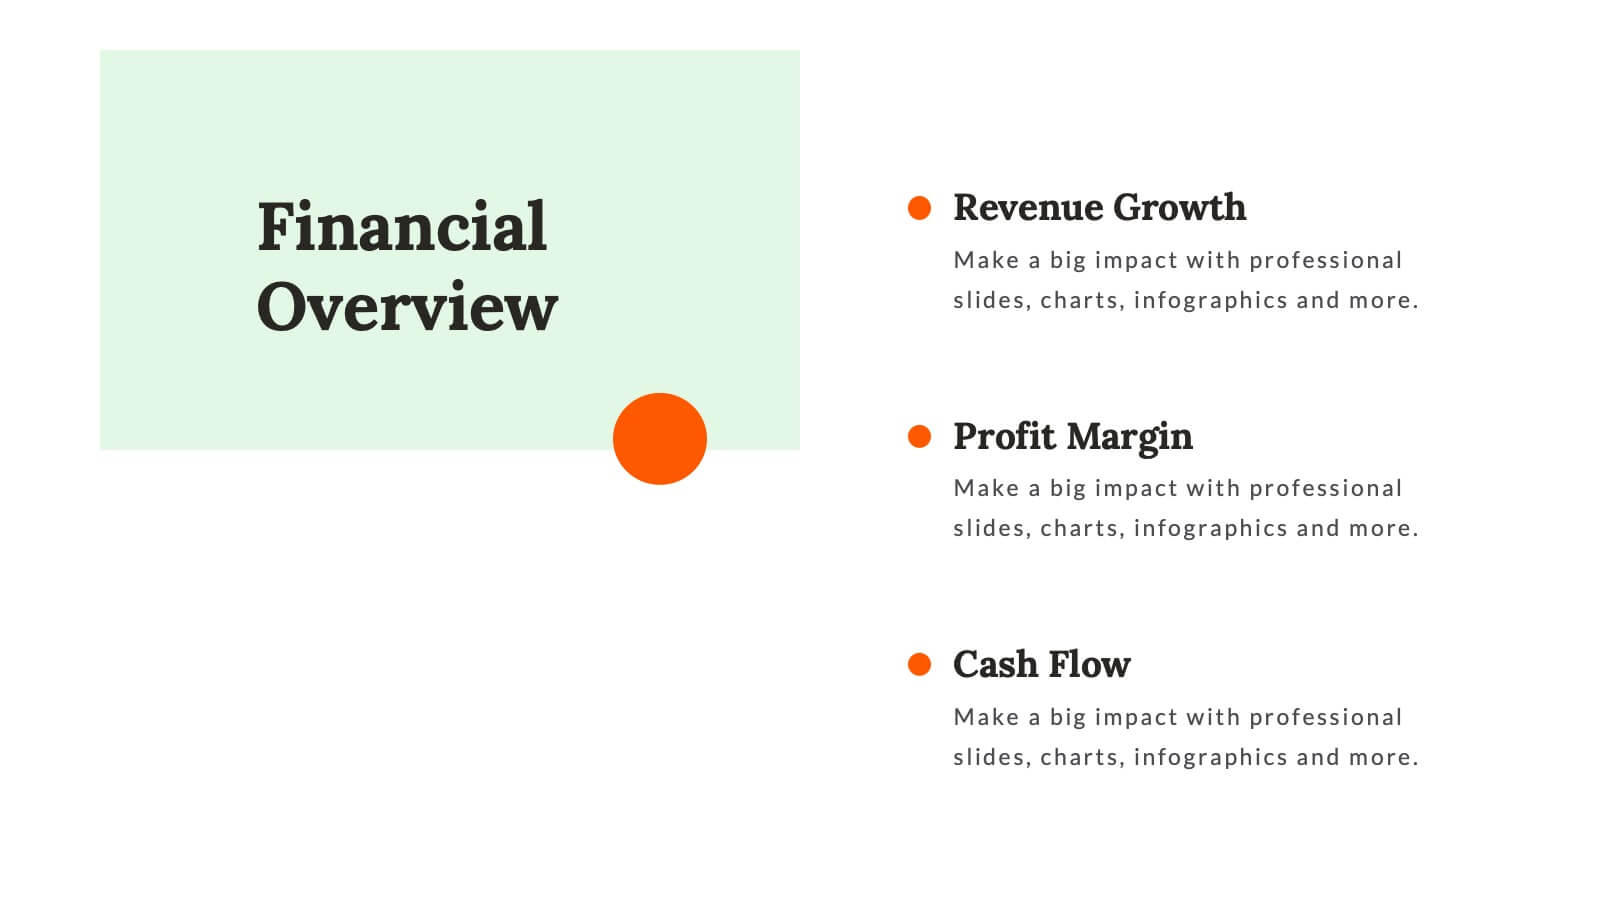
Whirlwind Startup Funding Proposal Presentation
Transform your startup funding proposals with this vibrant and professional template. Designed to impress potential investors, it features sections for mission & vision, founding story, market analysis, and financial overview. Highlight your unique value proposition and business model with clarity and style. This template is compatible with PowerPoint, Keynote, and Google Slides, ensuring seamless presentations on any platform. Perfect for conveying your innovative ideas and growth plans effectively.


5 slides
Enterprise Risk Management Framework Presentation
Visualize your organization’s risk strategy with the Enterprise Risk Management Framework Presentation. This slide outlines four core steps—Set Objective, Identify Risks, Assess Risks, and Risk Response—using a clear, directional design. Perfect for risk assessments, board updates, or audit reviews. Fully editable in PowerPoint, Google Slides, and Canva.


7 slides
Corporate Training Infographic
Enhance your corporate training program with our engaging Infographic, designed to succinctly communicate the key elements of effective employee development. Ideal for HR managers and corporate trainers, this Infographic provides a visual summary of training strategies and success metrics. Our Corporate Training Infographic includes sections on training goals, interactive learning approaches, progress tracking, and feedback collection. It's crafted to facilitate quick comprehension and retention of corporate training concepts, making it a perfect tool for internal communication and team meetings. The customizable layout allows you to highlight specific training outcomes, participant engagement, and the benefits of ongoing professional development. This SEO-friendly Infographic is tailored to attract professionals focused on boosting their team's performance and skills. Implement our Infographic to streamline your training processes and showcase the value of learning and development within your organization.


4 slides
Creative Startup Funding Presentation
A fresh, dynamic layout brings your ideas to life, making every funding insight feel clear, confident, and investor-ready. This presentation helps you explain financial needs, growth opportunities, and strategic plans in a simple, engaging way. Fully editable and easy to use in PowerPoint, Keynote, and Google Slides.


7 slides
Customer Journey Infographic Presentation Template
A Customer Journey Infographic is an illustration of the different stages a customer goes through when interacting with a business or organization. It is a way to show the customer's experience with the business or organization, from the initial contact to the post-purchase follow-up. This template is perfect for showing how people interact with your business, the emotions and feedback of your customer at each stage. This template includes lots of photo layouts, charts, and timelines that you can customize to show the different stages a customer goes through on their journey with your business.


21 slides
Thunderbird Small Business Pitch Deck Presentation
Take flight with this dynamic Thunderbird-inspired presentation, perfect for pitching your small business! Designed to highlight your business model, market potential, and financial projections, this template ensures your pitch is clear, compelling, and professional. Its bold visuals will help you soar. Compatible with PowerPoint, Keynote, and Google Slides.


4 slides
Effective Leadership Tips Presentation
Lead with clarity and confidence using this clean, modern presentation design. Perfect for sharing management insights, motivational principles, and communication strategies, it helps visualize ideas that inspire stronger teams and better decision-making. Fully editable and compatible with PowerPoint, Keynote, and Google Slides for effortless professional customization.


7 slides
Skills Gap Analysis Tool Infographic
Optimize workforce potential with our Skills Gap Analysis Tool Infographic, designed for HR professionals, team leaders, and organizational development experts. This infographic provides a visual representation of the skills present within a team and identifies areas requiring development. Our infographic lays out a systematic approach to assessing competency levels across various skill sets, highlighting strengths and gaps in your team's abilities. It includes segments for rating proficiency, mapping skill distribution, and planning for training or recruitment to bridge any gaps. With this tool, you can create a clear and actionable skills inventory that supports strategic workforce planning and personal development. This SEO-optimized infographic is crafted to guide you in aligning your team's skills with organizational goals. Leverage this infographic to conduct comprehensive skills gap analyses, ensuring your team has the capabilities to meet current and future challenges effectively.


4 slides
Real Estate Market Trends
Present housing data and property growth insights with this ascending building chart layout. Perfect for realtors, investors, and market analysts, this template helps visualize real estate performance over time. Fully editable in PowerPoint, Keynote, and Google Slides.


6 slides
Sustainability Management Analysis Infographics
Explore the world of Sustainability Management with our customizable infographic template. This template is fully compatible with popular presentation software like PowerPoint, Keynote, and Google Slides, allowing you to easily customize it to illustrate and communicate various aspects of sustainability management. The Sustainability Management infographic template offers a visually engaging platform to explore and explain the principles, strategies, and initiatives related to sustainability within organizations. Whether you're a sustainability professional, business leader, or simply interested in environmental responsibility, this template provides a user-friendly canvas to create informative presentations and educational materials. Deepen your understanding of Sustainability Management with this SEO-optimized infographic template, thoughtfully designed for clarity and ease of use. Customize it to highlight key sustainability goals, best practices, metrics, and the importance of sustainable business practices, ensuring that your audience gains a comprehensive understanding of this critical field. Start crafting your personalized infographic today to delve into the world of Sustainability Management.


6 slides
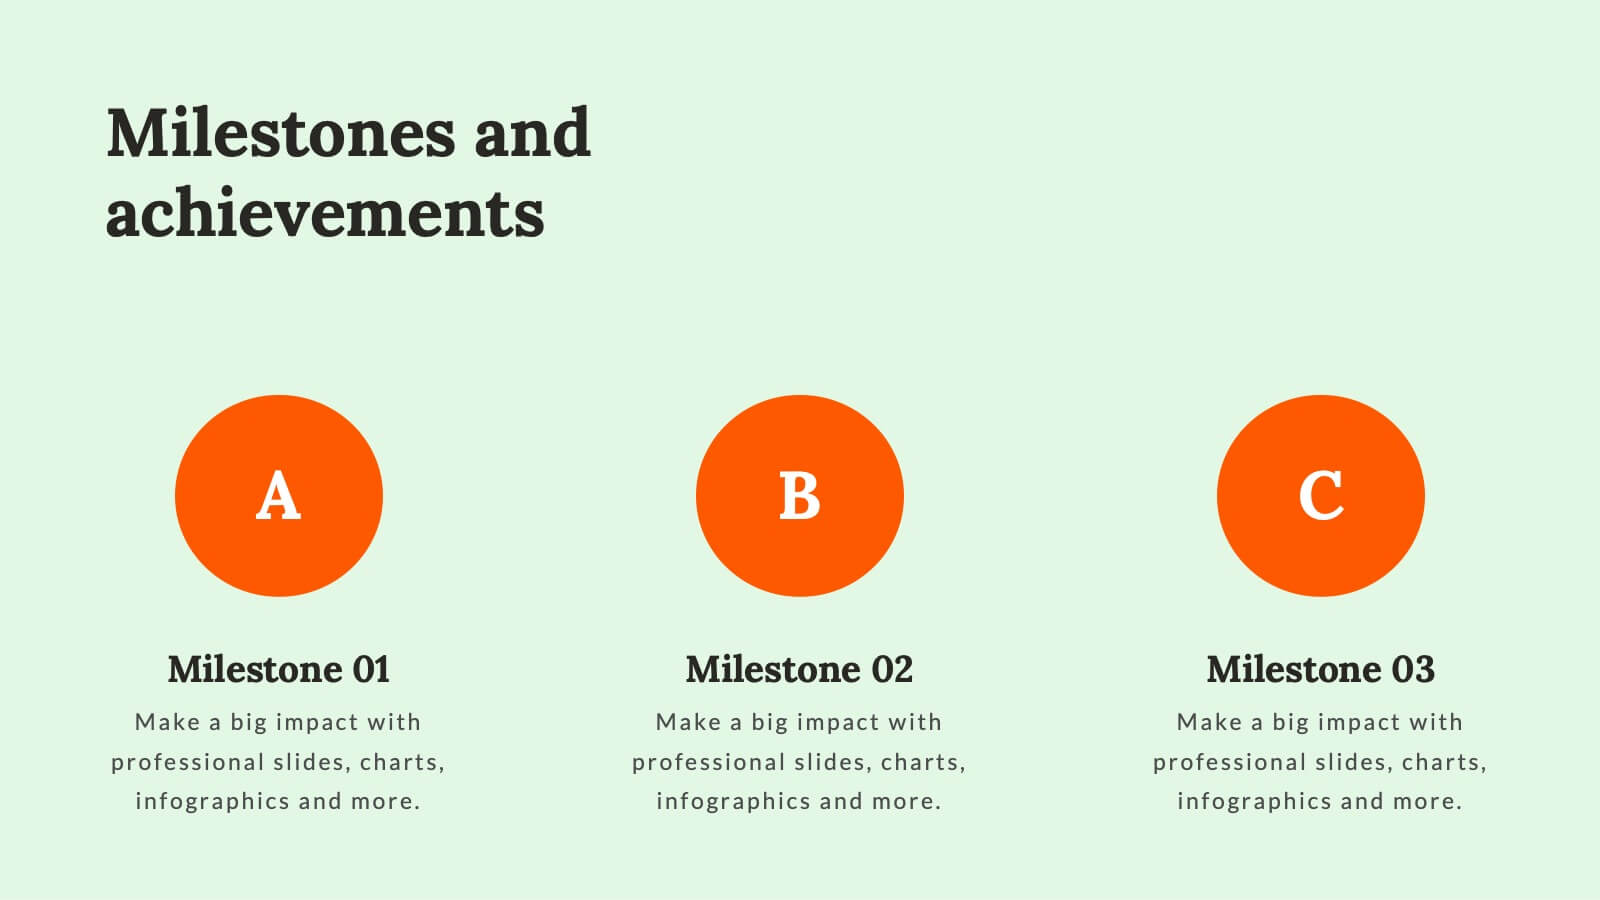
ABC Alphabet Infographic
An "Alphabet Infographic" is a visually engaging way to present the letters of the alphabet along with corresponding words or images that start with each letter. This type of infographic is often used in educational settings to teach young children the alphabet and basic vocabulary. Display the letters of the alphabet in a clear and appealing layout. You can arrange them in rows or columns, using a bold and easily readable font. Use colorful and child-friendly illustrations for the images associated with each letter. This will make the infographic more captivating and engaging for young learners.
5 slides
Key Milestone Tracker for Projects Presentation
Track project progress and celebrate wins with the Key Milestone Tracker for Projects Presentation. This template features a vertical flow of trophy icons embedded in hexagons, each representing a major milestone. Ideal for showcasing achievements, timelines, or key phases in a project lifecycle. Fully customizable and compatible with PowerPoint, Keynote, and Google Slides.