


Features
- 2 Unique slides
- Fully editable and easy to edit in Microsoft Powerpoint, Keynote and Google Slides
- 16:9 widescreen layout
- Clean and professional designs
- Export to JPG, PDF or send by email


Do you have any questions?
Recommend


14 slides
Business Model Canvas Presentation
Our Business Model Canvas presentation template is an invaluable tool for entrepreneurs and business strategists to map out their business model in a clear and structured way. It begins with an engaging title slide that announces the topic, leading to an explanatory slide on what a business model entails. The template includes dedicated slides for each segment of the business model canvas, allowing for a detailed analysis of your value proposition, customer segments, key partnerships, channels, customer relationships, key activities, key resources, and your cost structure. Each slide is designed for clarity, ensuring that the audience can easily follow the intricacies of your business model. The final sections provide space for outlining your revenue streams, highlighting the importance of diversification and sustainability. The presentation wraps up with a concise conclusion and credits slide for sourcing acknowledgments. This template is perfect for PowerPoint, Keynote, and Google Slides, designed to facilitate a comprehensive understanding of your business model for both internal and external stakeholders.


6 slides
Revenue Growth Sales Slide Presentation
Showcase your business success with this Revenue Growth Sales Slide Presentation. The upward-curved arrow design highlights five key milestones, each with customizable titles, icons, and color accents. Perfect for illustrating sales performance, growth metrics, or financial forecasts. Easy to edit in PowerPoint, Keynote, or Google Slides—ideal for sales teams, analysts, and executives.

20 slides
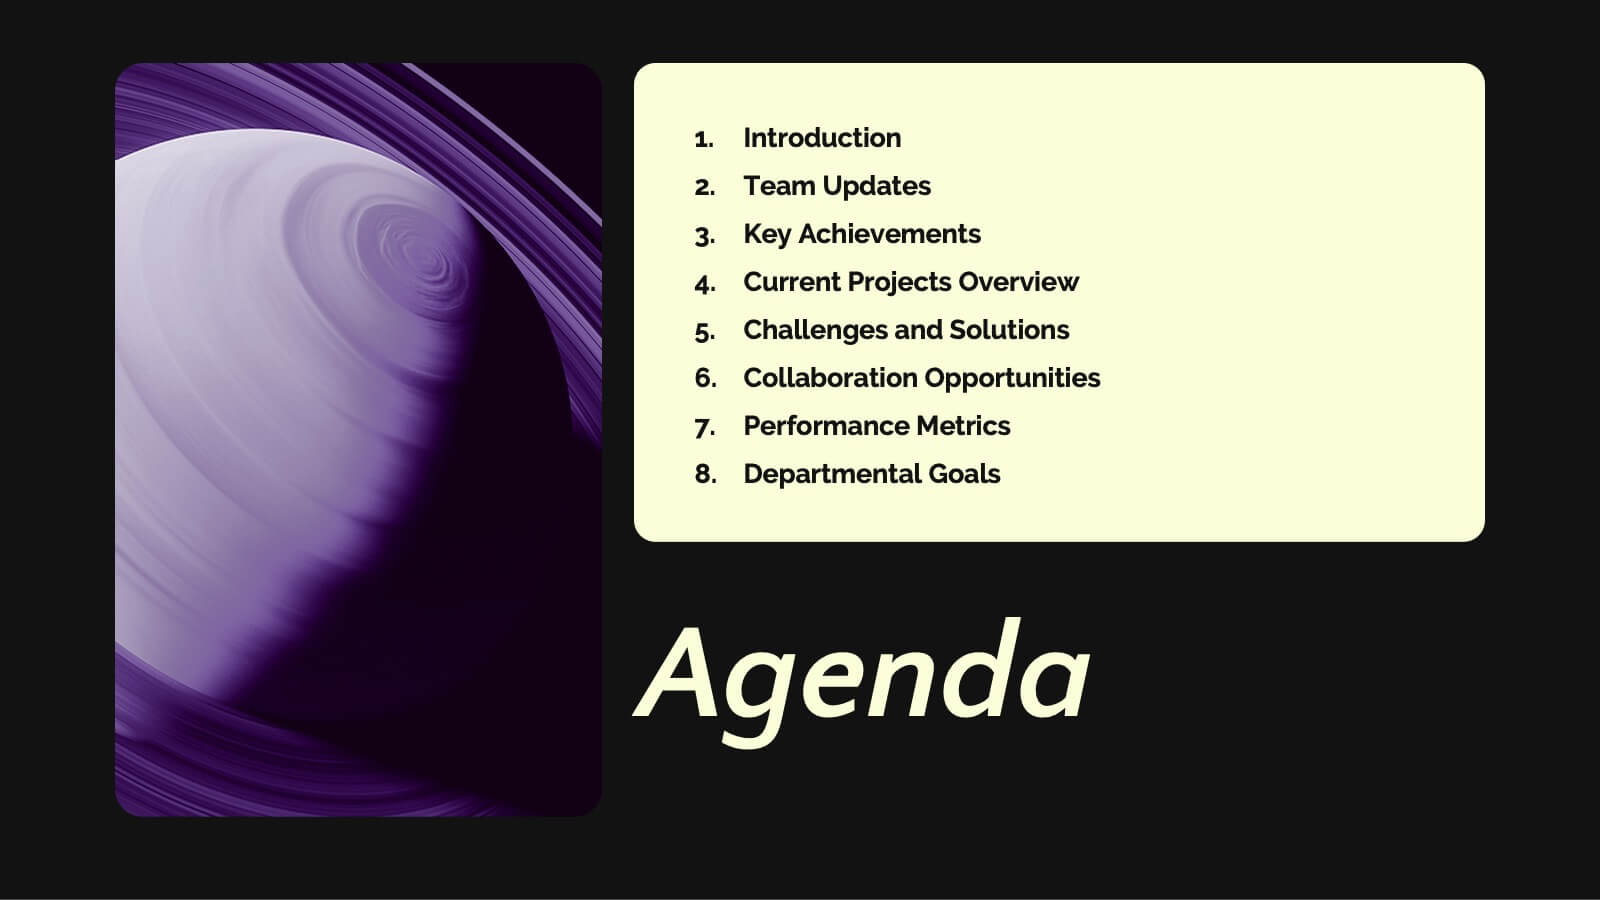
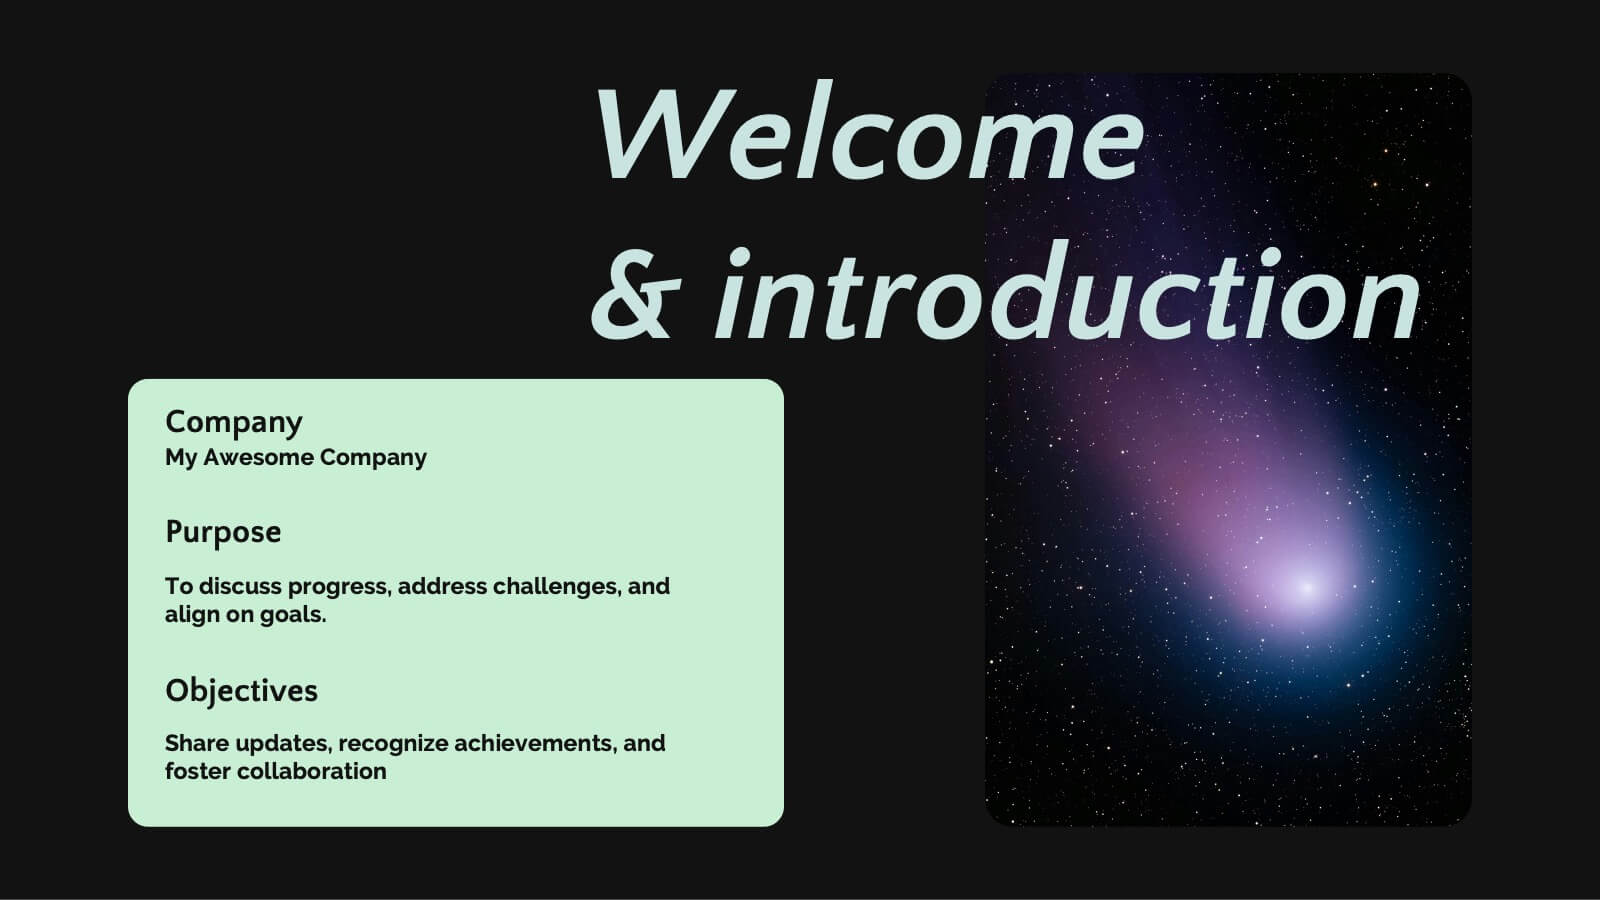
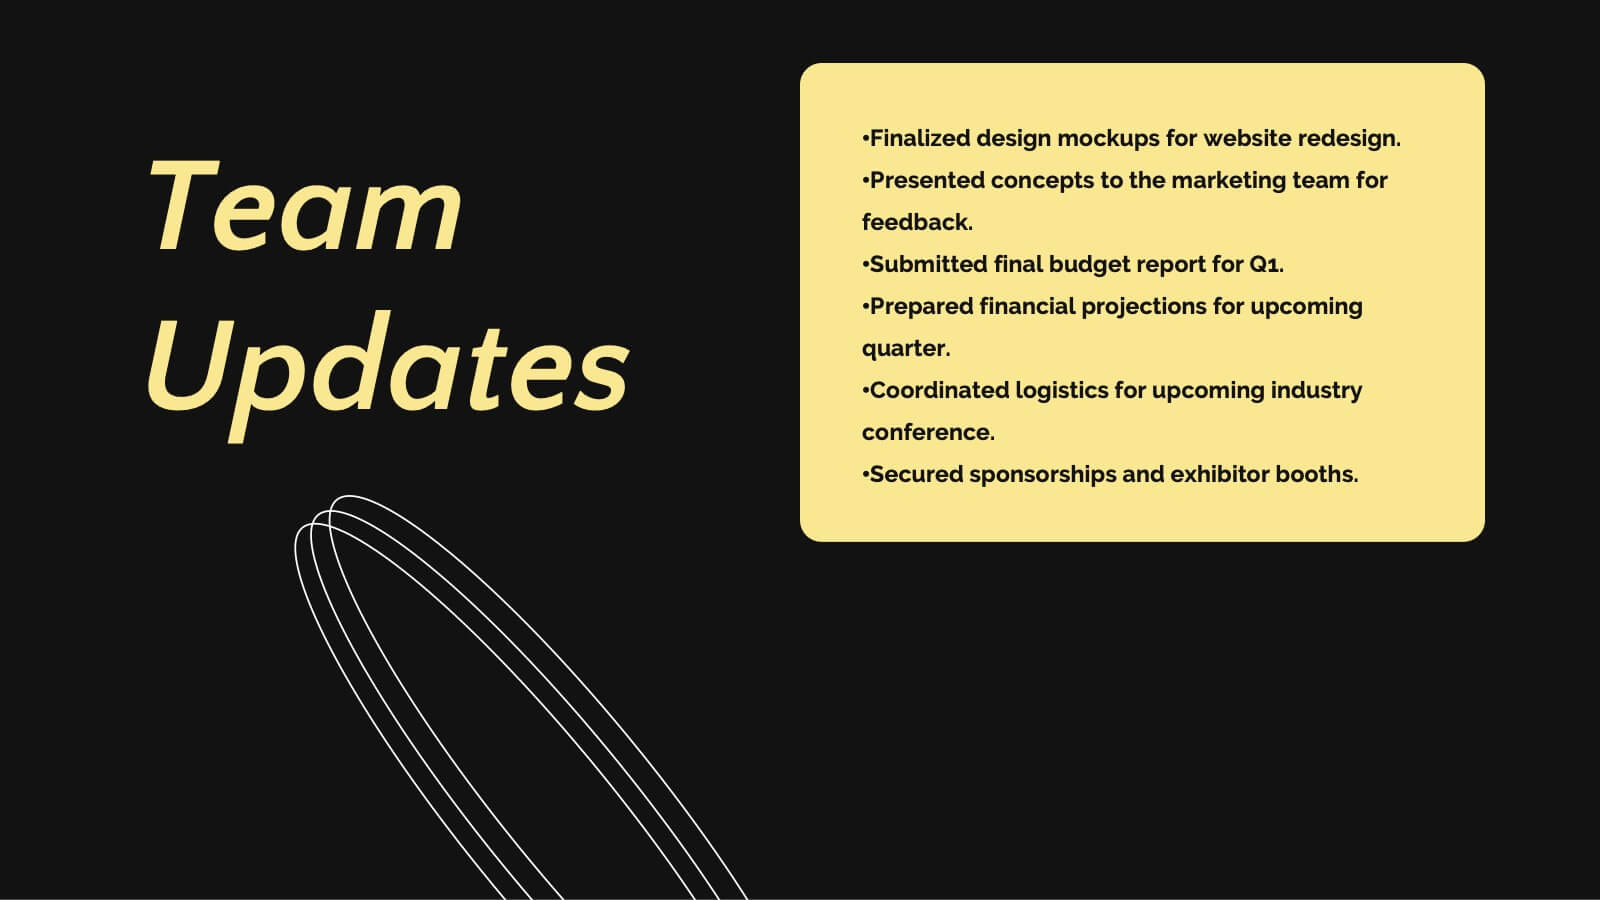
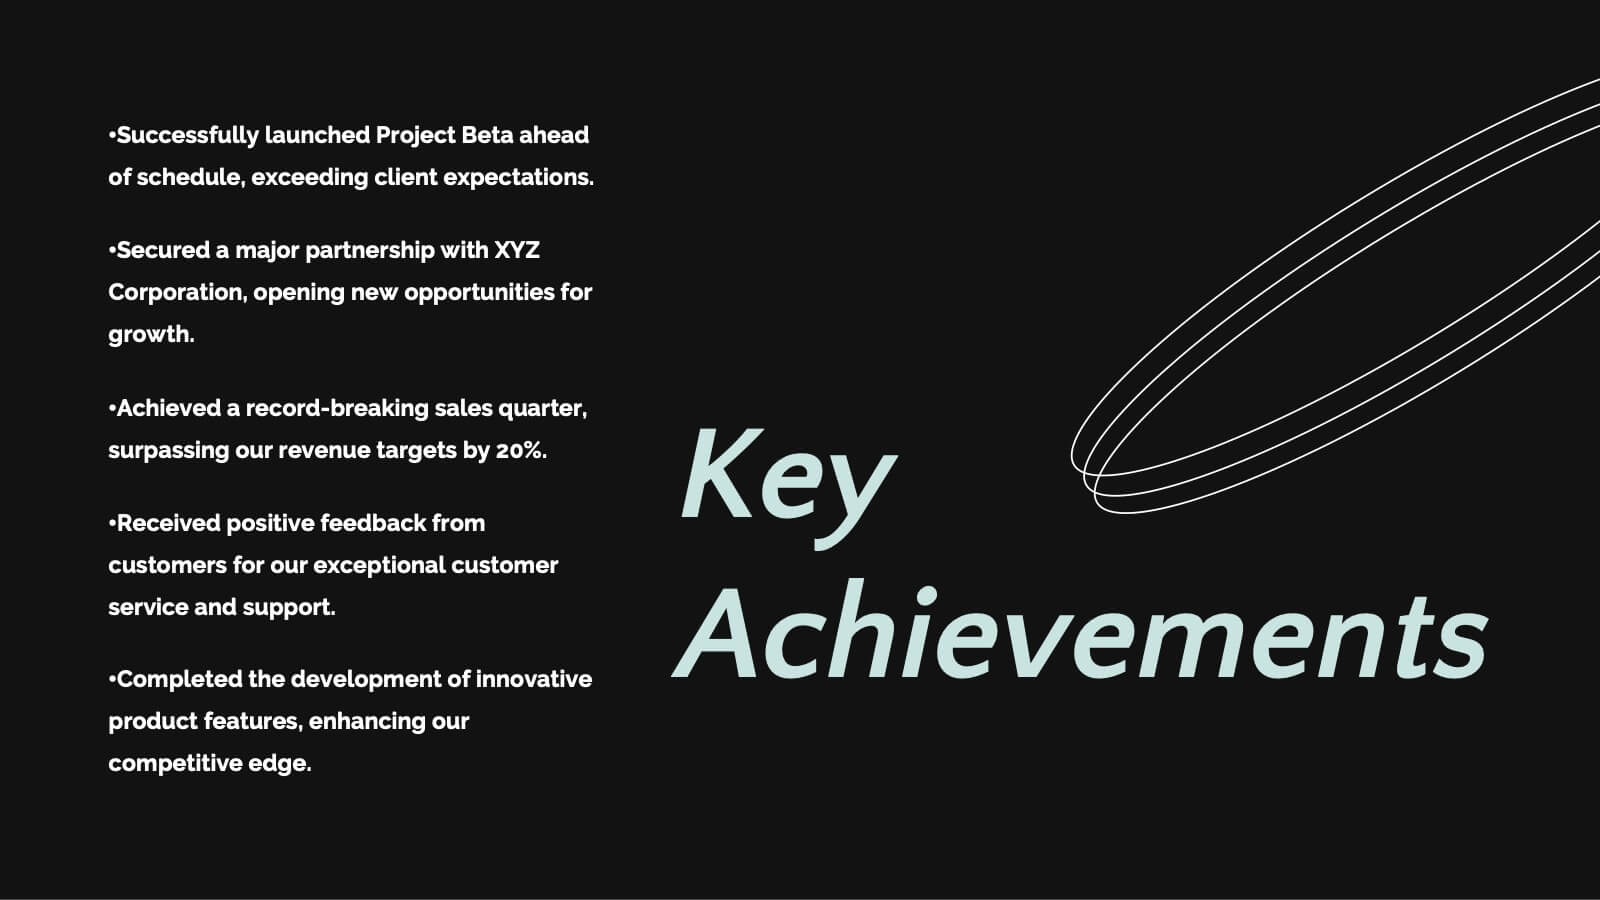
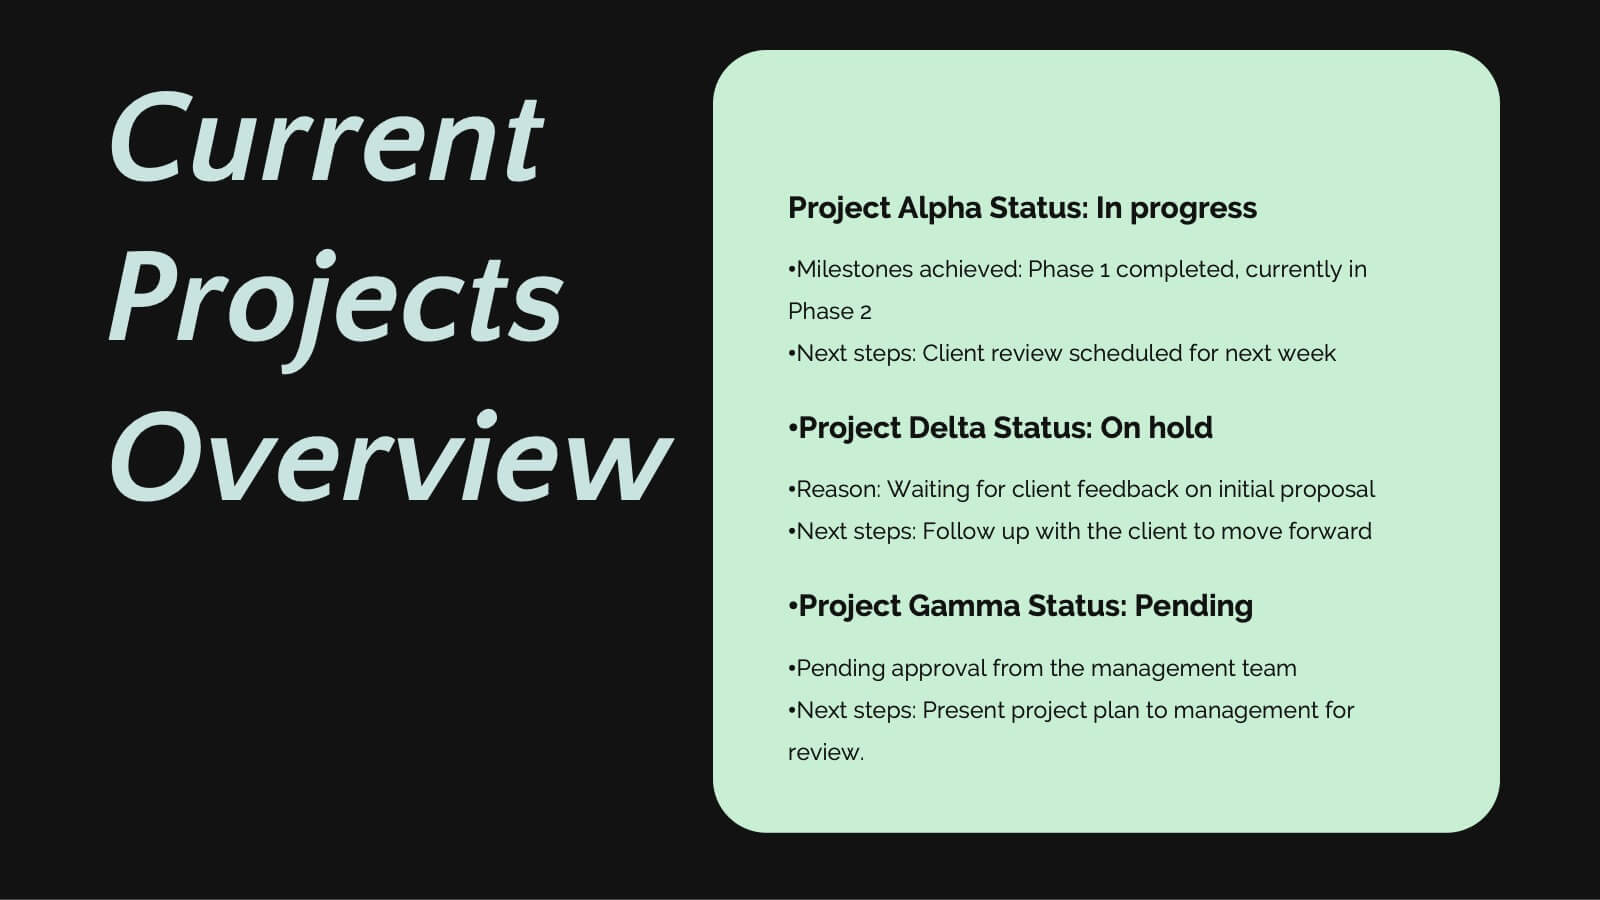
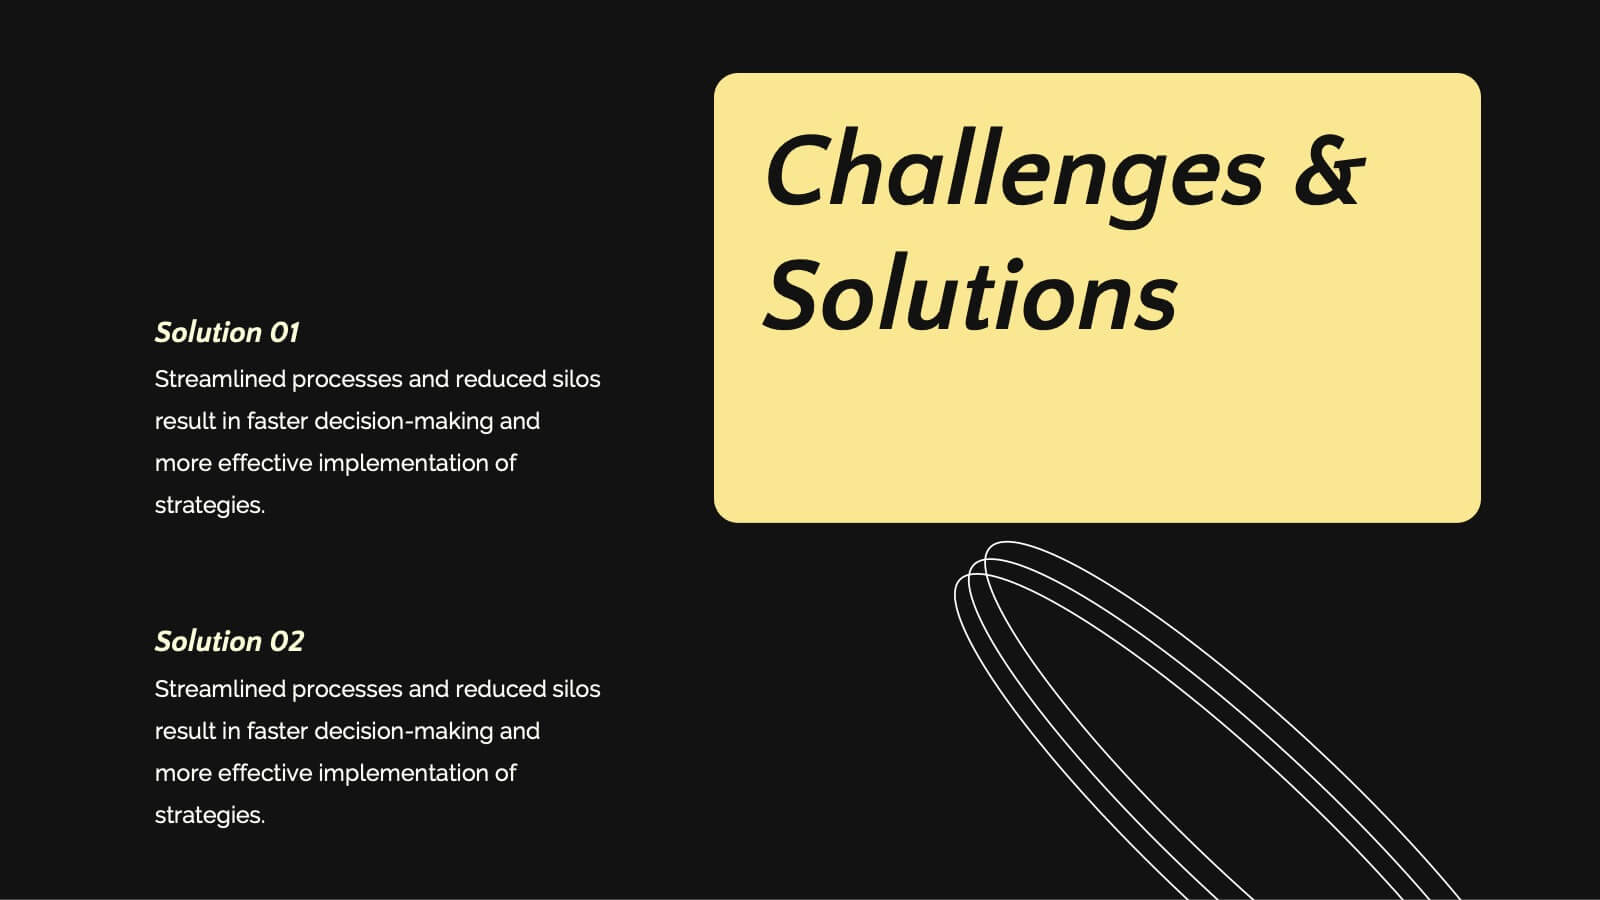
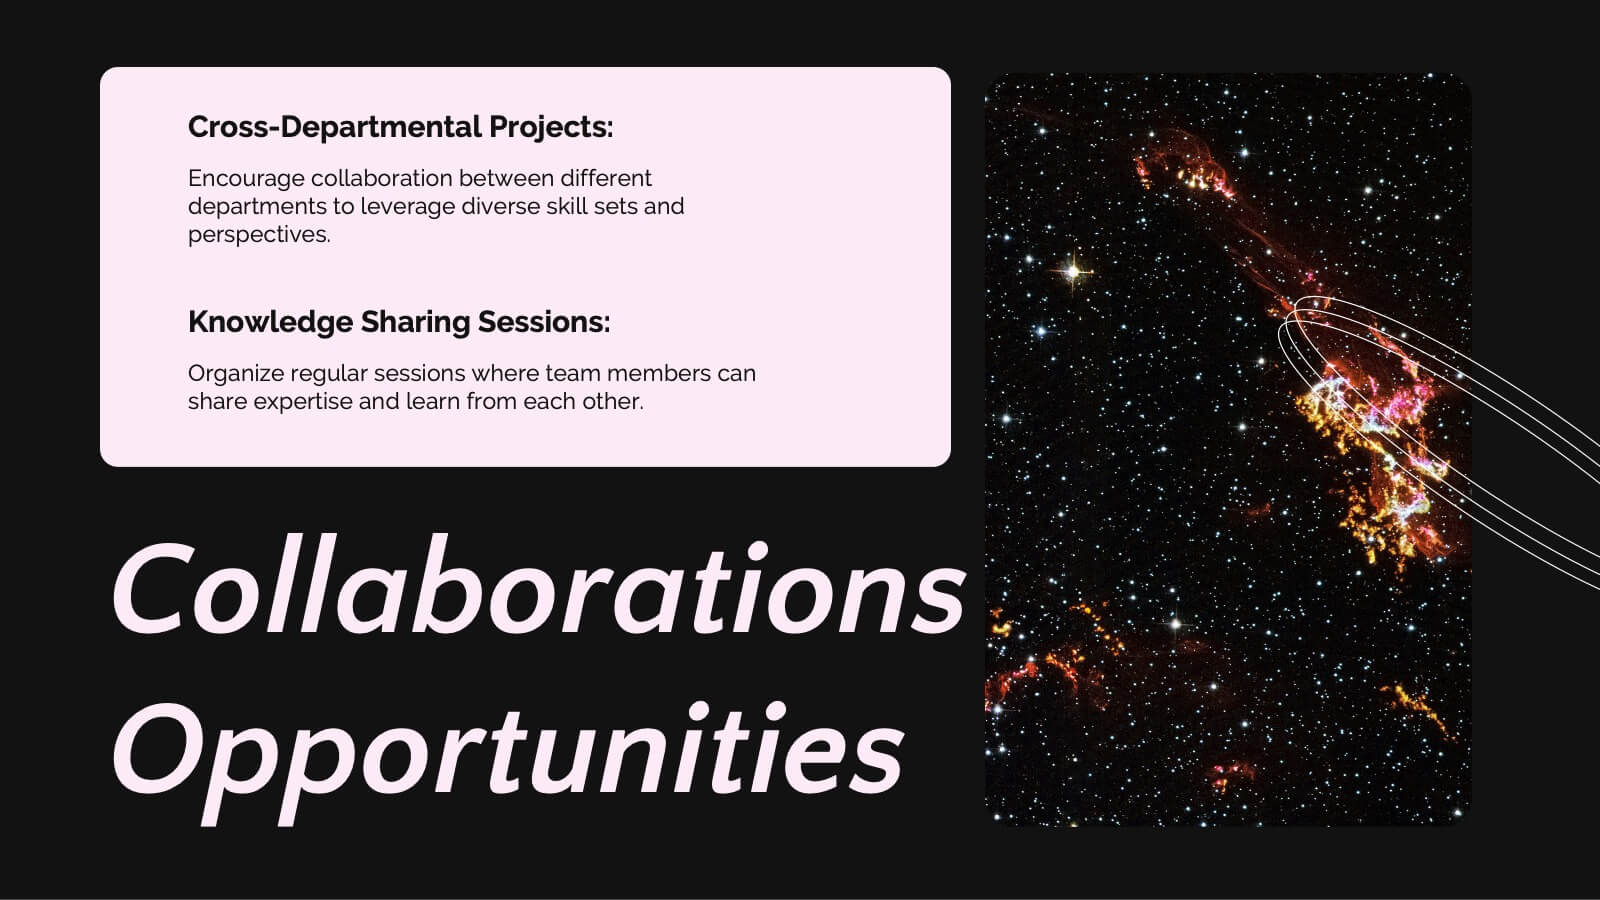
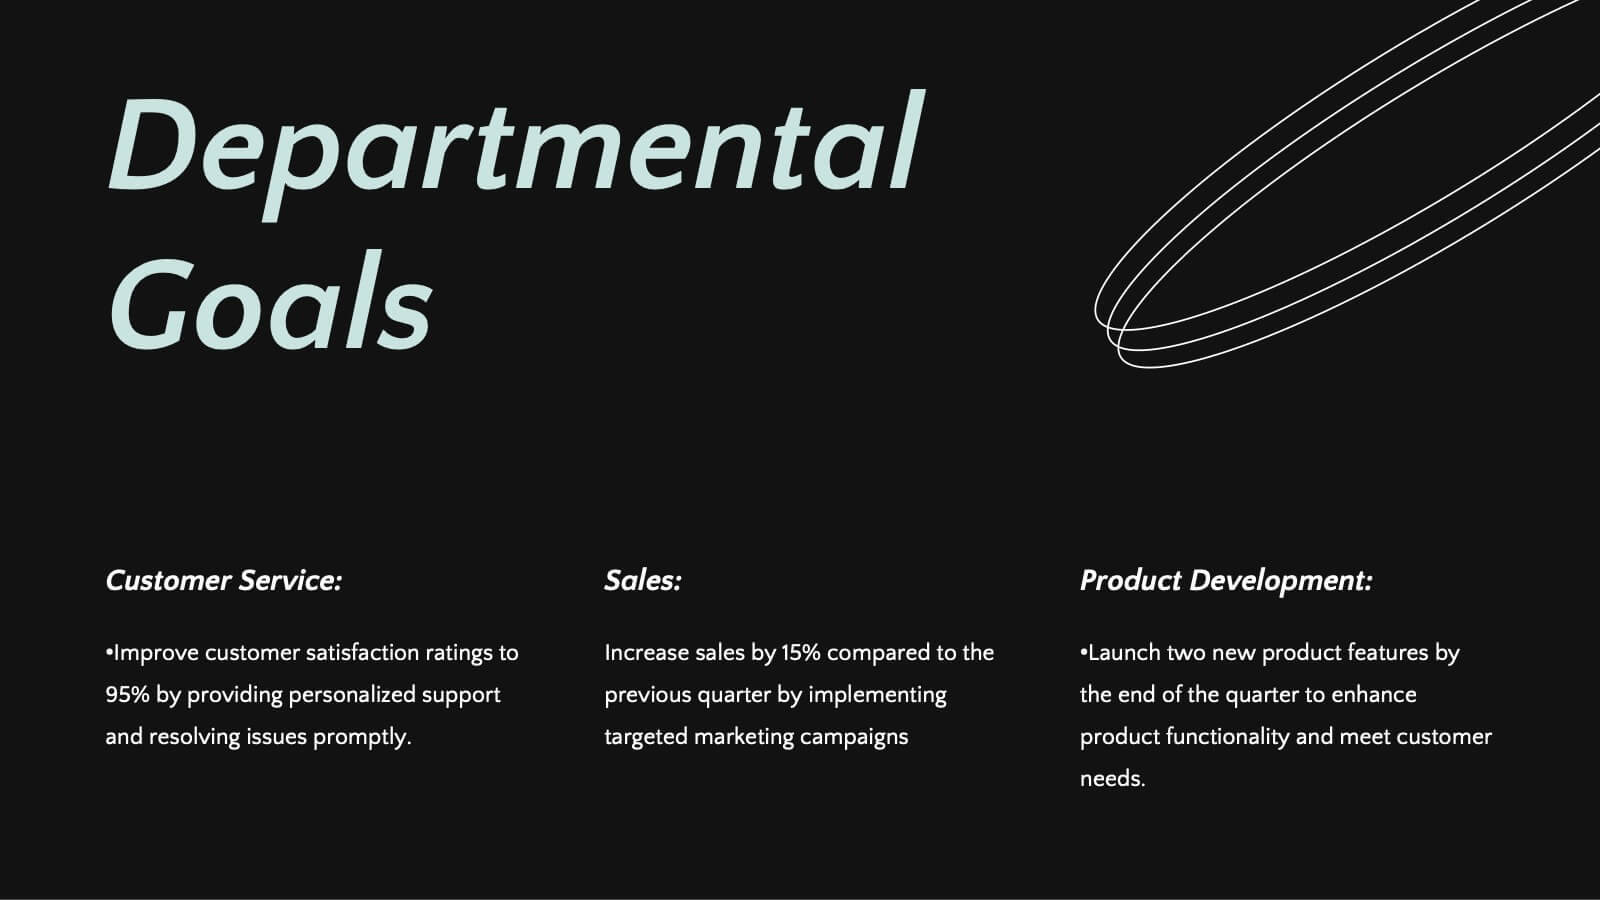
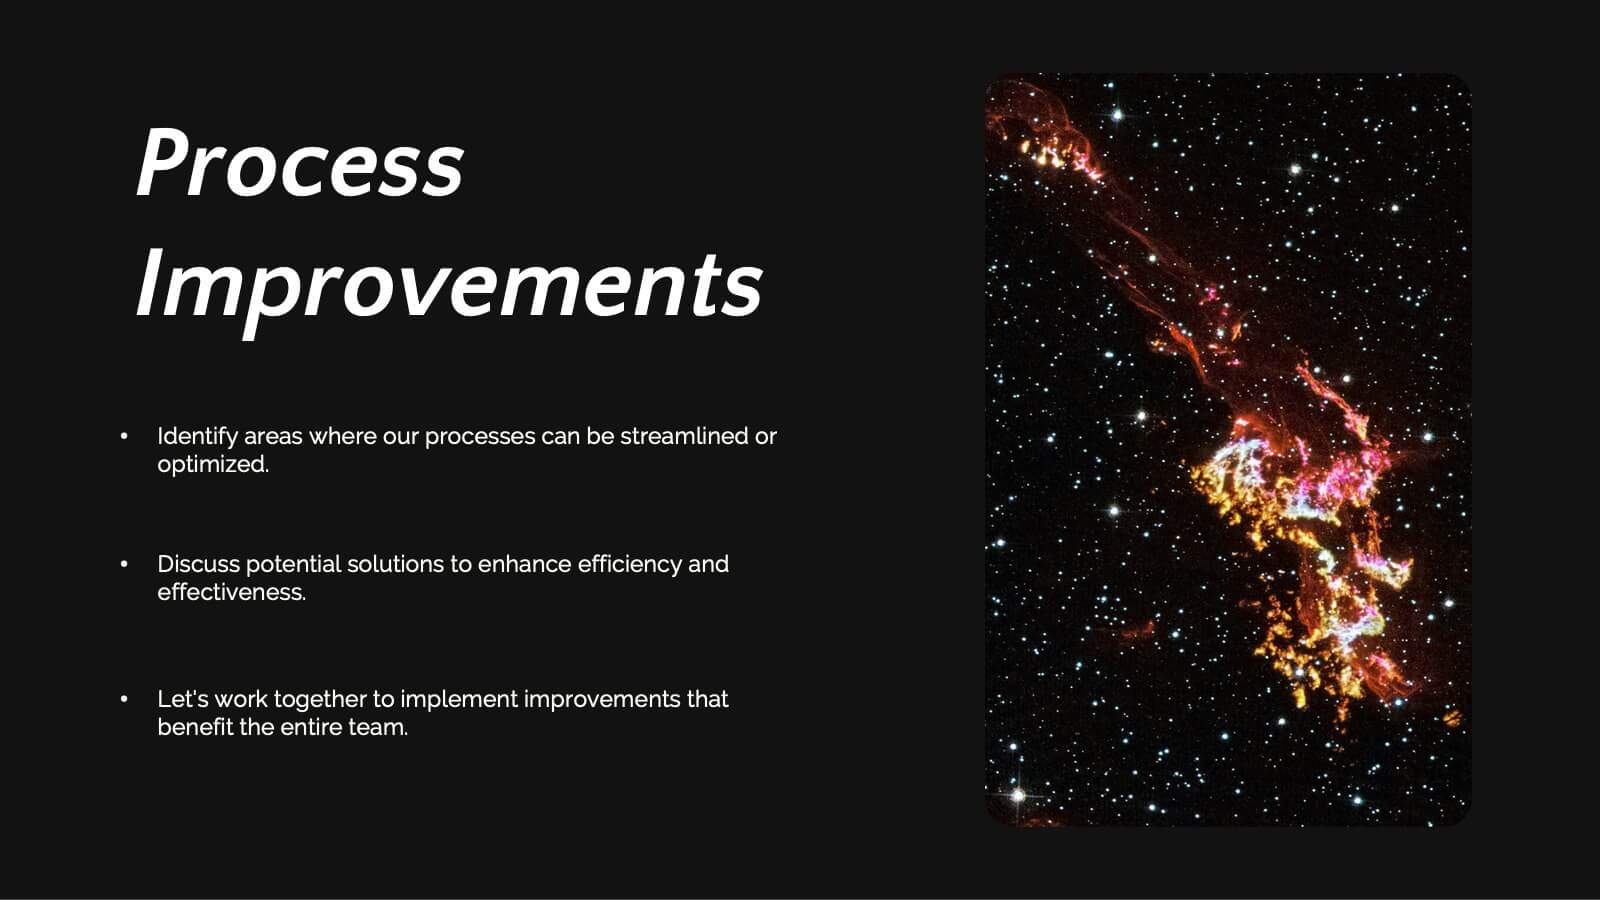
Saturn Business Plan Presentation
Embark on a journey to present your business plan like never before with this stellar presentation template! Perfect for diving deep into key updates, achievements, collaborations, and future goals, it guides your team through essential business strategies and challenges. Compatible with PowerPoint, Keynote, and Google Slides, it offers seamless flexibility and polished professionalism.


7 slides
Skills Gap Analysis Infographic Presentation Template
A skills gap analysis is a process that identifies organizational skill gaps and develops a plan to fill them. Employers use this process when they are trying to gauge their current skill sets, identify future needs and understand the best ways to meet those needs. This is an important part of your organization's recruiting strategy. Use this customizable template to gather your own insights into the skills gap in your organization. With this template you can analyze the current state of your company and team, identify areas for improvement, and create a roadmap for growing your team.


8 slides
SWOT-Based Competitive Analysis
Clearly map your organization’s strengths, weaknesses, opportunities, and threats with this dynamic infographic layout. Ideal for strategic planning sessions, this template uses a continuous loop to show interconnection between internal and external factors. Fully editable in PowerPoint, Keynote, and Google Slides.


3 slides
Time Management Techniques and Tips Presentation
Start your day like a pro—with structure, focus, and tools that work. This presentation template is designed to help you showcase effective time management strategies, productivity tips, and calendar planning methods with clean, modern visuals. Fully compatible with PowerPoint, Keynote, and Google Slides for effortless customization and professional results.


6 slides
Business Overview Company Profile Presentation
Present Your Business with a Dynamic Overview! The Business Overview Company Profile template features a modern circular flow design, perfect for showcasing company insights, key strategies, and core values. With six structured content sections, this layout helps you present information in a clear and engaging way. Whether you're introducing your business or outlining corporate initiatives, this fully editable template in PowerPoint, Keynote, and Google Slides ensures a polished and professional presentation for any industry.


21 slides
Carmenta Project Management Plan Presentation
Organize your projects with clarity using this comprehensive project management plan template. It includes slides for objectives, timelines, risk management, budget breakdowns, and team introductions. Ideal for efficient project presentations, it’s compatible with PowerPoint, Keynote, and Google Slides, offering a structured approach to showcase every project detail.


7 slides
Technology Skills Gap Infographic Presentation
A Skills Gap Infographic is a visual representation of the difference between the skills that employers need and the skills that are possessed by job seekers or employees. This template illustrates the gap between the skills that are required for a particular job and the skills that are currently available in the workforce. This template include charts, diagrams, and other visual elements that help to explain the extent of the skills gap, as well as its impact on the economy, businesses, and individuals. Use this to raise awareness about the skills gap and its implications to encourage action.


7 slides
Investment Management Infographic
Investment management, also known as asset management or fund management, involves the professional management of various securities and assets with the goal of achieving specific investment objectives for individuals, institutions, or entities. This infographic will encourage your audience to start or enhance their investment journey for financial prosperity. Customize the content, design, and visuals to craft an engaging and informative infographic that educates about investment management. This infographic should serve as a useful guide for both beginners and those looking to refine their investment strategies.


26 slides
Corporate Finance Presentation
The "Corporate Finance" template is your financial compass for presentations that require a mix of precision and clarity. Tailored for use on PowerPoint, Keynote, and Google Slides, it is perfect for demystifying the world of corporate finance. Commence with the "Wealth strategies designed for your unique journey" slide to capture the tailored approach of your financial services. The "Table of Contents" neatly outlines the topics such as investment strategies, risk management, and financial forecasting. Introduce the minds behind the numbers with "Meet Our CEO" and "Meet Our Team" slides. Utilize the "Three Option Slide" to present different financial models, and the "Chart Slide" to depict financial performance. The "Bringing a new perception of investing" slide can redefine investment approaches, while "Feel good with Earning, Feel free to call us." invites engagement. Every slide offers the opportunity to infuse data-driven insights with compelling visuals, ensuring that your "Corporate Finance" presentation not only informs but also impresses your corporate audience.


4 slides
Business KPI Metrics Dashboard Presentation
Track and present your key performance indicators clearly with this Business KPI Metrics Dashboard Presentation. Featuring modern gauge visuals, color-coded performance bars, and sectioned data blocks, this template helps you showcase financial, customer, and operational KPIs in a single glance. Fully editable and ideal for business reviews, team updates, and performance reports. Compatible with PowerPoint, Keynote, and Google Slides.


26 slides
Maki Presentation Template
Japanese cuisine is known all around the world, there is so much to try including all the different types of sushi. Maki is a 26 slide template made to help you market your services and products. The clean, simplistic design makes it easy for you to display your content in any modernized way. Maki is designed to showcase your packages, pricing and more. Help your customers feel comfortable purchasing your service or product using this template. Present your message clearly and effectively with this presentation. You can customize the design, photos, background and fonts to make it your own.


26 slides
Melo Presentation Template
Are you looking for a presentation to make your product stand out? Melo is a beautifully elegant presentation with modern elements and light neutral color palette. Perfect for furniture brands, or any one looking for a modern presentation. These slides include world maps, company slides, mockups and charts perfect for businesses, this template has everything you'll need. It's simple yet chic design makes it stand out and at the same time keep your audience engaged. This is the perfect choice for businesses, brands or anyone who needs to make a great looking template on their next presentation


6 slides
Bitcoin and Blockchain Technology Presentation
Unlock the potential of cryptocurrency and distributed ledger technology with our "Bitcoin and Blockchain Technology" presentation templates. These templates are designed to elucidate complex concepts in an understandable format, making them ideal for educators, technologists, and business professionals. Compatible with PowerPoint, Keynote, and Google Slides, they are a versatile tool for anyone looking to explain or explore the innovative world of blockchain.


5 slides
Customer Relationship Strategy Presentation
Refine your approach to customer interactions with the "Customer Relationship Strategy" presentation templates. Perfect for delineating clear, actionable strategies to enhance client engagement and satisfaction, these templates are a must-have for businesses focused on building lasting customer relationships. Compatible with PowerPoint, Keynote, and Google Slides, they provide the tools to effectively communicate your customer relationship policies and goals.


4 slides
Buyer Persona and Market Segmentation Presentation
Visualize ideal customer types with this engaging buyer persona template. Showcase personality traits, goals, brand affinities, and bios in a stylish format with tropical-inspired accents. Ideal for market segmentation, branding, and campaign alignment. Fully editable in PowerPoint, Keynote, and Google Slides to match your marketing strategy and presentation tone.