


Features
- 5 Unique slides
- Fully editable and easy to edit in Microsoft Powerpoint, Keynote and Google Slides
- 16:9 widescreen layout
- Clean and professional designs
- Export to JPG, PDF or send by email


Do you have any questions?
Recommend


5 slides
Brainstorming Spider Chart Presentation
Turn your ideas into action with a clean, modern design that keeps every thought connected and easy to follow. This presentation helps teams brainstorm, organize concepts, and refine strategies with clarity and flow. Fully editable and compatible with PowerPoint, Keynote, and Google Slides for seamless collaboration.


4 slides
Lab Research Data Analysis Layout Presentation
Present your scientific findings with clarity using this Lab Research Data Analysis Layout Template. Featuring molecular, lab flask, and data icons in a connected node design, it's ideal for researchers and analysts. Fully editable in PowerPoint, Keynote, and Google Slides, this clean layout ensures your data is both visual and professional.


10 slides
Employee Retention and HR Strategy Presentation
Present your HR initiatives with a clean, puzzle-inspired visual in this Employee Retention and HR Strategy slide. This layout features a silhouette icon alongside a 5-step vertical format—each step with its own icon and title box—to illustrate key elements like onboarding, employee engagement, recognition programs, and more. Fully editable and compatible with PowerPoint, Keynote, and Google Slides.


20 slides
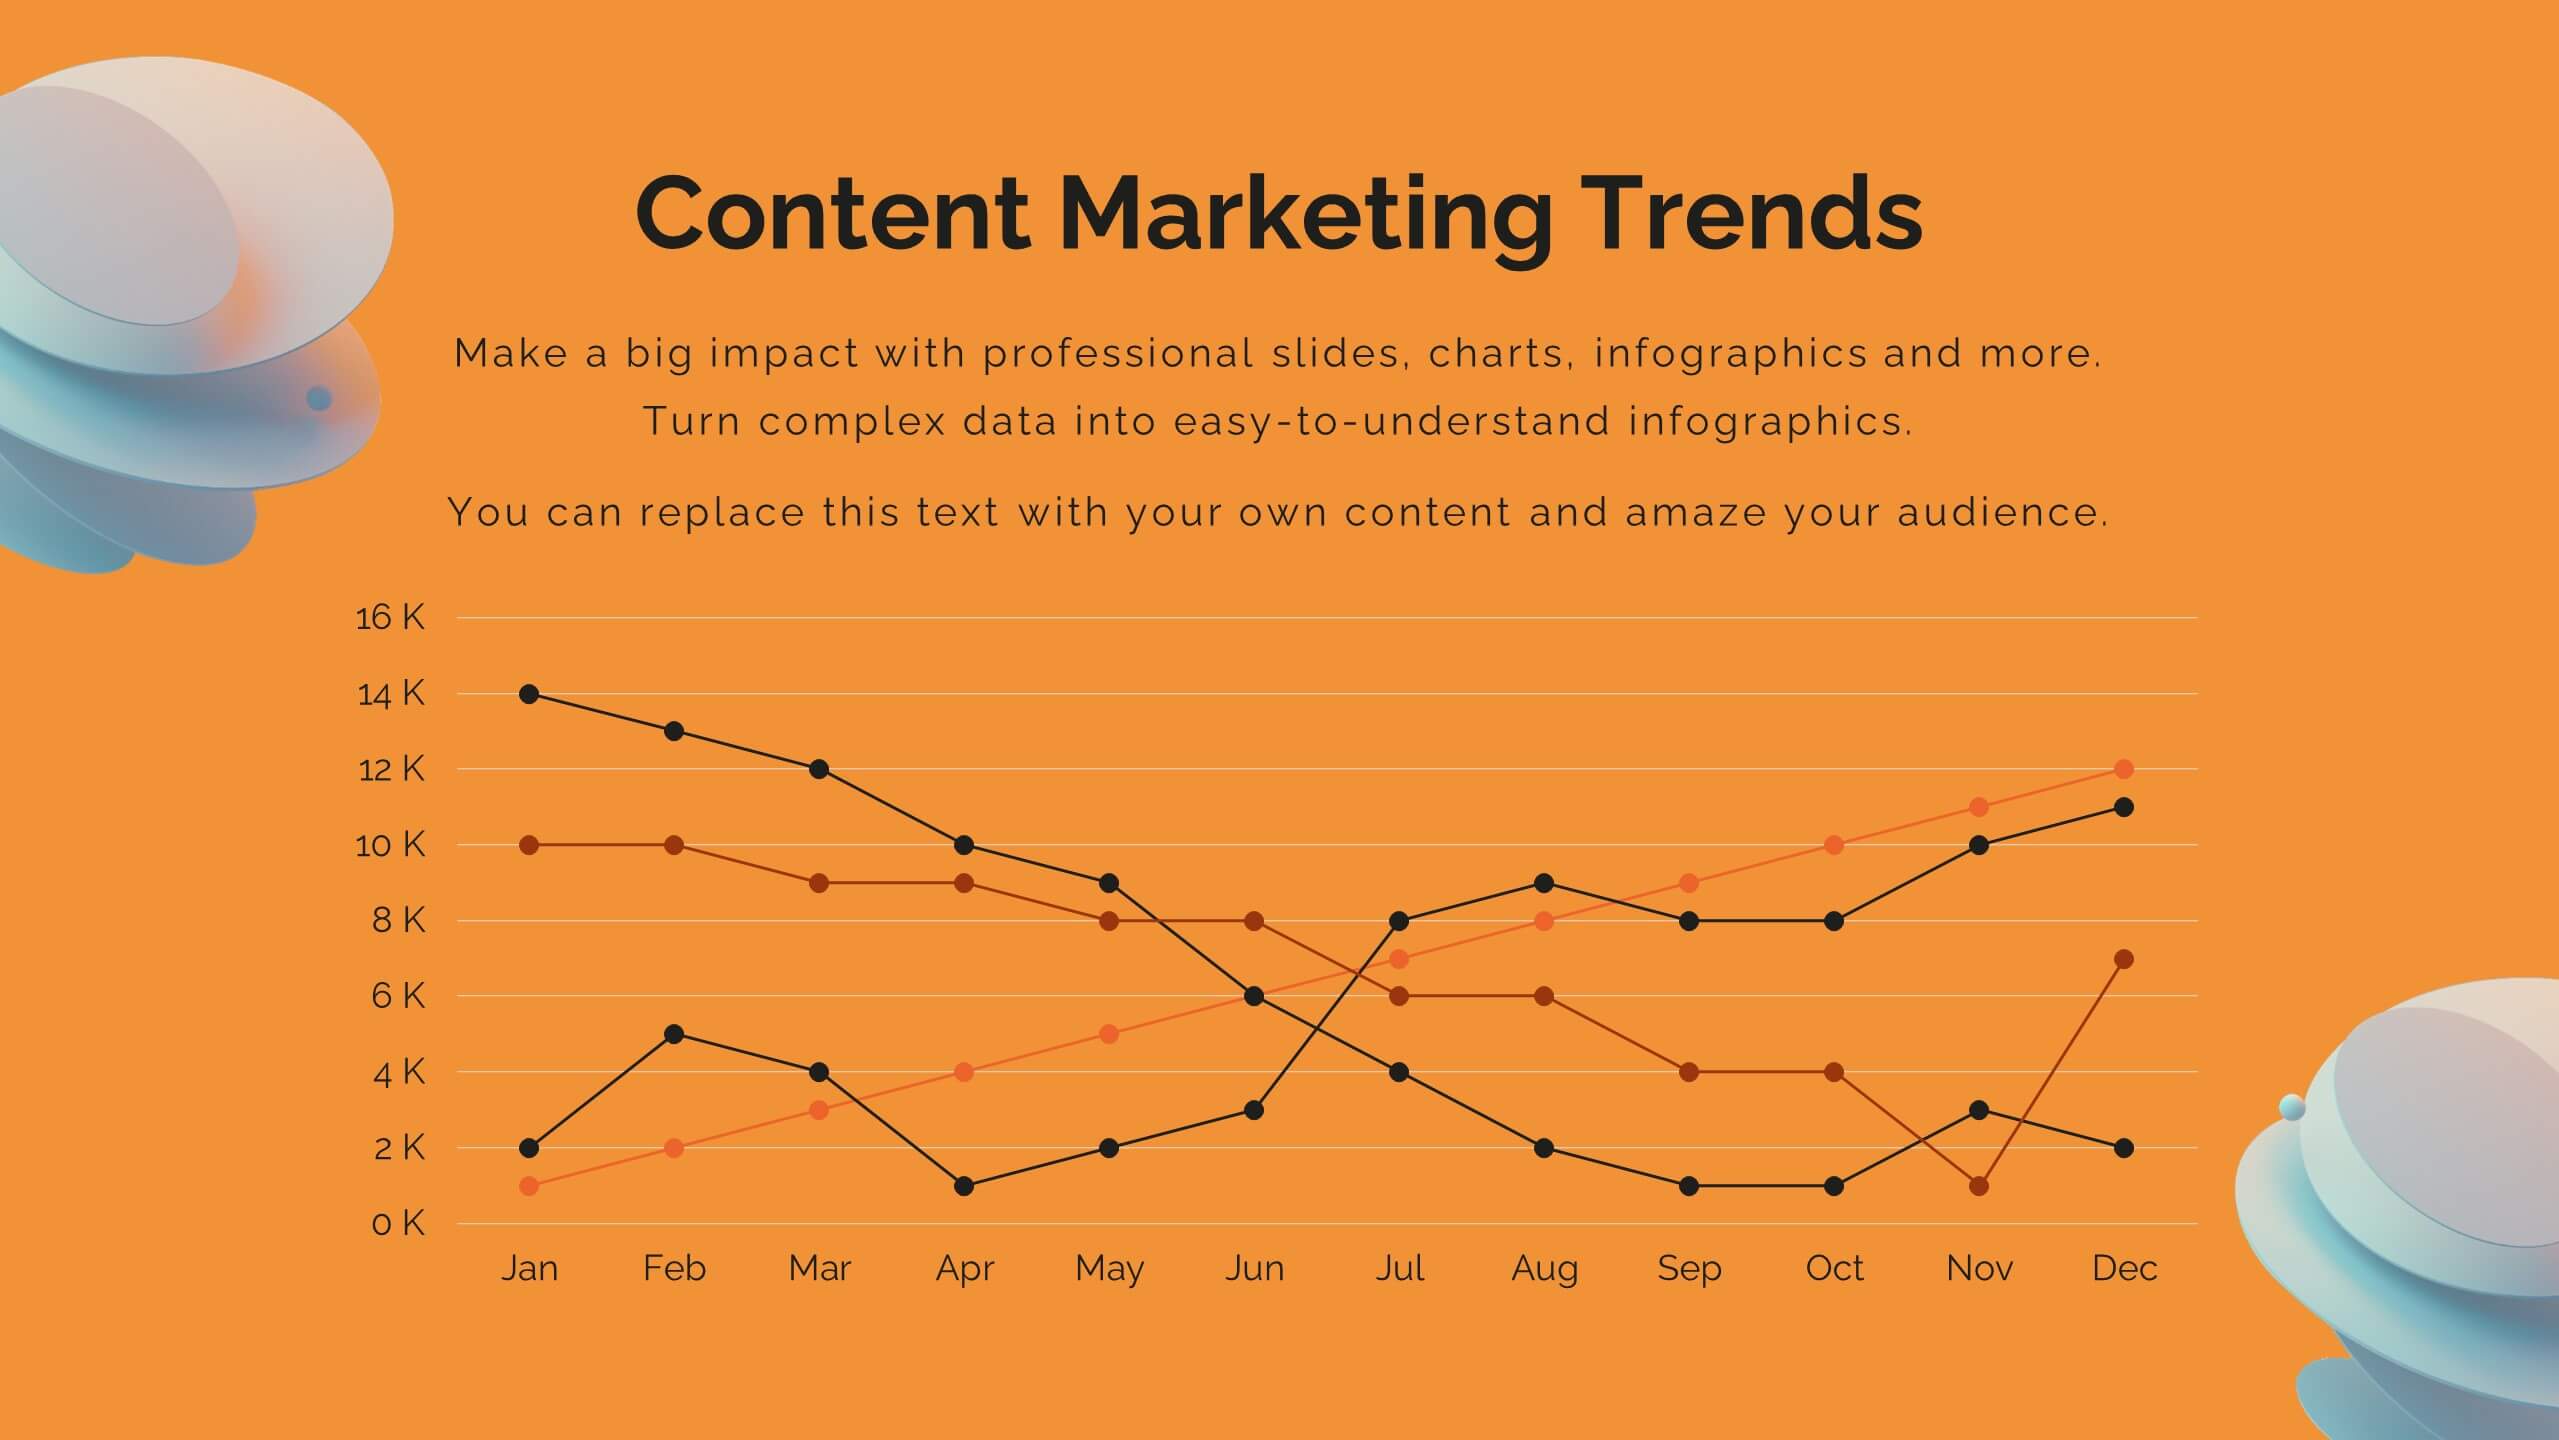
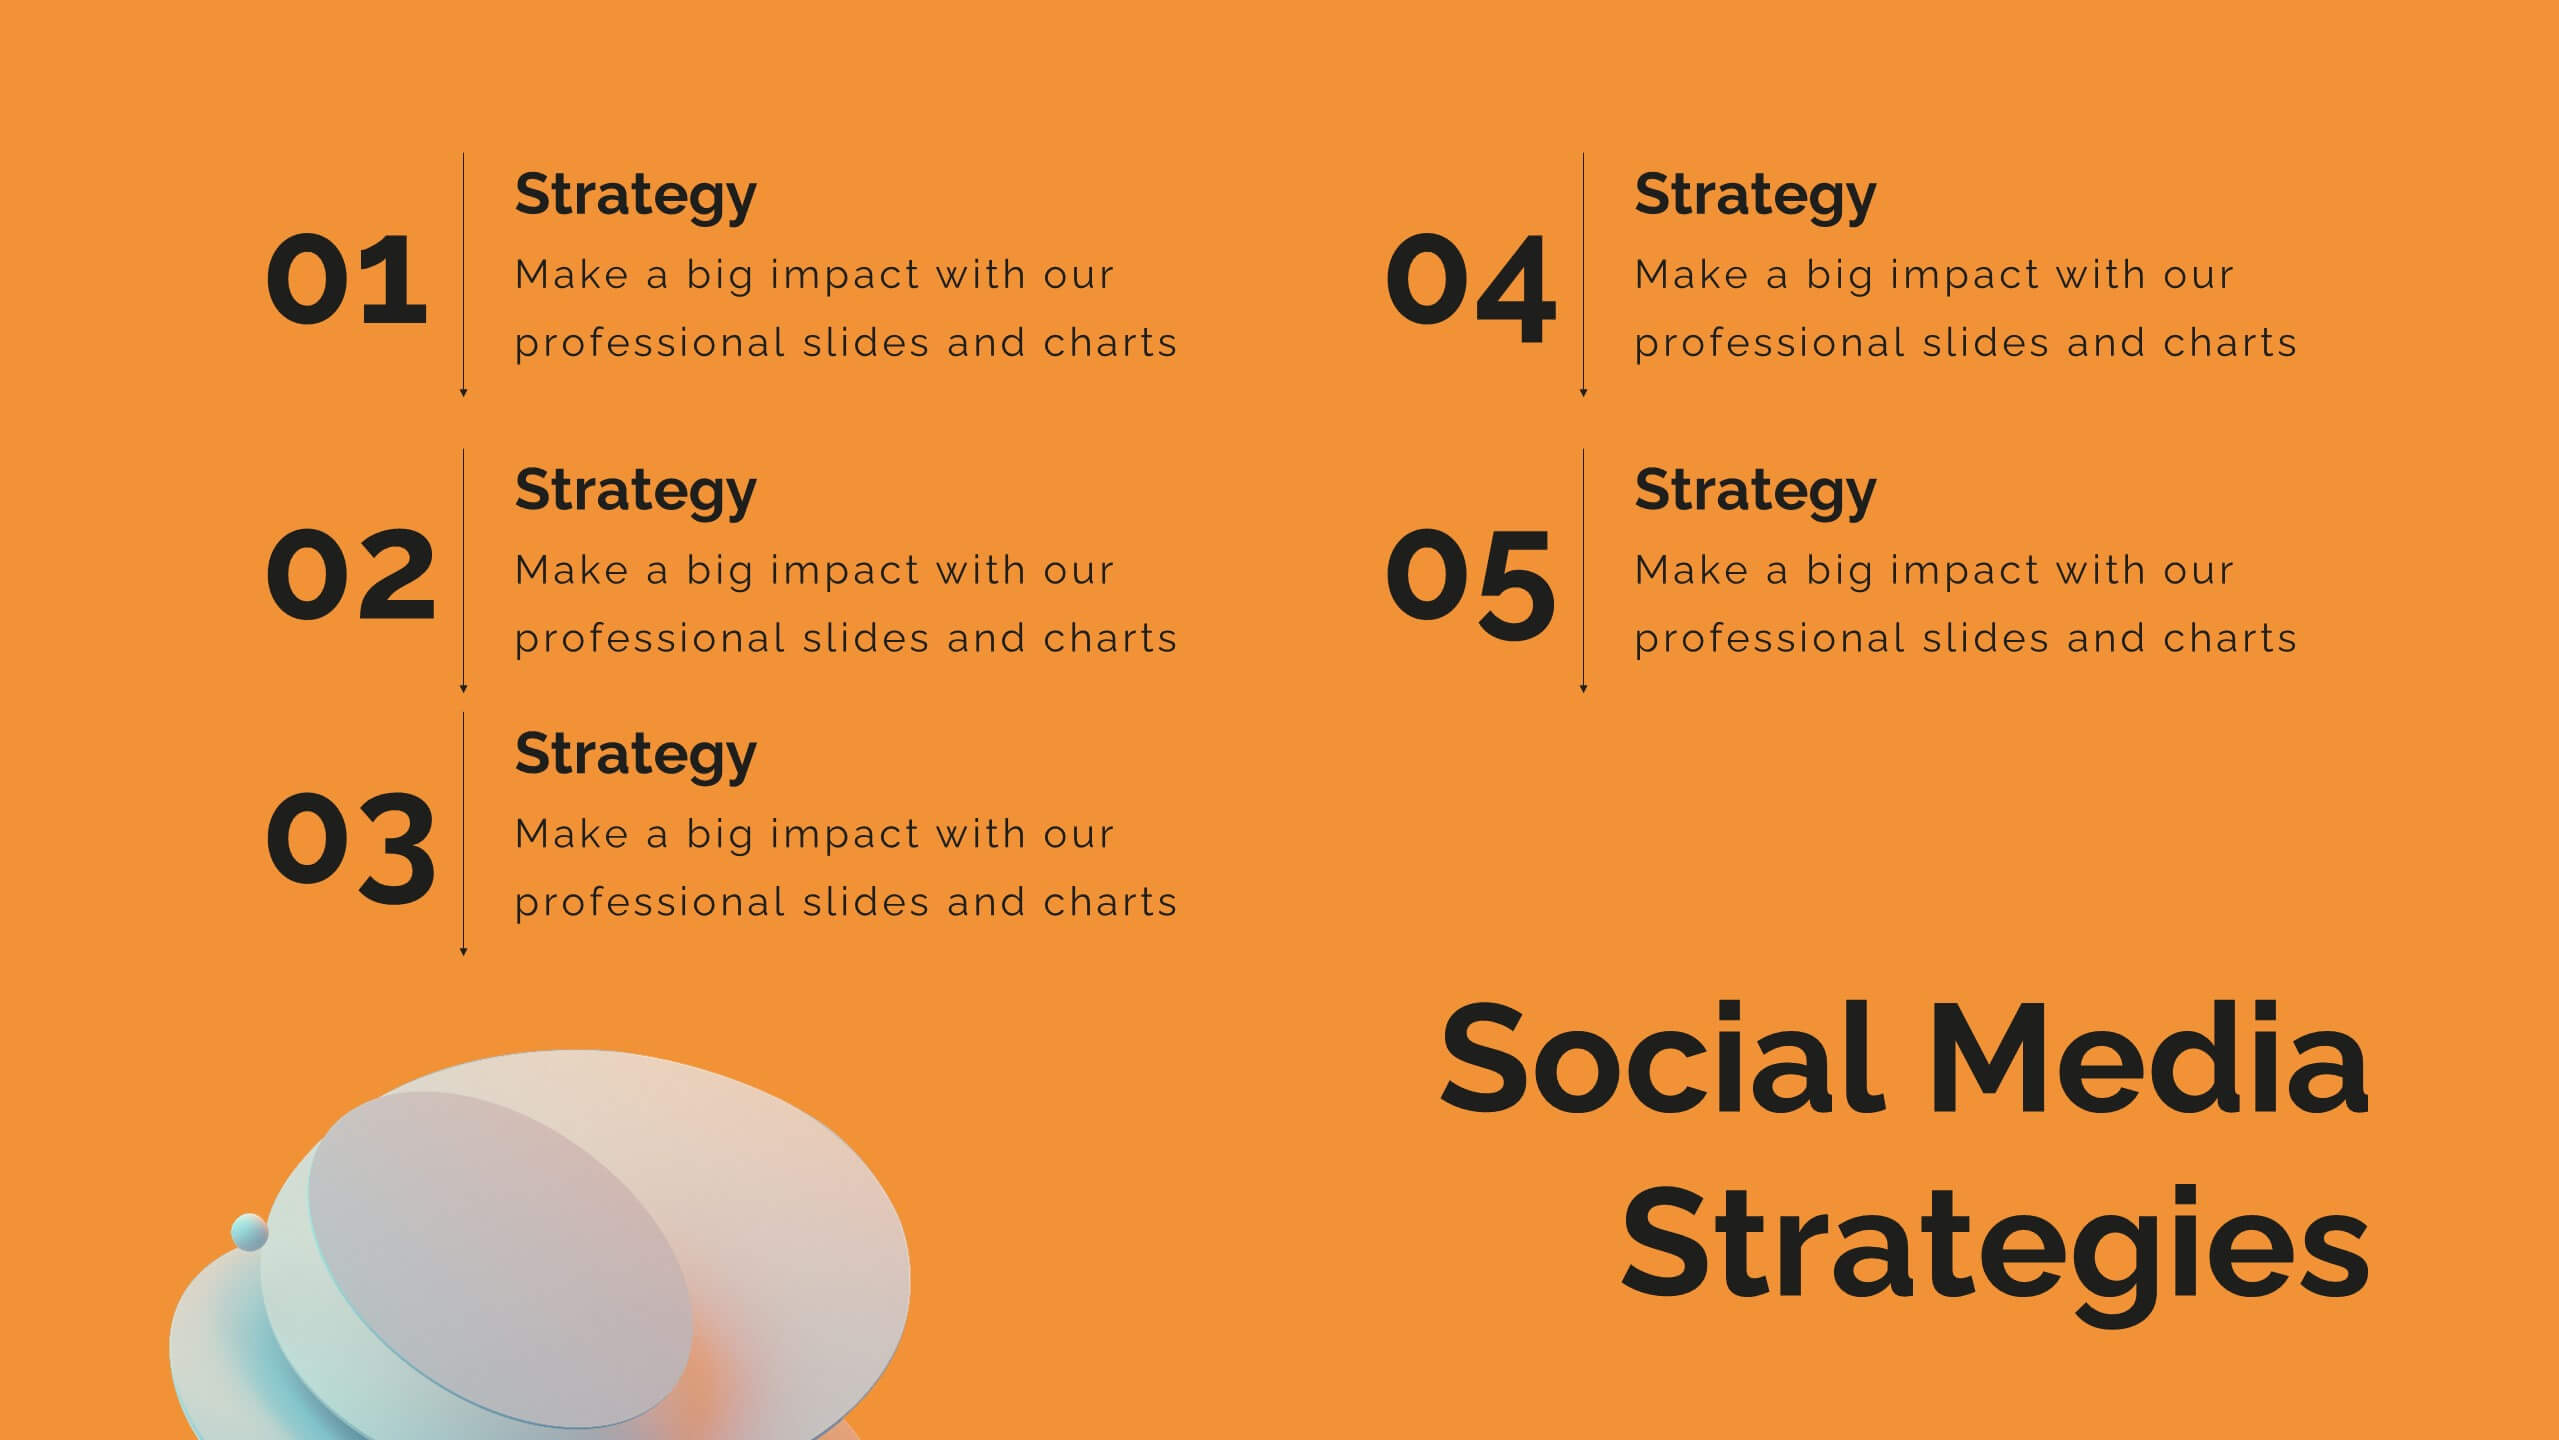
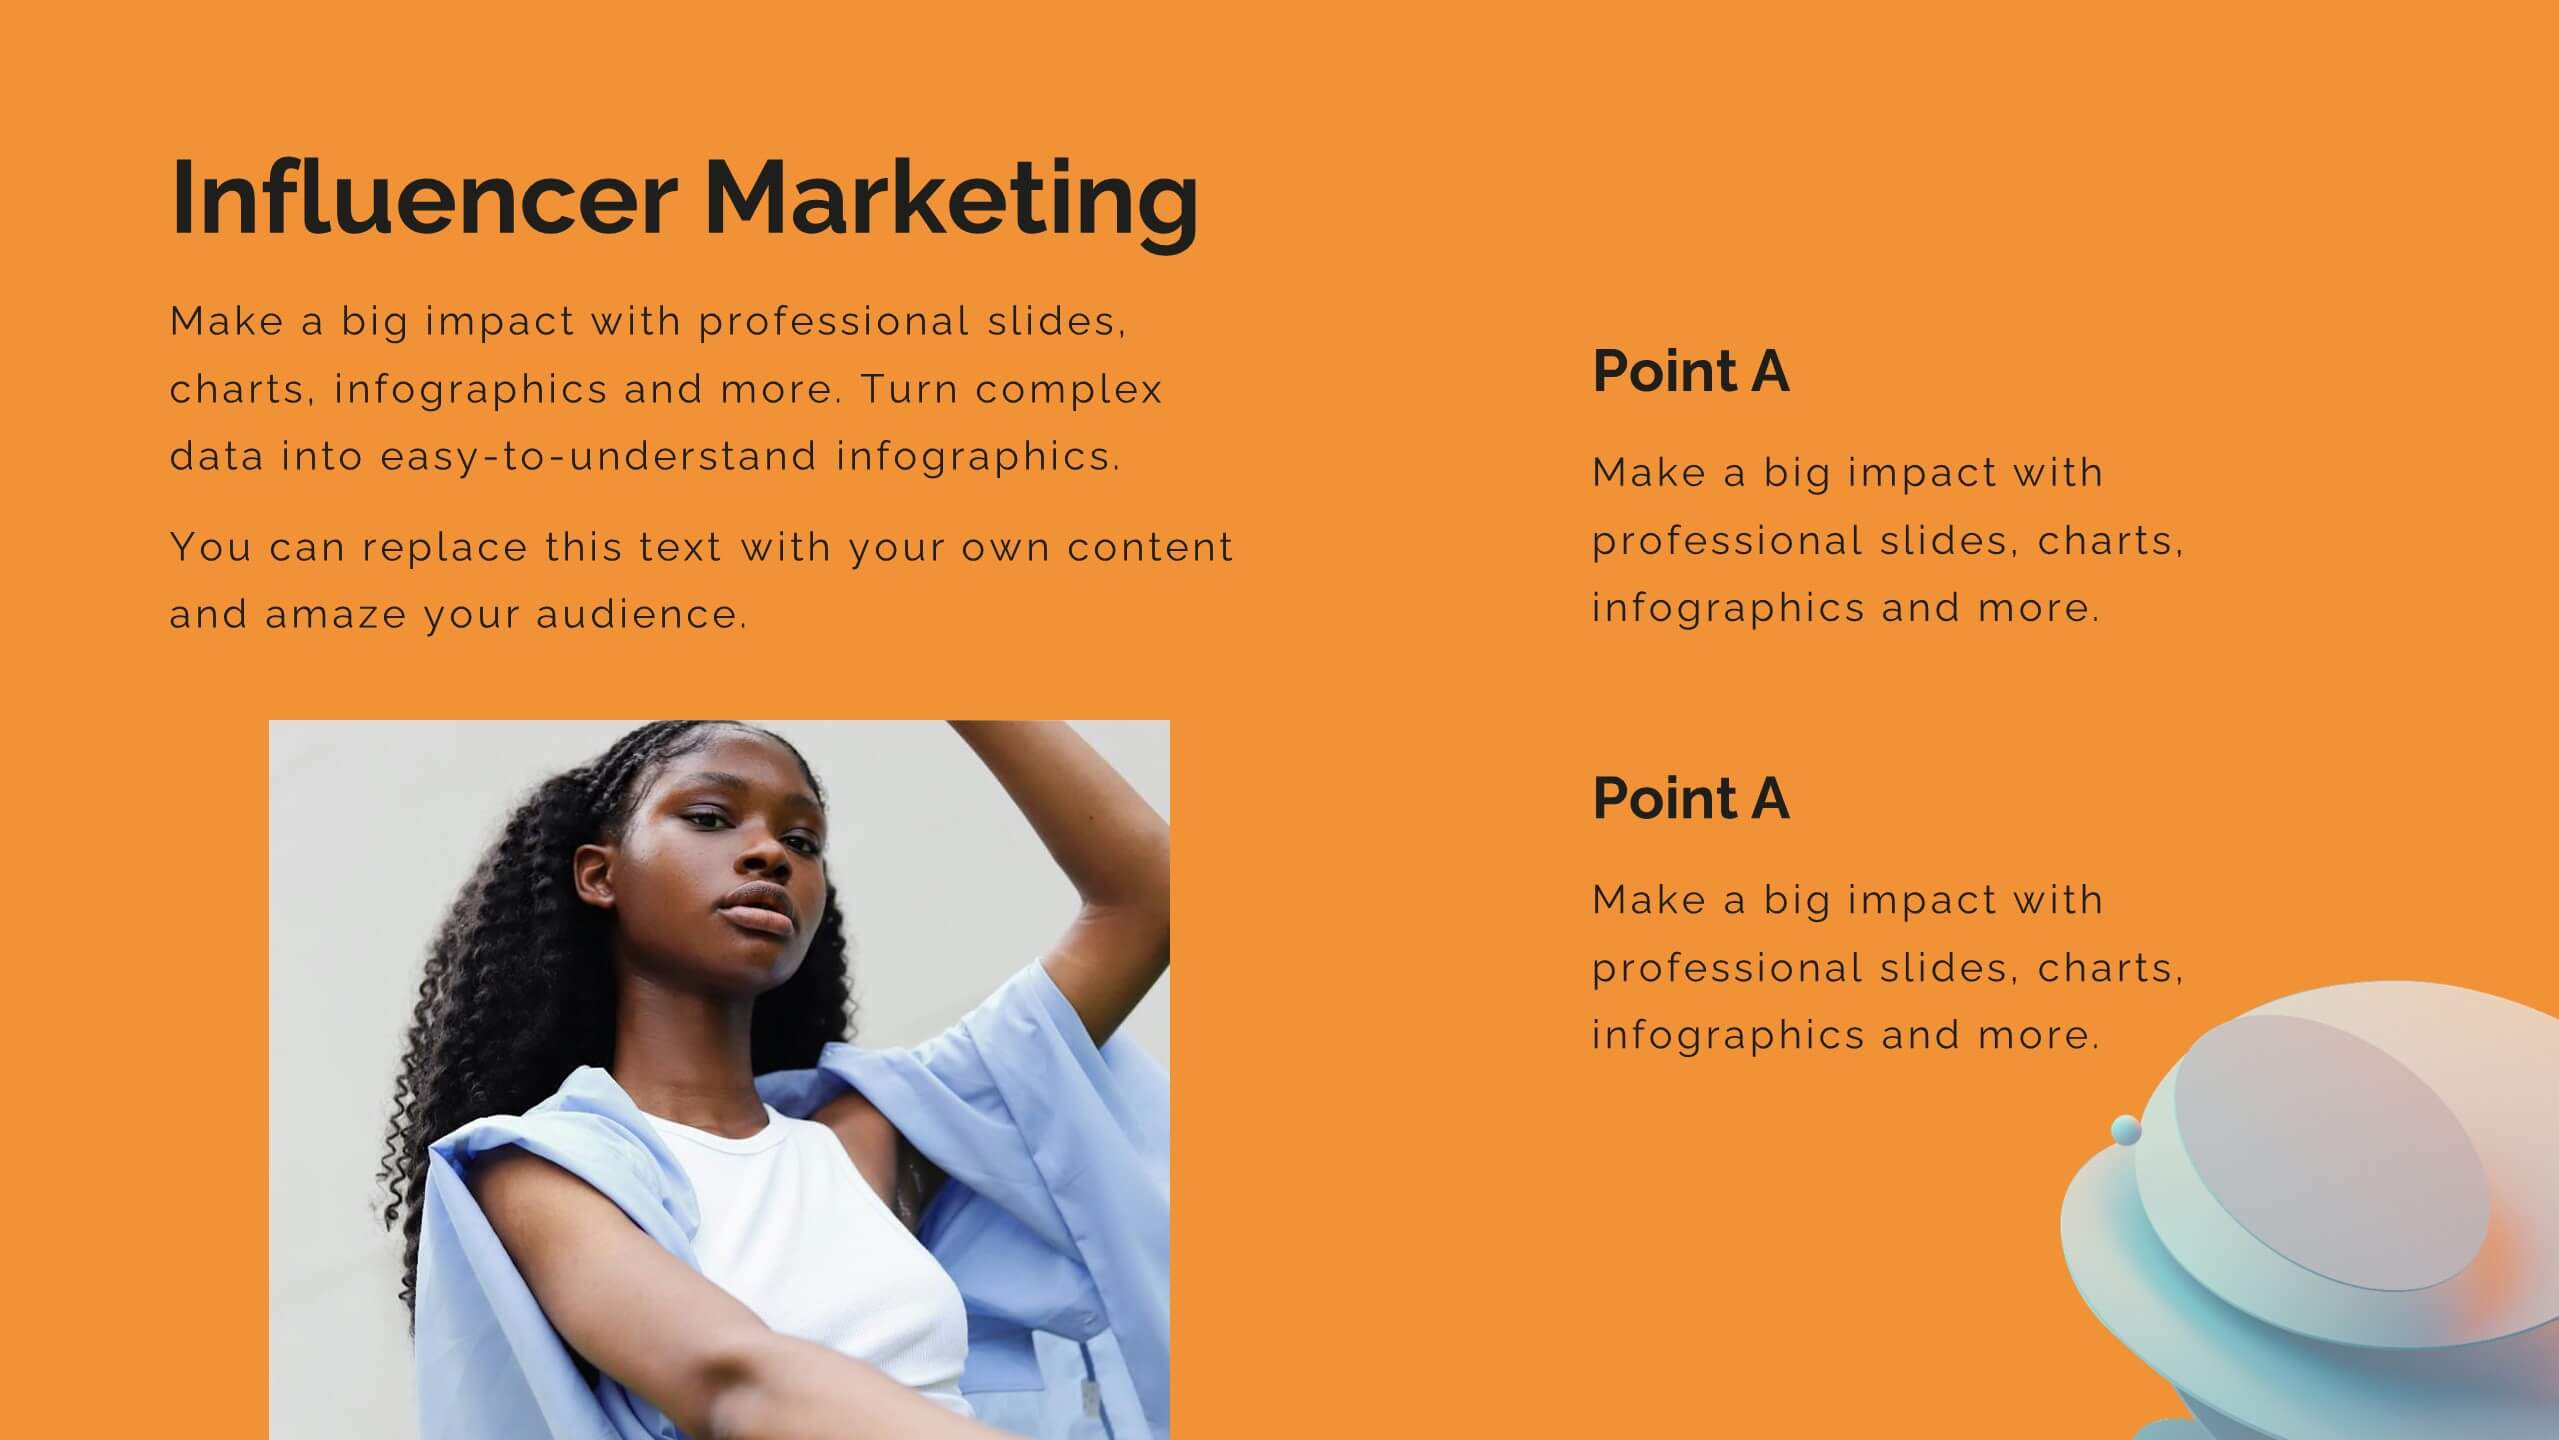
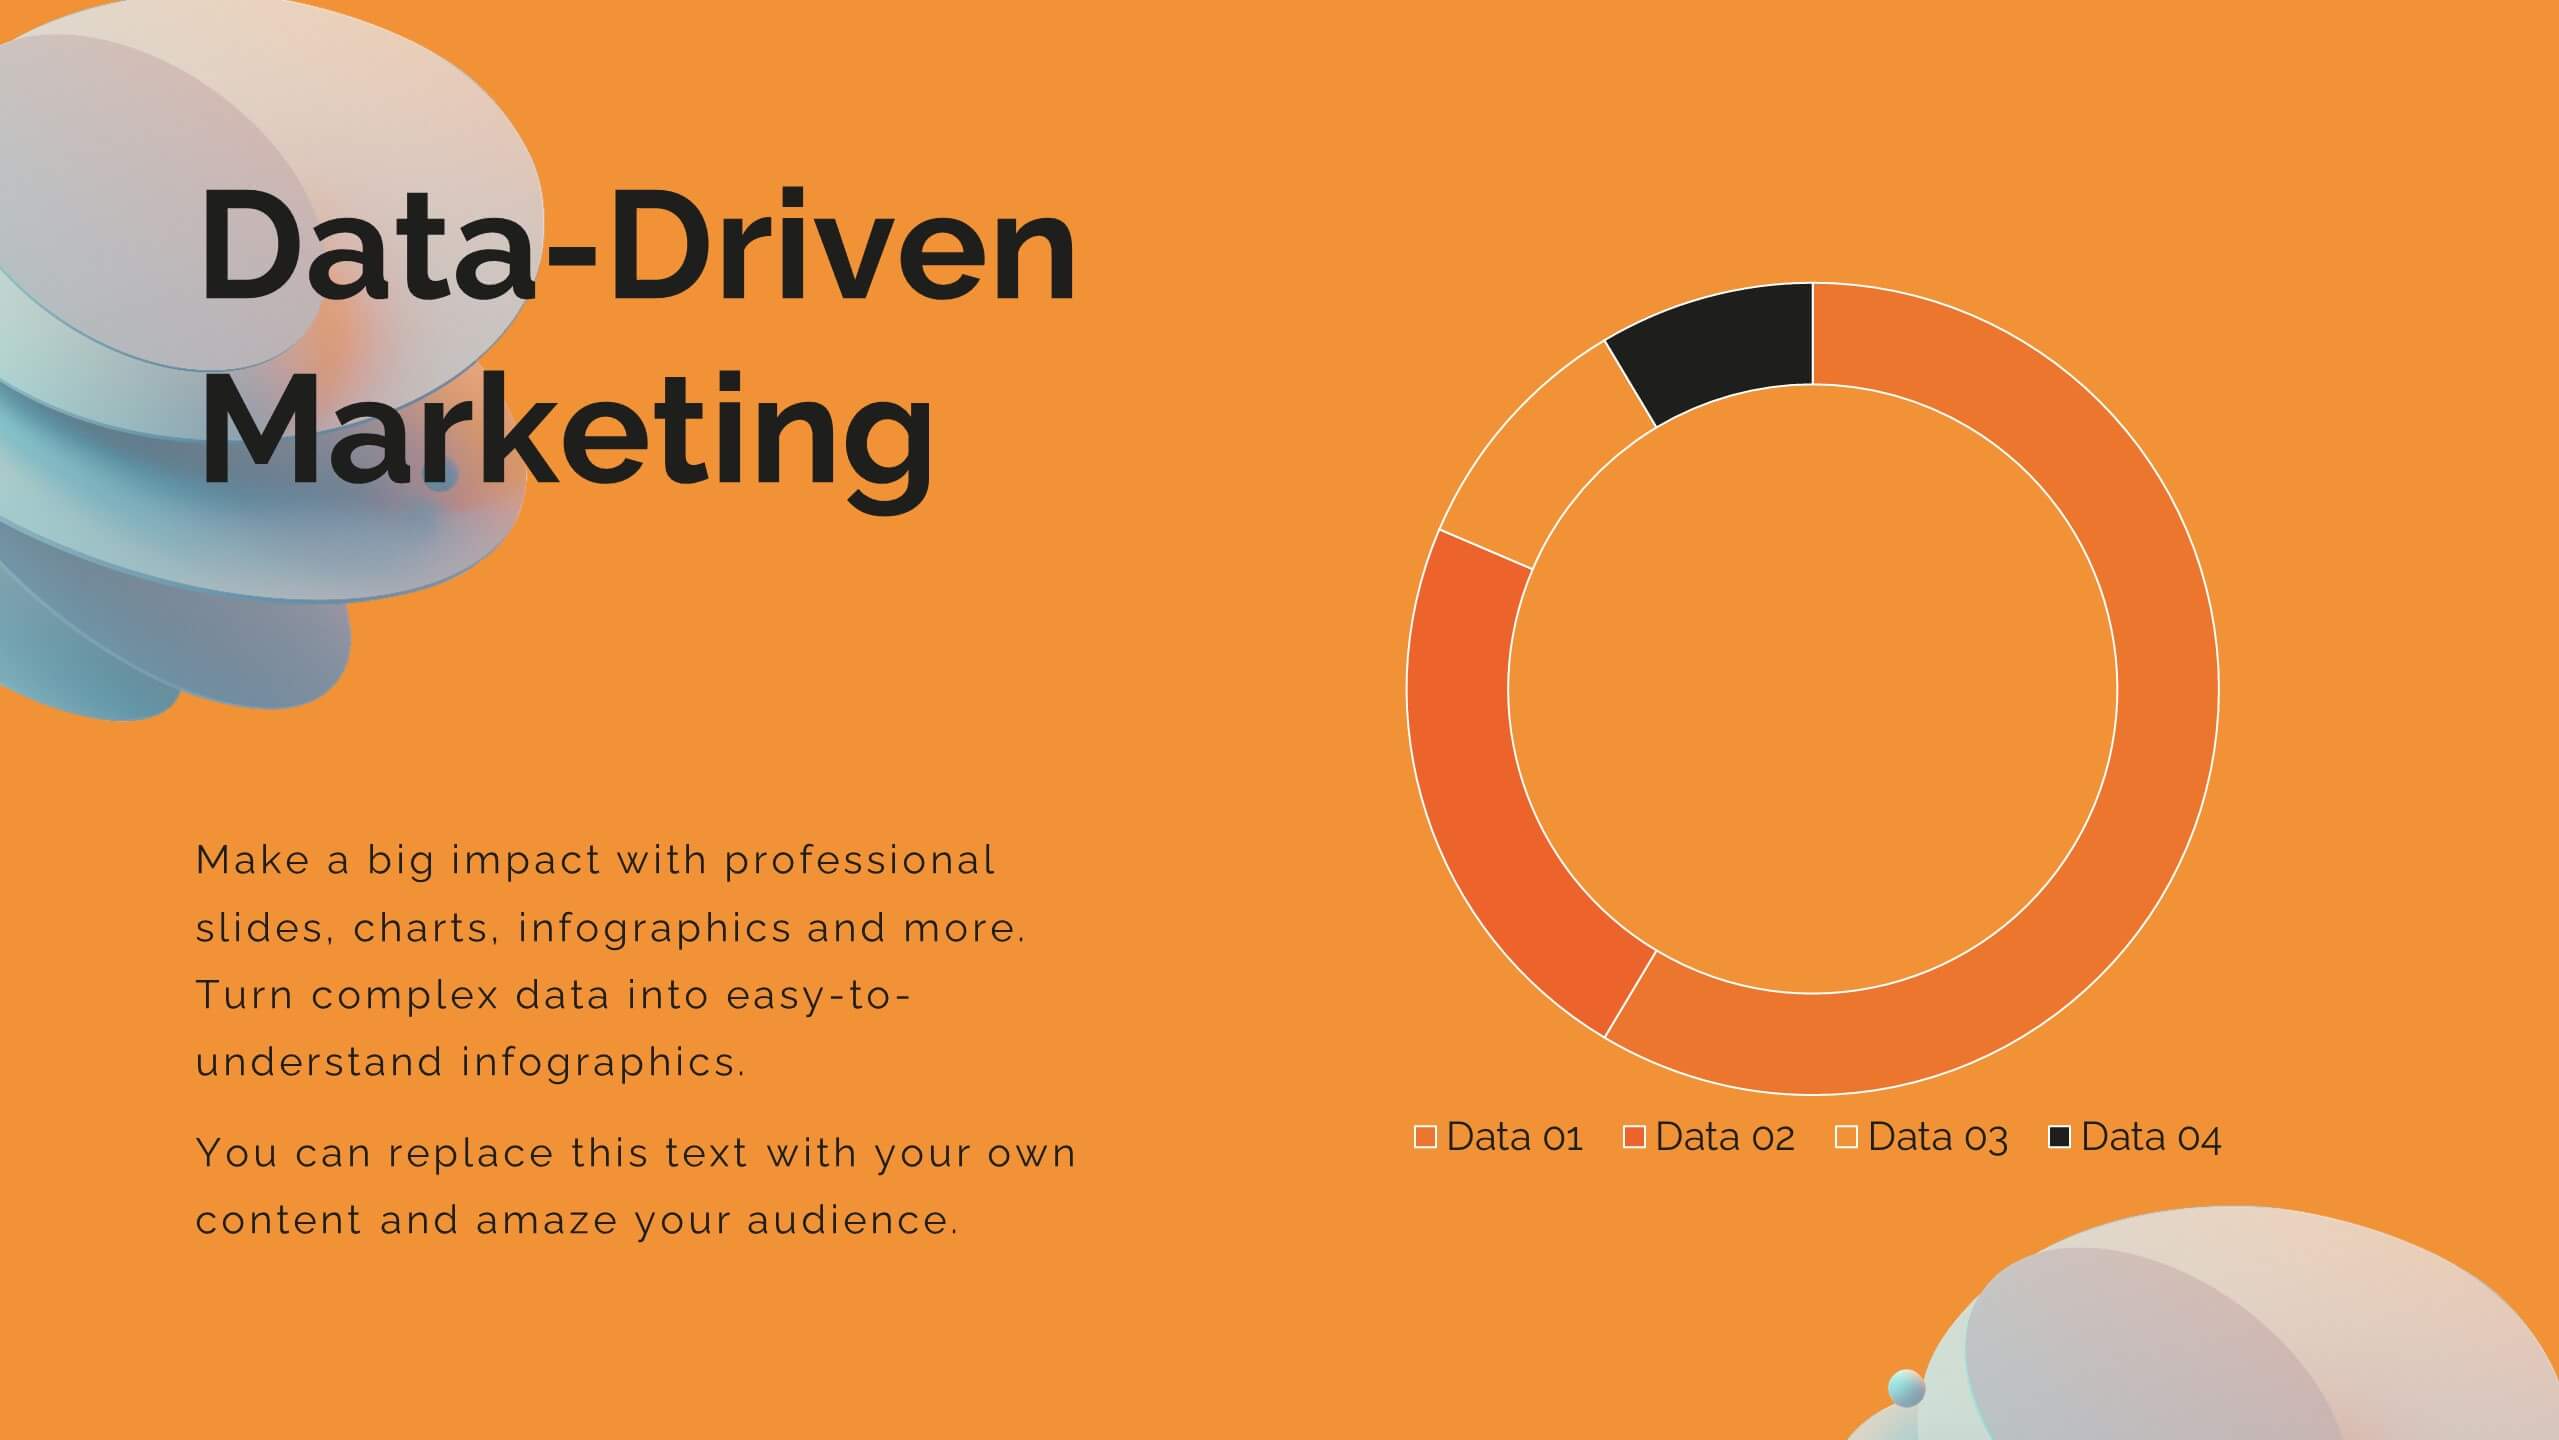
Breeze Content Marketing Pitch Deck Presentation
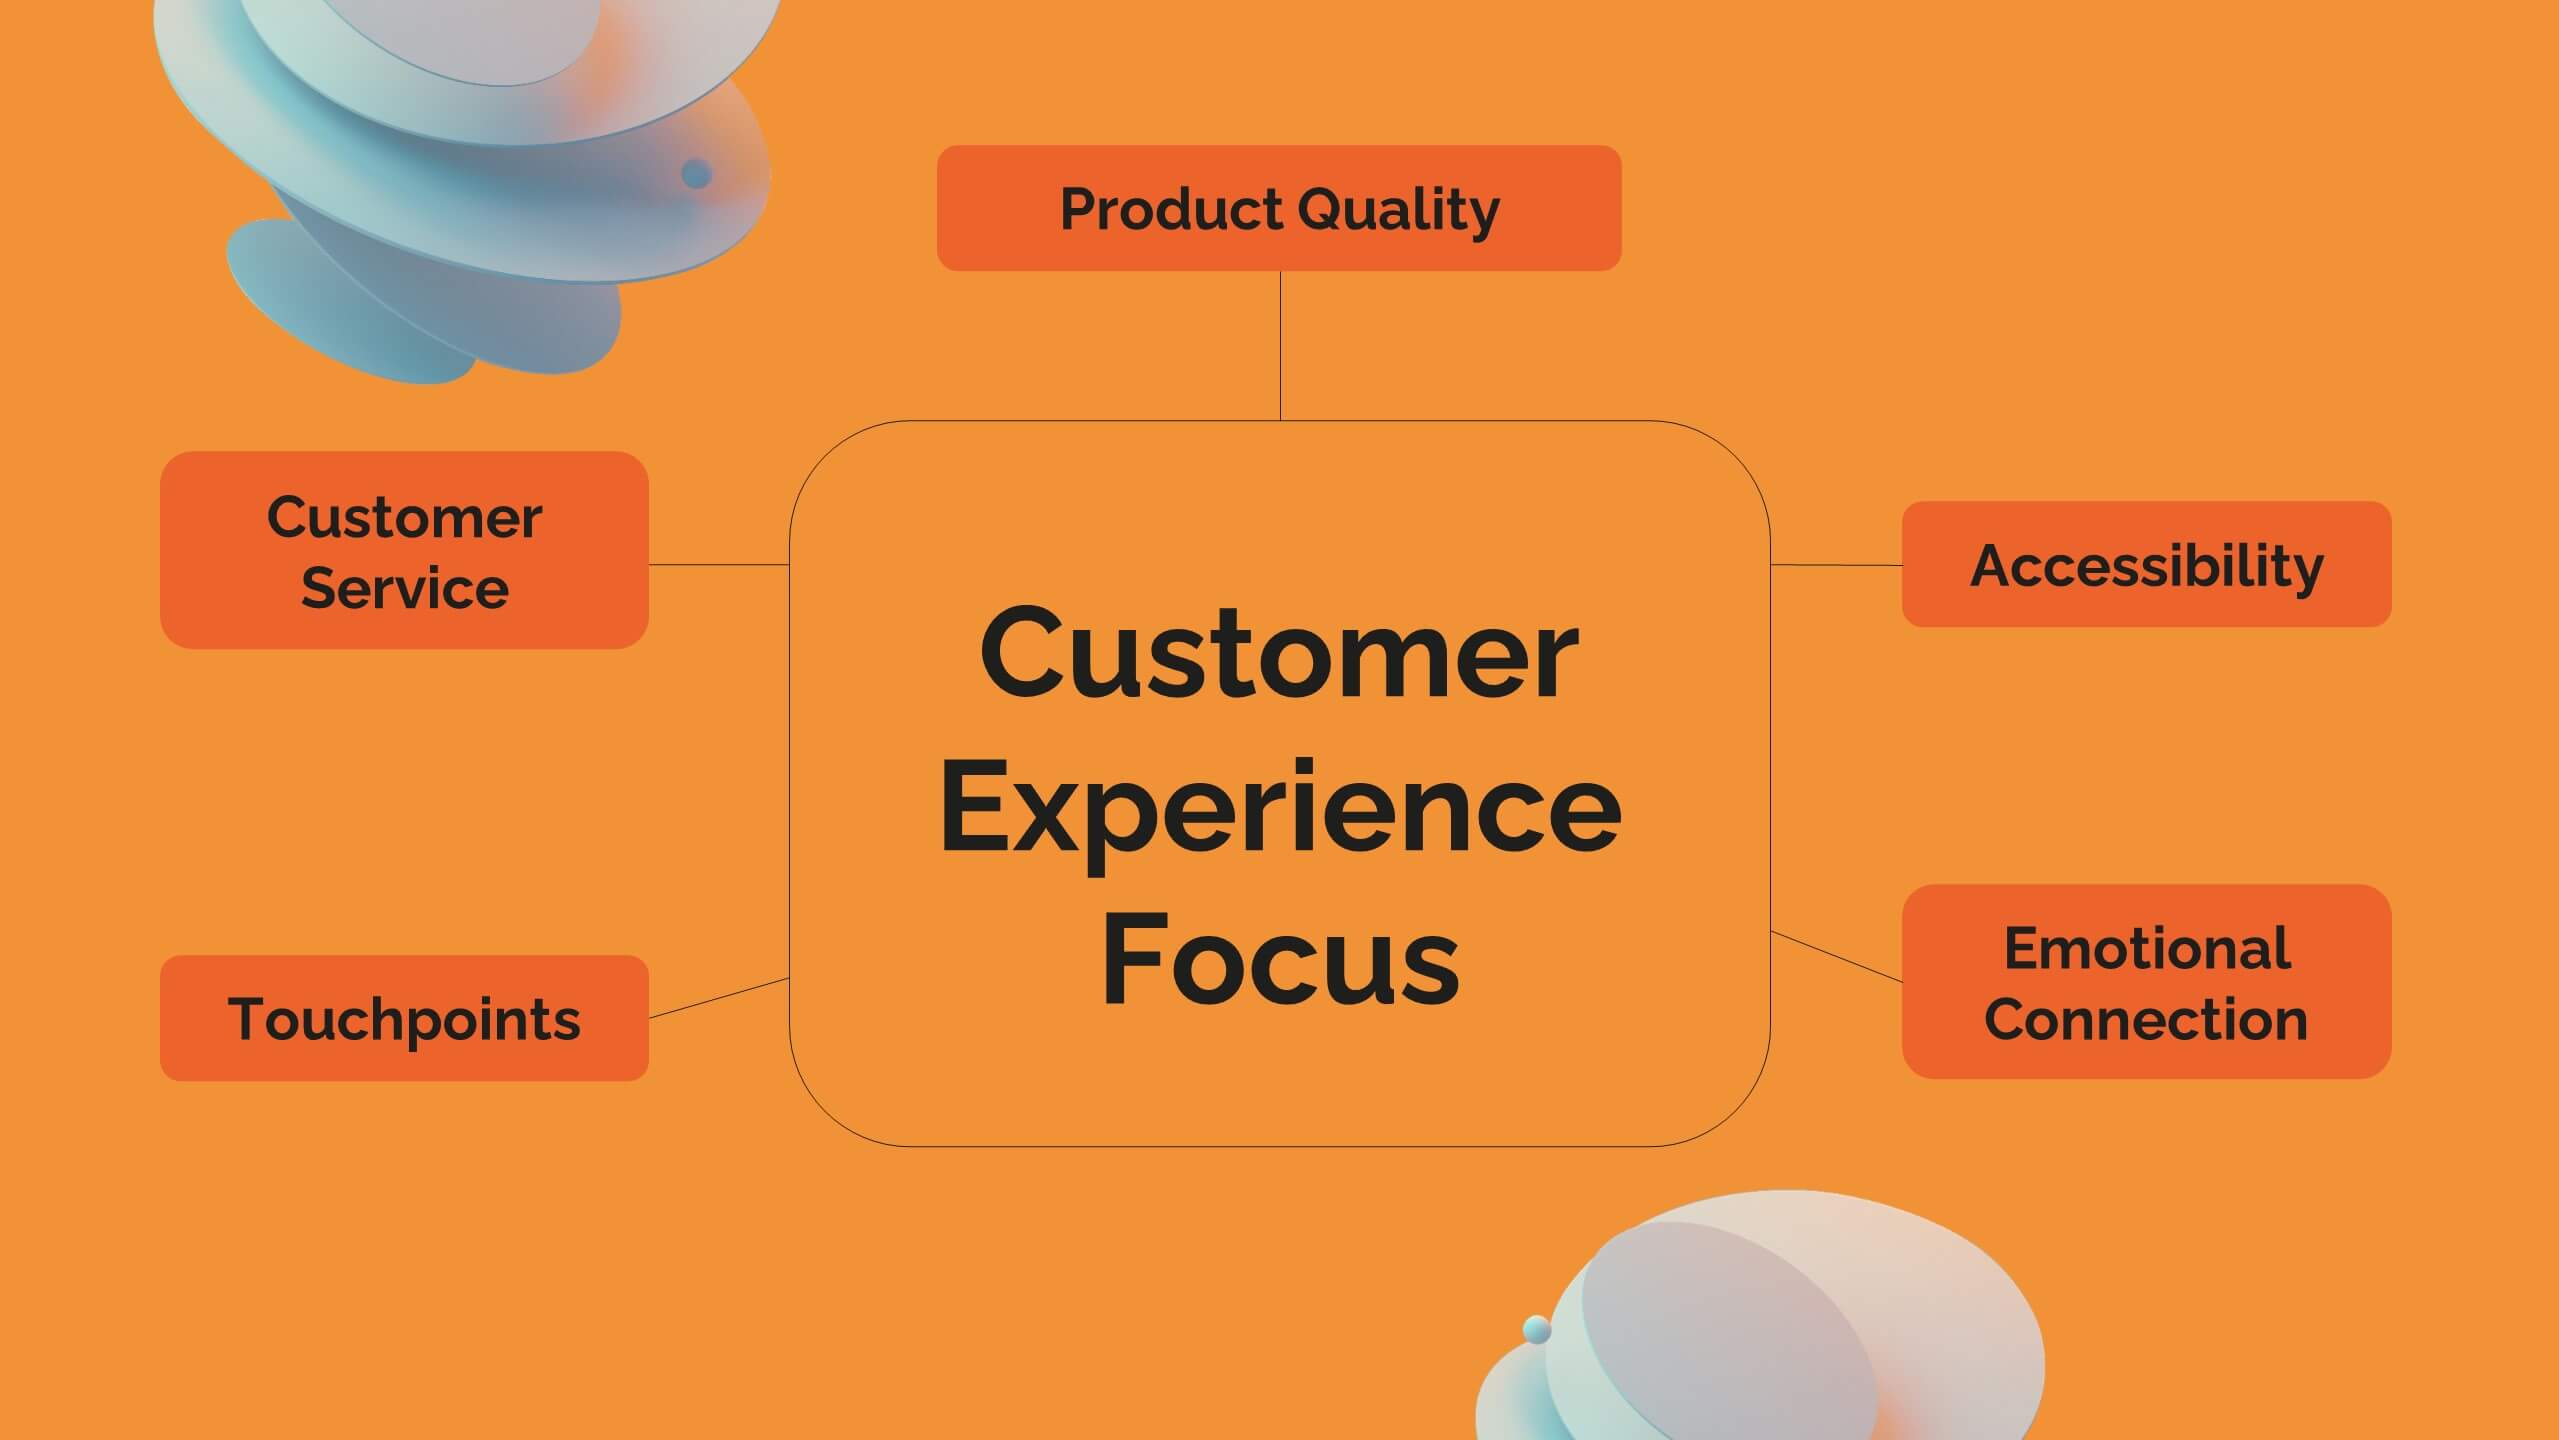
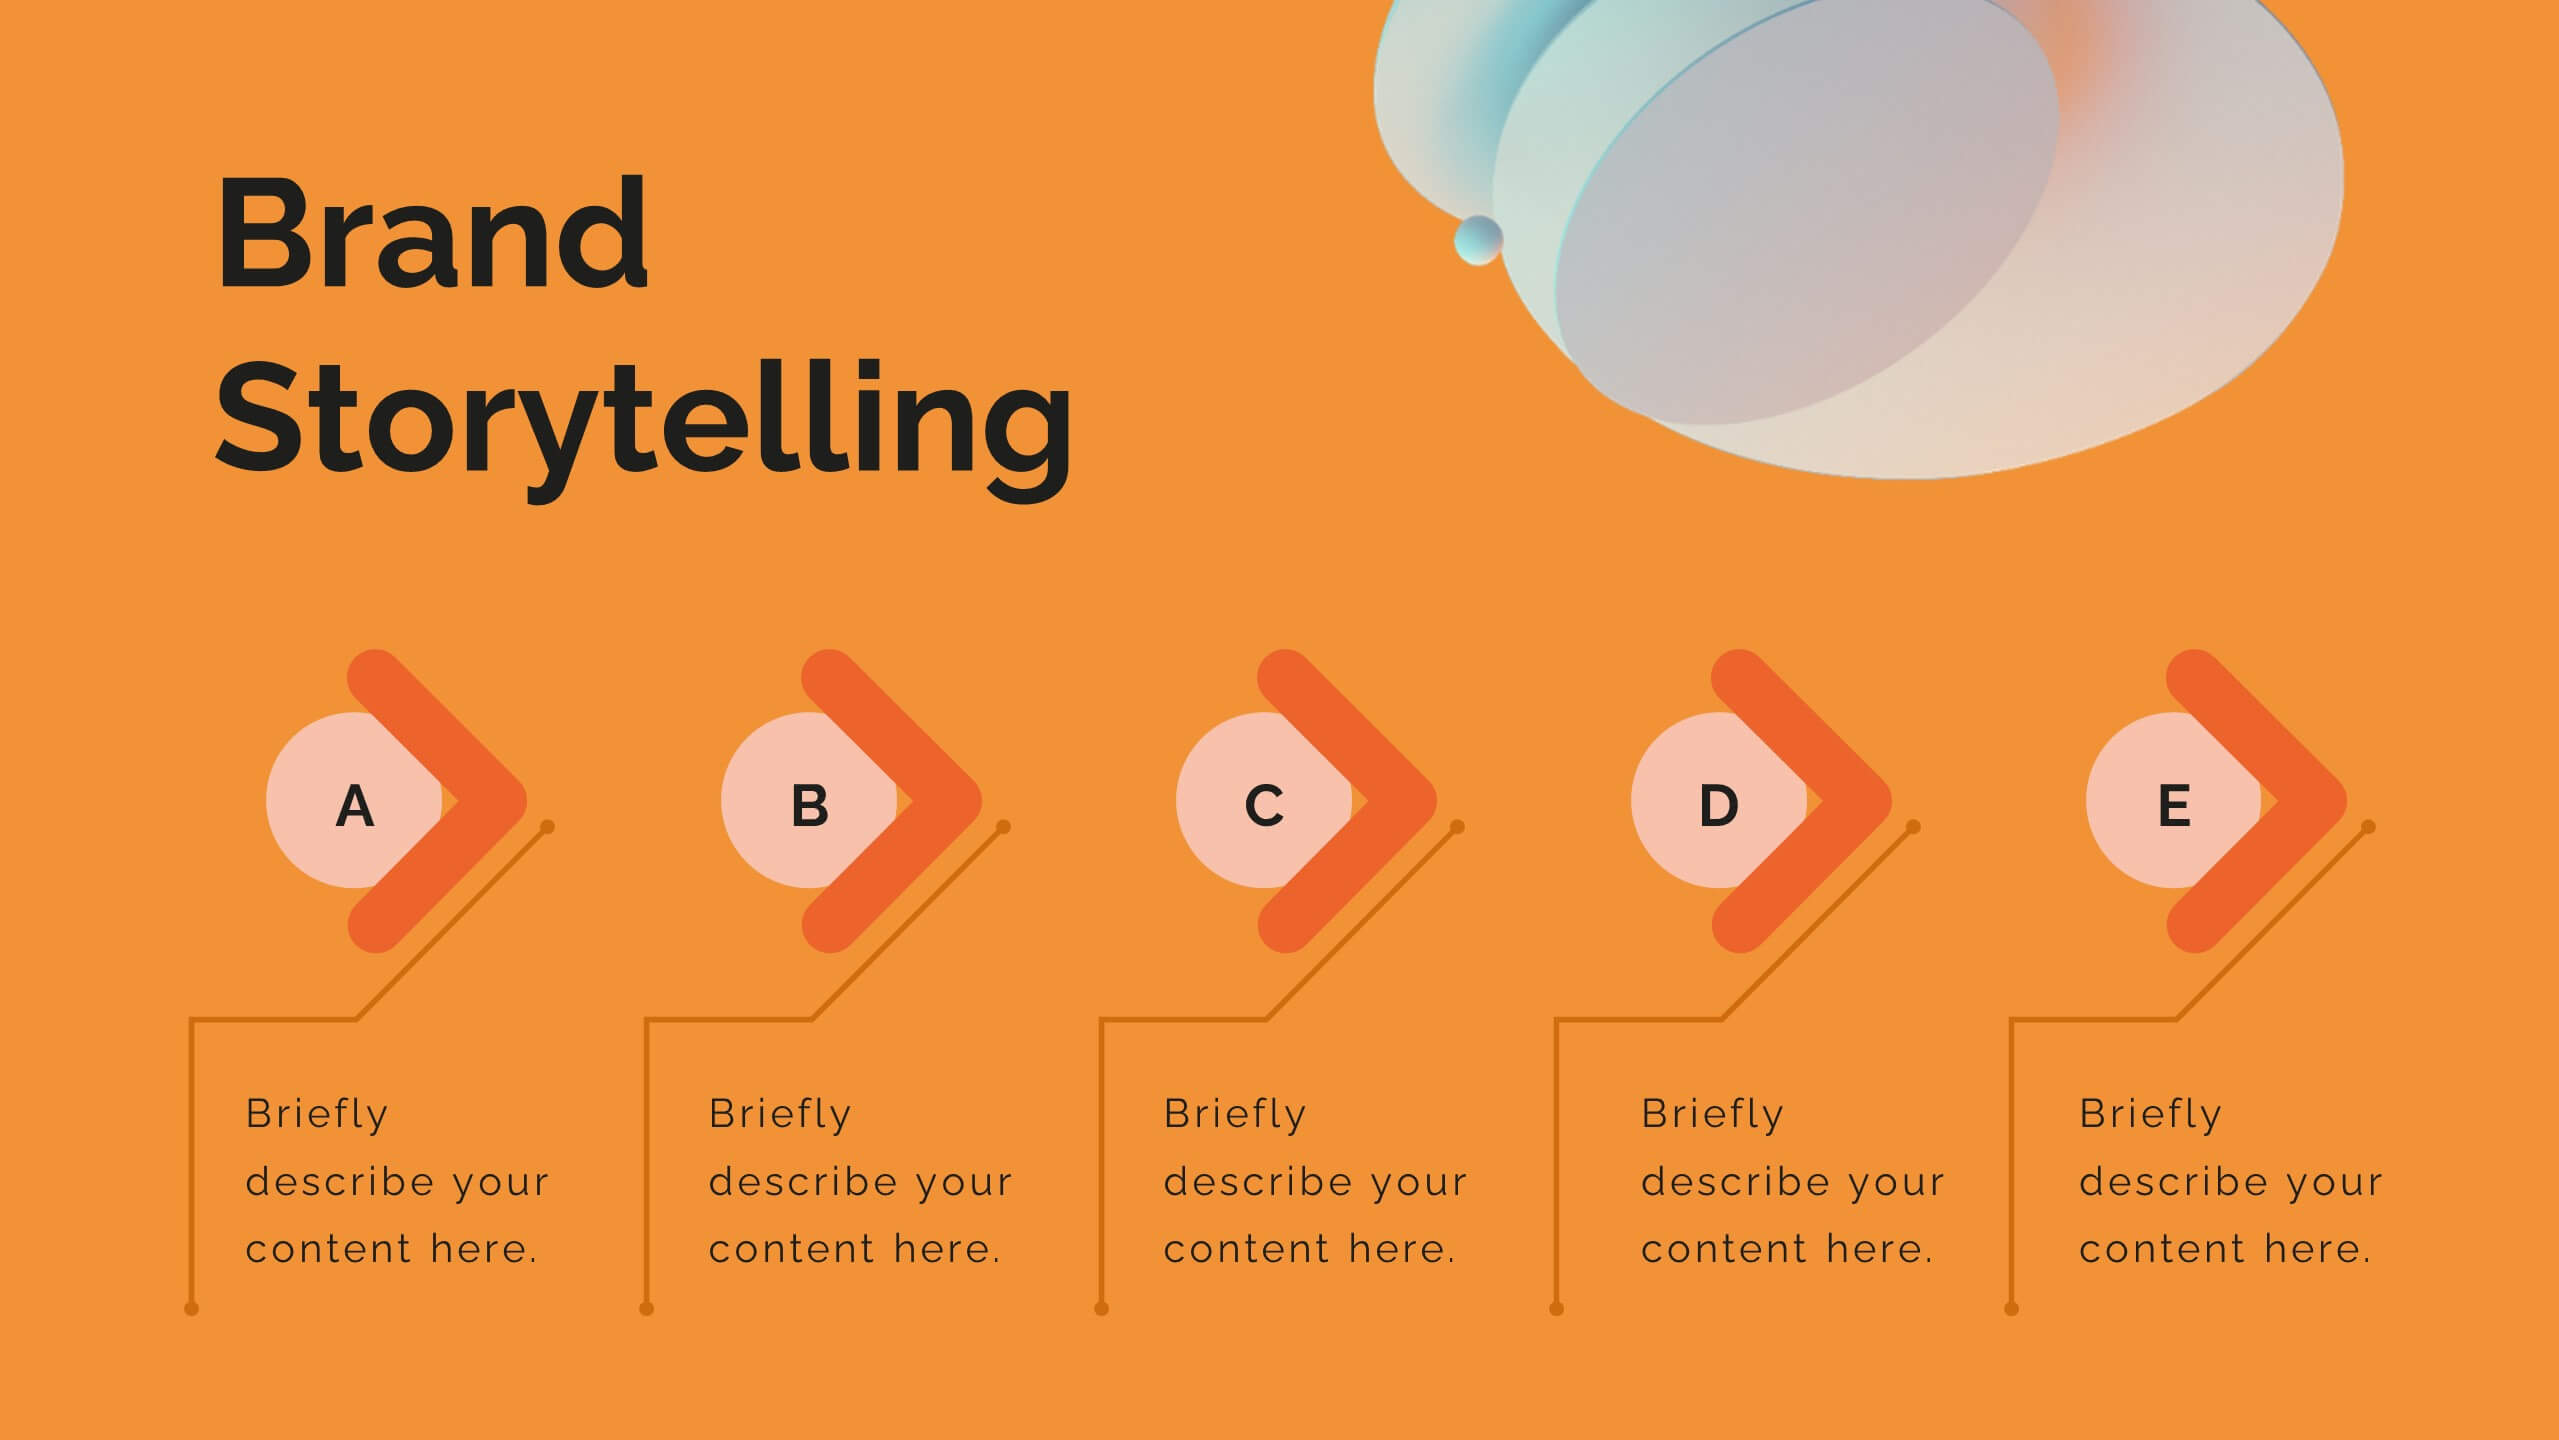
Elevate your content marketing strategy with this vibrant pitch deck! Perfect for outlining industry trends, consumer behavior, and innovative techniques. Ideal for marketers aiming to impress clients and stakeholders. Compatible with PowerPoint, Keynote, and Google Slides, this template ensures your pitch is engaging, persuasive, and professional. Achieve marketing success today!


6 slides
Human Anatomy Structure Diagram Presentation
Explore human body systems visually with this anatomy diagram slide. Highlight up to five organs or regions using numbered callouts connected to a central graphic. Ideal for healthcare, education, or medical presentations. Easily customizable in PowerPoint, Keynote, or Google Slides for labeling body parts, explaining functions, or guiding patient education.


5 slides
Business Development Five-Step Plan Presentation
Accelerate your growth with the Business Development Five-Step Plan presentation. This structured template guides you through key stages of business expansion, from strategy to execution. Designed for entrepreneurs, startups, and corporate teams, this clear and engaging format ensures effective planning and communication. Fully customizable for PowerPoint, Keynote, and Google Slides to fit your specific needs.


4 slides
Aviation Industry Overview Presentation
Bring your data in for a smooth takeoff with this clean and modern visual layout. Perfect for presenting industry insights, market trends, or operational performance, this design helps convey complex information with clarity and flow. Fully editable and compatible with PowerPoint, Keynote, and Google Slides for seamless customization.


5 slides
Medical Services Infographics
Navigate the complexities of healthcare information with our medical services infographics. Rendered in a life-affirming palette of blue and red, these infographics elucidate various facets of medical services. The template serves as a lifeline for healthcare professionals, and public health advocates by providing a clear, visual narrative of services, processes, and advancements in the medical field. Compatible with Powerpoint, Keynote, and Google Slides. Its creative yet informative style, enhanced with relevant graphics and icons, ensure that critical information catches the eye, improves understanding, and encourages engagement.


4 slides
Market Research Survey Insights Presentation
Showcase key data from your latest research with this bold, megaphone-themed survey slide. Ideal for presenting percentages and key findings side-by-side, this layout draws attention to market trends, consumer feedback, or audience segmentation. Fully editable in PowerPoint, Keynote, and Google Slides.


8 slides
Survey Poll Results Visualization Presentation
Easily showcase your survey or poll data with this bold and modern results visualization slide. Designed with eye-catching circular charts, it helps your audience quickly grasp key insights at a glance. Perfect for business reviews, feedback summaries, or internal reports. Compatible with PowerPoint, Keynote, and Google Slides.


5 slides
Business Model Canvas and Strategy Presentation
Visualize your entire business model in one clean, structured slide. This presentation template breaks down key areas—Partners, Activities, Value Propositions, Customers, Channels, Costs, and Revenue—into a color-coded layout for strategic clarity. Perfect for startups, consultants, or internal strategy teams. Fully editable in PowerPoint, Keynote, and Google Slides.


7 slides
Buyer Infographic
Discover the power of visual storytelling with our dynamic Infographic Template, designed to bring the buyer's journey to life in full color and engaging detail! Each slide is a palette of opportunity, with bold hues and intuitive layouts that transform standard data into a compelling narrative. This template is a marketer’s dream, perfect for delineating complex buyer behaviors, demographics, and decision processes in an easily digestible format. It leverages striking graphics and concise text to illuminate key insights that drive consumer actions, making it indispensable for presentations, reports, or online content. Customize to your heart’s content, adjusting colors, fonts, and layouts to align perfectly with your branding. Whether you're detailing market trends, consumer feedback, or purchase patterns, this template ensures your data not only informs but also inspires. Ideal for strategists, sales teams, and marketers, it's your secret weapon in crafting stories that not only tell but also sell.


6 slides
Business People Partner Infographics
Our "Business People Partner" infographic template is a modern and dynamic tool designed for PowerPoint, Keynote, and Google Slides. This template is particularly useful for HR professionals, business consultants, and team leaders who are involved in fostering effective business partnerships. The template highlights essential elements such as organizational roles, partnership strategies, and communication channels. Its layout is thoughtfully designed to help users articulate the intricacies of business partnerships and the roles of various stakeholders in a clear and concise manner. This makes it an invaluable resource for presentations focusing on collaborative efforts and strategic alliances in the business world. Featuring a bright and inviting color scheme, the design of this template is both contemporary and engaging. It reflects the dynamic and collaborative nature of business partnerships, making your presentation not just informative but also visually appealing. Whether you're presenting to executives, partners, or team members, this template ensures your message is delivered with clarity and impact.


4 slides
Preventative Healthcare Strategies Presentation
Present medical insights with clarity using this syringe-themed slide layout designed for preventative healthcare strategies. Ideal for showcasing public health plans, vaccination drives, or early intervention tactics. Fully editable in PowerPoint, Keynote, and Google Slides, this modern visual aids healthcare professionals in delivering data-driven, concise messages with professional impact.


7 slides
Matrix Diagram Infographic Presentation Template
A matrix diagram, also known as a matrix chart or matrix plot, is a type of chart that is used to compare and contrast different elements or variables. It is typically represented as a grid or table with rows and columns. This template will help show you how different things are related to each other. Use this template to compare and contrast things like products or tasks. It includes grids and tables that you can fill in with your own information. Add your own pictures and colors to make it look more appealing. This template is perfect for your school projects or work presentations.


6 slides
Modern Travel Infographic
Explore your story like a globe waiting to be spun, using this clean visual layout to highlight key destinations, ideas, or data points in a modern, travel-inspired flow. It’s perfect for simplifying complex information with style. Fully customizable and compatible with PowerPoint, Keynote, and Google Slides.


6 slides
Pathway and Options Framework Analysis Presentation
Navigate your business strategy with clarity using the Pathway and Options Framework Analysis Presentation. This slide features a horizontal hexagon progression that visually maps out five distinct stages or decision points. Ideal for illustrating phased development, strategic alternatives, or milestone-based planning. Each segment includes an icon and customizable title area for key data points. Use this clean, modern layout to engage stakeholders or clarify complex processes. Fully editable in PowerPoint, Keynote, and Google Slides.