


Features
- 5 Unique slides
- Fully editable and easy to edit in Microsoft Powerpoint, Keynote and Google Slides
- 16:9 widescreen layout
- Clean and professional designs
- Export to JPG, PDF or send by email


Do you have any questions?
Recommend


21 slides
Luminary Annual Report Presentation
Create stunning annual reports with this sleek template! Highlight key achievements, financial summaries, and performance metrics. Perfect for showcasing operational updates, strategic initiatives, and market trends. Designed for business professionals and analysts. Compatible with PowerPoint, Keynote, and Google Slides.


4 slides
Interlocking Puzzle Chart Design Presentation
Unlock big ideas with a visual design that clicks your concepts together like a seamless 3D puzzle. This presentation makes it easy to explain connected processes, relationships, or strategic components in a clean, engaging way. Perfect for business, planning, and team alignment. Fully compatible with PowerPoint, Keynote, and Google Slides.


7 slides
Brain Structure Infographic
Unlock the marvels of the human mind with our brain structure infographic. Resting on a pristine white canvas and enriched by the calming green, profound blue, and enlightening yellow, this template meticulously dissects the intricacies of brain anatomy. Adorned with detailed infographics, illustrative icons, and specific image placeholders, it dives deep into the regions and functions of the brain. Impeccably tailored for Powerpoint, Keynote, or Google Slides. An indispensable resource for neuroscientists, educators, medical students, or anyone with an intrigue for cerebral wonders. Venture with insight; let each slide be your guide through the labyrinth of the human brain.


22 slides
Event Agenda Presentation
Organize your event with precision using this Event Agenda presentation template. Designed for clarity and impact, it includes slides for conference overviews, speaker introductions, session descriptions, and networking opportunities. Perfect for business conferences or workshops, this template is compatible with PowerPoint, Keynote, and Google Slides, ensuring your event runs smoothly and professionally.


5 slides
Myths & Facts About Cases Of Mass Hysteria Infographics
Delve into the intriguing world of collective human psychology with myths & facts about cases of mass hysteria infographics. Set against an engaging purple backdrop, these infographics are designed to captivate, educate, and debunk misconceptions surrounding mass hysteria events. Ideal for historians, educators, psychologists, and students. The creative use of vibrant colors and compelling icons help in breaking down complex psychological phenomena into understandable content, making it easier to spark discussion on this fascinating subject. Whether it's for academic purposes, or informational content, this template stands out by blending education with intriguing storytelling.


3 slides
Linear Business Process Flow Presentation
Give your workflow a smooth, streamlined story with a layout that makes every step feel clear and intentional. This presentation outlines processes in a clean, linear format ideal for planning, operations, or strategy mapping. Fully compatible with PowerPoint, Keynote, and Google Slides.


19 slides
Sales Proposal Presentation
Secure your next big deal with our Sales Proposal presentation template, tailored to make your pitch unforgettable. It's a comprehensive toolkit for sales professionals designed to address every aspect of your offering. The slides smoothly guide your audience through your company overview, mission, product or service features, and the solutions you provide to the client's problems. They are meticulously structured to help you outline your value proposition, address customer pain points, and present a convincing case with customer testimonials. The design is not just visually appealing but also conducive to narrative flow, presenting cost and pricing details with clarity, and allowing room for engaging Q&A sessions. This template is ideal for sales pitches, adaptable across PowerPoint, Keynote, and Google Slides. It helps you build a persuasive argument for why your solution is the best fit for the client, providing a professional edge in a competitive marketplace.


6 slides
Financial Report Summary Presentation
Showcase key financial highlights with the Financial Report Summary slide. Featuring a central moneybag icon surrounded by currency symbols, this layout is ideal for presenting up to five critical financial insights or revenue sources. Each label is paired with editable titles and descriptions to keep your content clear and relevant. Fully compatible with PowerPoint, Keynote, and Google Slides for effortless customization.


5 slides
Hierarchical Structure in Triangle Format Presentation
Clearly illustrate levels of authority or stages of growth with the Hierarchical Structure in Triangle Format Presentation. This layout features a visually stacked triangle with color-coded segments, each layer representing a tier or level of information. Ideal for organizational charts, value pyramids, or priority structures. Each section includes a title, icon, and description area to keep your message clear and impactful. Fully editable in PowerPoint, Keynote, and Google Slides.


7 slides
Business People Networking Infographic
Networking is the lifeblood of any thriving business. Our business people networking infographic, designed in a pristine white backdrop with striking orange highlights and sophisticated black nuances, encapsulates the essence of professional connections and collaborations. It provides a visual representation of how relationships can foster growth, open opportunities, and catalyze success. Tailored for business leaders, conference organizers, and networking event planners, this template offers a compelling narrative of networking's power. Fully optimized, it's compatible with leading presentation platforms: PowerPoint, Keynote, and Google Slides.


26 slides
Leyna Presentation Template
Leyna is an elegant and minimalist wedding planner presentation template. This wonderful presentation template will help couples know what all you’ll offer as a wedding planner. We have made it easy for you this this multipurpose template because you will be able to edit easily to make sure it fits what you need. We have built a clean, responsive and modern design for them to have a great experience on what they are looking for in the best way possible. This template provides a professional and clean design for your business or personal use. It's time to impress the potential clients!


6 slides
Market Sizing with TAM SAM SOM Strategy Presentation
Clearly define your market opportunity using the Market Sizing with TAM SAM SOM Strategy Presentation. This template breaks down Total Addressable Market, Serviceable Available Market, and Serviceable Obtainable Market with a visual bullseye format that’s intuitive and persuasive. Easily editable in PowerPoint, Keynote, and Google Slides.
20 slides
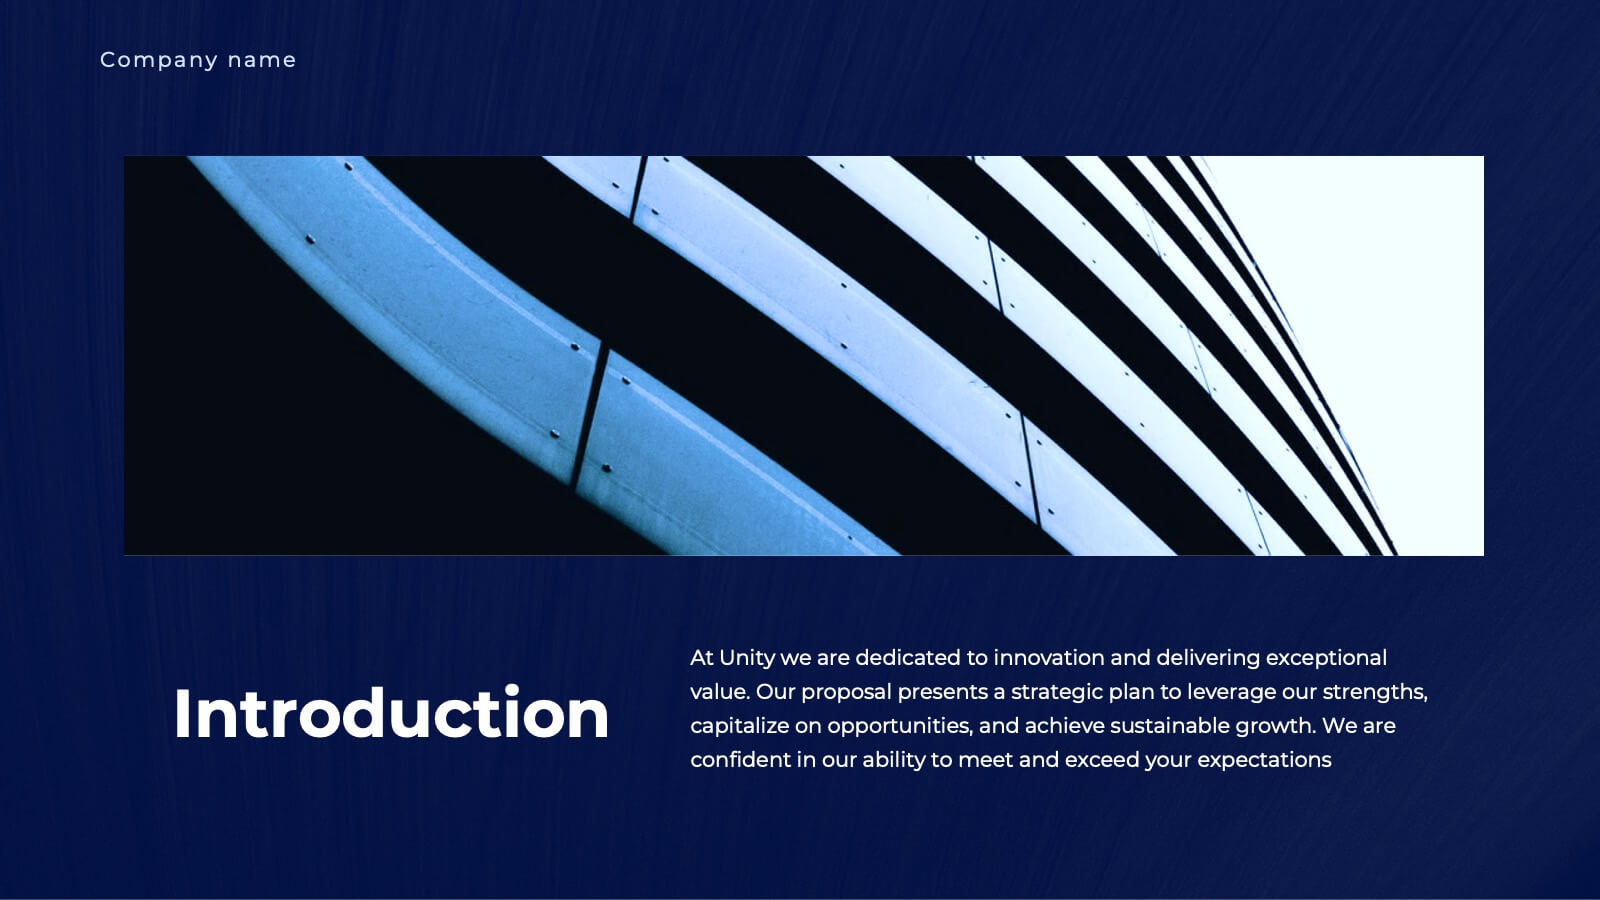
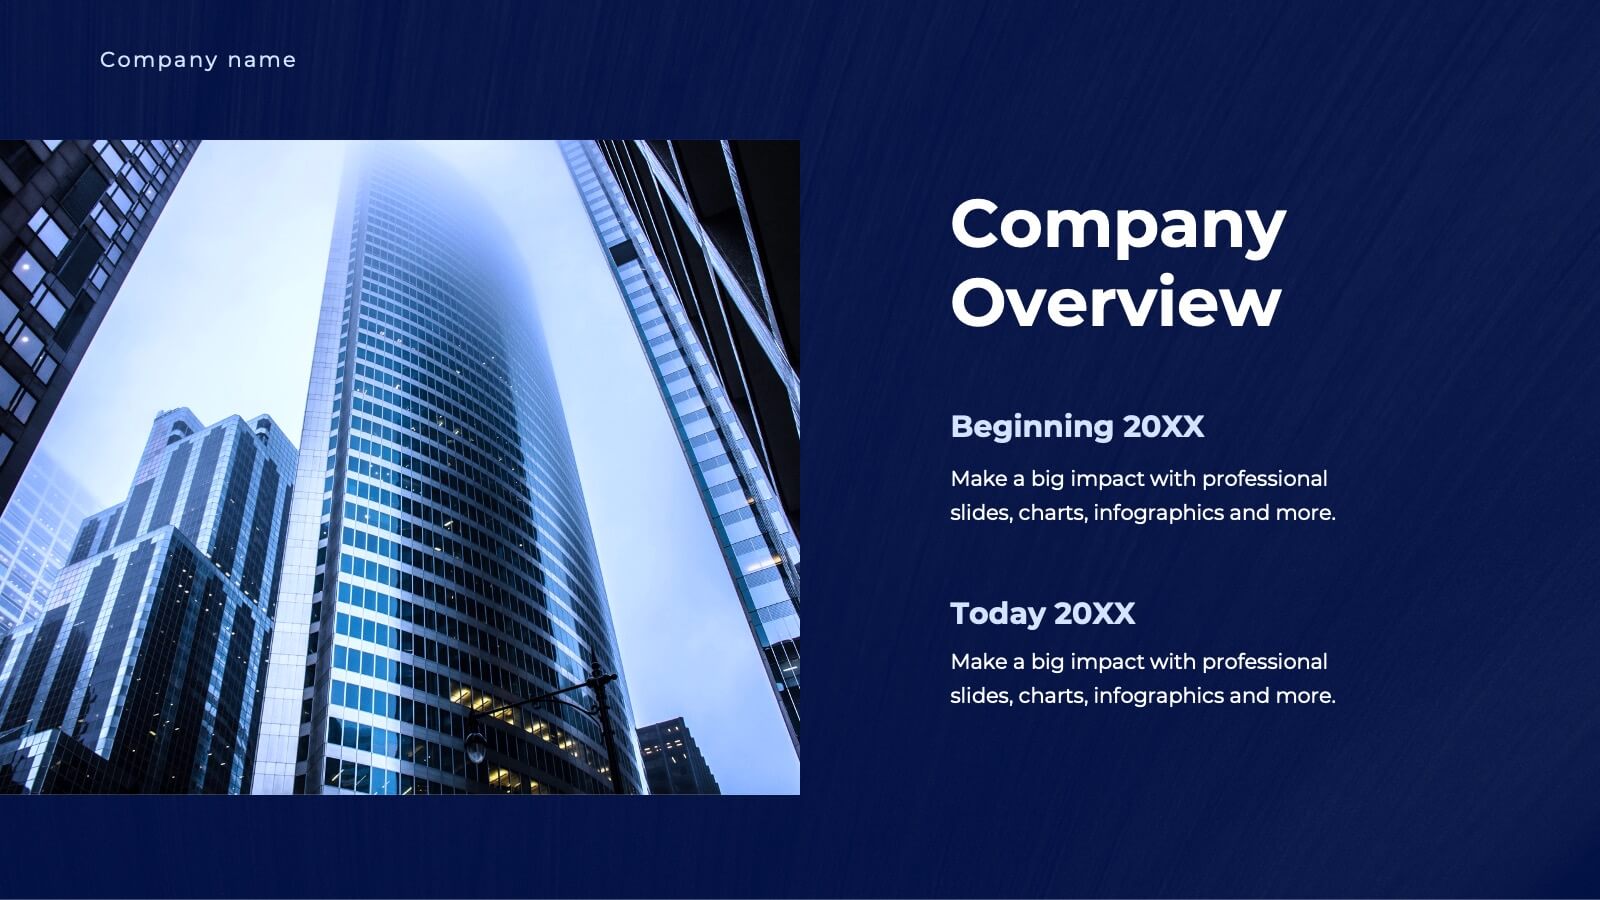
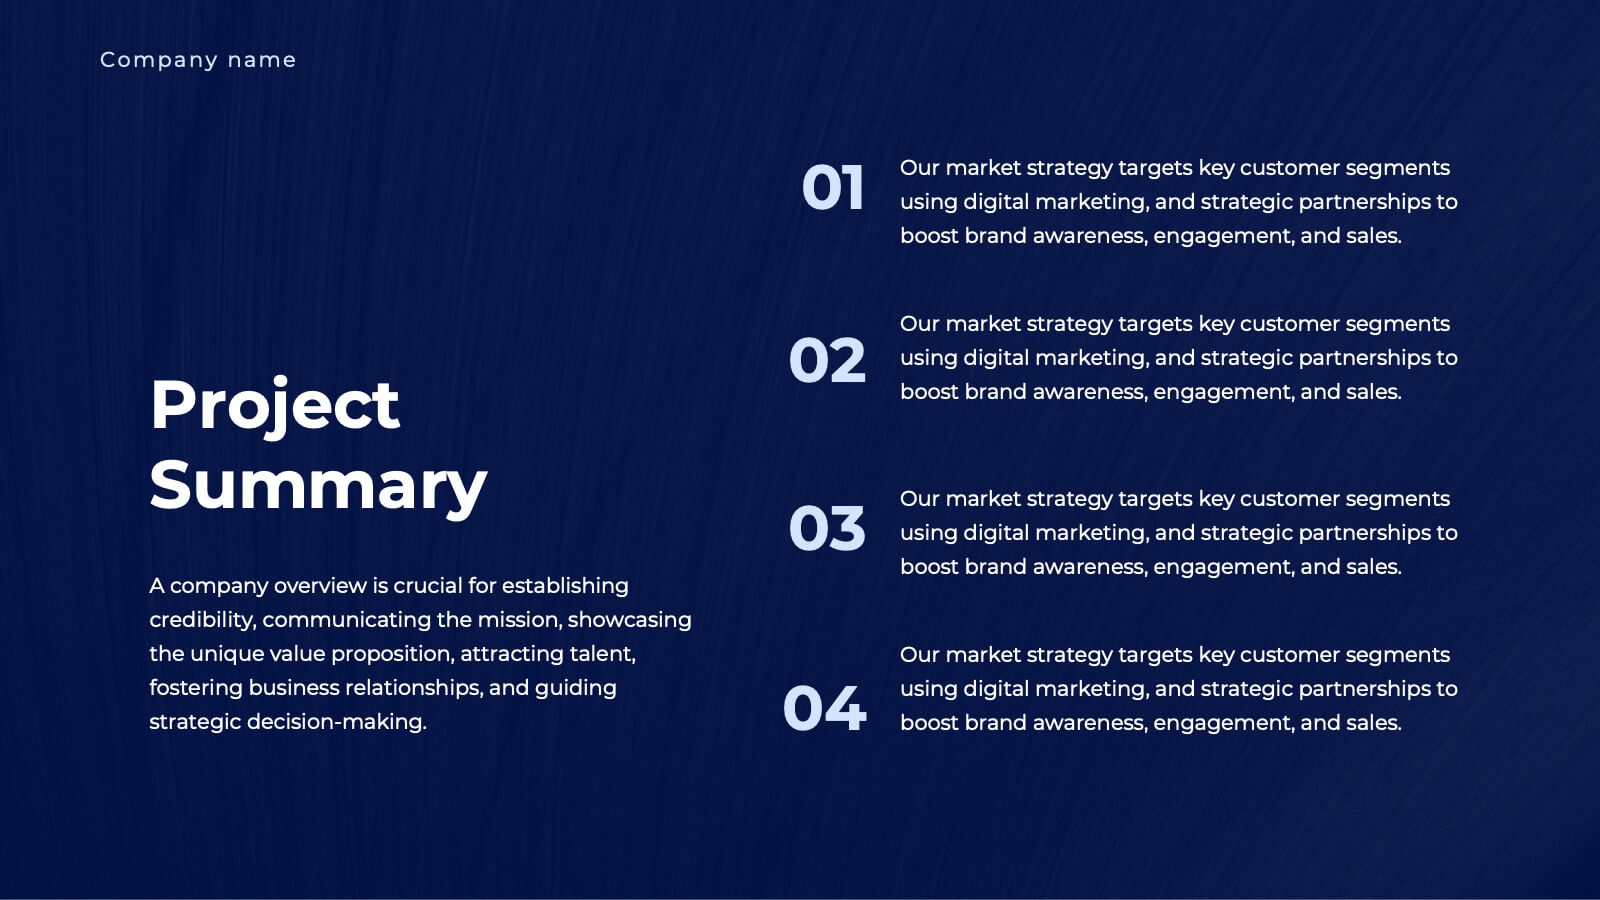
Unity Business Proposal Presentation
Take your business proposals to the next level with this elegant and comprehensive template! Perfect for presenting company overviews, project summaries, and detailed solutions. Ideal for business professionals looking to impress clients and stakeholders. Compatible with PowerPoint, Keynote, and Google Slides, this template ensures your proposals are impactful and professional.


5 slides
Human Resource Functions Infographics
Illuminate the complexities of people management with our human resource functions infographics template. Cast in the professional yet warm palette of black, orange, pink, and red, this template is an essential tool for HR professionals, corporate trainers, and business leaders. It elegantly dissects various HR realms with its sleek graphics, intuitive icons, and dedicated image placeholders, making it perfect for showcasing recruitment processes, employee engagement strategies, or organizational culture principles. Its creative, vertical style is designed to hold the attention and fuel the imagination, turning any HR presentation into a compelling narrative.


20 slides
Nexisphere Marketing Proposal Presentation
Showcase your marketing plan with this proposal deck, featuring sections on consumer analysis, digital trends, influencer strategies, and SEO insights. Ideal for presenting a comprehensive marketing approach, it’s compatible with PowerPoint, Keynote, and Google Slides, offering flexibility for engaging presentations tailored to any audience.


5 slides
Cryptocurrency Investment Infographics
Cryptocurrency Investment refers to the practice of buying, holding, or trading digital currencies as a form of investment. These infographic templates allow you to effectively present information about cryptocurrency investment, demystify the subject, and empower individuals to explore and navigate the world of digital currencies with confidence. Use these infographics to educate and inform individuals about the world of cryptocurrency investment. These aim to provide key information and insights to help people make informed decisions when it comes to investing in cryptocurrencies. Compatible with Powerpoint, Keynote, and Google Slides.


3 slides
Business Self-Introduction
Make a memorable first impression with this clean, skill-focused introduction slide. Ideal for presenting professional backgrounds, role highlights, and expertise levels. Great for resumes, team intros, or portfolio decks. Fully editable in PowerPoint, Keynote, and Google Slides.