


Features
- 5 Unique slides
- Fully editable and easy to edit in Microsoft Powerpoint, Keynote and Google Slides
- 16:9 widescreen layout
- Clean and professional designs
- Export to JPG, PDF or send by email


Do you have any questions?
Recommend


6 slides
Key Conclusion Summary in Presentation
Conclude your presentation with clarity using this visually structured summary slide. Highlight five key takeaways through a linear roadmap with numbered sections and icons for quick reference. Perfect for final thoughts, progress recaps, or strategic conclusions. Fully editable in PowerPoint, Keynote, and Google Slides to suit your presentation needs.


6 slides
Central Idea Spider Layout Presentation
Bring your big idea to life with a sleek, organized layout that keeps every supporting point perfectly connected. This presentation is ideal for mapping strategies, goals, or project concepts in a clear, visual way. Fully customizable and compatible with PowerPoint, Keynote, and Google Slides for effortless editing.


5 slides
Types of Restaurants Infographics
Restaurants are establishments that prepare and serve food and beverages to customers. These infographic templates are perfect for anyone looking to explore the diverse world of dining establishments and understand the unique features and offerings of each type. These provide an engaging and comprehensive overview of the diverse culinary world. With its visually appealing design and well-organized information, this is ideal for anyone looking to learn about different restaurant types, plan dining experiences, or educate others about the wide range of dining options available.


4 slides
Veterinary Care and Health Tips Presentation
Keep your audience engaged with this clean, friendly infographic layout perfect for sharing animal care advice and clinic insights. Ideal for veterinarians or pet health professionals, it helps communicate tips, services, and best practices clearly. Fully editable and compatible with PowerPoint, Keynote, and Google Slides for easy customization.


5 slides
5-Step Business Optimization Plan Presentation
Showcase your improvement roadmap using this 5-step building block diagram. Perfect for illustrating sequential development, each step is styled like interlocking bricks to convey progress and structure. Fully editable in PowerPoint, Keynote, and Google Slides—ideal for strategic planning, process optimization, and business growth presentations needing a clear step-by-step layout.


7 slides
Food Infographic Presentation Template
A Food Infographic is a visual representation of information and data related to food. It can be used to educate people on various aspects of food such as its nutritional value, cooking methods, and recipes. This template can be presented in a variety of ways, including charts, graphs, illustrations, and images you can customize with your information. The goal of this Food Infographic is to make complex information about food more accessible and easy to understand for the general public. This template works with Powerpoint, Keynote, and Google Slides, so you can use it on any device.


23 slides
Clarity Business Operations Plan Presentation
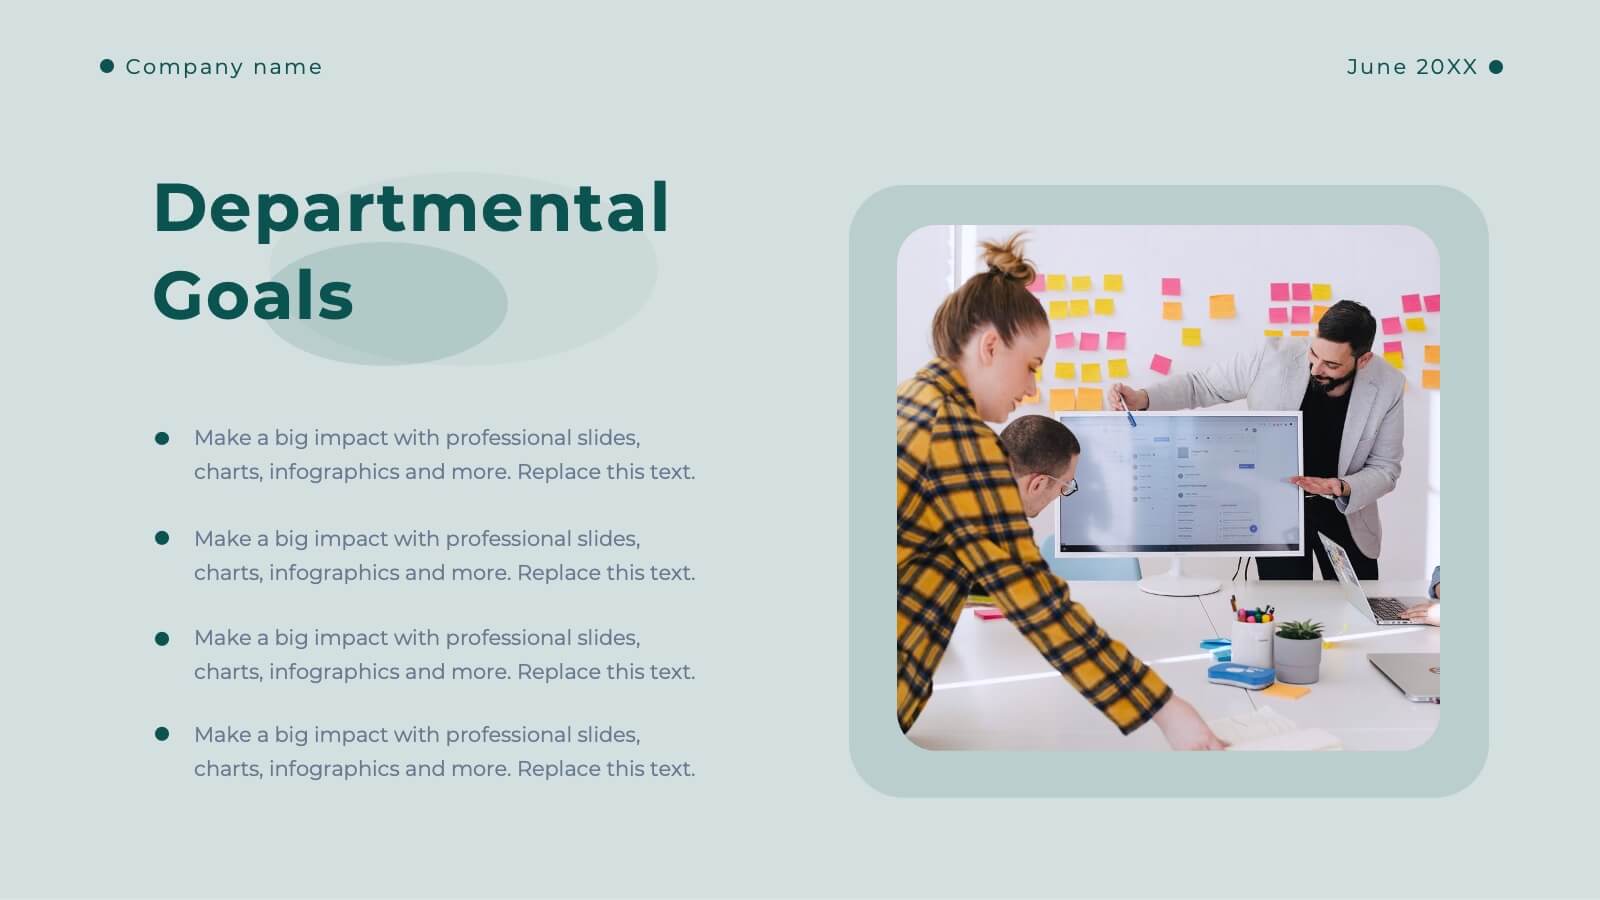
Optimize your business operations with this sleek presentation template! Perfect for outlining team updates, key achievements, and performance metrics, it includes slides for departmental goals, process improvements, and upcoming events. Engage your team with clear visuals and detailed content. Compatible with PowerPoint, Keynote, and Google Slides for seamless presentations on any platform.


3 slides
Agricultural Business Plan Presentation
Showcase your farming strategies with this agricultural business plan template, featuring plant growth visuals and clean, modern layouts. Ideal for agribusiness proposals, sustainability reports, and agricultural project planning. Fully editable in Canva, PowerPoint, and Google Slides, allowing you to customize text, icons, and colors to match your brand identity.


4 slides
Efficient Workflow Management Presentation
Optimize productivity with the Efficient Workflow Management template, designed to streamline processes and improve task coordination. Ideal for project managers, teams, and businesses, this template visually maps workflows, helping to identify bottlenecks and enhance efficiency. Fully customizable and compatible with PowerPoint, Keynote, and Google Slides for seamless presentations.


5 slides
Impacts of Information Technology Infographics
Information Technology has had a profound impact on various aspects of society, including business, communication, education, healthcare, and entertainment. These infographic templates are designed to help you communicate complex technological concepts in a visually compelling way, making it suitable for IT professionals, businesses, or anyone interested in understanding and highlighting the transformative power of information technology. The template features a sleek design with customizable layouts, icons, and color schemes that can be adjusted to match your branding. It is compatible with PowerPoint, Keynote, and Google Slides.


6 slides
Business Case Studies Analysis Presentation
Turn insights into impact with this clean and professional layout designed to showcase real-world business challenges and results. Perfect for summarizing objectives, methods, and key outcomes, it helps you tell a clear and compelling story. Fully compatible with PowerPoint, Keynote, and Google Slides for easy customization and presentation.


4 slides
Simple RACI Matrix Overview Presentation
Bring instant clarity to every role with a clean, puzzle-style layout designed to map responsibilities without confusion. This presentation helps teams outline who leads, supports, approves, and stays informed in any project, turning tasks into a simple visual grid. Fully editable and compatible with PowerPoint, Keynote, and Google Slides.


5 slides
Key Business Question Breakdown Presentation
Present critical insights with this keyhole-themed layout, perfect for outlining strategic business questions or core decision points. The six-segment format allows you to break down complex topics into clear, actionable areas. Fully customizable in Canva, PowerPoint, or Google Slides—ideal for planning, workshops, or stakeholder presentations.


6 slides
Company Hierarchy Infographics
Effectively illustrate your company's hierarchy with our Company Hierarchy infographic template. This template is fully compatible with popular presentation software like PowerPoint, Keynote, and Google Slides, allowing you to easily customize it to showcase your organization's structure and reporting relationships. The Company Hierarchy infographic template offers a visually engaging platform to depict the different levels of leadership, departments, and roles within your company. Whether you're an HR professional, manager, or business leader, this template provides a user-friendly canvas to create informative presentations and organizational charts. Optimize your communication of your company's hierarchy with this SEO-optimized Company Hierarchy infographic template, thoughtfully designed for clarity and ease of use. Customize it to showcase leadership teams, reporting lines, and the key responsibilities of each role, ensuring that your audience gains a comprehensive understanding of your organization's structure. Start crafting your personalized infographic today to effectively communicate your company's hierarchy.


6 slides
SEO Consulting Infographics
The "SEO Consulting" infographic template is designed for PowerPoint, Keynote, and Google Slides, making it a valuable resource for SEO consultants, digital marketing professionals, and business owners. This template is crafted to effectively communicate the essentials of SEO in a professional and engaging manner. Featuring key elements of SEO such as optimization strategies, keyword research, and website traffic analysis, the template is structured to simplify the complex aspects of SEO. This makes it an ideal tool for presentations aimed at educating clients or team members about the nuances of search engine optimization and its impact on digital marketing. The design of the template is modern and business-oriented, with a color scheme that includes shades of blue, green, and gray. This professional yet engaging aesthetic ensures that the presentation is not only informative but also visually appealing. Whether used in client meetings, training sessions, or marketing seminars, this template is sure to enhance the understanding and appeal of SEO consulting services.


10 slides
Decision Tree Diagram Presentation
Simplify Decision-Making! The Decision Tree Diagram Presentation helps visualize complex choices with structured branching paths. Perfect for business strategies, process flows, or risk analysis, this template ensures clarity with editable nodes and connectors. Fully customizable and available for PowerPoint, Keynote, and Google Slides to fit your unique needs effortlessly.


23 slides
Soundburst Business Idea Pitch Deck Presentation
The Pitch Deck Presentation Template delivers a professional, modern design with 23 slides tailored for startups and businesses. Covering company overview, solutions, market opportunities, and financials, it's fully customizable for your unique vision. Compatible with PowerPoint, Keynote, and Google Slides, this template ensures impactful, investor-ready presentations.