


Features
- 10 Unique slides
- Fully editable and easy to edit in Microsoft Powerpoint, Keynote and Google Slides
- 16:9 widescreen layout
- Clean and professional designs
- Export to JPG, PDF or send by email


Do you have any questions?
Recommend


4 slides
Airline Industry Analysis and Growth Presentation
Navigate the future of aviation with the Airline Industry Analysis and Growth presentation. This template uses a dynamic runway visual to highlight four key metrics, trends, or milestones—ideal for tracking airline performance, market share, or industry forecasts. Best for aviation analysts, transport consultants, and business development teams. Fully editable in PowerPoint, Keynote, and Google Slides.


22 slides
Wanderer Professional Portfolio Showcase Presentation
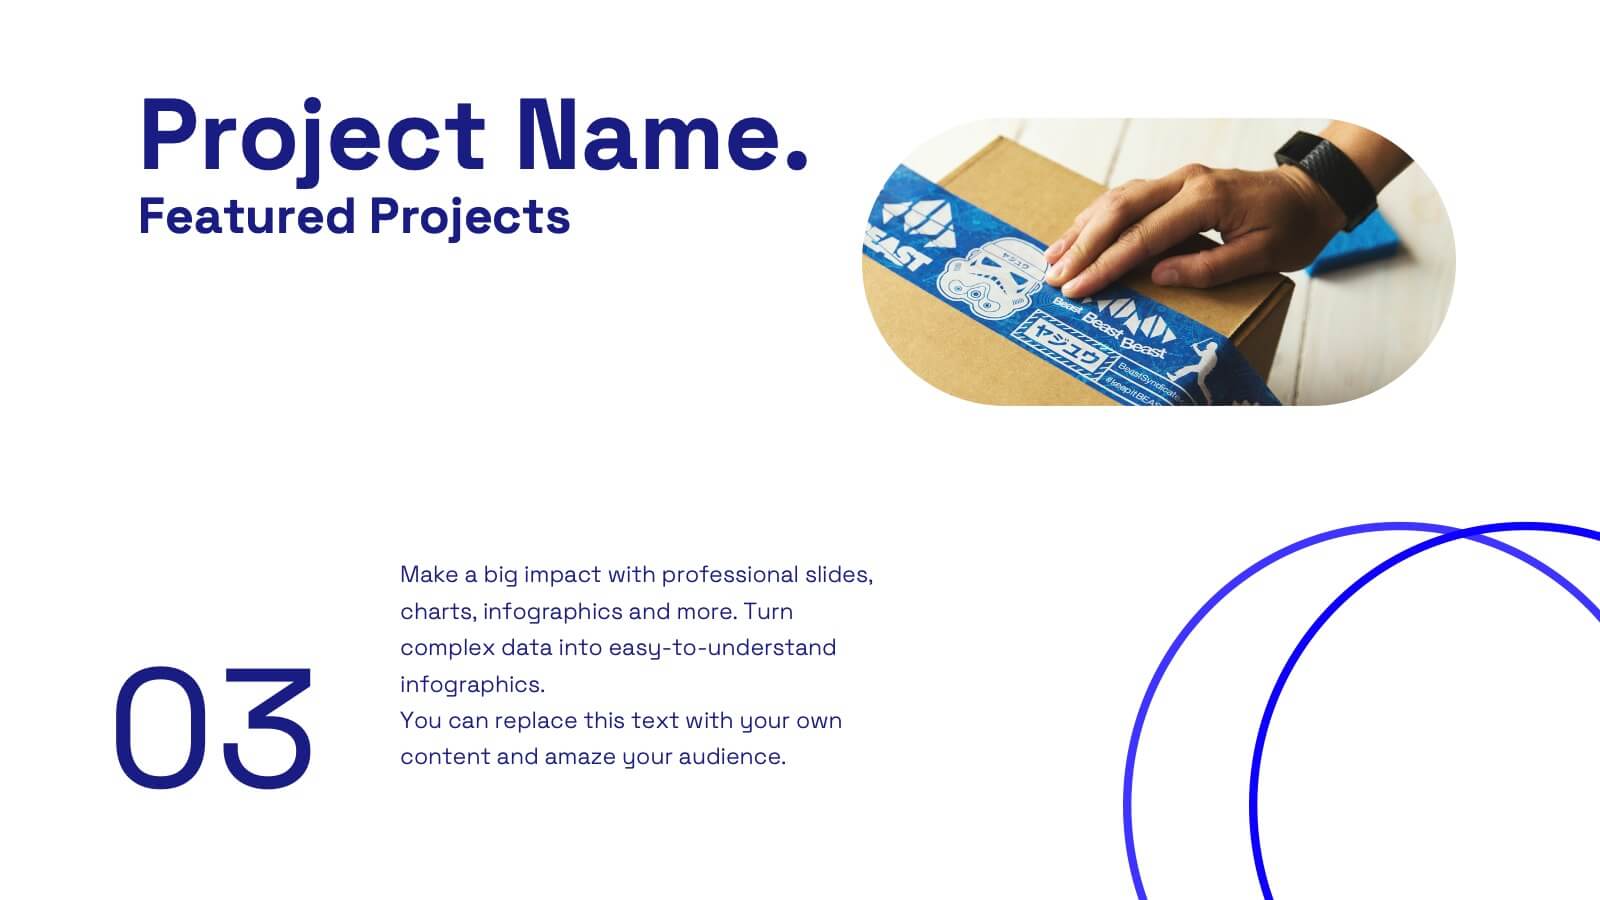
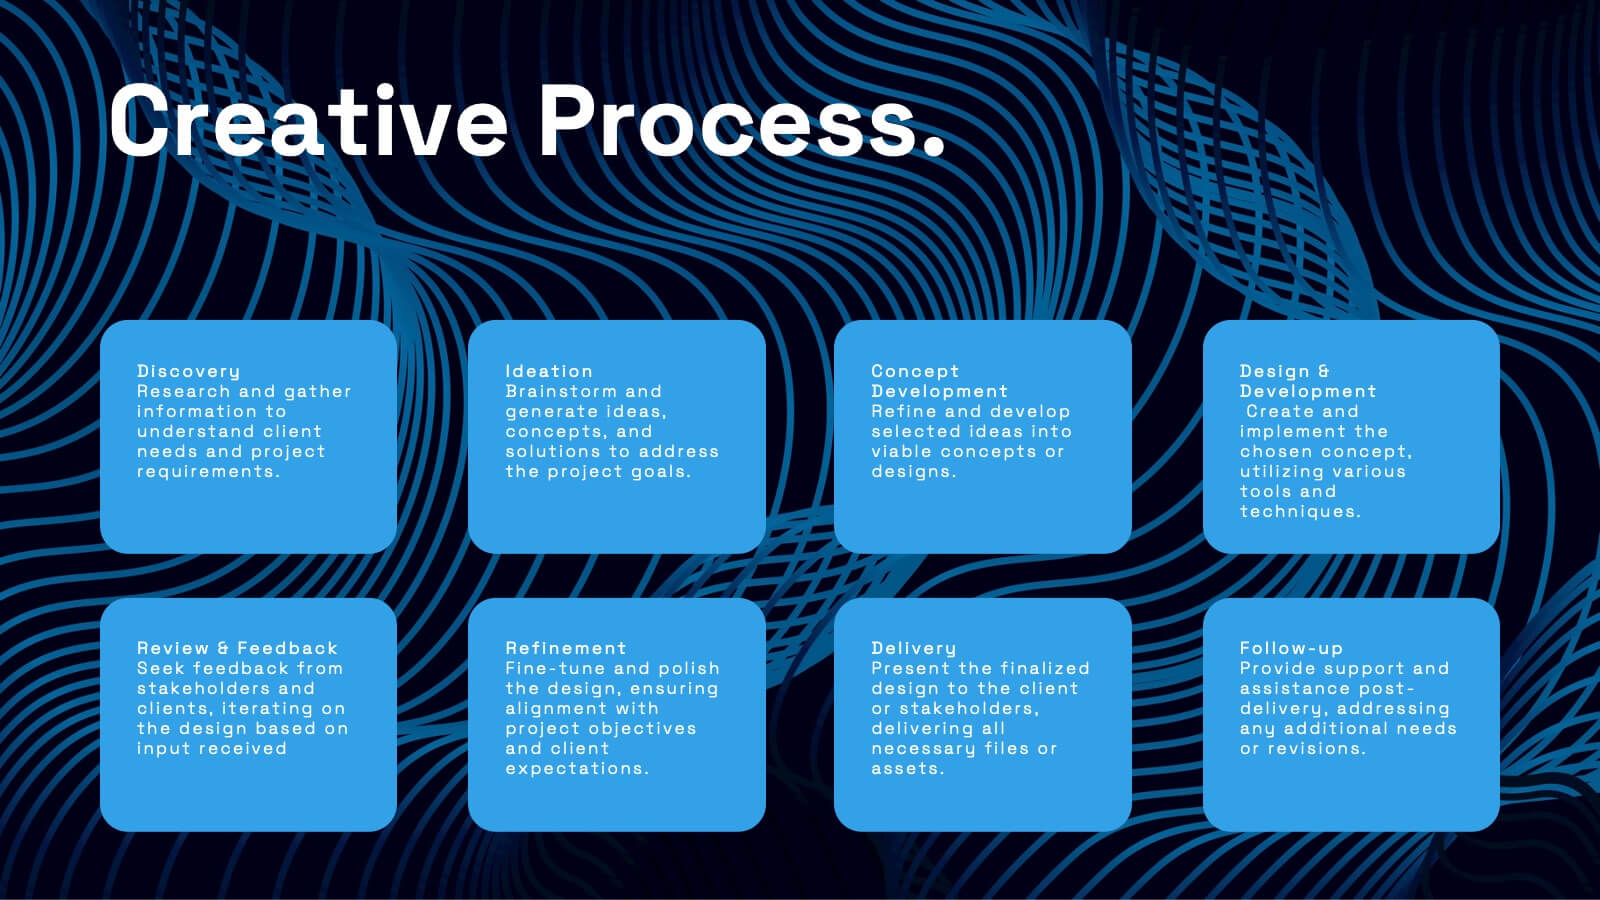
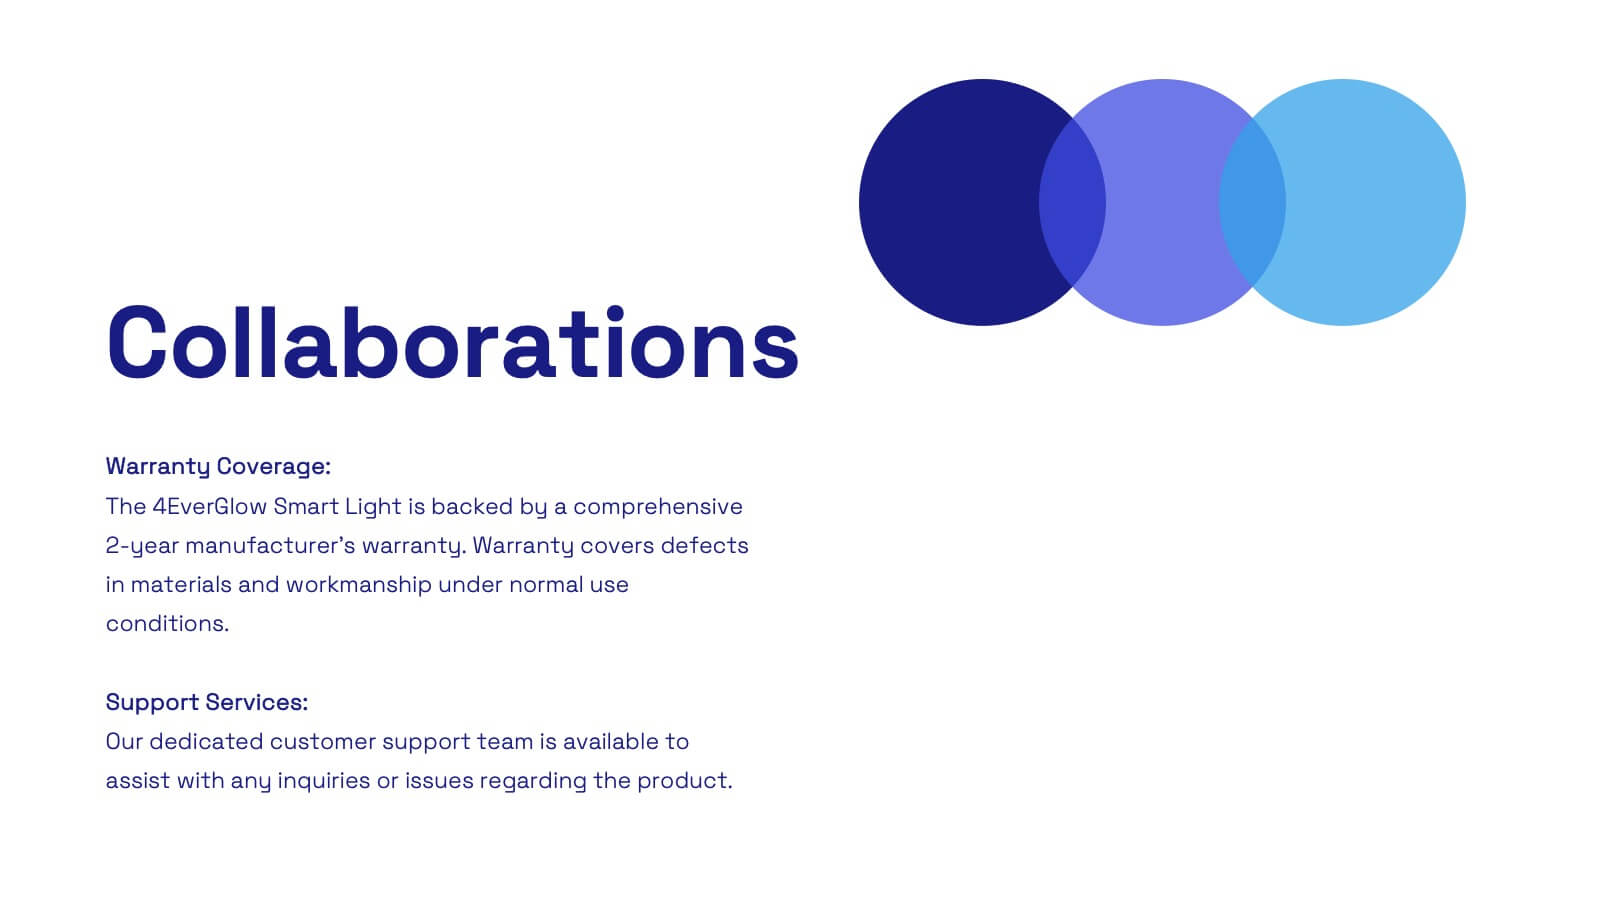
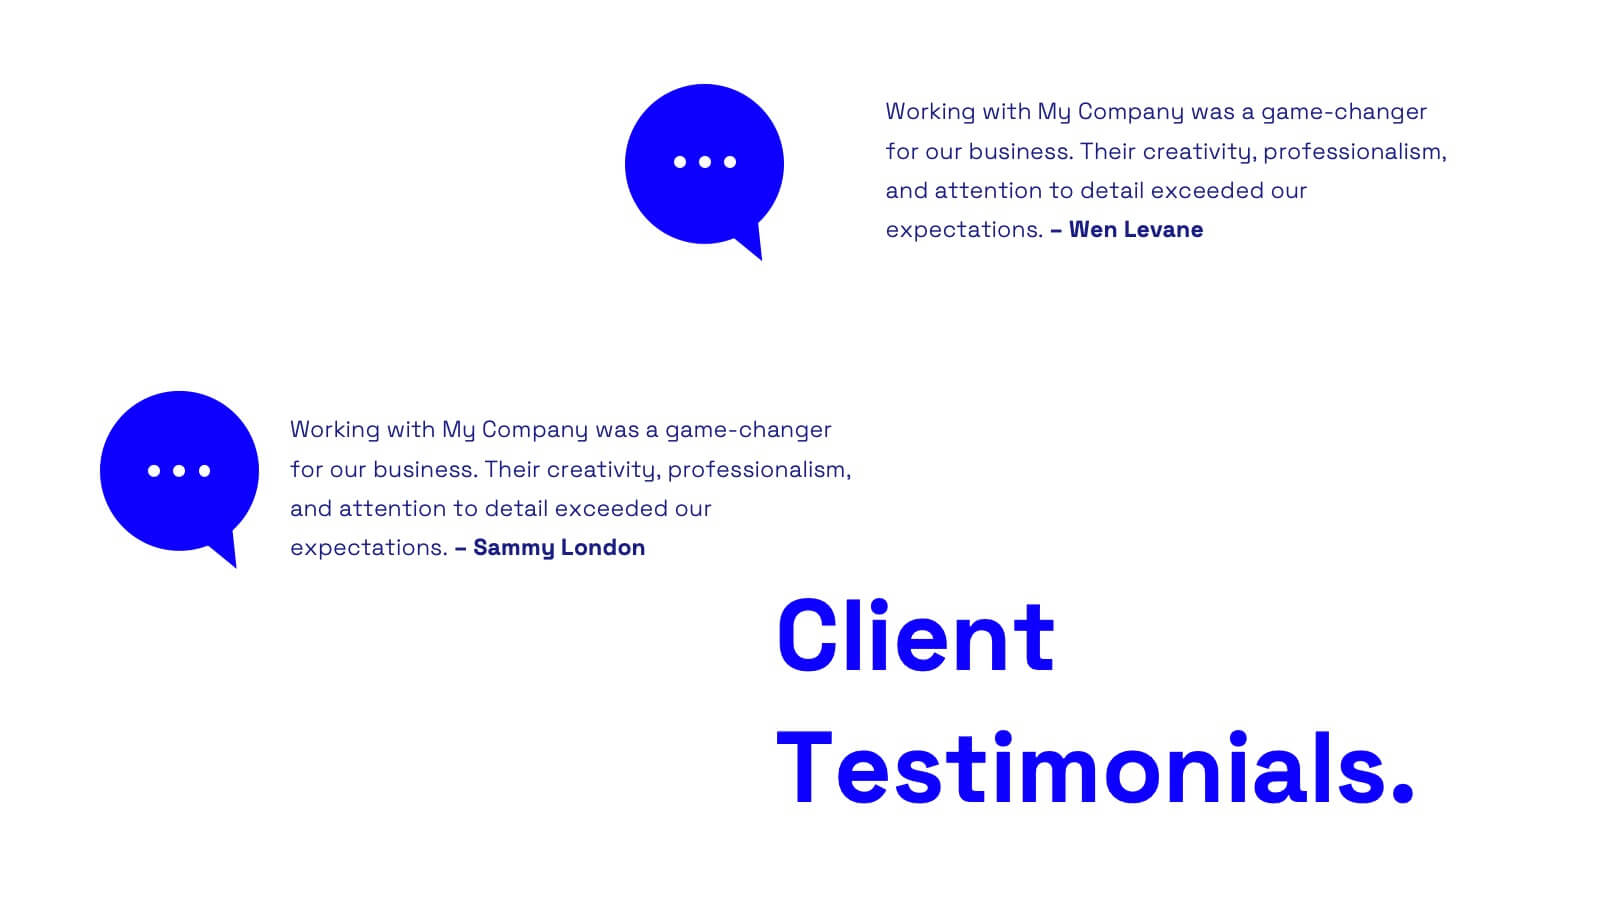
Showcase your creative work with this sleek, modern portfolio template. Perfect for highlighting your projects, philosophy, and client testimonials, it features a professional design with a dynamic layout. Display your awards, services offered, and pricing clearly to impress potential clients. Compatible with PowerPoint, Keynote, and Google Slides, it ensures seamless presentations on any platform.


7 slides
Concentric Circles Model Infographic Presentation
A Concentric Circle Infographic is a visual tool that represents information, data or ideas in a circular format, where each circle is centered inside the next larger circle. In this template you can use the circles to show the relationships between different elements or components, with the innermost circle representing the most important or central idea, and the outer circles representing related or peripheral ideas. Designed in Powerpoint, Keynote, and Google slides the circles in the template can be easily customized with different colors, sizes, and designs to fit your needs.


8 slides
Interactive Digital Learning Experience Presentation
Make your content more engaging with the Interactive Digital Learning Experience Presentation. This layout blends quiz-style visuals and educational icons, helping you present learning modules, assessments, or training checkpoints in a fun and intuitive way. Use it to simplify information, boost audience interaction, or highlight multiple-choice content. Fully editable in Canva, PowerPoint, Keynote, and Google Slides.


6 slides
E-Learning Industry Infographic
E-learning, short for "electronic learning," refers to the use of digital technologies to deliver educational content and programs to learners via the internet or other digital platforms. This infographic template is a visual representation that provides key information and insights about the e-learning industry. This encompasses a wide range of online learning methods, tools, and resources that cater to various educational needs and goals. This template serves as a valuable tool to educate viewers about the e-learning landscape, its benefits, and its potential for transforming education and training.


6 slides
Commercial Agriculture Infographics
Explore the world of Commercial Agriculture with our customizable infographic template. This template is fully compatible with popular presentation software like PowerPoint, Keynote, and Google Slides, allowing you to easily customize it to illustrate and communicate various aspects of commercial agriculture. The Commercial Agriculture infographic template offers a visually engaging platform to explore and explain the practices, trends, and challenges in modern agriculture for commercial purposes. Whether you're a farmer, agricultural professional, student, or simply interested in food production and sustainability, this template provides a user-friendly canvas to create informative presentations and educational materials. Deepen your understanding of Commercial Agriculture with this SEO-optimized infographic template, thoughtfully designed for clarity and ease of use. Customize it to highlight key agricultural practices, technologies, crop management, and the importance of sustainable farming, ensuring that your audience gains valuable insights into this vital industry. Start crafting your personalized infographic today to explore the world of Commercial Agriculture.


10 slides
Post-Pandemic Business Strategy Presentation
Help your team adapt to the new normal with this sleek and professional slide layout. Featuring a sanitizer bottle graphic as a central metaphor, the design visually supports your content on strategic recovery, operational safety, or workflow changes. Includes four editable text sections, each with modern icons. Ideal for HR, leadership updates, or business continuity plans. Compatible with PowerPoint, Keynote, and Google Slides.


5 slides
Team and Client Feedback Collection Strategy
Gather actionable insights with the Team and Client Feedback Collection Strategy Presentation. This slide layout uses a balanced circular and rating-star design to showcase four core feedback sources—ideal for presenting survey outcomes, satisfaction metrics, and review strategies. Fully editable in PowerPoint, Keynote, and Google Slides.


7 slides
Short Term Goals Infographic Presentation
Short-term Goals are important because they provide a clear focus and direction for individuals or organizations to achieve their long-term objectives. Get started on your goals in no time with this template. It is professional, clean and has everything you need to create a presentation. It's a good choice for career advancement and pitches. This template is designed to help your audience visualize the impact of your goals. Use this template as a base to brainstorm your vision and objectives with your team. The goal-oriented design will bring awareness and create excitement about your goals.


6 slides
Regional Finance Infographic
Regional finance plays a vital role in fostering economic growth, attracting investments, and improving the overall well-being of communities within a specific region. This infographic template focuses on financial trends, insights, and data related to specific regions or countries. It is designed to help businesses, organizations, or financial professionals analyze and understand the financial landscape of a particular region. The data-driven content in this template is suitable for businesses or individuals seeking insights to make informed decisions regarding investments, market entry, or financial planning in a specific region.


8 slides
Insurance Market Trends Presentation
Stay Ahead in the Insurance Industry with this Insurance Market Trends Presentation template. Designed with a modern roadmap layout, this slide helps illustrate key trends, policy changes, and industry insights in an engaging and structured way. Ideal for insurance professionals, financial analysts, and business strategists, this fully customizable template is compatible with PowerPoint, Keynote, and Google Slides, making it easy to adapt to your specific needs.


8 slides
International Marketing Infographic
International Marketing refers to the strategies and activities undertaken by businesses to promote and sell their products or services in markets outside of their home country. This infographic template highlights key aspects of international marketing strategies and best practices. It is designed to help businesses understand the complexities and opportunities of marketing products or services in global markets. This provides an overview of international marketing concepts and strategies. Compatible with Powerpoint, Keynote, and Google Slides. This template is suitable for businesses aiming to expand their reach and succeed in the global marketplace.


20 slides
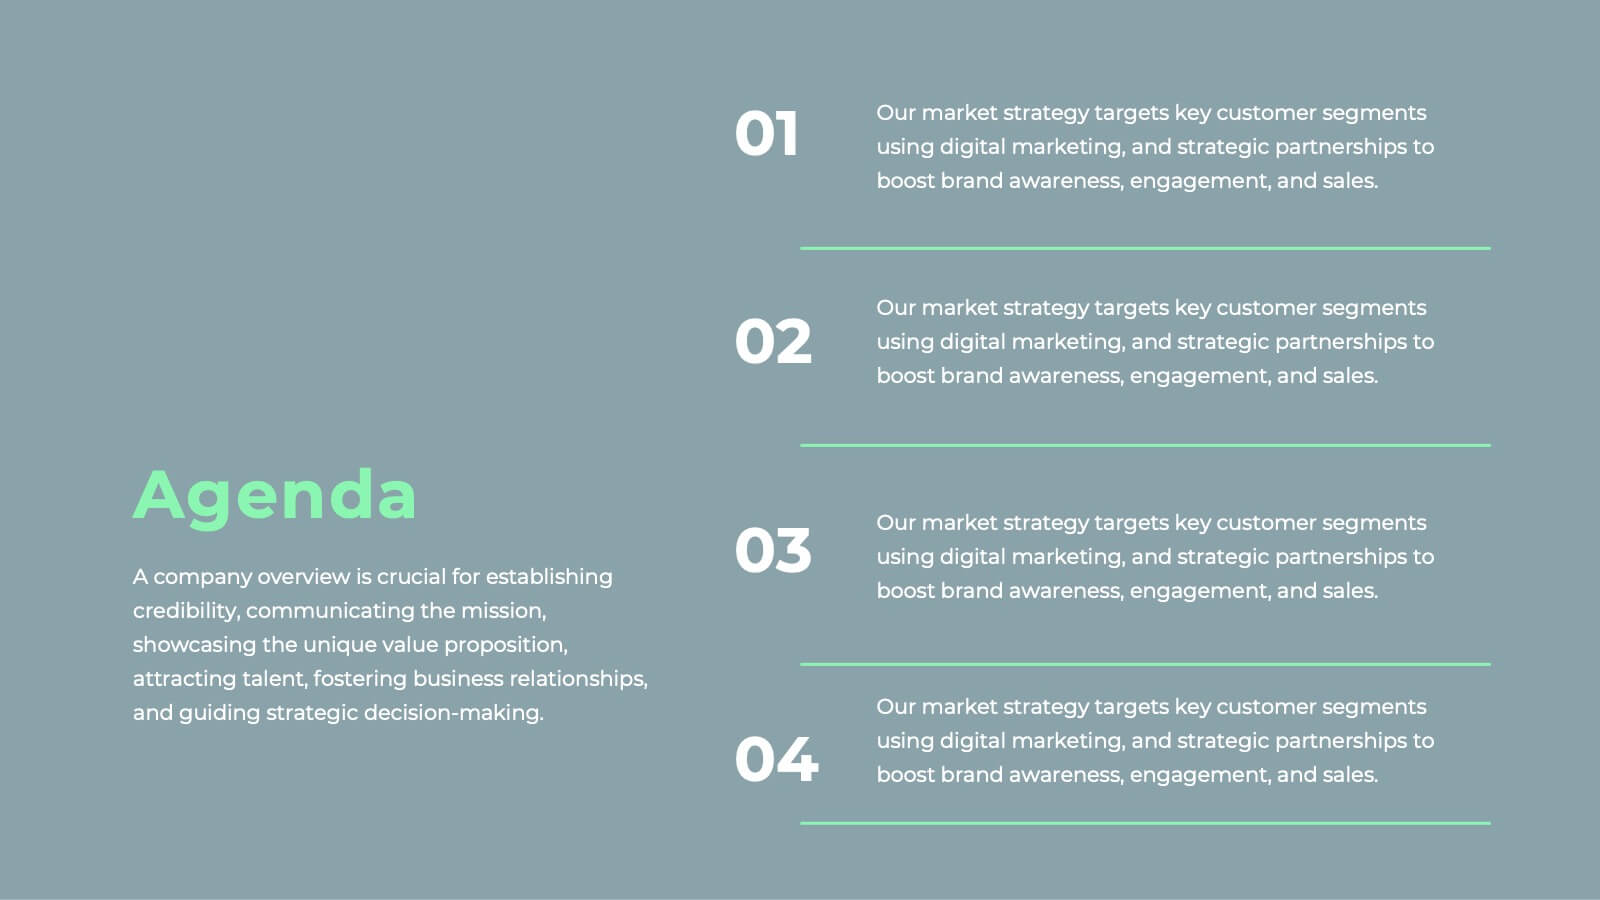
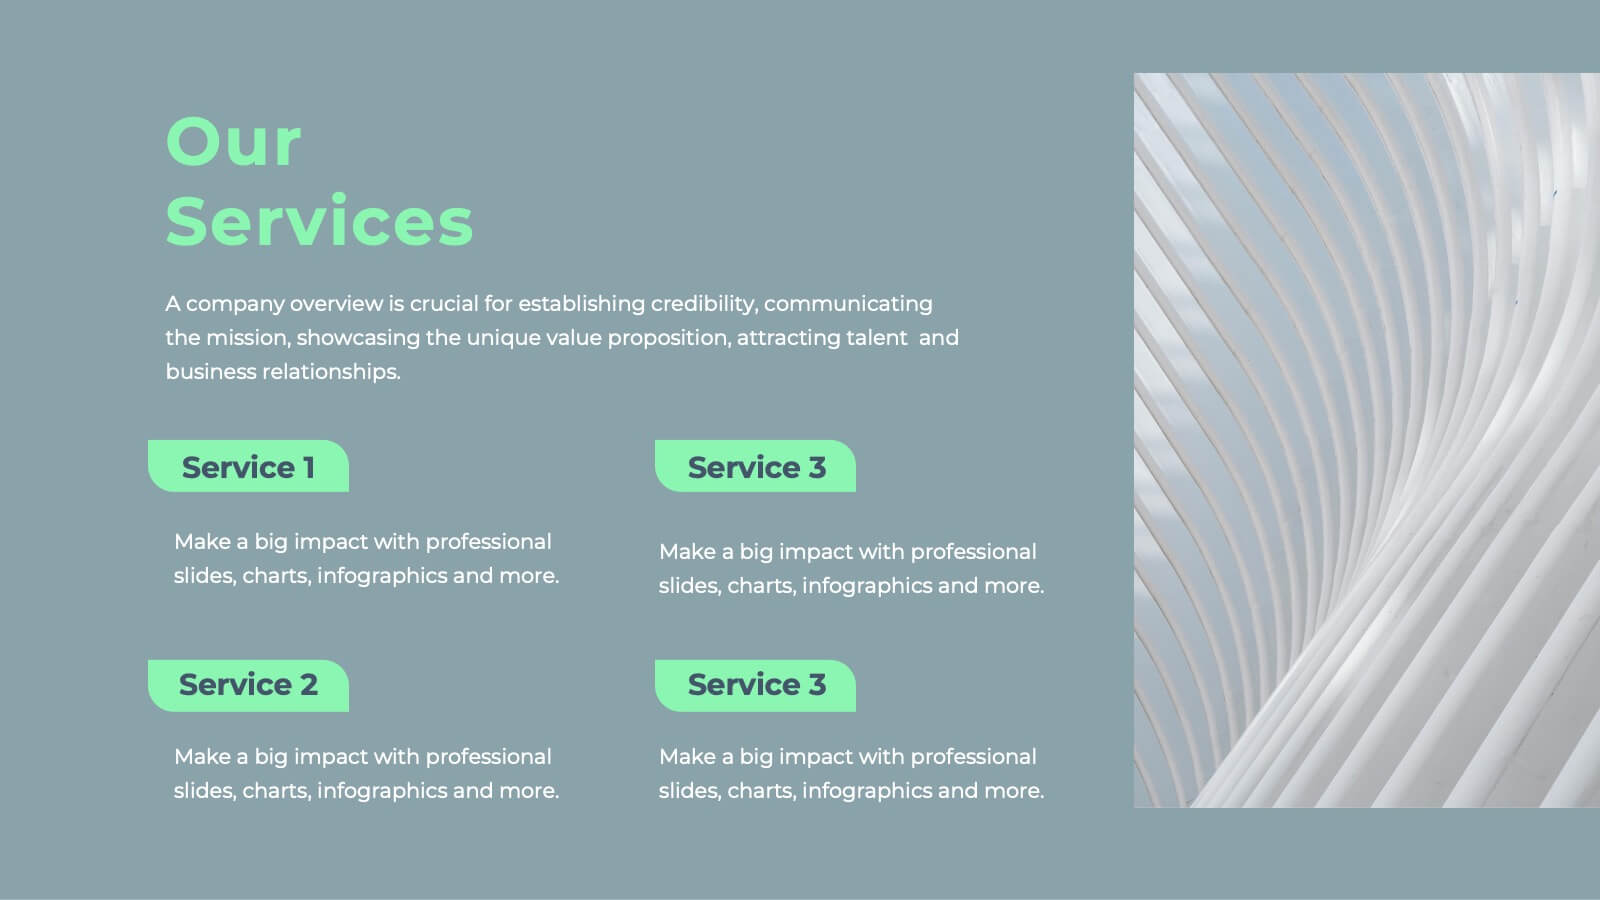
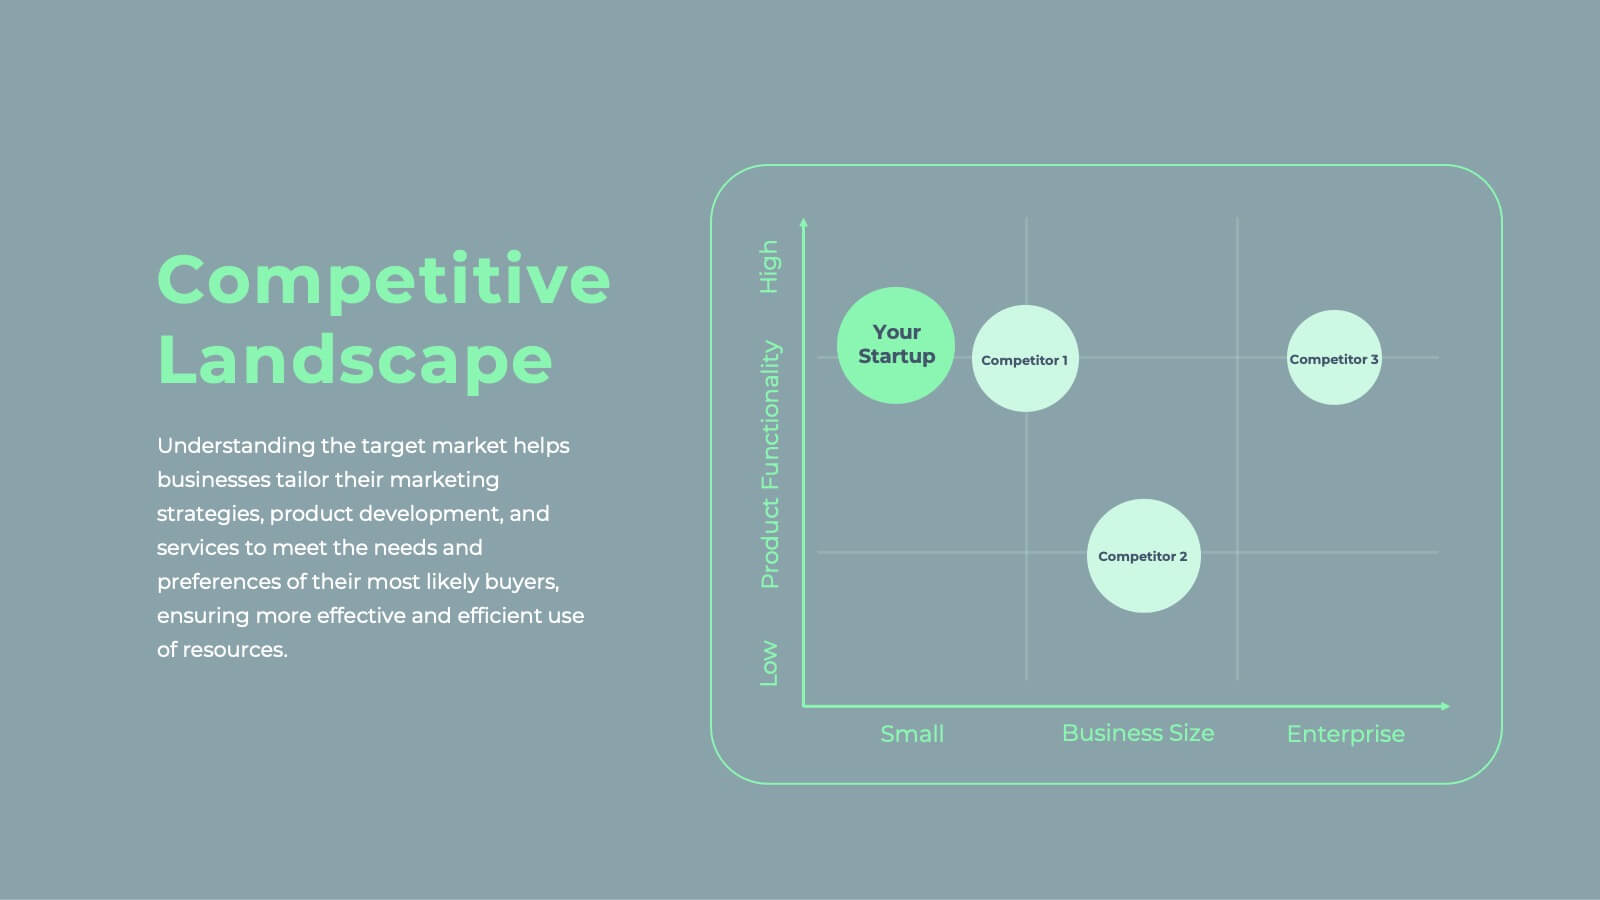
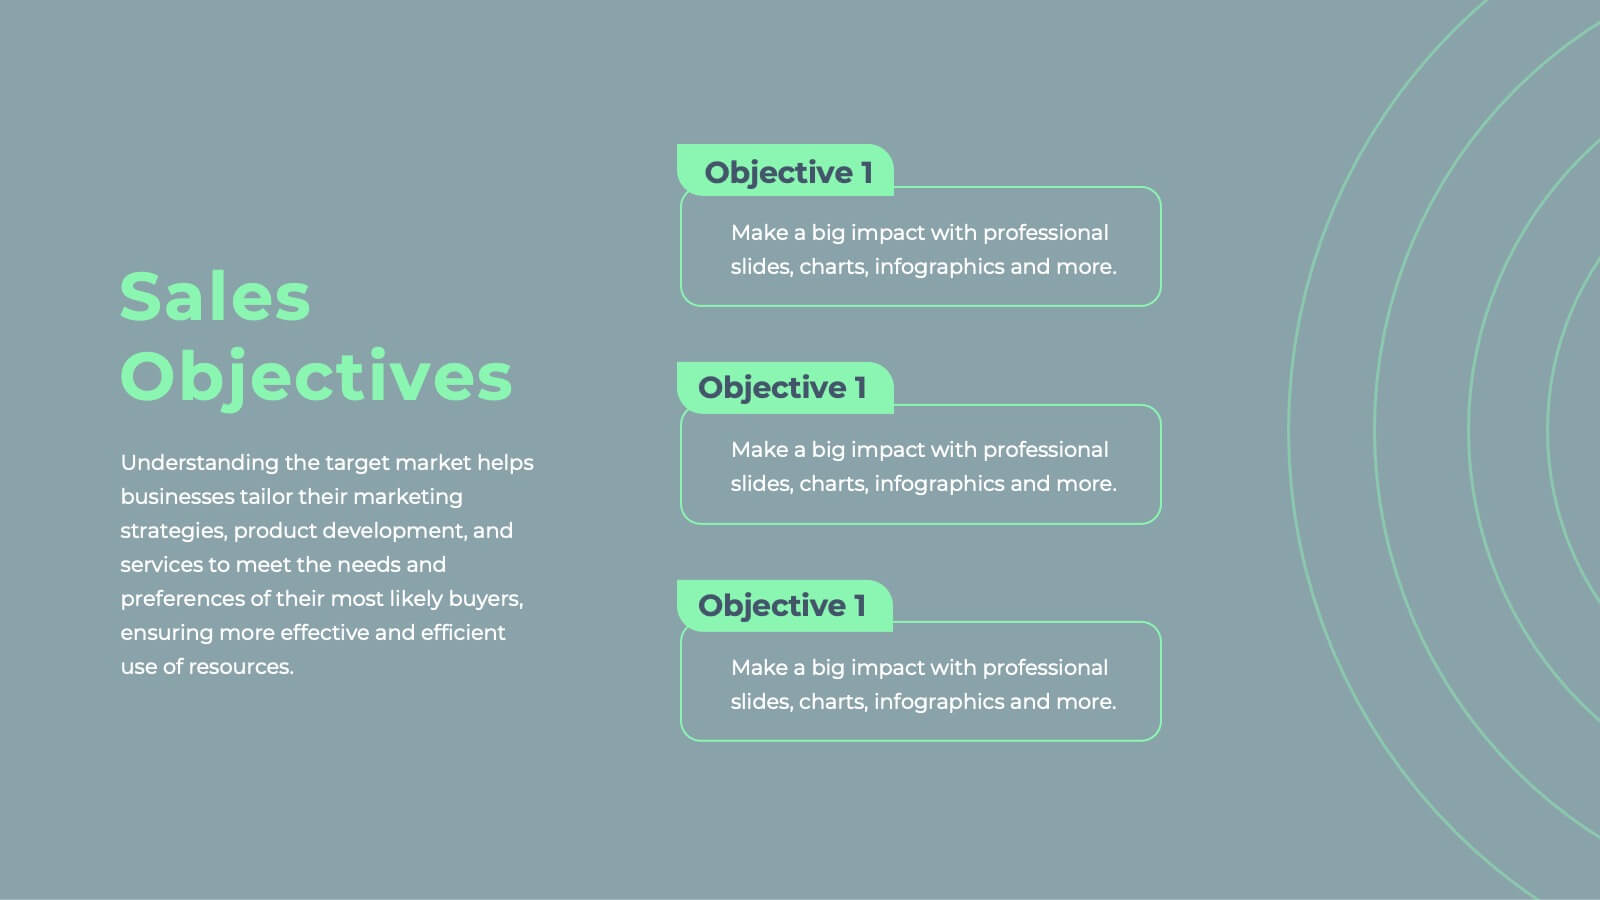
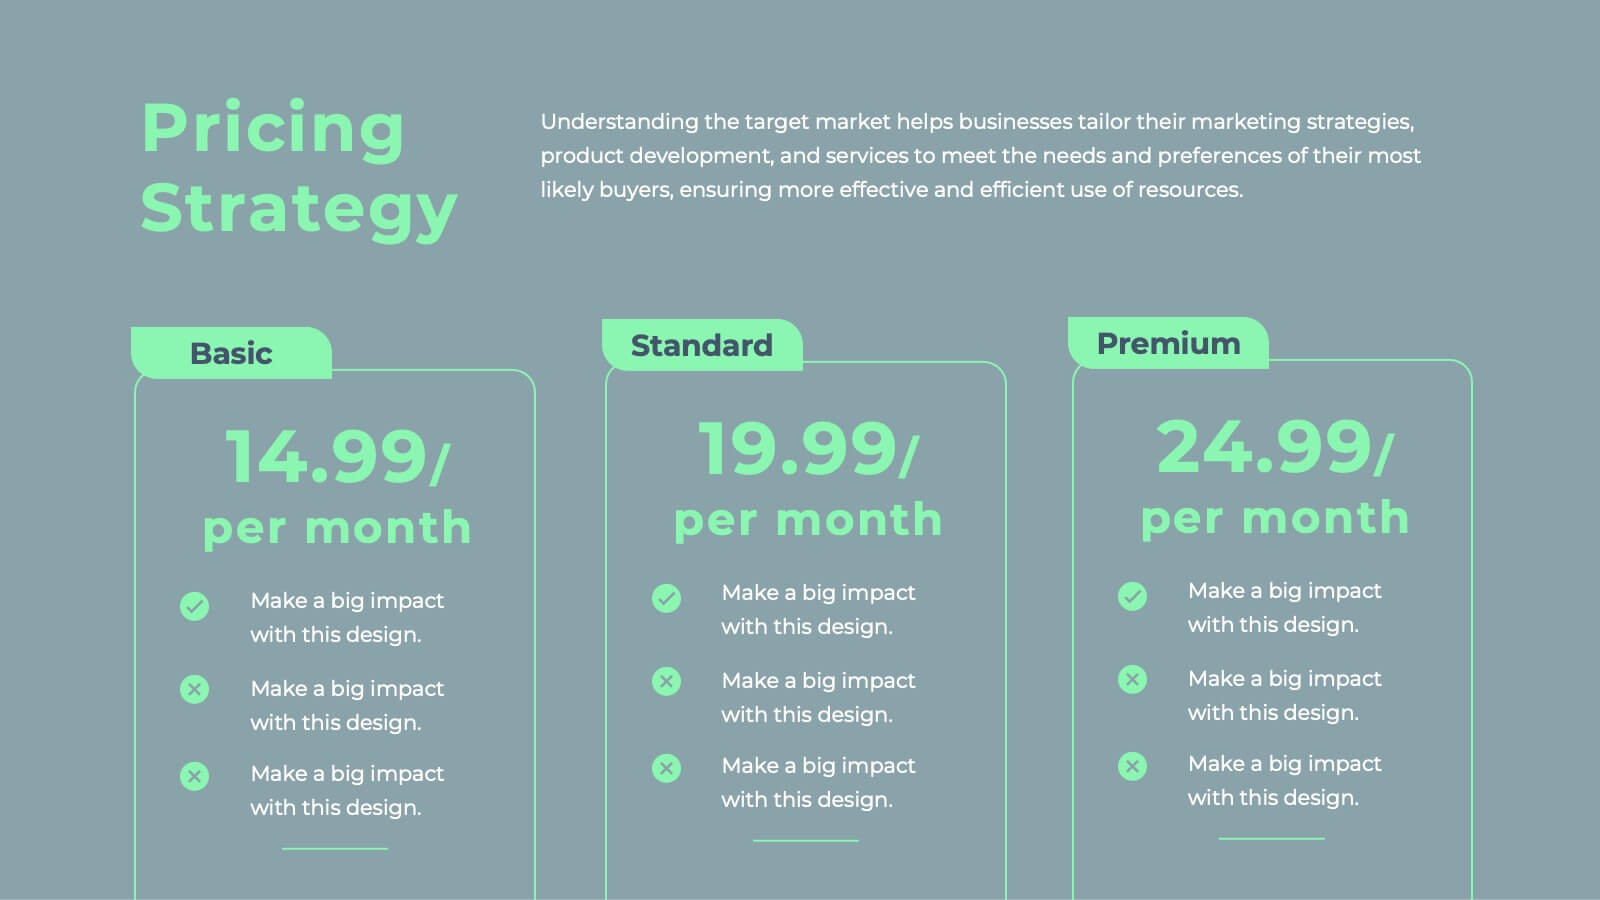
Javelin Sales Strategy Presentation
Boost your sales strategy with this sleek template! Perfect for outlining objectives, processes, performance metrics, and future opportunities. Tailored for impactful presentations to clients and teams. Fully customizable and compatible with PowerPoint, Keynote, and Google Slides.


6 slides
Market Challenges and Resilience Strategy Presentation
Tackle volatility with clarity using the Market Challenges and Resilience Strategy presentation. This slide features a modern smartphone graphic surrounded by six key strategy zones, each with its own icon and text area—ideal for outlining market pressures, competitive moves, or adaptive responses. Use it to communicate resilience frameworks, digital transformation steps, or scenario planning. Fully customizable in PowerPoint, Keynote, and Google Slides.


6 slides
KPI Metric Infographic
KPI stands for Key Performance Indicator, and it is a measurable value that helps organizations track their progress and performance towards achieving specific business goals and objectives. This infographic template is designed to display key performance indicators and metrics in a concise and easy-to-understand manner. KPIs are quantifiable measurements used to evaluate the success of an organization, project, or specific business activities. The infographic provides a visual representation of these KPIs, making it easier for stakeholders and decision-makers to interpret the data and track progress.


8 slides
Machine Learning Overview Presentation
The "Machine Learning Overview" presentation template features a central circular design that effectively illustrates the interconnectedness of various components in machine learning processes. Each segment of the circle is dedicated to a key area such as data acquisition, algorithm development, model training, validation, and deployment, which are critical to understanding and executing machine learning projects. This visual arrangement makes it easy to follow and is ideal for educational environments or professional settings where clarity and concise information delivery are essential.


7 slides
North America Population Infographic Presentation
North America is a continent located in the northern hemisphere of the Earth, bordered by the Pacific Ocean to the west. It includes countries such as the United States, Canada, Mexico, and several others in the Caribbean and Central America. This template can be a powerful tool to communicate information about the continent in an informative and engaging way. This can help people understand and appreciate the diversity and complexity of North America, and can be used for a variety of purposes, from education to marketing. This template is compatible with Powerpoint, Keynote and Google Slides.