


Features
- 5 Unique slides
- Fully editable and easy to edit in Microsoft Powerpoint, Keynote and Google Slides
- 16:9 widescreen layout
- Clean and professional designs
- Export to JPG, PDF or send by email


Do you have any questions?
Recommend


6 slides
Blue Ocean Market Infographics
Dive into the concept of Blue Ocean Markets with our customizable infographic template. This template is fully compatible with popular presentation software like PowerPoint, Keynote, and Google Slides, allowing you to easily customize it to illustrate and communicate various aspects of Blue Ocean Strategy and market creation. The Blue Ocean Market infographic template offers a visually engaging platform to explain the principles, strategies, and advantages of creating new market spaces by focusing on innovation and value innovation. Whether you're a business leader, strategist, entrepreneur, or anyone interested in market expansion, this template provides a user-friendly canvas to create informative presentations and educational materials. Deepen your knowledge of Blue Ocean Markets with this SEO-optimized infographic template, thoughtfully designed for clarity and ease of use. Customize it to showcase the differentiation factors, examples of successful blue ocean strategies, and the shift from competition to uncontested market space, ensuring that your audience gains valuable insights into this innovative approach. Start crafting your personalized infographic today to explore the world of Blue Ocean Markets.


10 slides
Employee Retention and HR Strategy Presentation
Present your HR initiatives with a clean, puzzle-inspired visual in this Employee Retention and HR Strategy slide. This layout features a silhouette icon alongside a 5-step vertical format—each step with its own icon and title box—to illustrate key elements like onboarding, employee engagement, recognition programs, and more. Fully editable and compatible with PowerPoint, Keynote, and Google Slides.


21 slides
Karma Design Portfolio Presentation
Step into the spotlight with this bold and contemporary design portfolio! It presents your creative work in a sleek, visually striking format. From featured projects to your creative process and collaborations, this portfolio will leave a lasting impression. Perfect for showcasing your design style on PowerPoint, Keynote, or Google Slides!


21 slides
Sol Photography Portfolio Template Presentation
Showcase your creative work with this vibrant photography portfolio presentation template. It features sections for introductions, project descriptions, and accolades, making it perfect for photographers looking to display their style and collaborations. Compatible with PowerPoint, Google Slides, and Keynote, this template is designed to impress viewers with its dynamic layout and bright color scheme.
4 slides
Team Performance and Progress Tracker Presentation
Track momentum, highlight achievements, and visualize team success with this clean performance tracker layout. Featuring gauge meters and progress bars, this slide makes it easy to present productivity metrics, goal progress, or task completion at a glance. Fully editable and compatible with PowerPoint, Keynote, and Google Slides.


26 slides
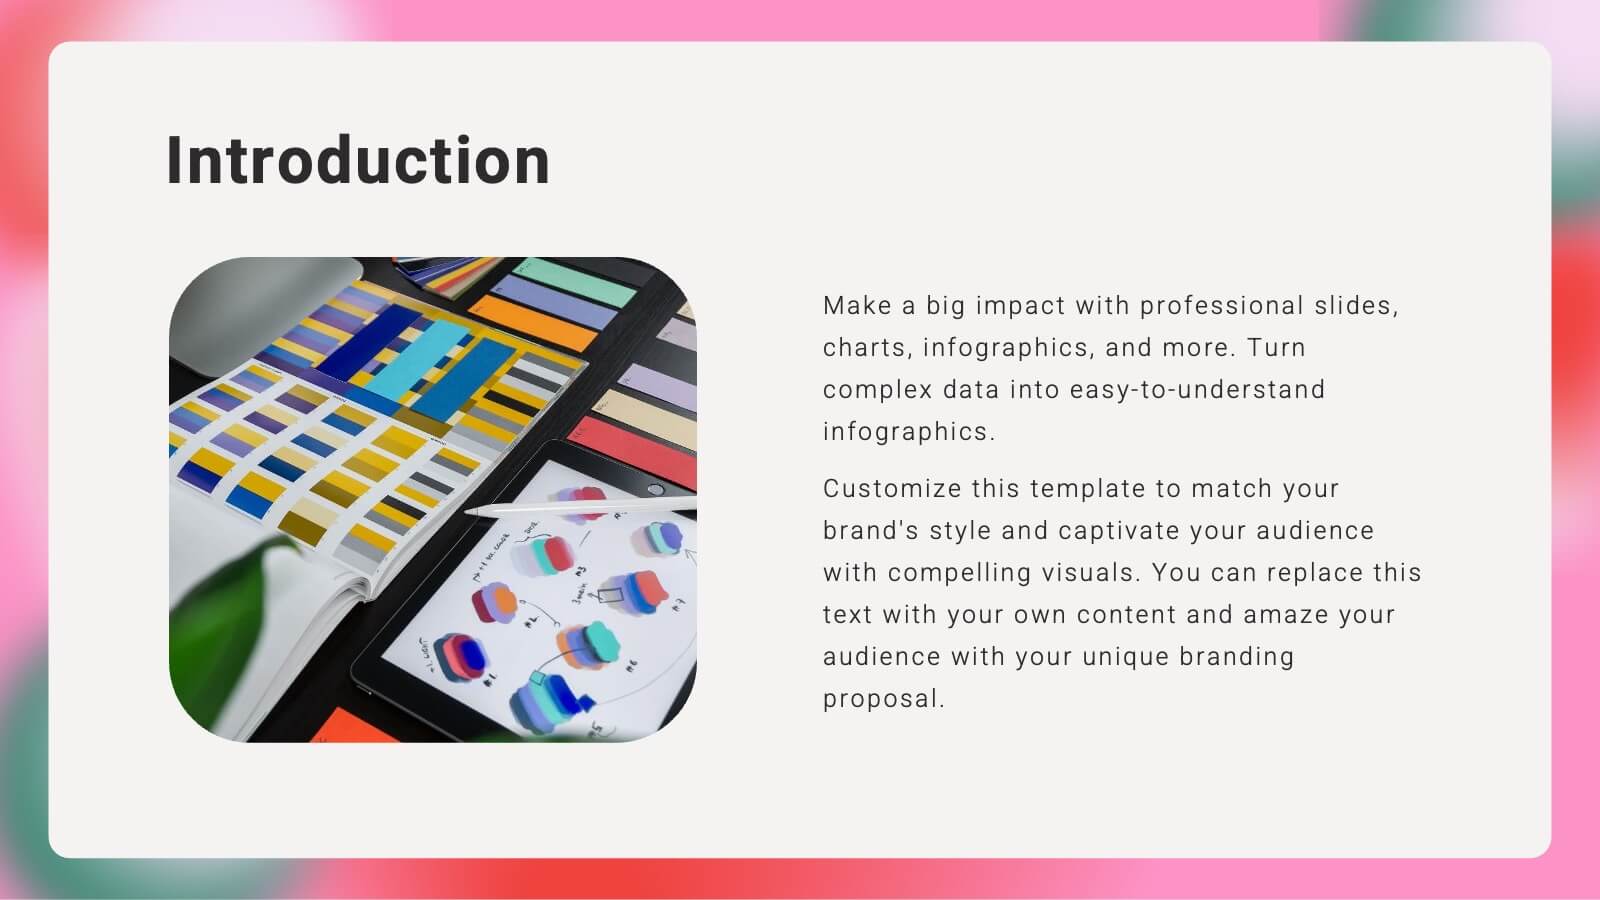
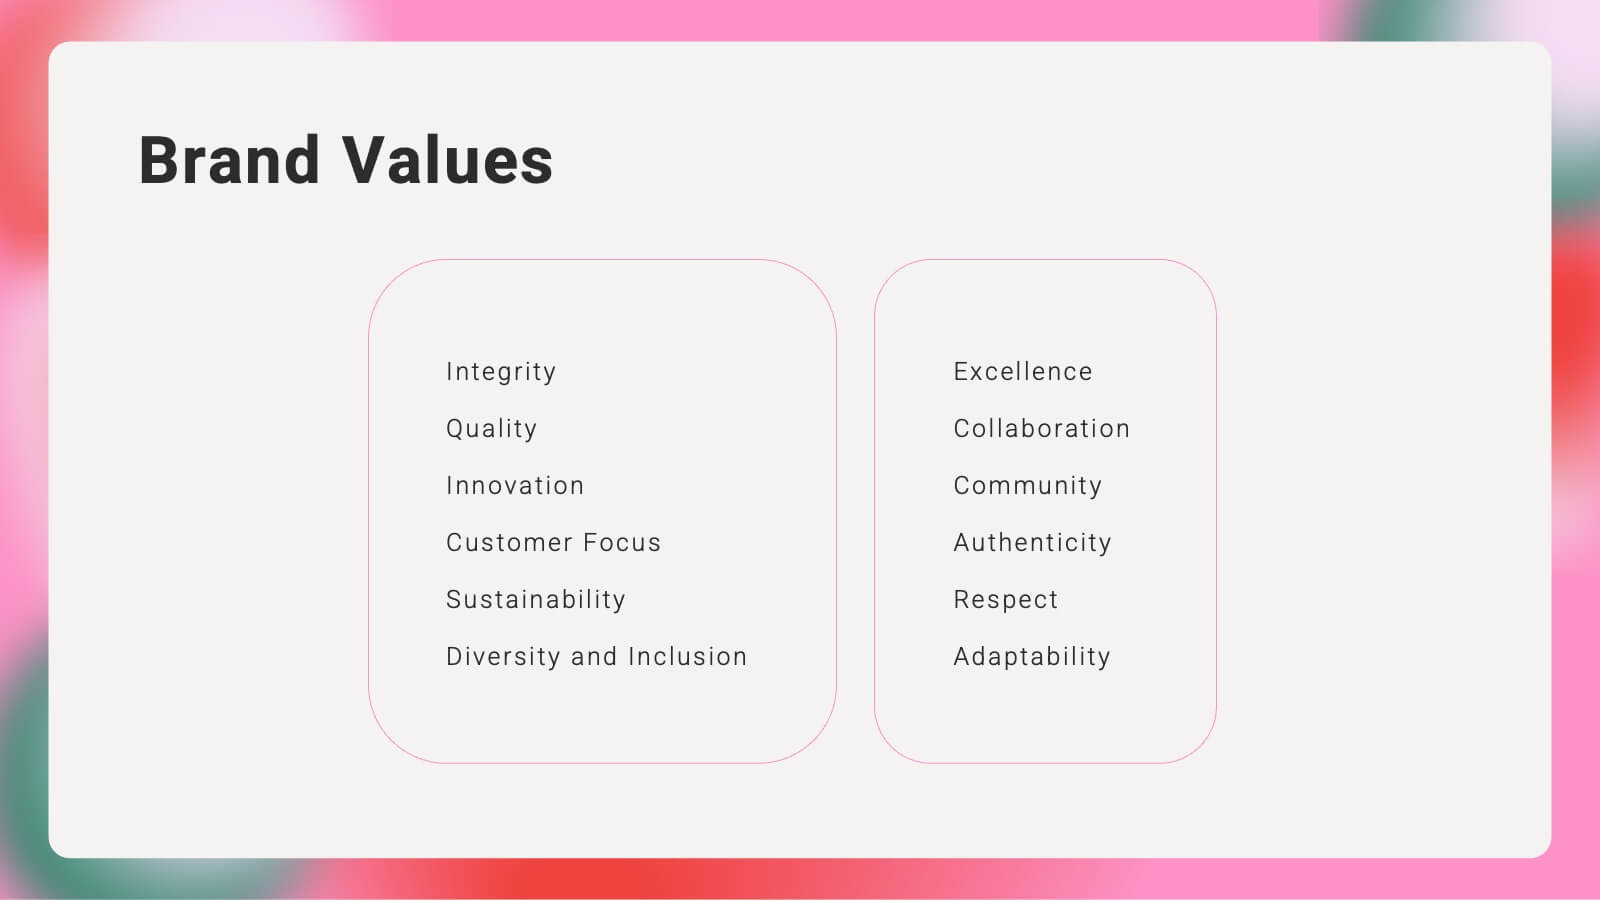
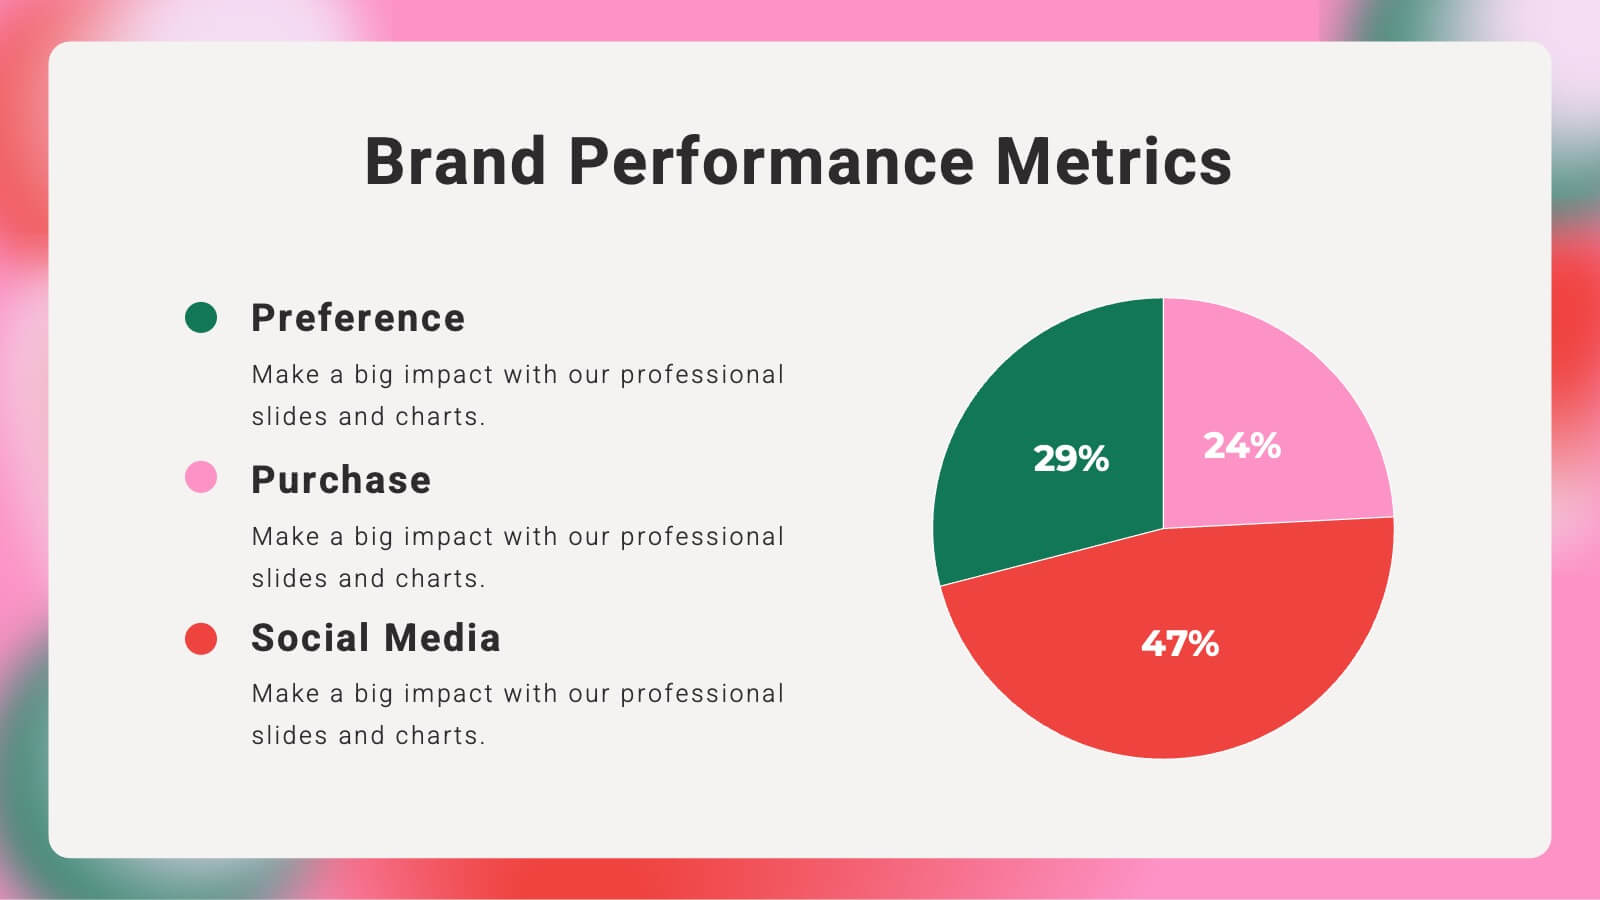
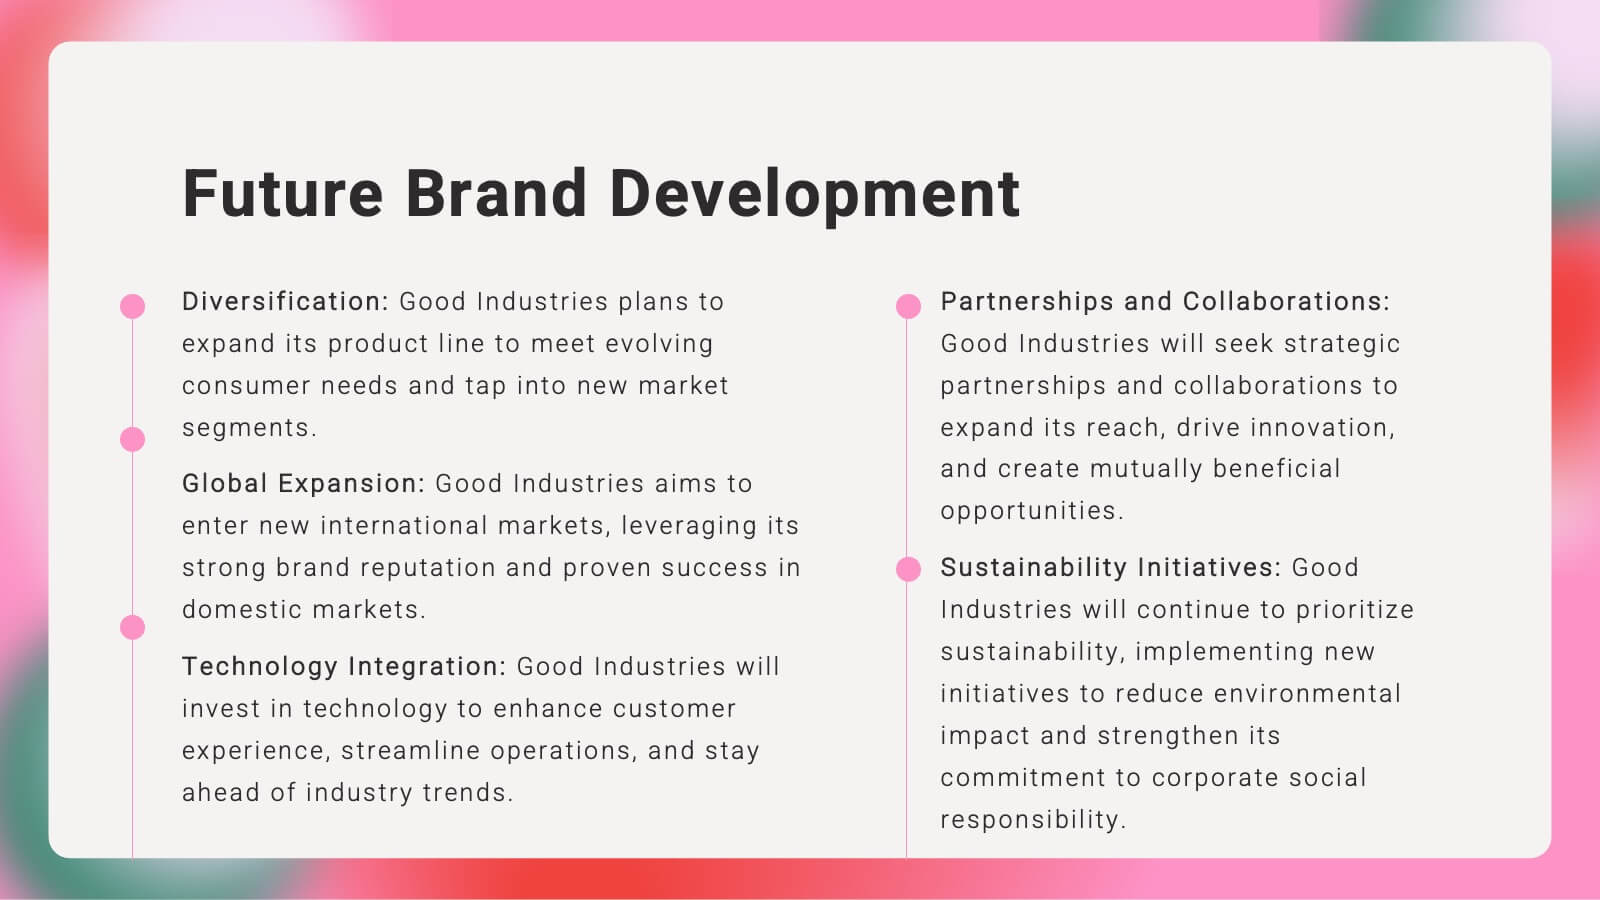
Branding Agency Company Profile Presentation
Branding for a digital agency is essential for creating a strong and memorable identity that sets it apart from competitors and resonates with its target audience. This presentation is a professional template, designed to showcase the expertise and capabilities of a branding agency. With its modern and sleek design, this presentation is perfect for introducing the agency's services, achievements, and client success stories to potential clients, partners, or investors. This template is perfect to showcase successful branding projects and campaigns, emphasizing the challenges faced, the creative solutions employed, and the results achieved for clients.


4 slides
Impact of 5G on Business and Innovation Presentation
Illustrate how next-gen connectivity is transforming industries with this sleek 5G innovation infographic. Featuring a 3D smartphone and signal waves, this slide presents four gradient-colored segments ideal for showcasing business use cases, digital transformation, and market impact. Ideal for tech startups, consultants, and enterprise innovation teams. Easily editable in PowerPoint, Keynote, and Google Slides.


10 slides
IT Infrastructure and Support
Present your tech strategy with clarity using this IT infrastructure and support slide. Featuring a segmented donut chart and coordinated icon-labeled sections, it's perfect for visualizing network components, system layers, or support processes. Ideal for CIOs, IT managers, and tech teams, and fully editable in PowerPoint, Keynote, or Google Slides.


5 slides
Messaging Strategy and Flow Presentation
Communicate with clarity using this streamlined messaging strategy and flow presentation template. Designed to visualize the stages of message planning—from audience segmentation to final delivery—this layout helps teams align communication goals and channels. Ideal for marketing, PR, or internal comms presentations. Fully compatible with PowerPoint, Keynote, and Google Slides.


4 slides
Lean Agile Implementation Roadmap Presentation
Present your Lean Agile journey with this upward roadmap diagram. Designed for project managers and Agile teams, this layout visualizes four progressive stages using icons and curved arrows. Ideal for showcasing phased adoption, sprint milestones, or transformation goals. Fully customizable in PowerPoint, Keynote, and Google Slides for easy adaptation.


22 slides
Event Agenda Presentation
Organize your event with precision using this Event Agenda presentation template. Designed for clarity and impact, it includes slides for conference overviews, speaker introductions, session descriptions, and networking opportunities. Perfect for business conferences or workshops, this template is compatible with PowerPoint, Keynote, and Google Slides, ensuring your event runs smoothly and professionally.


8 slides
Data-Driven KPI Slide Presentation
Bring your data to life with a sharp, modern layout that turns complex metrics into clear, compelling visuals. This presentation helps you showcase performance insights, compare trends, and highlight key takeaways with ease. Fully customizable and compatible with PowerPoint, Keynote, and Google Slides.


7 slides
Watercolor Plan Infographic
A watercolor plan infographic refers to an infographic design or style that incorporates elements of watercolor painting. Dive into the world of dreams and aspirations with our watercolor plan infographic template. This artistic and visually captivating infographic guides you through your plans and goals with the fluidity and creativity of watercolors. This infographic is a visually stunning and inspiring template that transforms the process of goal setting into an artistic masterpiece, encouraging individuals to paint their dreams with vivid hues of determination and creativity.


23 slides
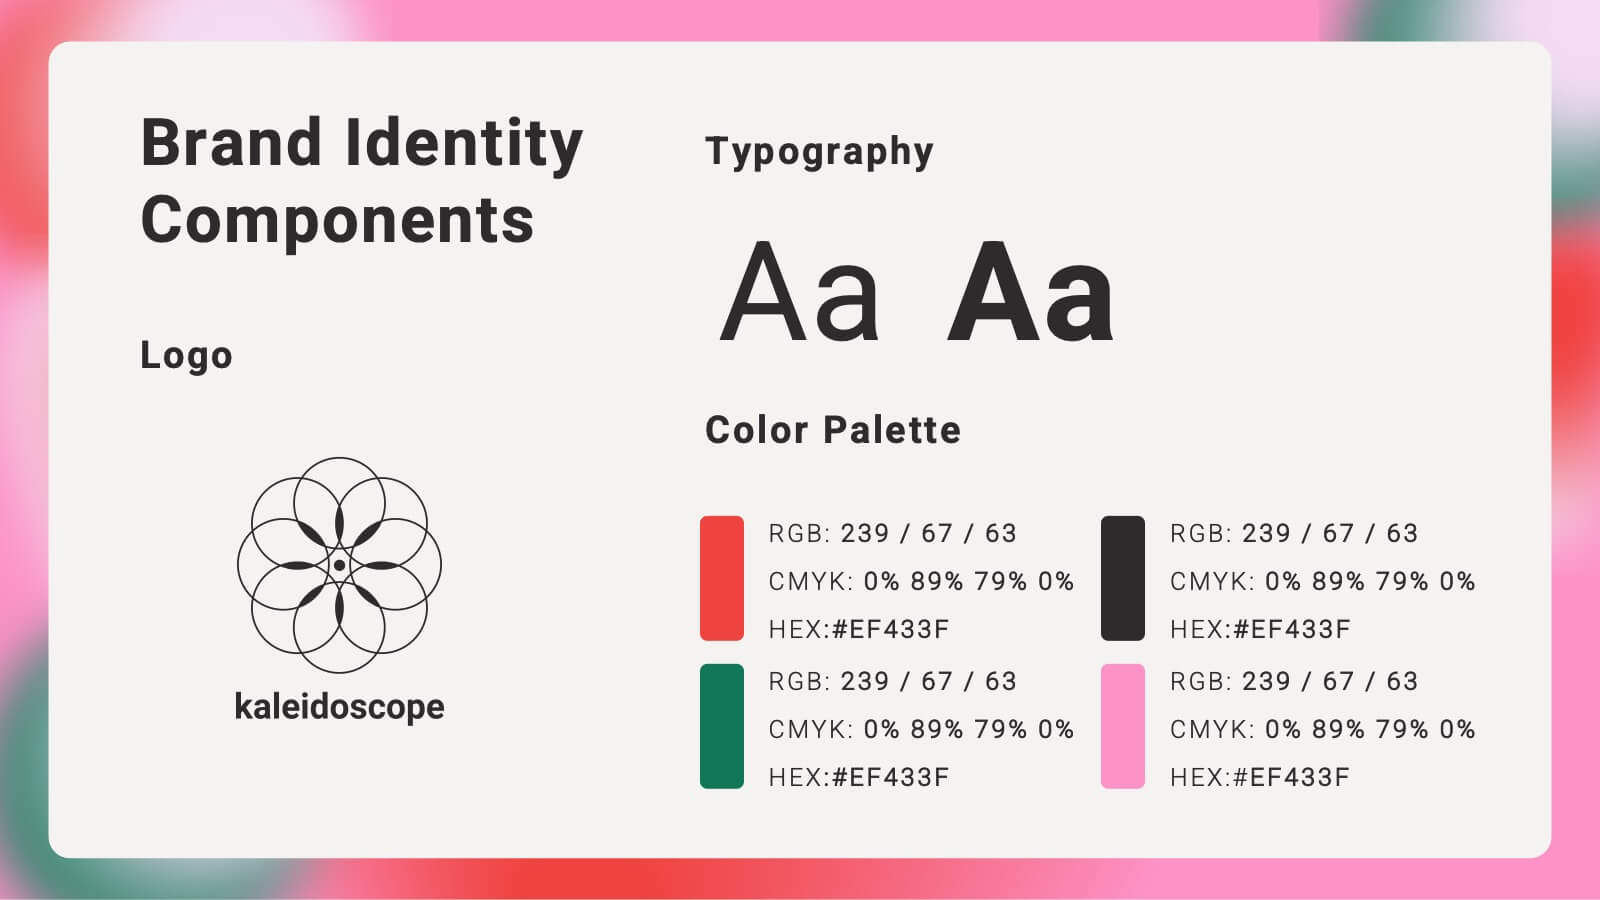
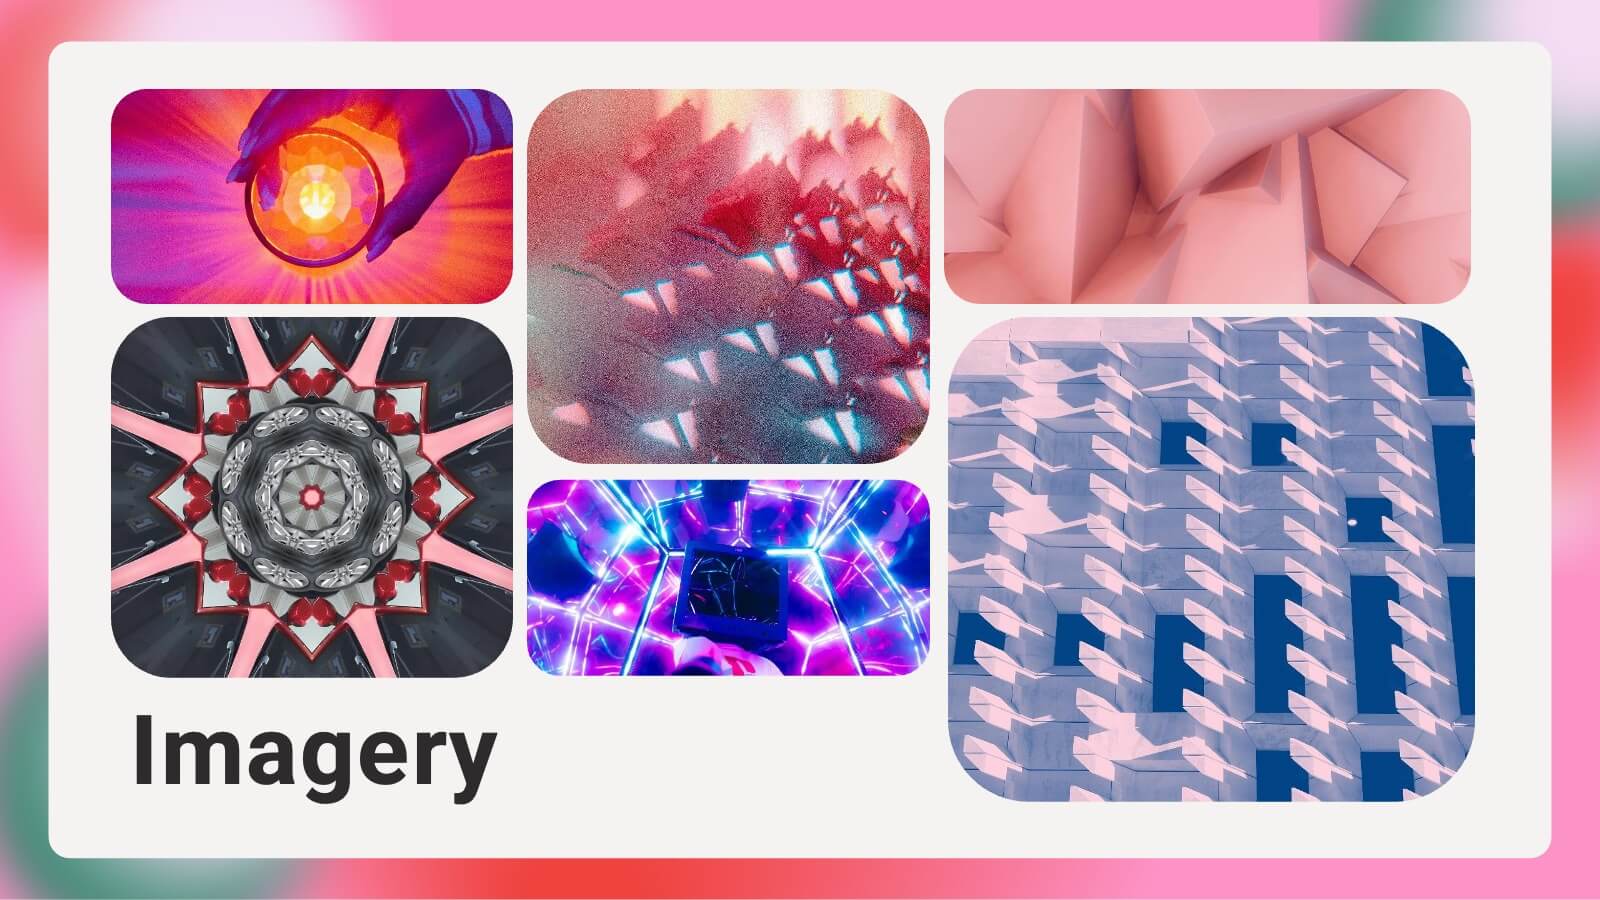
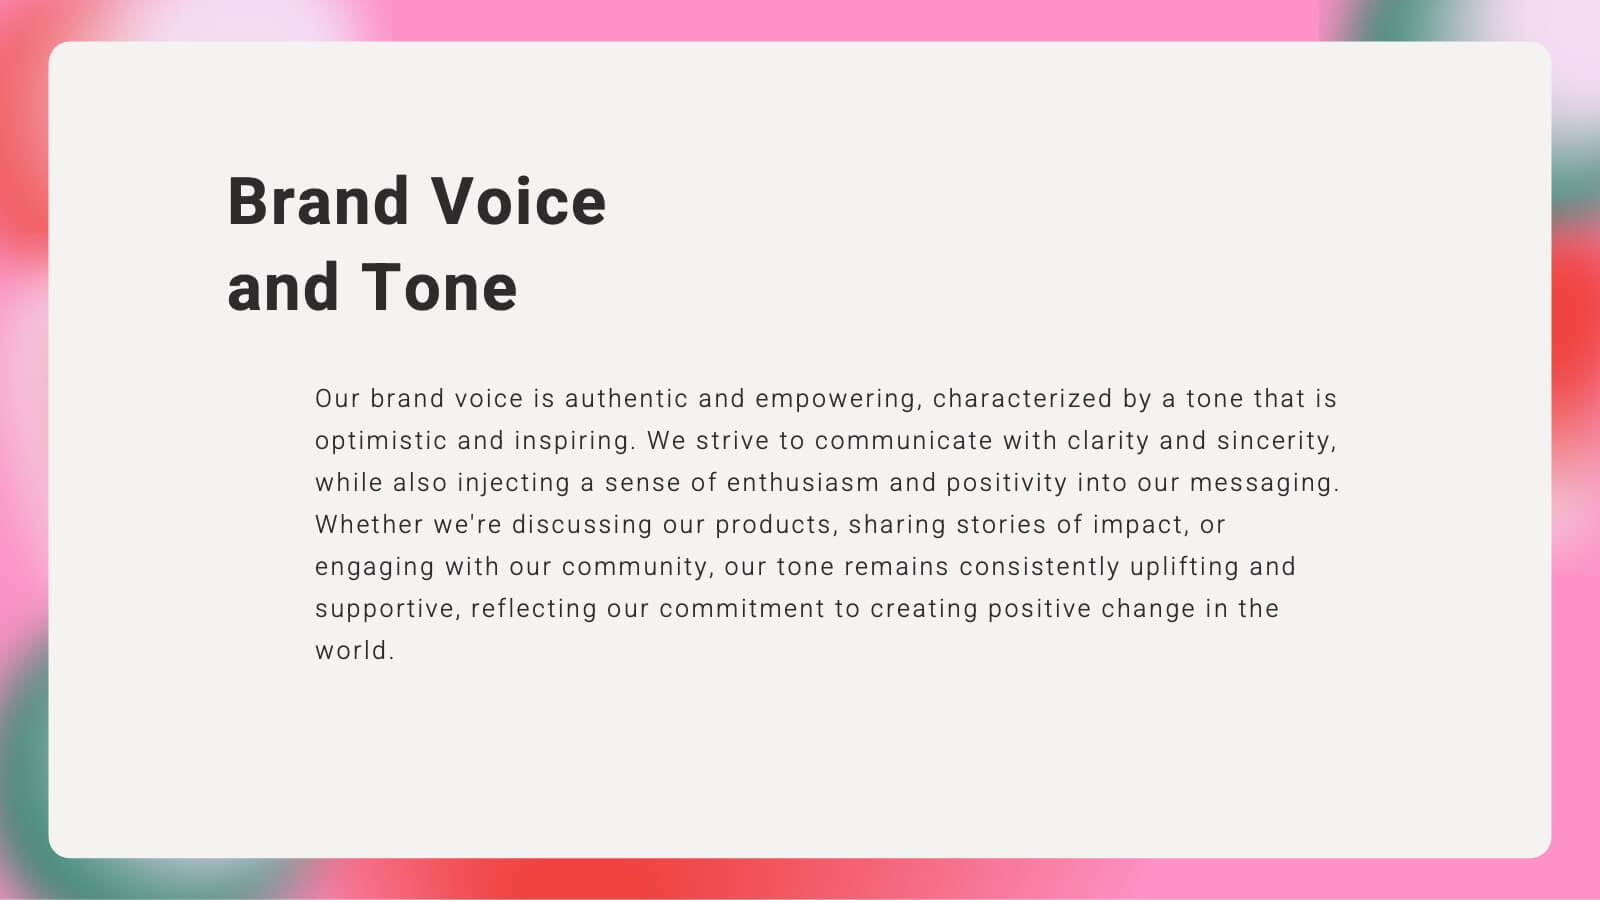
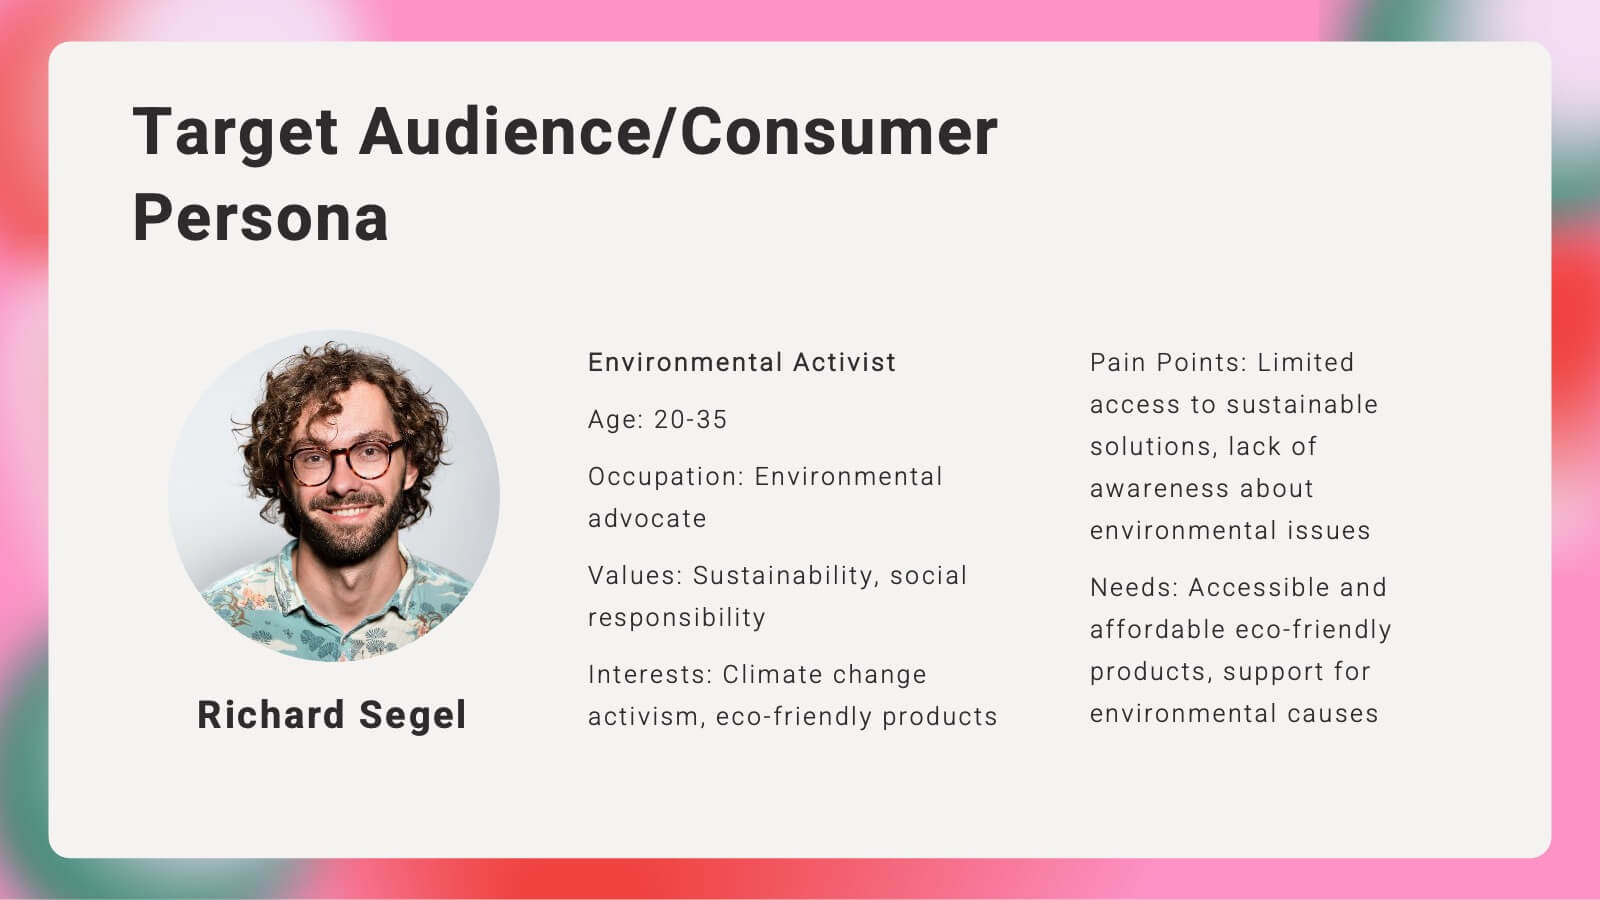
Kaleidoscope Brand Strategy Report Presentation
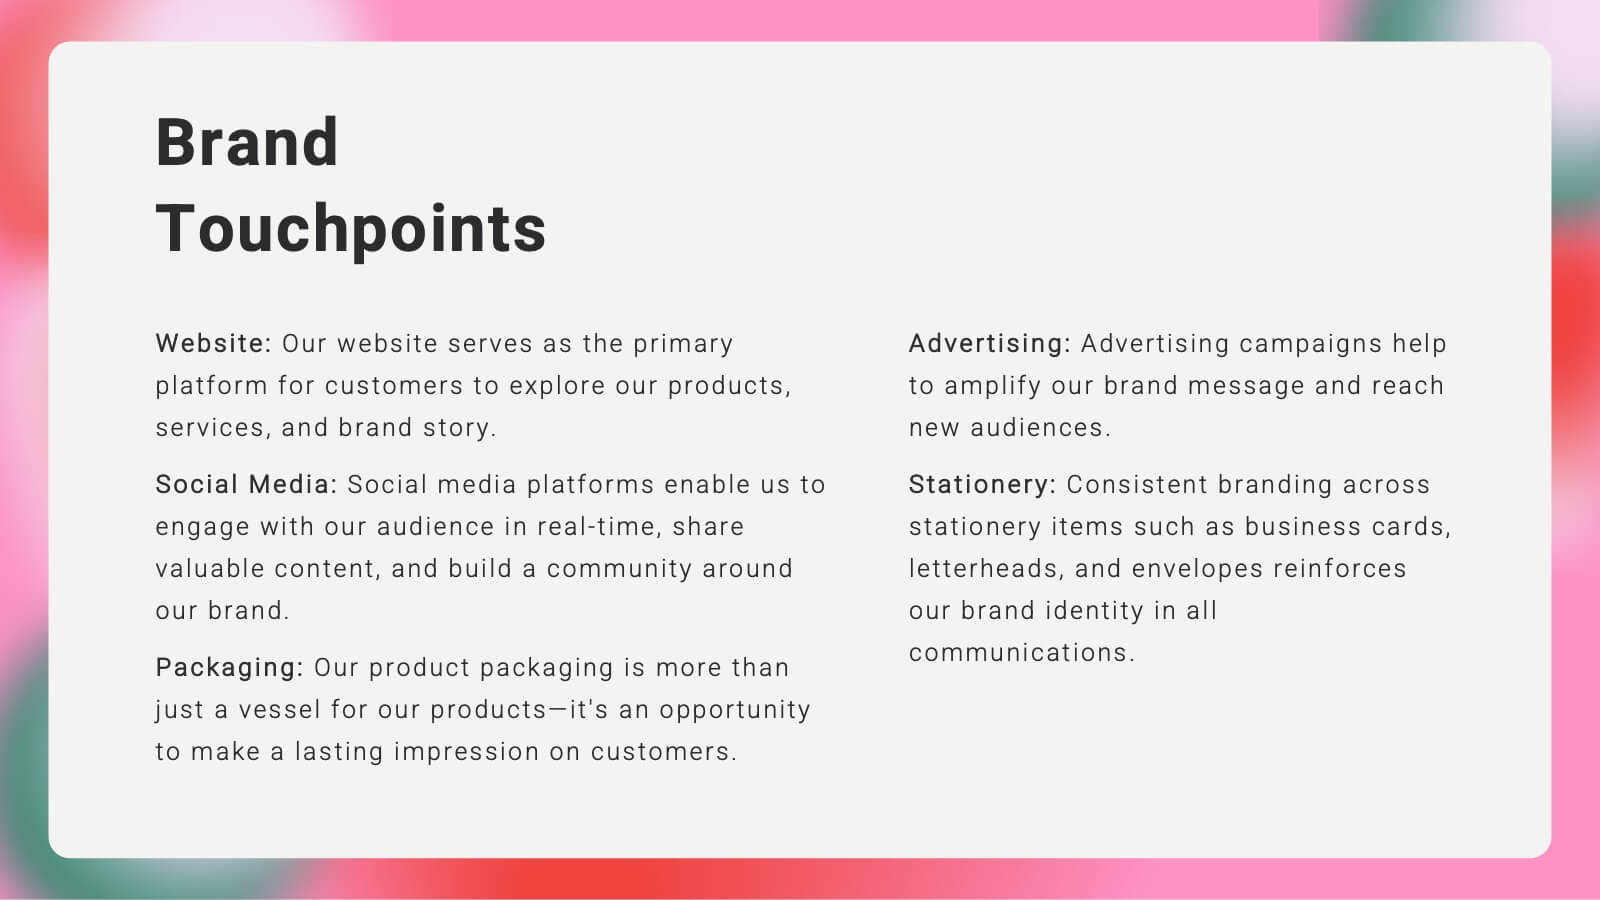
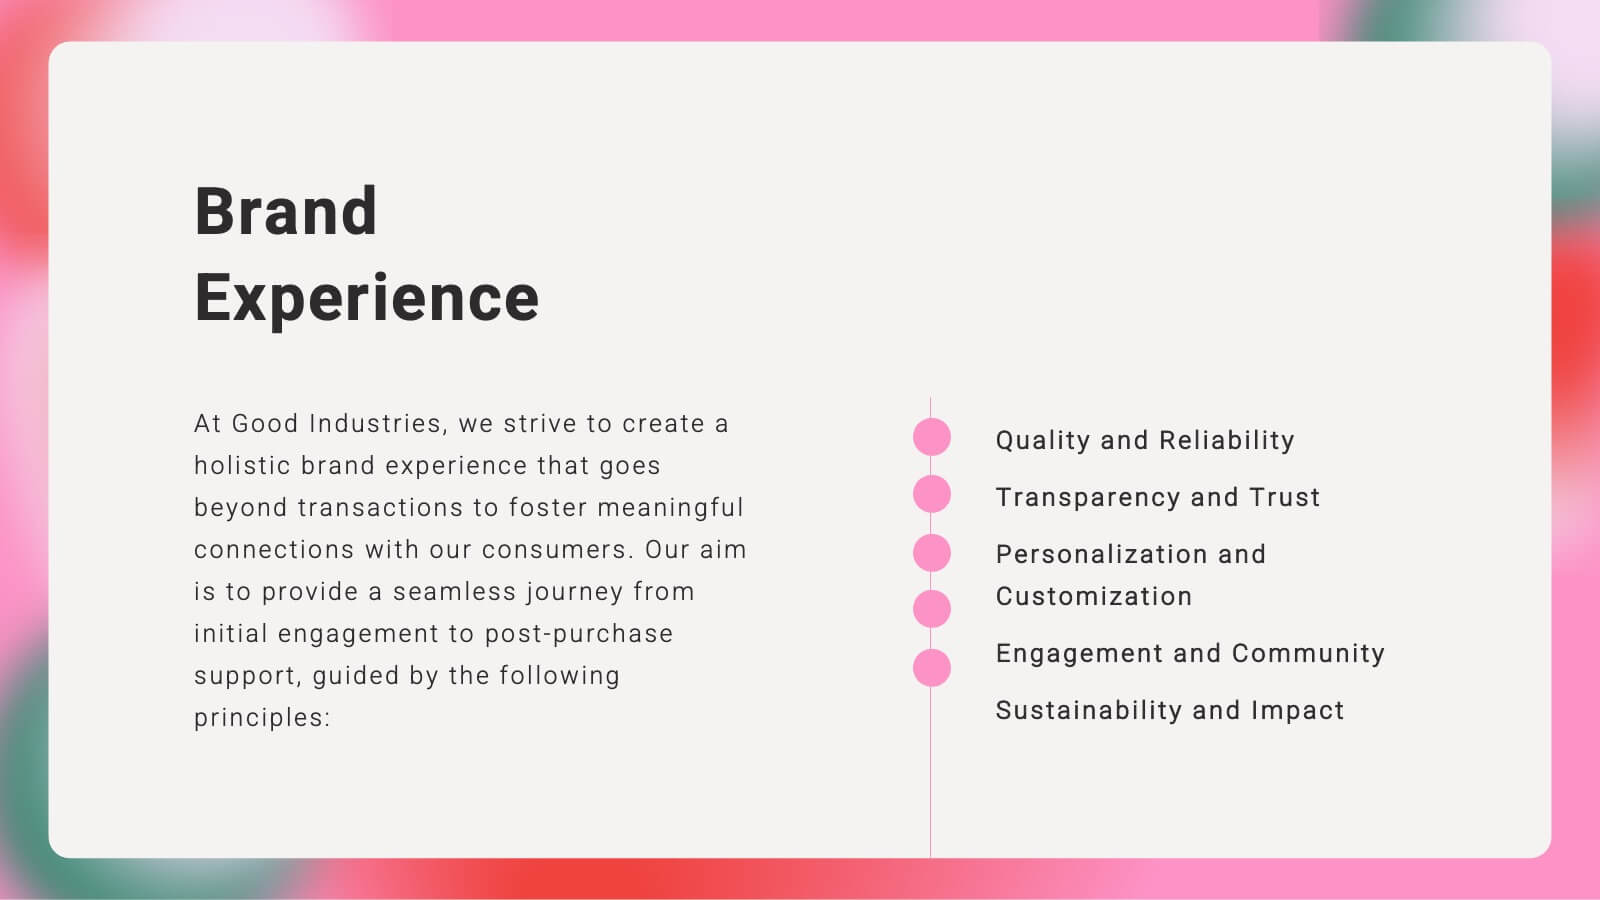
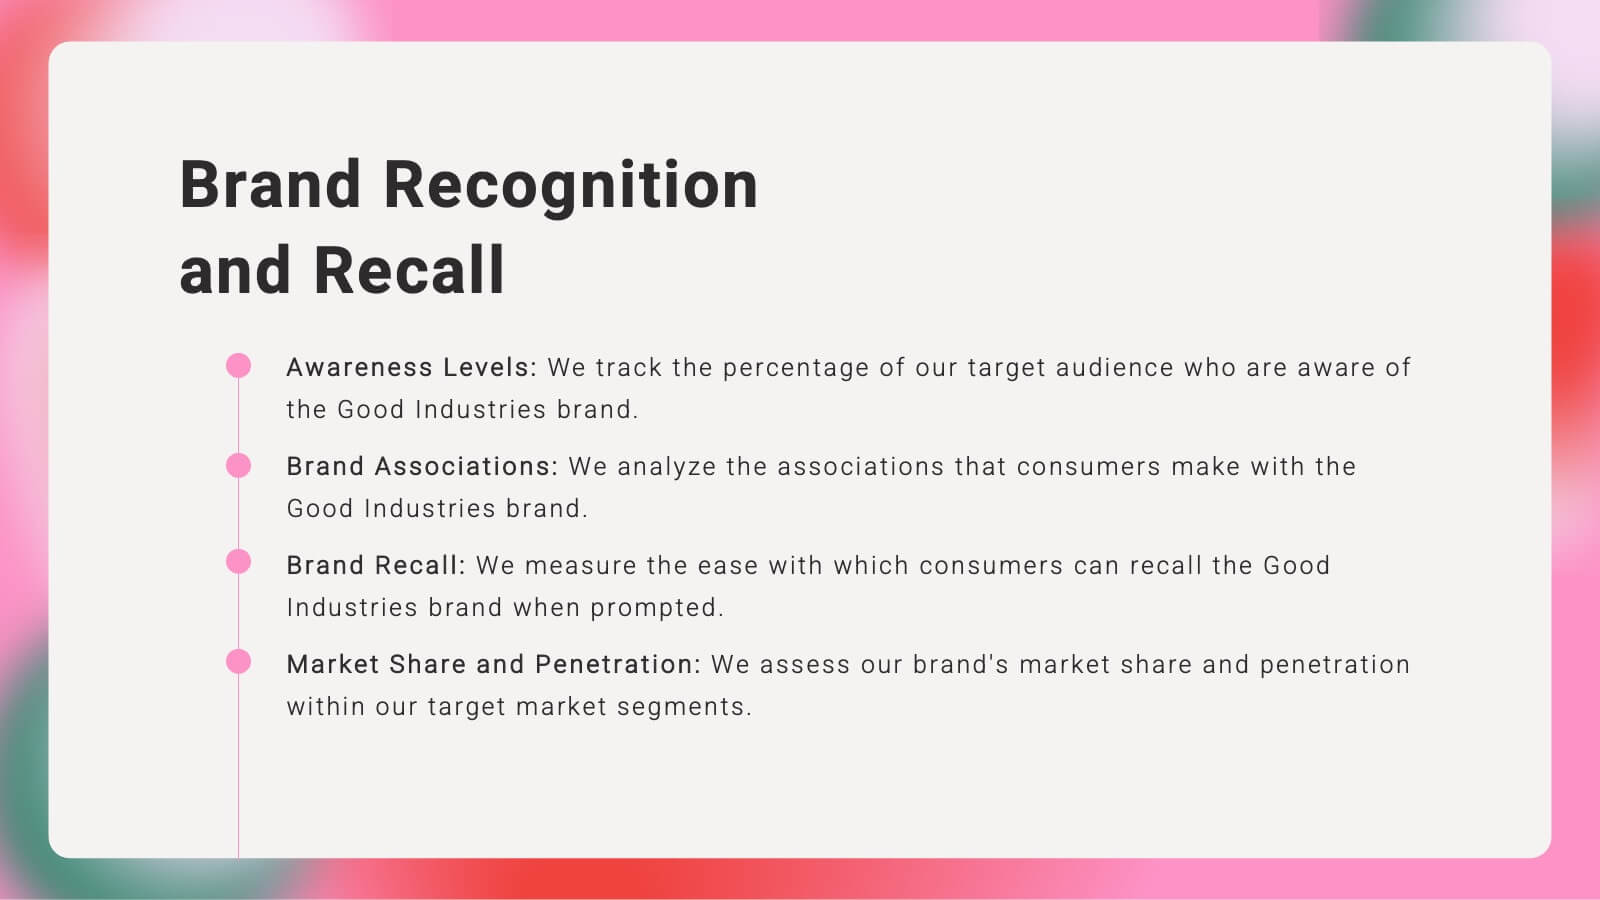
Craft a compelling narrative for your brand with this vibrant brand strategy presentation template. Designed to cover every facet of brand development, from vision and mission to market analysis and consumer personas, this template is an essential tool for businesses looking to establish a strong brand identity. It incorporates visually engaging slides that outline brand voice, values, and touchpoints, facilitating a thorough understanding of strategic branding. Compatible with platforms like PowerPoint, Google Slides, and Keynote, it is accessible across various devices, making it perfect for collaborative planning and presentations.


6 slides
Agriculture Jobs Infographic
Agriculture jobs encompass a wide range of career opportunities that involve the cultivation, production, processing, and distribution of crops, livestock, and other agricultural products. This infographic template showcases the diversity of jobs within the agriculture industry, highlighting the roles, required skills, and potential career growth. This infographic can be organized into different categories of agriculture jobs, such as Farming and Crop Production, Livestock Management, Agricultural Engineering, and Agricultural Research. This template is compatible with Powerpoint, Keynote, and Google Slides.


20 slides
Oracle Startup Strategy Presentation
Launch your startup strategy with this sleek template! Perfect for detailing your mission, vision, business model, and market analysis. Ideal for entrepreneurs aiming to impress investors and stakeholders. Compatible with PowerPoint, Keynote, and Google Slides, this template ensures your startup strategy is professional, clear, and compelling. Secure your path to success!


6 slides
PESTEL Management Infographic
PESTEL analysis is a framework used to assess and analyze the external macro-environmental factors that can impact an organization, industry, or market. This infographic template provides an overview of the PESTEL analysis framework and its application in strategic management. This template provides a clear and concise explanation of the PESTEL analysis framework, detailing each component of the acronym for you to use. It highlights the significance of considering these external factors when formulating business strategies and making informed decisions. Compatible with Powerpoint, Keynote, and Google Slides.