


Features
- 6 Unique slides
- Fully editable and easy to edit in Microsoft Powerpoint, Keynote and Google Slides
- 16:9 widescreen layout
- Clean and professional designs
- Export to JPG, PDF or send by email


Do you have any questions?
Recommend


26 slides
Coffee Shop Warm Company Profile Presentation
Coffee shops have become an important part of modern culture, especially in urban areas, and they come in various styles and themes. This presentation template is designed to bring the essence of your coffee haven to life. From the first sip to the last drop, let this presentation showcase the soul-warming experience your coffee shop provides. Fully customizable and compatible with Powerpoint, Keynote, and Google Slides. Utilize warm colors like browns, oranges, and yellows to evoke a cozy, comforting atmosphere. The template integrates coffee cup icons, latte art, and coffee bean graphics for a coffee-centric theme.


7 slides
Money Market Infographic
The money market is a sector of the financial market where short-term borrowing and lending occur, typically in the form of highly liquid and low-risk instruments. Navigate the financial landscape with our Money Market Infographic. This colorful and informative template is designed to help you understand the dynamics of the money market, empowering you to make sound financial decisions. Compatible with Powerpoint, Keynote, and Google Slides. This infographic demystifies the money market, offering valuable insights and knowledge to help you navigate the world of investments and financial growth.


7 slides
Team Work Infographic Presentation Template
Teamwork is a method of working collaboratively in order to achieve a goal. Members of a team can accomplish more than they could individually through their combined talents, knowledge and experience. This template can be used to help explain what teamwork is, what it looks like, why it’s important, and how you can cultivate it within your organization. This teamwork template is designed to encourage communication. Use this template to help evaluate what areas your team can improve on and how they can do so. Point out exactly how vital teamwork is to the success of your business.


7 slides
Health Program Infographic
Introducing the health program infographic, a visual guide that seamlessly blends informative content with simplicity, tailored to the needs of health professionals and organizations. This template is designed to elucidate the core elements and steps of any health program, ensuring viewers understand its intricacies and objectives with ease. Set against a pristine white canvas, the infographic employs various shades of calming blue. Intuitive icons punctuate each segment of the infographic, aiding in the comprehension of the health program's various components. Compatible with PowerPoint, Keynote, and Google Slides, ensures a clear and concise presentation.


7 slides
Innovation Infographics Presentation Template
Our innovation Infographic template is a trendy and professional way to present innovation to your audience in a way that keeps them engaged. This design features simple yet striking elements which will deliver your message, while the font and color scheme gives you that flexibility to personalize this template to your brand’s identity. We have designed this presentation template to help you create and deliver engaging content for your audience. It is a powerful tool that helps you build interest, generate leads and position yourself as an authority on the subject of innovation.


26 slides
Austin Presentation Template
Sports photography captures the essence of sports and its participants by conveying a strong image. The photographer needs to carefully plan the timing of taking these photos. The Austin Template is perfect for displaying information about your products and services. Vivid and bold colors draw your audience's attention, while the creative sections provide all the relevant details. With an appealing layout and stylish design, you can present yourself in the best light possible. This template will give your site the professional look it deserves, and be sure to stand out to your clients.


5 slides
4-Phase Product Lifecycle Diagram Presentation
Visualize your product’s evolution with the 4-Phase Product Lifecycle Diagram Presentation. Perfect for marketing, strategy, and product teams, this template maps out introduction, growth, maturity, and decline stages. Fully editable in PowerPoint, Keynote, and Google Slides—ideal for product managers, analysts, and educators presenting strategic roadmaps or lifecycle planning.
5 slides
Business Strategy Arrow Presentation
Enhance your strategic planning with the Business Strategy Arrow Presentation. This visually structured template guides your audience through a step-by-step progression, making it ideal for business roadmaps, strategic plans, and goal-oriented workflows. Easily customize the colors, text, and icons to align with your brand. Fully compatible with PowerPoint, Keynote, and Google Slides for effortless editing and professional presentations.


7 slides
Business Strategy Plan Infographic
A Business Strategy Infographic shows you how to create a business plan that will help you achieve your goals. This infographic is designed to help you understand how your company and competitors are going to win in the marketplace by showing how all of their moves fit together. This template is a beautiful combination of data visualization, charts, and graphics to help you see what's going on in your business. This is the perfect tool for anyone who wants to understand the current state of their operations and make informed decisions about how to move forward. Fully customizable and compatible with Powerpoint, Keynote, and Google Slides.


3 slides
Project Proposal Executive Summary
Summarize your project proposal with clarity and visual appeal using this clean executive slide. Highlight key metrics, growth indicators, and progress updates alongside a modern photo layout that keeps your audience engaged. This template is fully customizable and compatible with PowerPoint, Keynote, and Google Slides for easy, polished presentations.


5 slides
Purpose-Driven Mission and Values Presentation
Present your organization’s core purpose and guiding principles with this Purpose-Driven Mission and Values presentation. This clean, flag-style layout is perfect for showcasing five key pillars such as integrity, collaboration, or innovation. Easily customizable in Canva, PowerPoint, or Google Slides to align with your brand.


13 slides
Market Segmentation and Consumer Demographics Presentation
Visualize your audience breakdown with this clean, data-driven demographic infographic slide. Featuring customizable male and female icons, percentage metrics, and bar charts for segment analysis, this layout is perfect for showcasing consumer insights, behavior patterns, and target group comparisons. Ideal for marketing reports, business plans, and audience research decks. Fully editable in PowerPoint, Keynote, and Google Slides.


4 slides
Comparison Table Slide Presentation
Quickly highlight the differences between options with the Comparison Table Slide Presentation. This layout features a clean, structured table with checkmarks and Xs to visually compare features, services, or product tiers. Ideal for pricing plans, feature breakdowns, or side-by-side evaluations. Each column is color-coded for clarity and impact. Fully customizable in PowerPoint, Keynote, and Google Slides.


24 slides
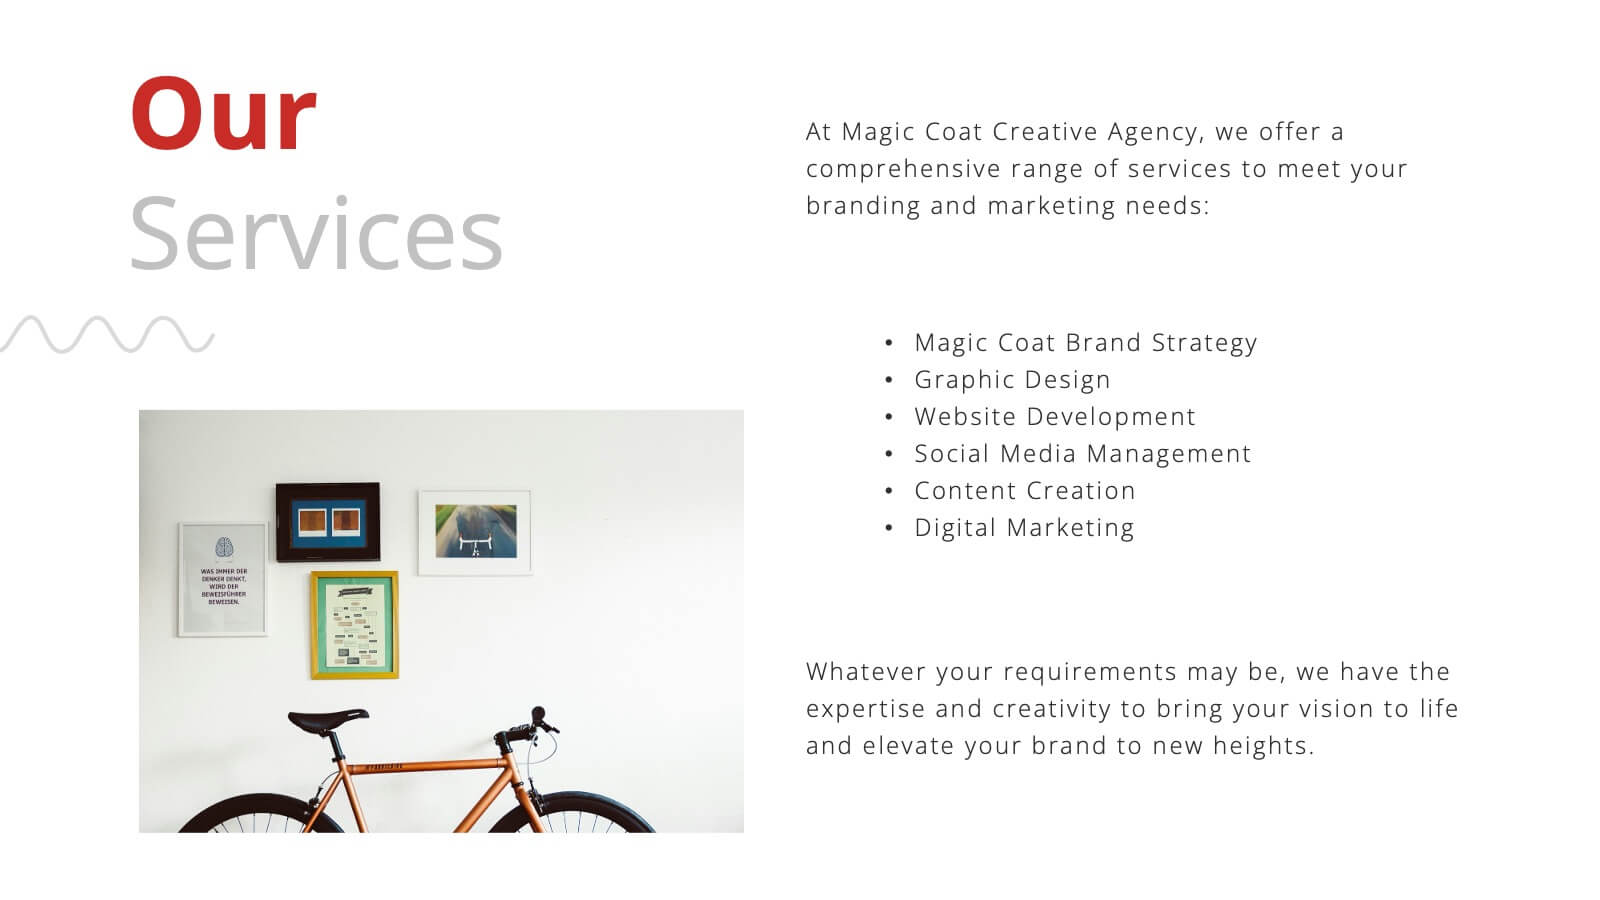
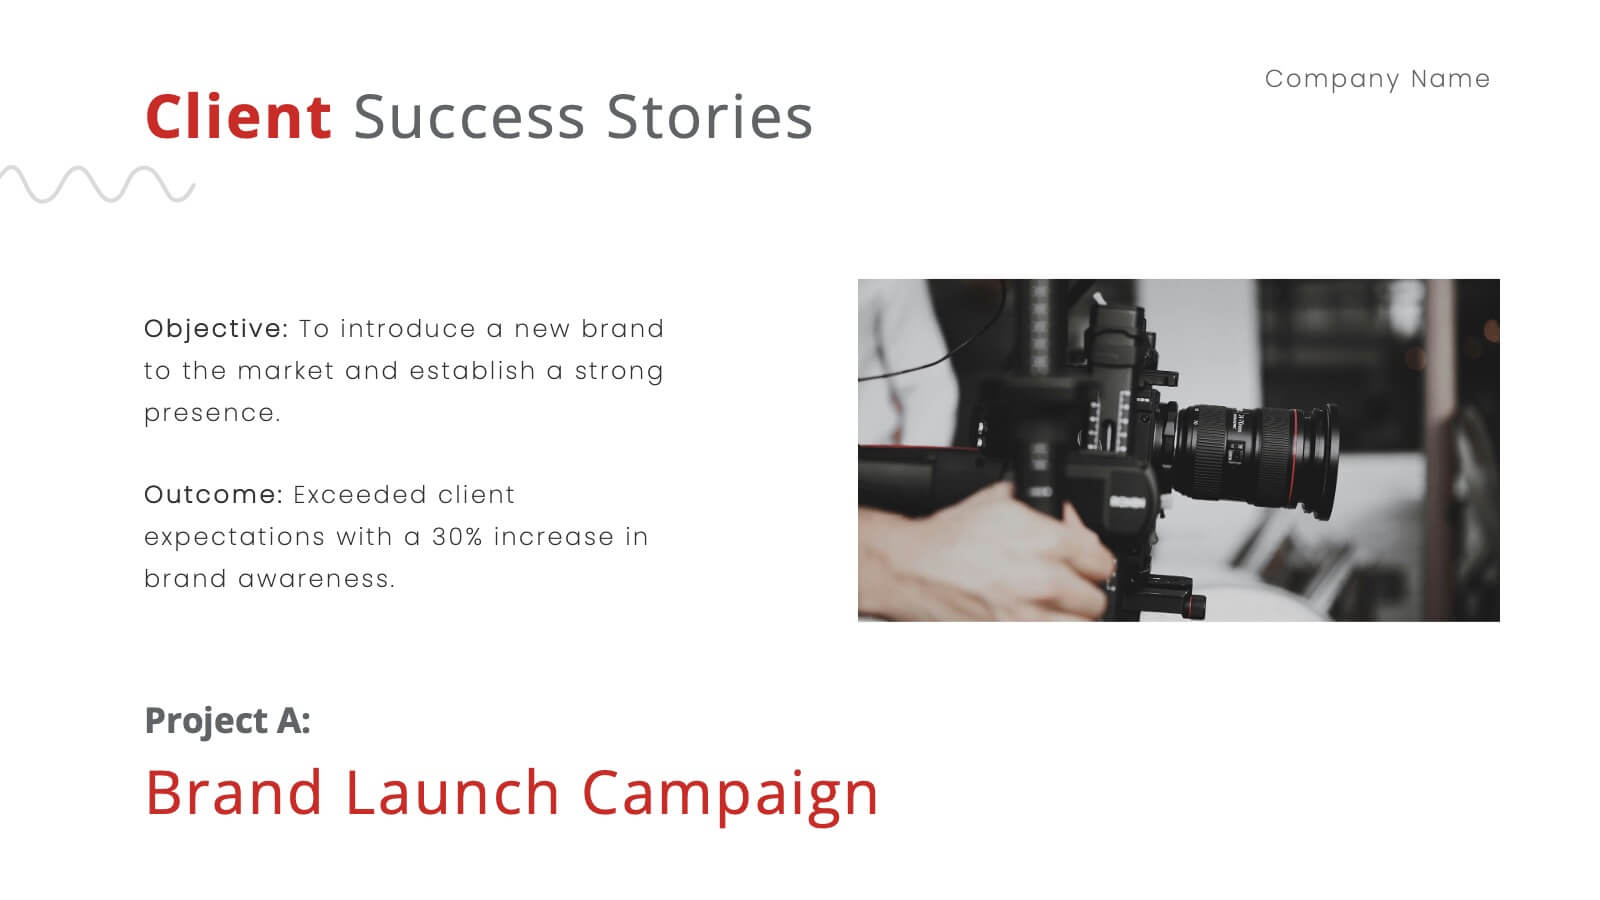
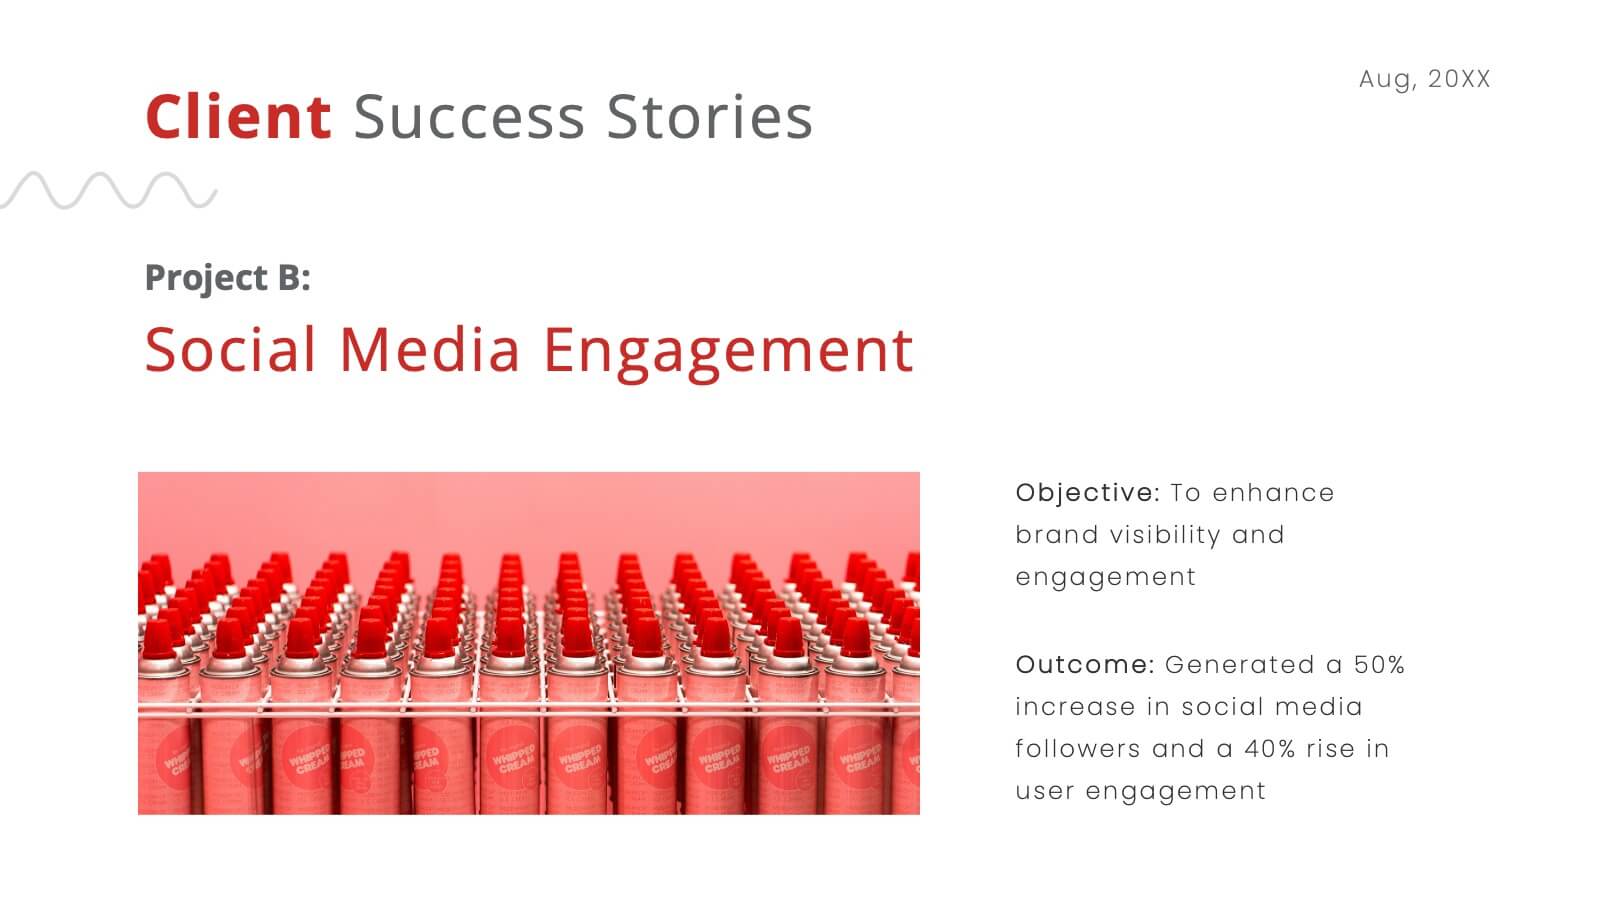
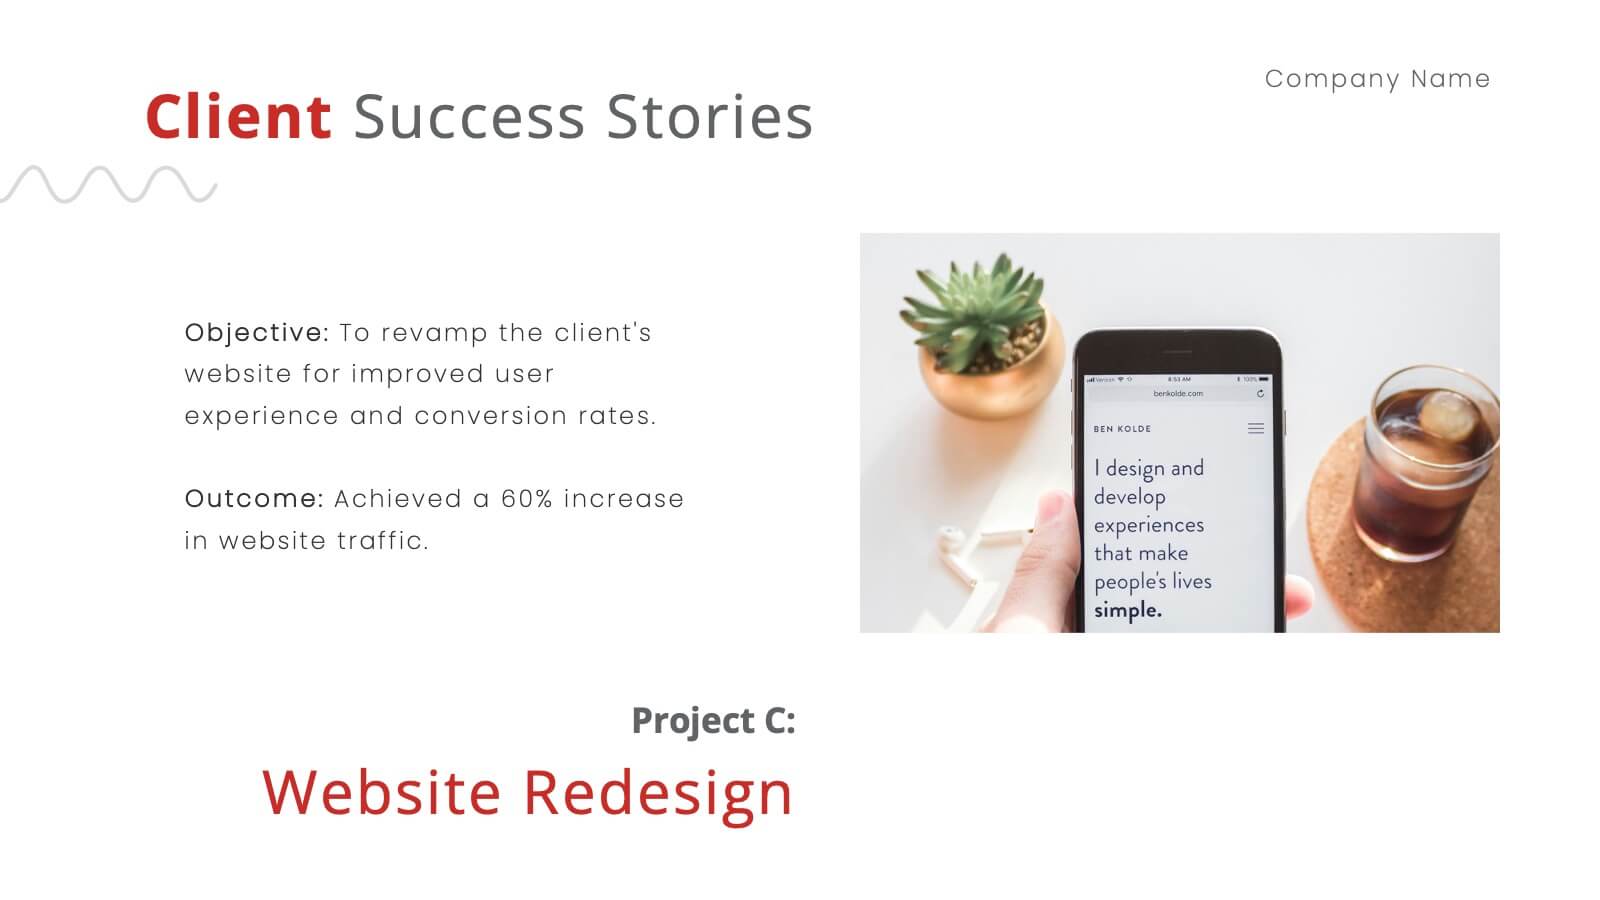
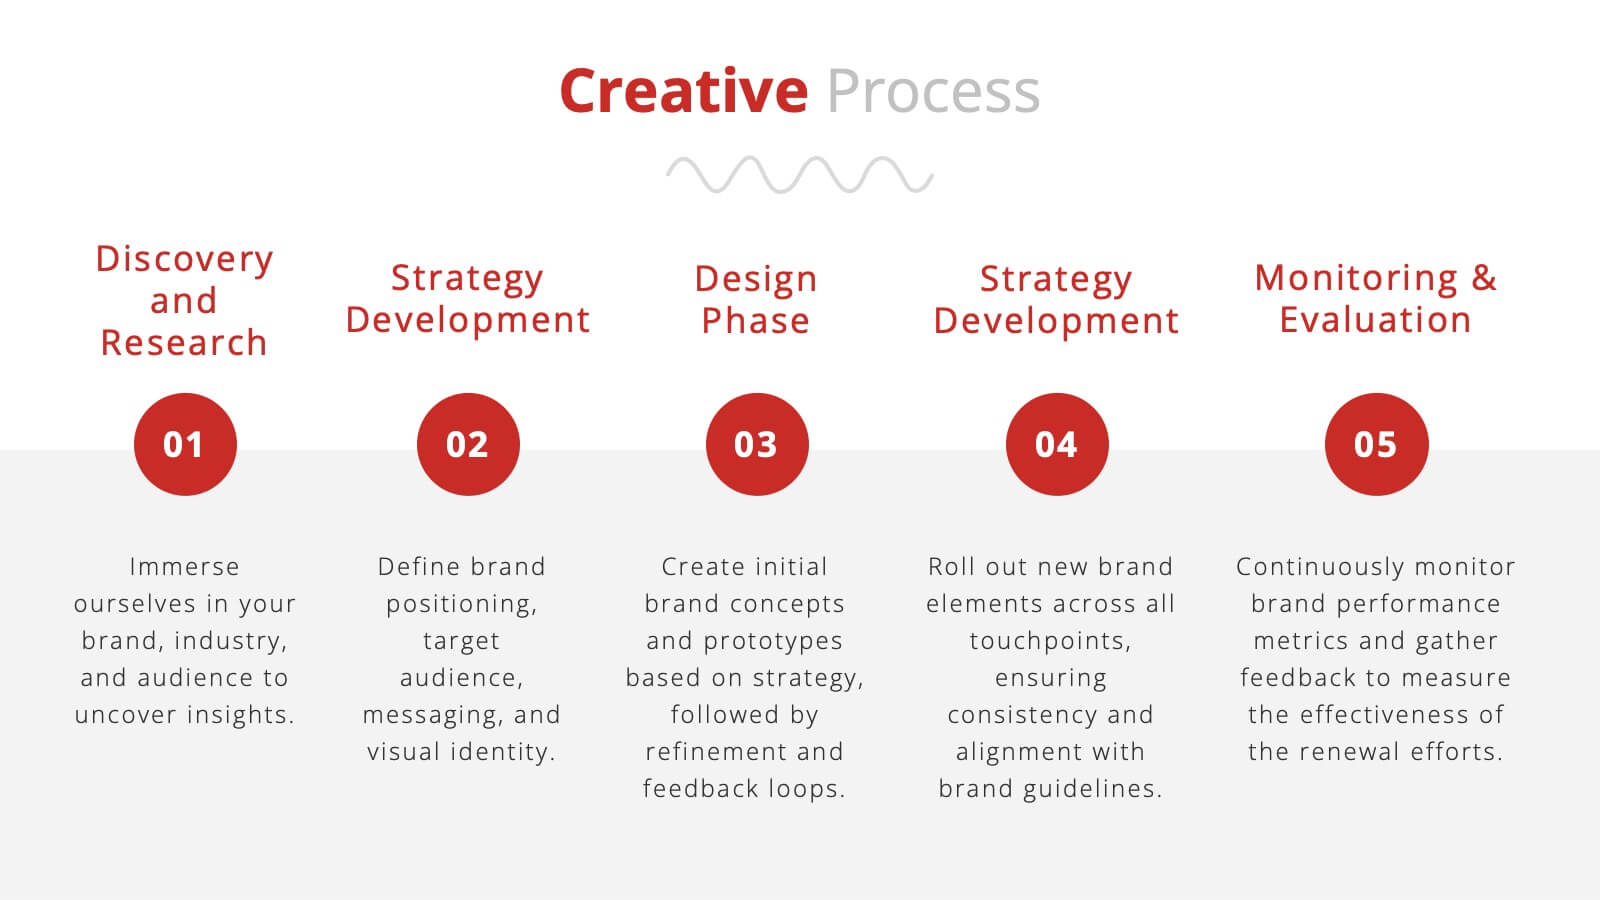
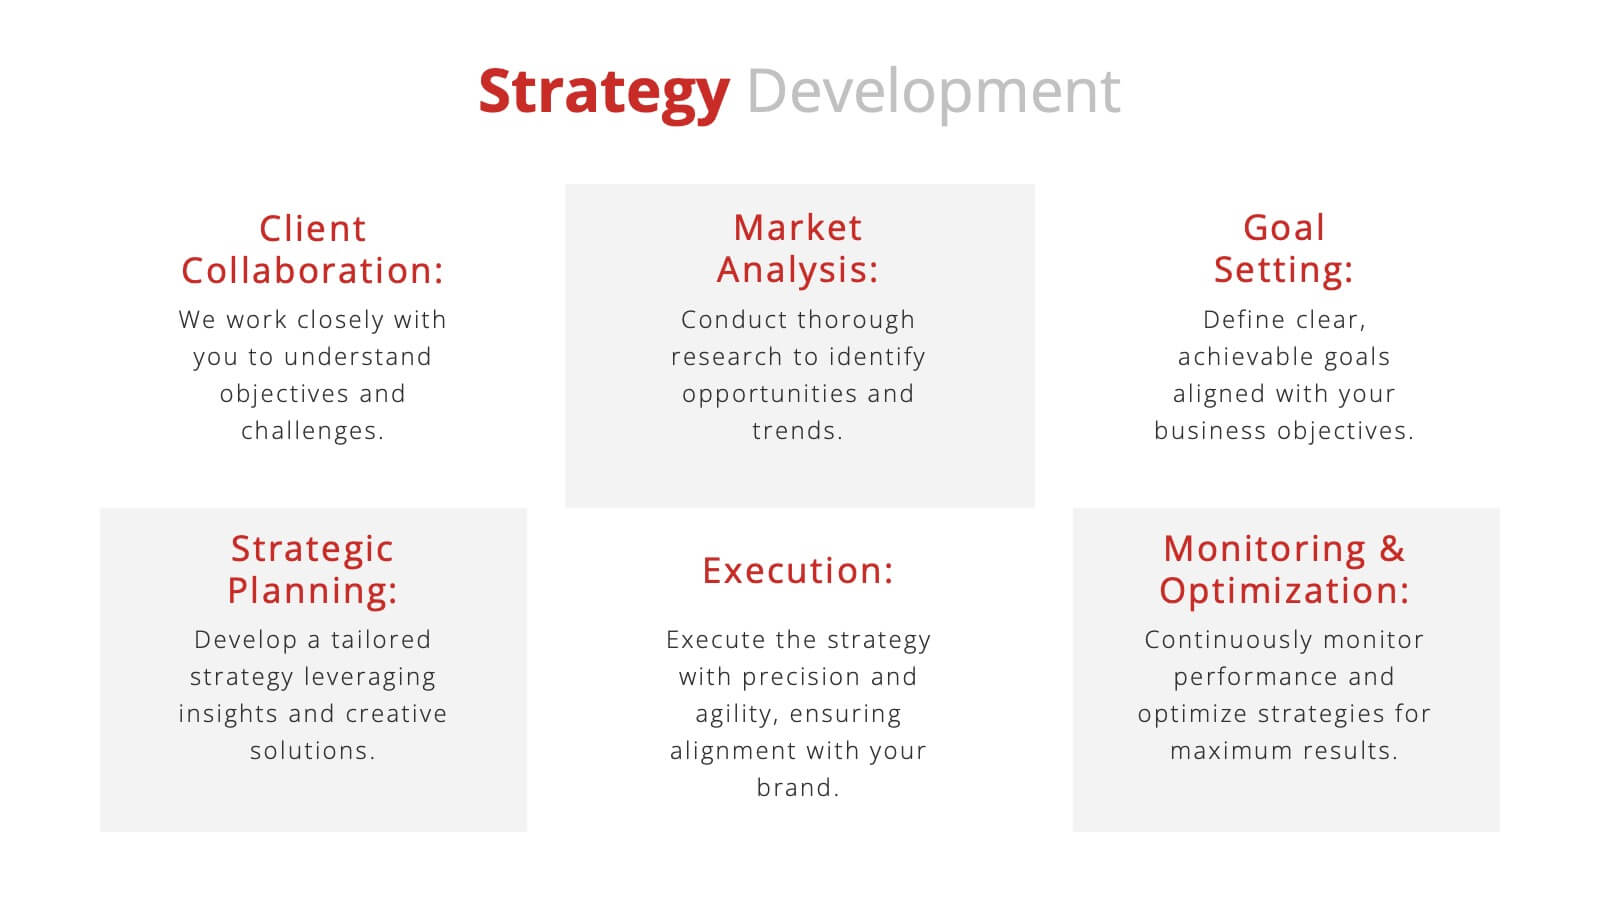
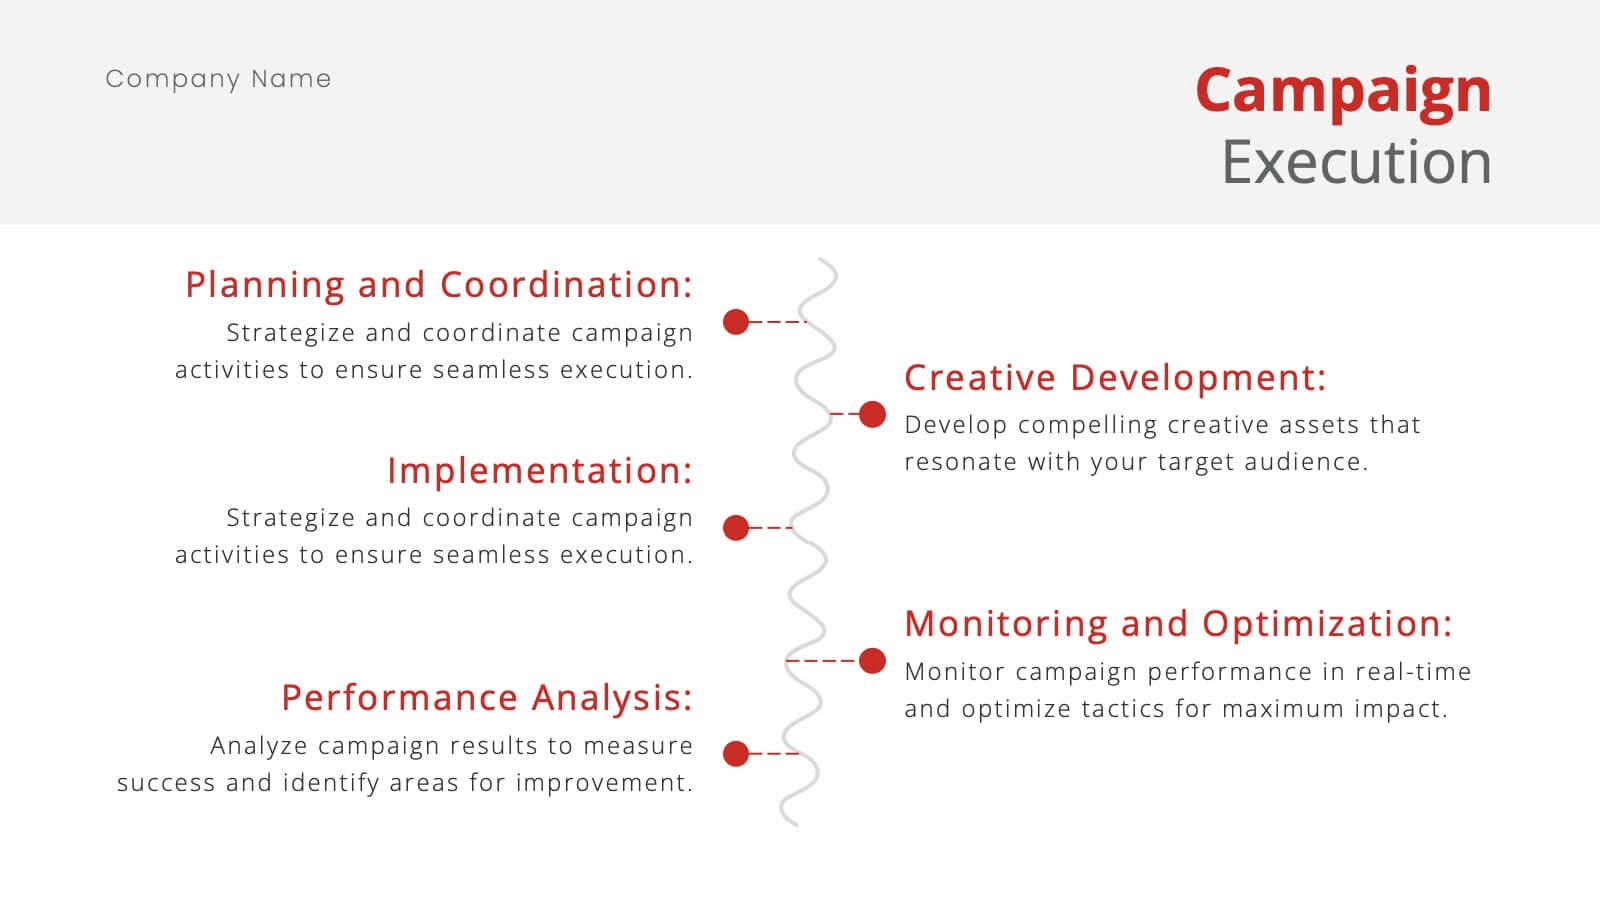
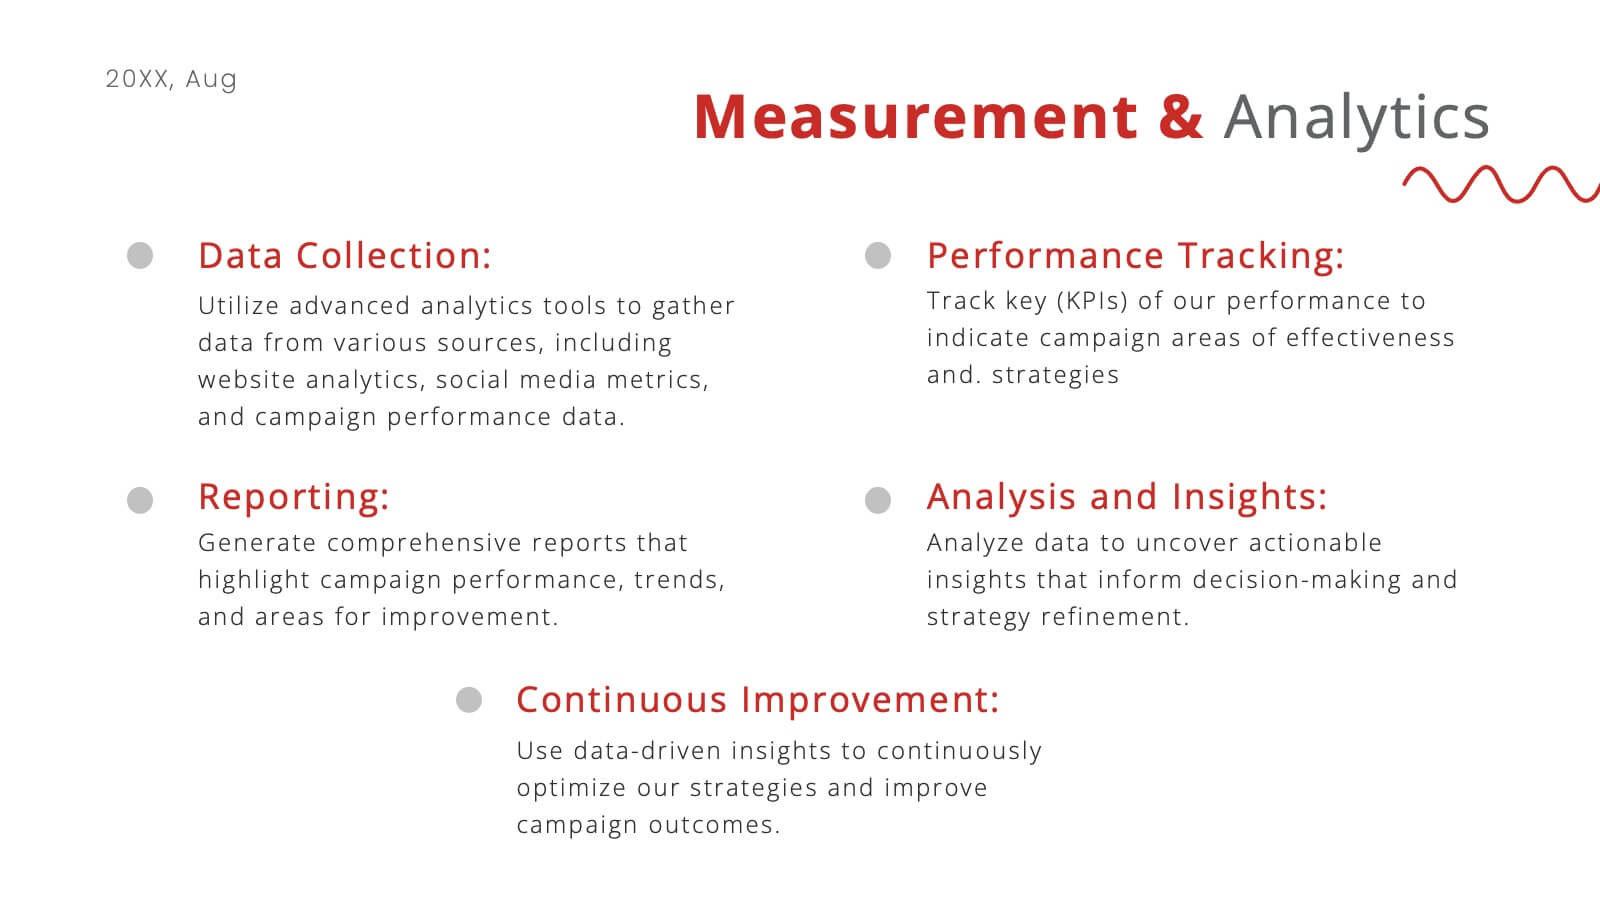
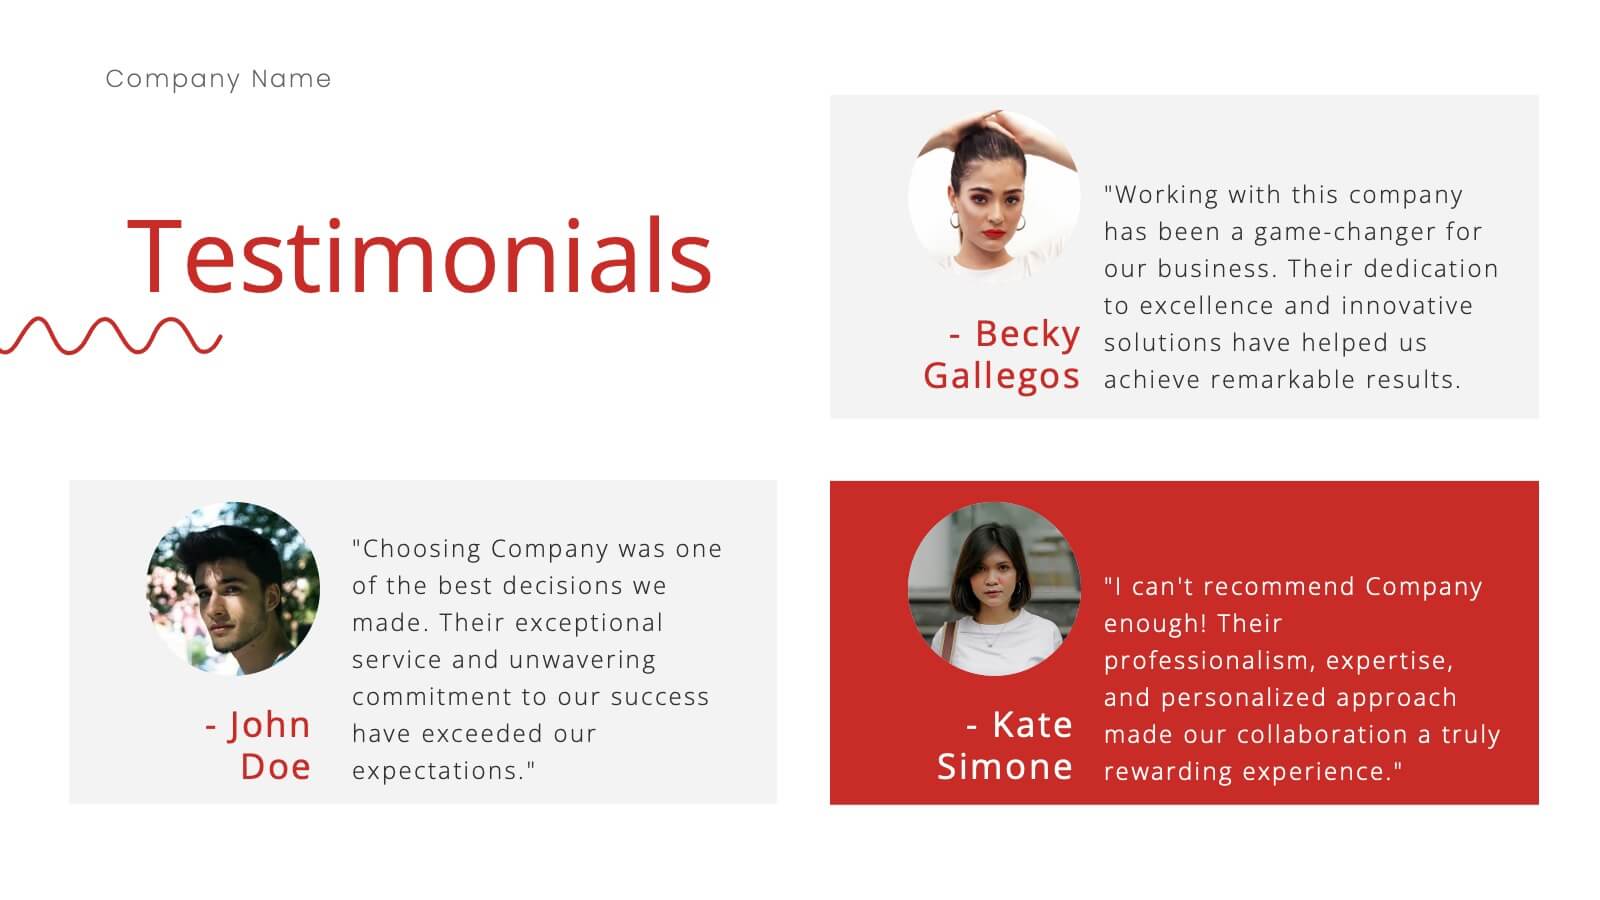
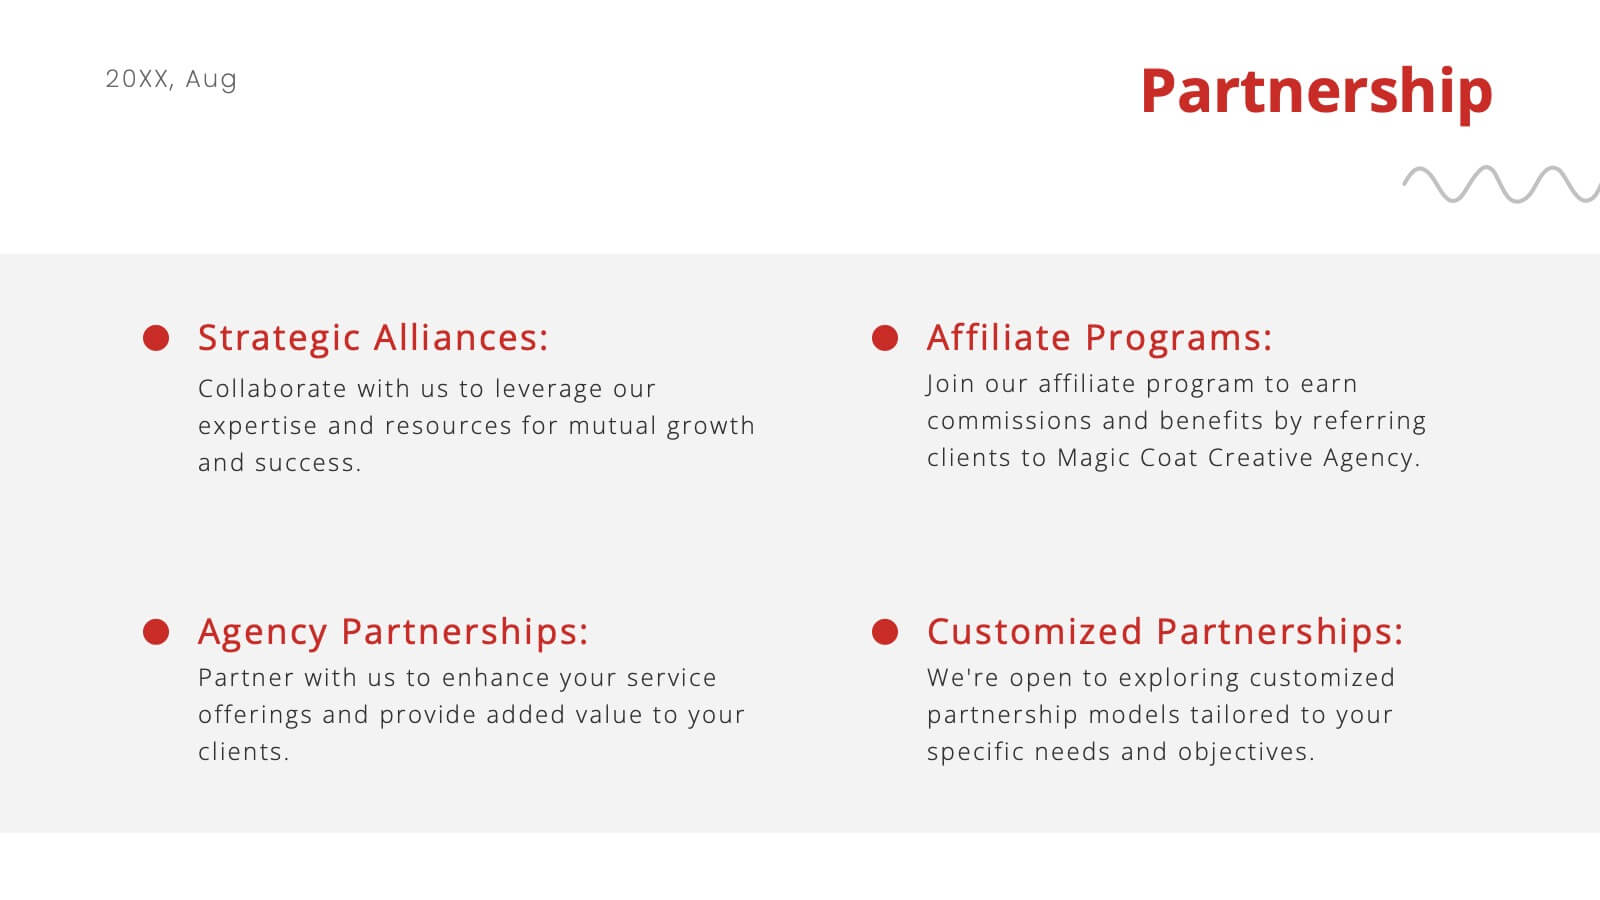
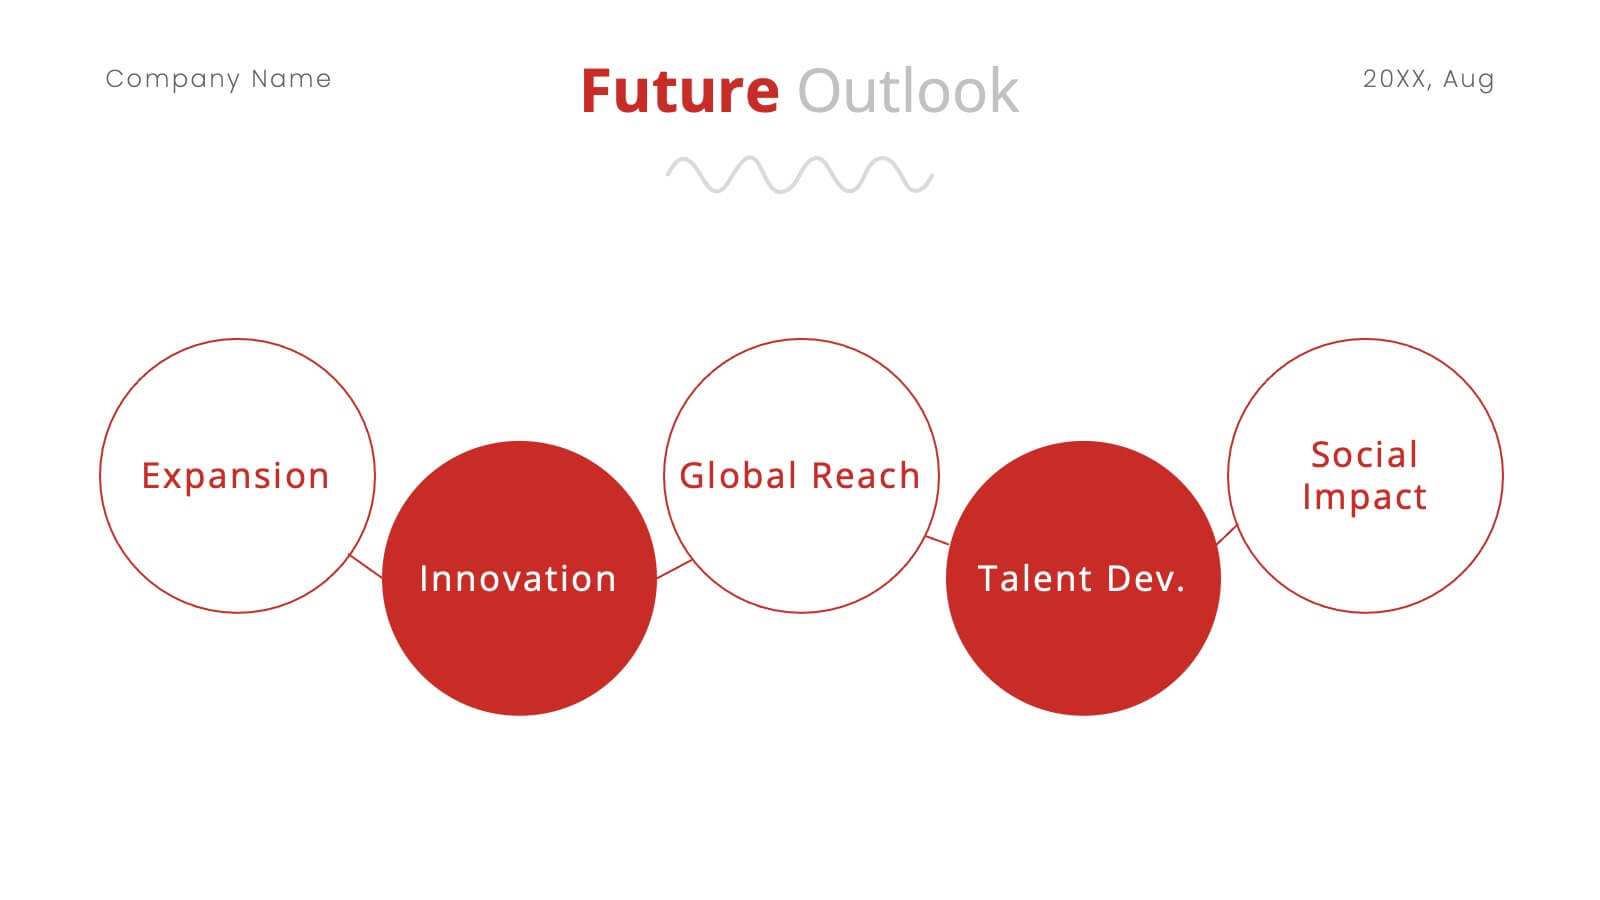
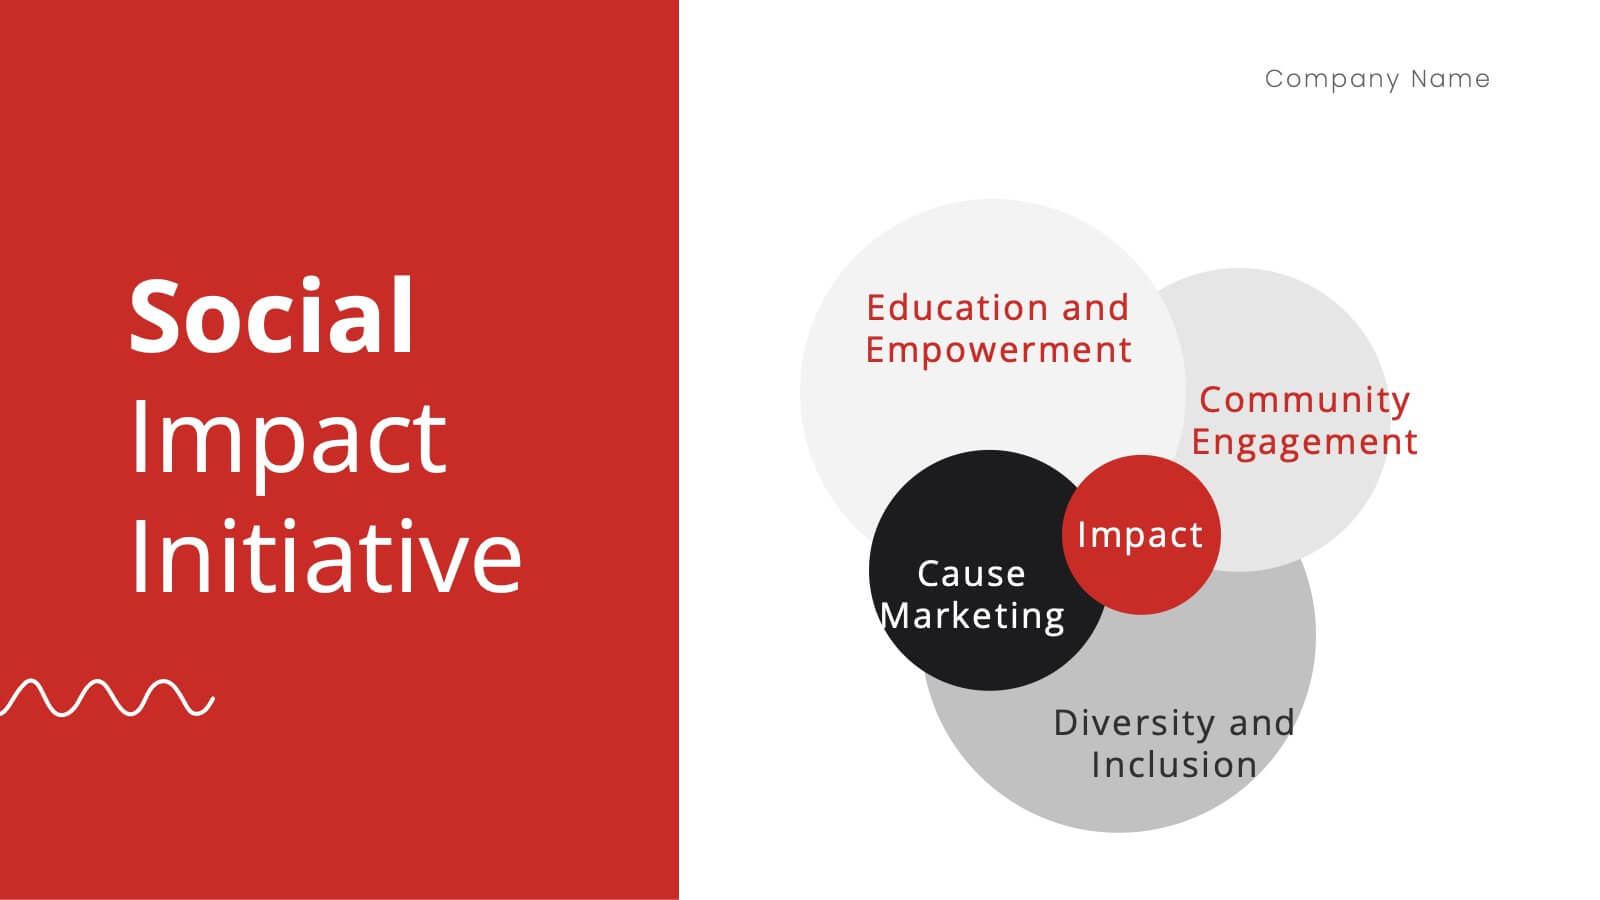
Nickel Advertising Agency Proposal Presentation
Take your advertising agency to the next level with this sleek and modern presentation template! Highlighting your services, team, success stories, and marketing strategies, it’s the perfect tool to showcase your agency’s strengths and capabilities. Fully customizable and compatible with PowerPoint, Keynote, and Google Slides, this template is ideal for impressing potential clients and partners.


5 slides
Online Digital Marketing Infographics
Online Digital Marketing refers to the promotion of products, services, or brands using digital channels and technologies. These infographic templates aims to educate and inspire the audience about the world of digital marketing and equip them with valuable insights and strategies to enhance their online presence. This is a valuable tool for presenting the intricacies of digital marketing in a clear and engaging manner. The templates provide slides that focus on analytics and measurement, emphasizing the importance of tracking and evaluating digital marketing efforts. You can customize the templates with your own branding to create a professional look.


5 slides
North America Business Landscape Map Presentation
Explore the business terrain with the "North America Business Landscape Map" template, which delivers a comprehensive visualization of business data across various regions. Designed for strategic presentations, it enables clear communication of market insights and data points, crucial for decision-making. This template is compatible with PowerPoint, Keynote, and Google Slides, enhancing its utility for professionals in diverse fields.


4 slides
Project Task Ownership with RACI Chart Presentation
Assign roles clearly with the Project Task Ownership with RACI Chart Presentation. This template simplifies responsibility mapping across tasks using the RACI framework (Responsible, Accountable, Consulted, Informed). With a clean matrix layout, it's perfect for project planning, stakeholder alignment, and workflow transparency. Fully editable in PowerPoint, Canva, and Google Slides.