


Features
- 6 Unique slides
- Fully editable and easy to edit in Microsoft Powerpoint, Keynote and Google Slides
- 16:9 widescreen layout
- Clean and professional designs
- Export to JPG, PDF or send by email


Do you have any questions?
Recommend


20 slides
Astralisque Sales Proposal Presentation
This Sales Proposal Presentation is designed to help businesses outline their sales strategies with a bold and dynamic style. Covering key elements such as competitive analysis, objectives, pricing strategy, and sales performance metrics, it ensures a professional look. Fully customizable and compatible with PowerPoint, Keynote, and Google Slides.


19 slides
Zenith Sales Proposal Presentation
Get ready to blow your clients away with this electrifying sales proposal template! Packed with sections on project scope, bold objectives, timelines, and jaw-dropping pricing, it’s designed to make a powerful impact. The sleek, cutting-edge design ensures you’ll leave a lasting impression. Fully compatible with PowerPoint, Keynote, and Google Slides!


7 slides
Matrix System Diagram Infographic
A matrix diagram is a visual representation of data in a matrix format, commonly used to analyze the relationships between two or more sets of items. This infographic template is a valuable tool in various fields including business, project management, quality management, and decision-making processes. Compatible with Powerpoint, Keynote, and Google Slides. This is designed to help you present intricate relationships, structures, and data in a clear and visually engaging way. Whether you're illustrating business strategies, decision matrices, or organizational hierarchies, this template simplifies complexity.


8 slides
Target Demographic Insights
Get a clear view of your audience with the Target Demographic Insights Presentation. This template uses a visual bullseye layout to highlight key demographic data through concentric circles and percentages. Ideal for marketers, brand strategists, or analysts, it helps you communicate audience segmentation and market reach effectively. Fully editable in PowerPoint, Keynote, and Google Slides.


23 slides
Rainshadow Digital Strategy Presentation
This Digital Strategy Presentation Template is designed to provide a structured approach to planning and implementing digital initiatives. Covering essential elements such as market trends, competitive analysis, value proposition, and risk management, it offers a professional framework to align goals with actionable steps. Fully customizable and compatible with PowerPoint, Keynote, and Google Slides.


7 slides
TAM SAM SOM Model Infographic
Strategically target market opportunities with our TAM SAM SOM Model Infographic, a crucial tool for entrepreneurs, marketers, and business strategists. This infographic simplifies the understanding of market sizing and potential for new products or services. Our infographic visually breaks down the Total Addressable Market (TAM), Serviceable Available Market (SAM), and Serviceable Obtainable Market (SOM), helping you to quantify the market demand and focus your business strategies effectively. With this tool, you can illustrate the layers of market segmentation, from the broadest perspective to the target segment you aim to capture. This SEO-friendly infographic is designed to guide teams in prioritizing product development, marketing efforts, and sales strategies. Utilize our TAM SAM SOM Model Infographic in your business plans and investor presentations to convey a clear market analysis and establish a strong foundation for your go-to-market strategy.


8 slides
Australia and Pacific Map Presentation
Bring your regional data to life with a crisp, modern layout that highlights key insights across Australia and the Pacific islands. Perfect for displaying geographic trends, business reach, or market segmentation, this map design keeps your message clear and engaging. Fully compatible with PowerPoint, Keynote, and Google Slides.


6 slides
Professional Business Plan Presentation
Make every idea count with a clean, professional presentation that helps you communicate your business strategy clearly and confidently. Ideal for showcasing goals, market insights, and performance plans, it delivers structure with style. Fully compatible with PowerPoint, Keynote, and Google Slides for easy customization and seamless presentation design.


5 slides
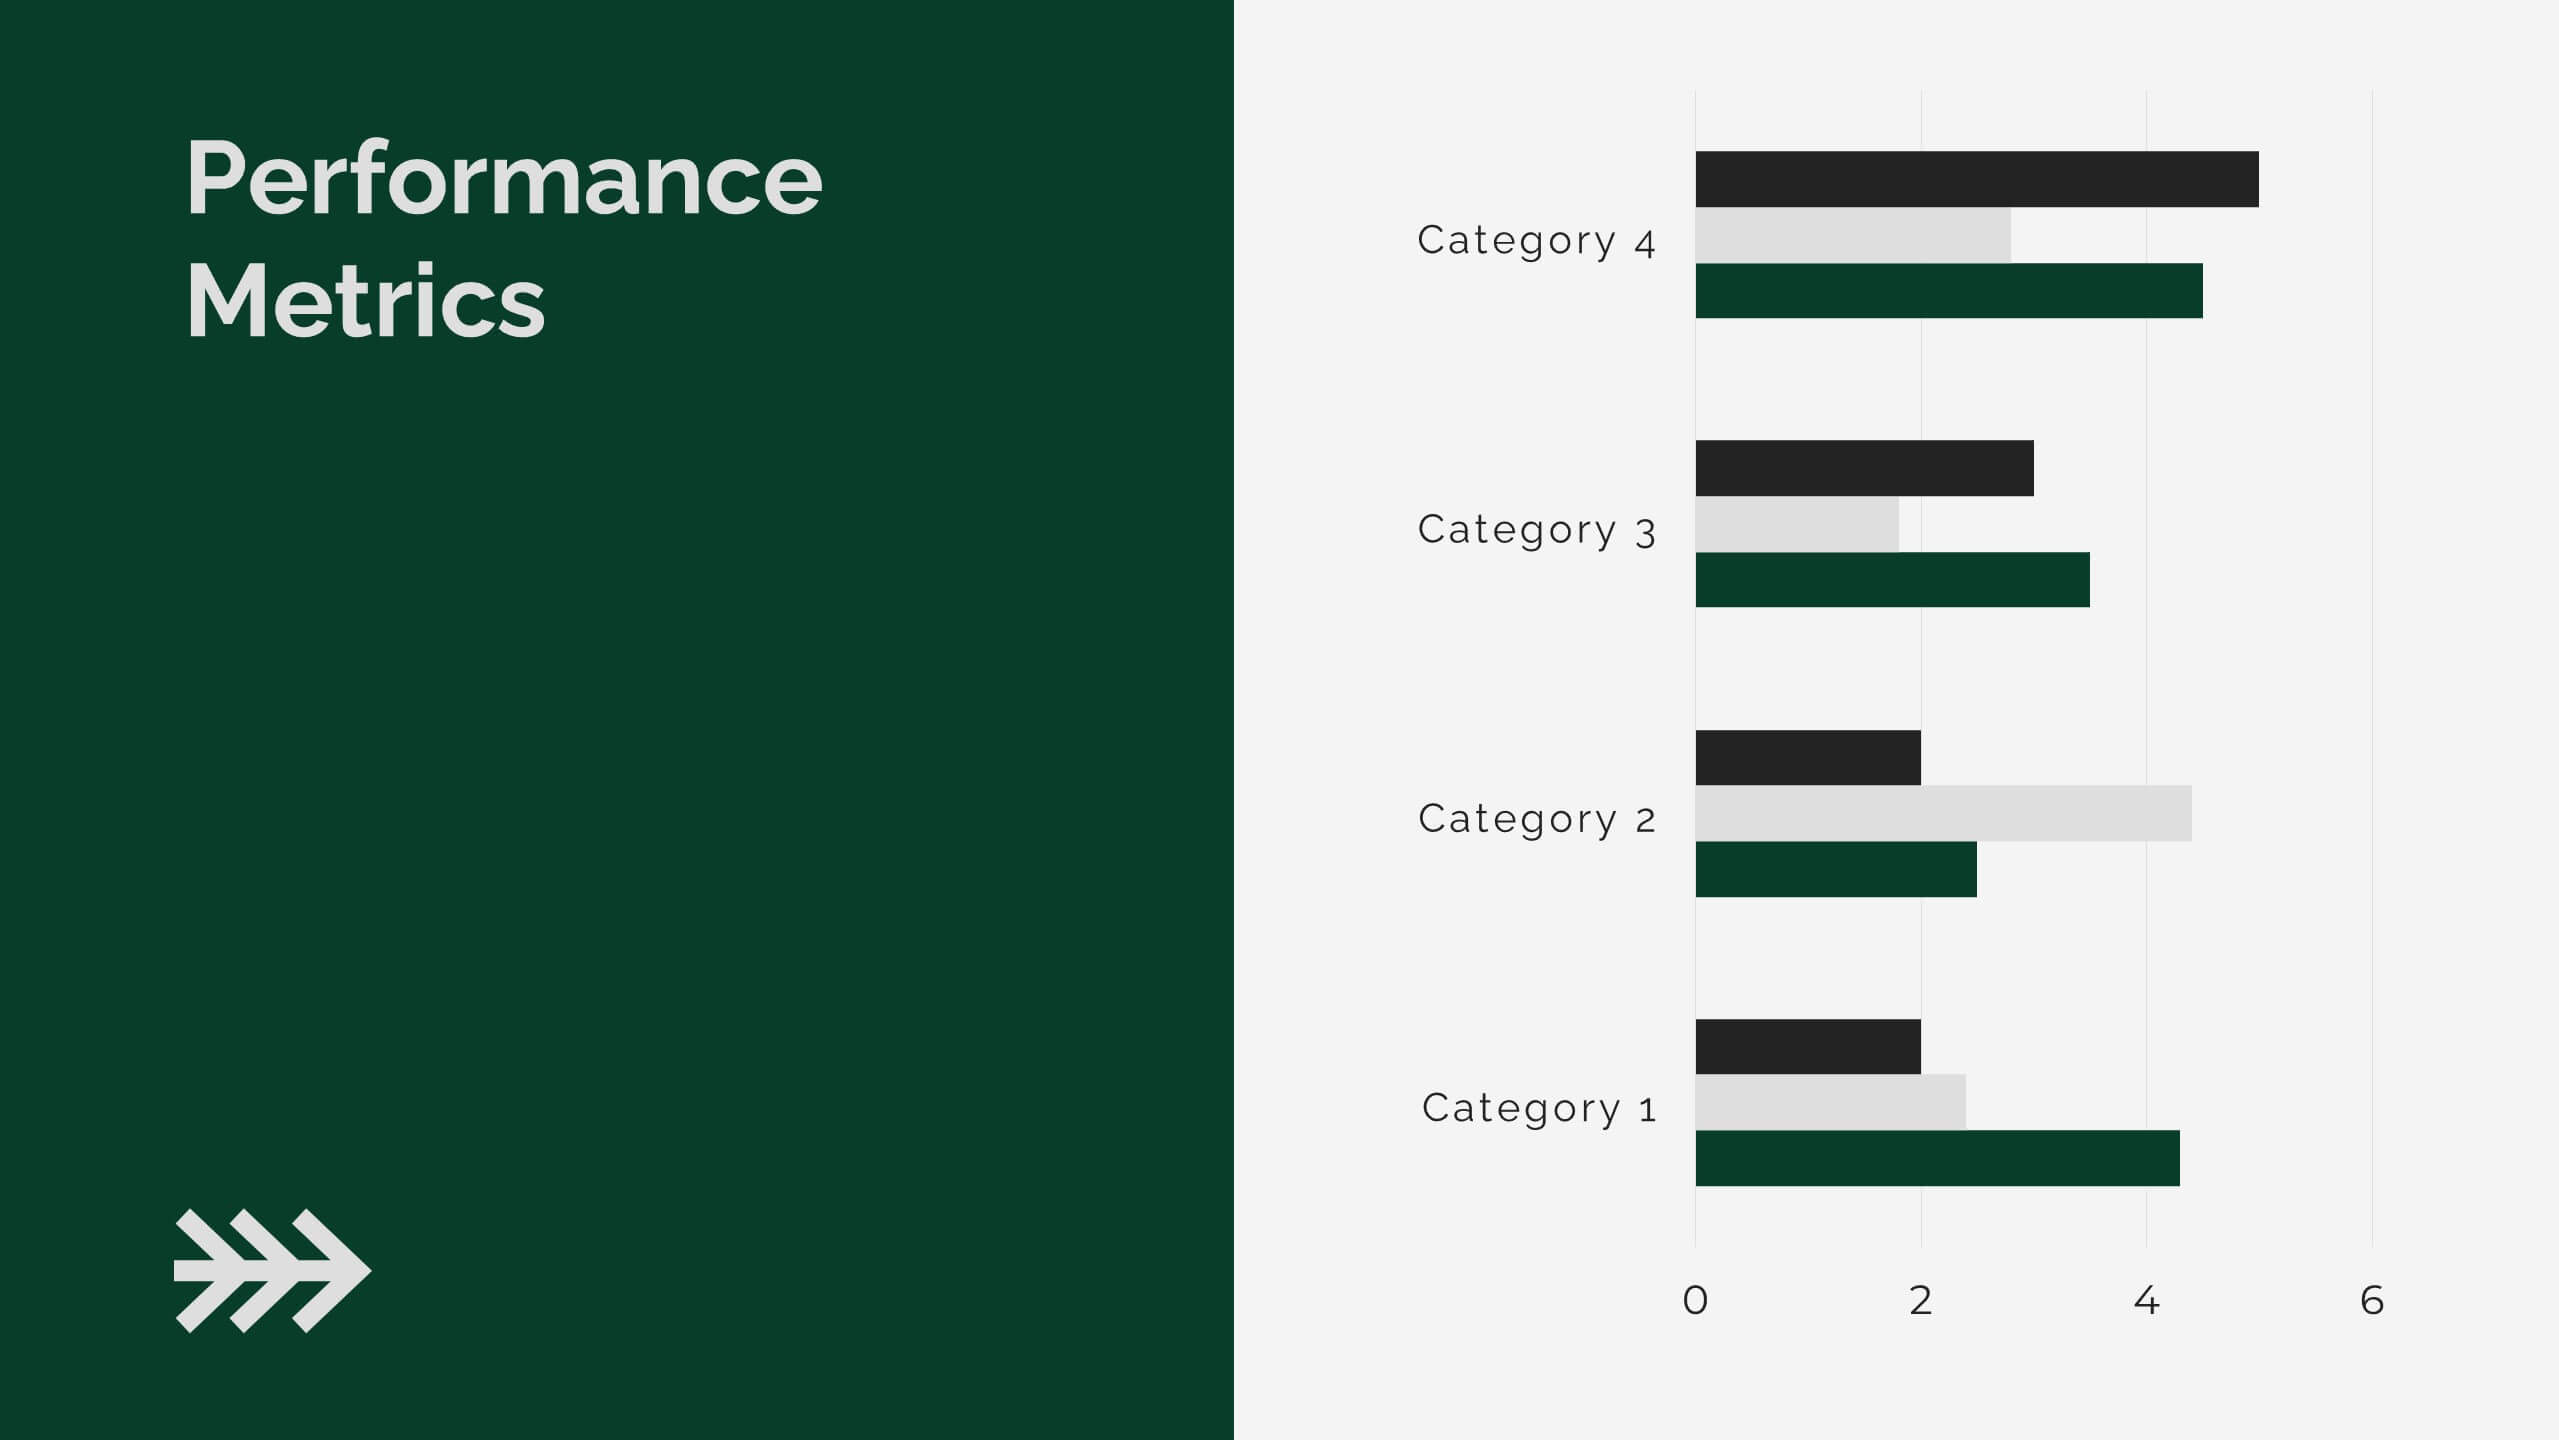
Performance Metrics and KPI Review Presentation
Visualize performance at a glance with the Performance Metrics and KPI Review presentation template. Featuring sleek gauge charts in various color schemes, this layout makes it easy to display progress, thresholds, and KPIs across categories. Customize each dial and label to reflect your own business metrics. Compatible with PowerPoint, Keynote, and Google Slides.


5 slides
Meeting Minutes and Notes Presentation
Keep every discussion organized and every detail accounted for with this clean and structured layout. Perfect for summarizing key decisions, attendees, and next steps, it helps teams capture essential meeting insights efficiently. This easy-to-edit template works flawlessly with PowerPoint, Keynote, and Google Slides for a polished professional presentation.


7 slides
Executive Summary Business Infographic
Elevate your executive insights with our meticulously crafted executive summary infographic. Drenched in the professionalism of blue tones and accented by the prestige of gold, our template encapsulates key findings and top-tier decisions in a comprehensive yet concise manner. Enriched with pinpoint infographics, emblematic icons, and relevant image placeholders, it conveys essential details with precision. Perfectly honed for Powerpoint, Keynote, or Google Slides. An indispensable resource for business leaders, managers, and analysts seeking to distill complex information into actionable insights. Present with authority; let every slide underscore pivotal decisions.


21 slides
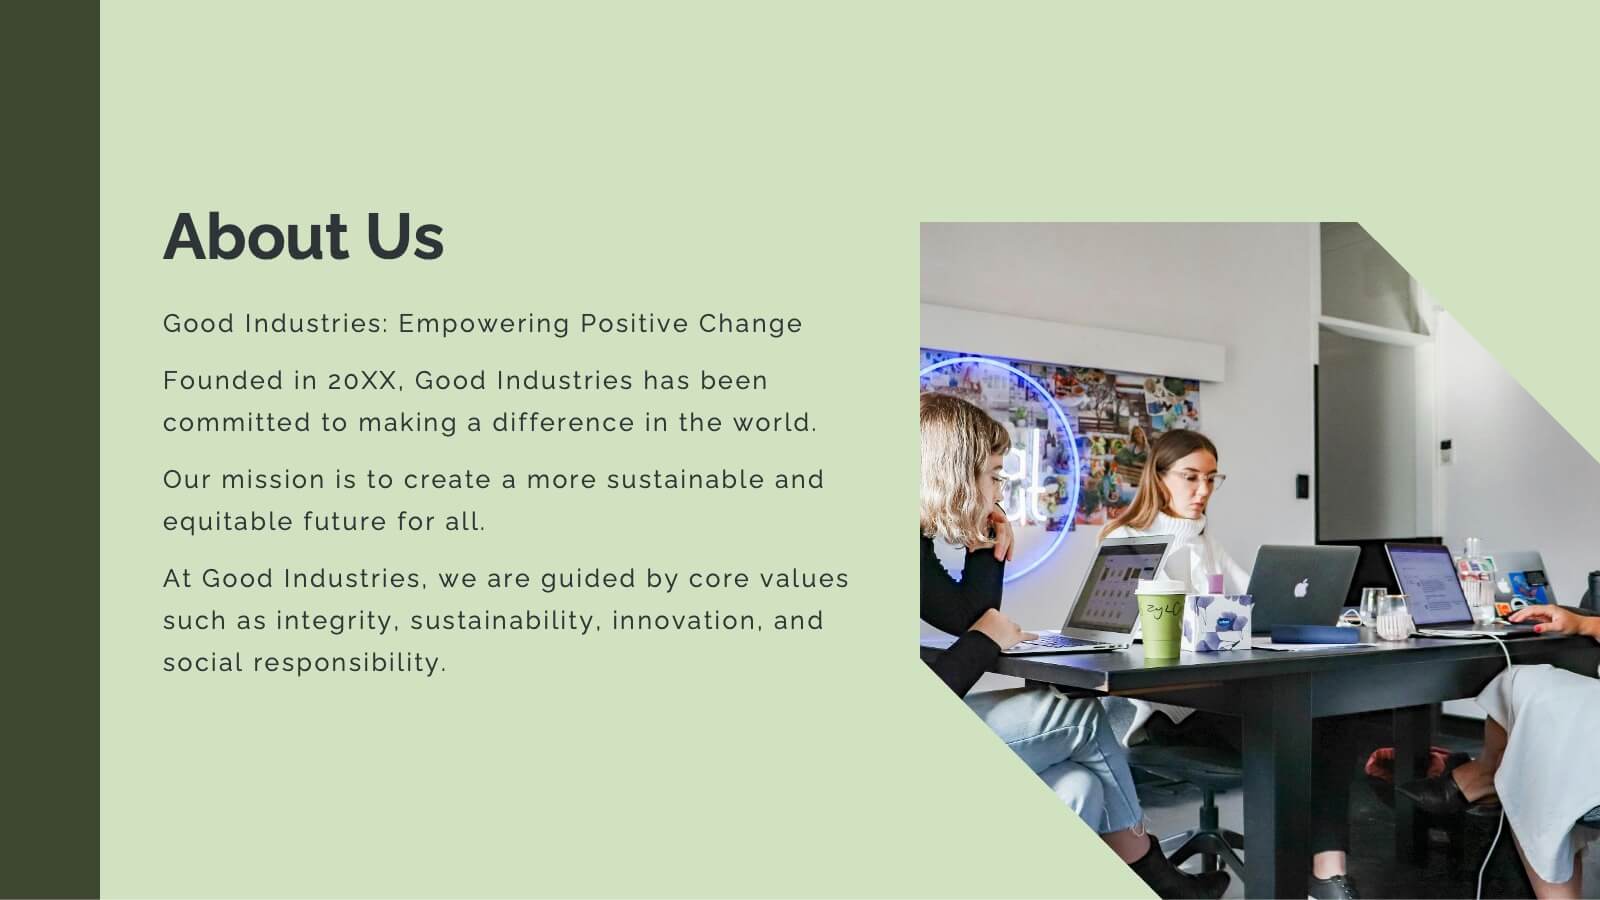
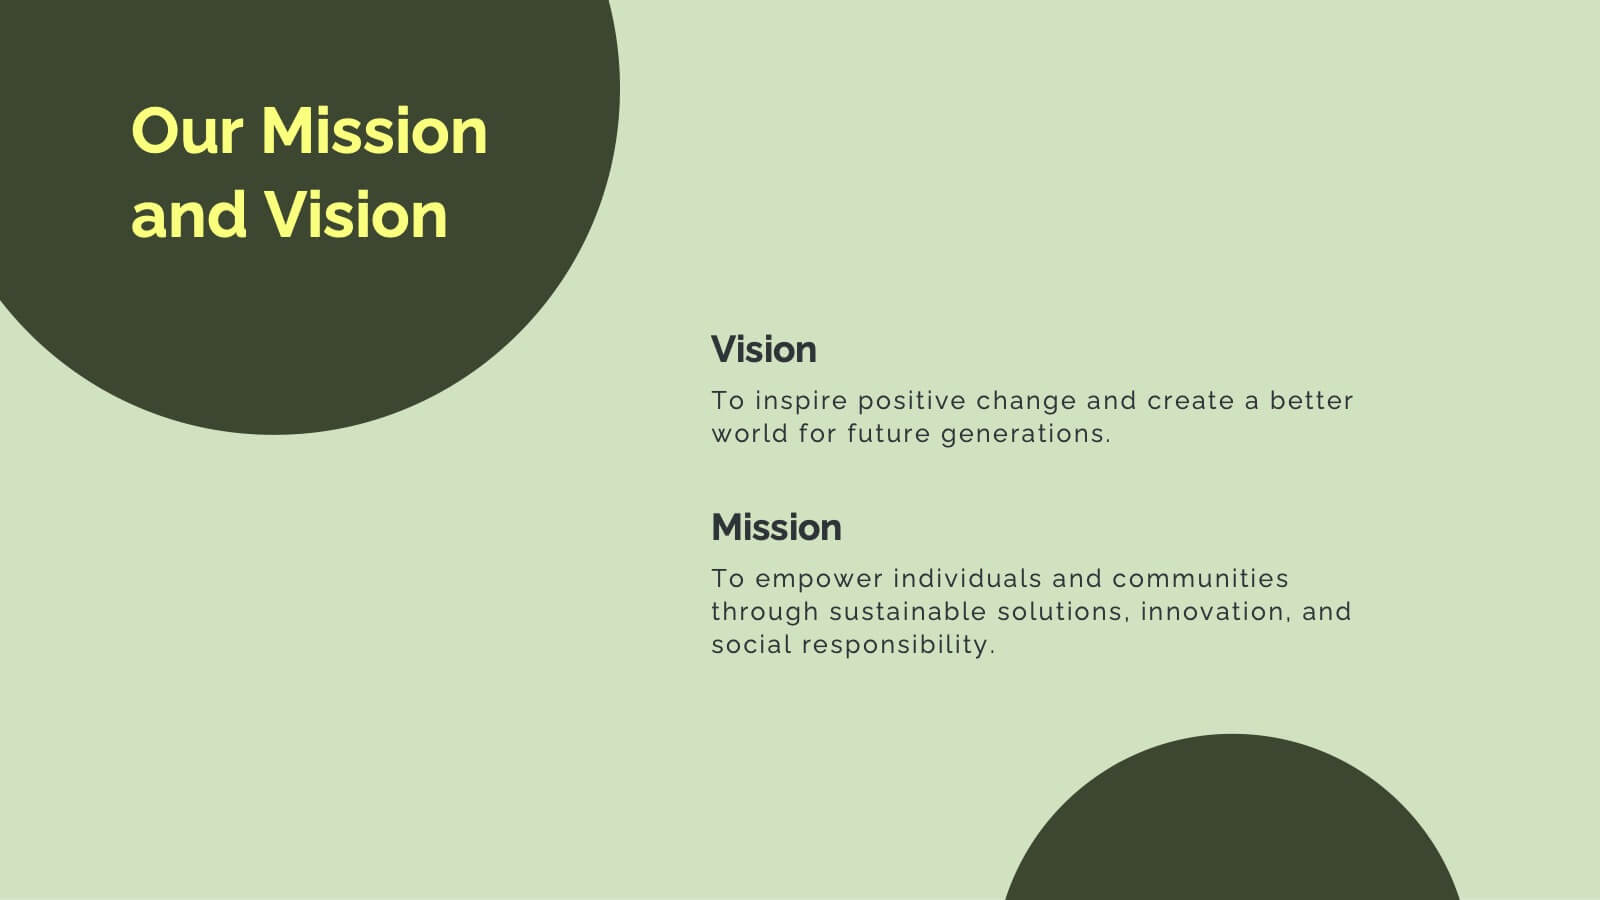
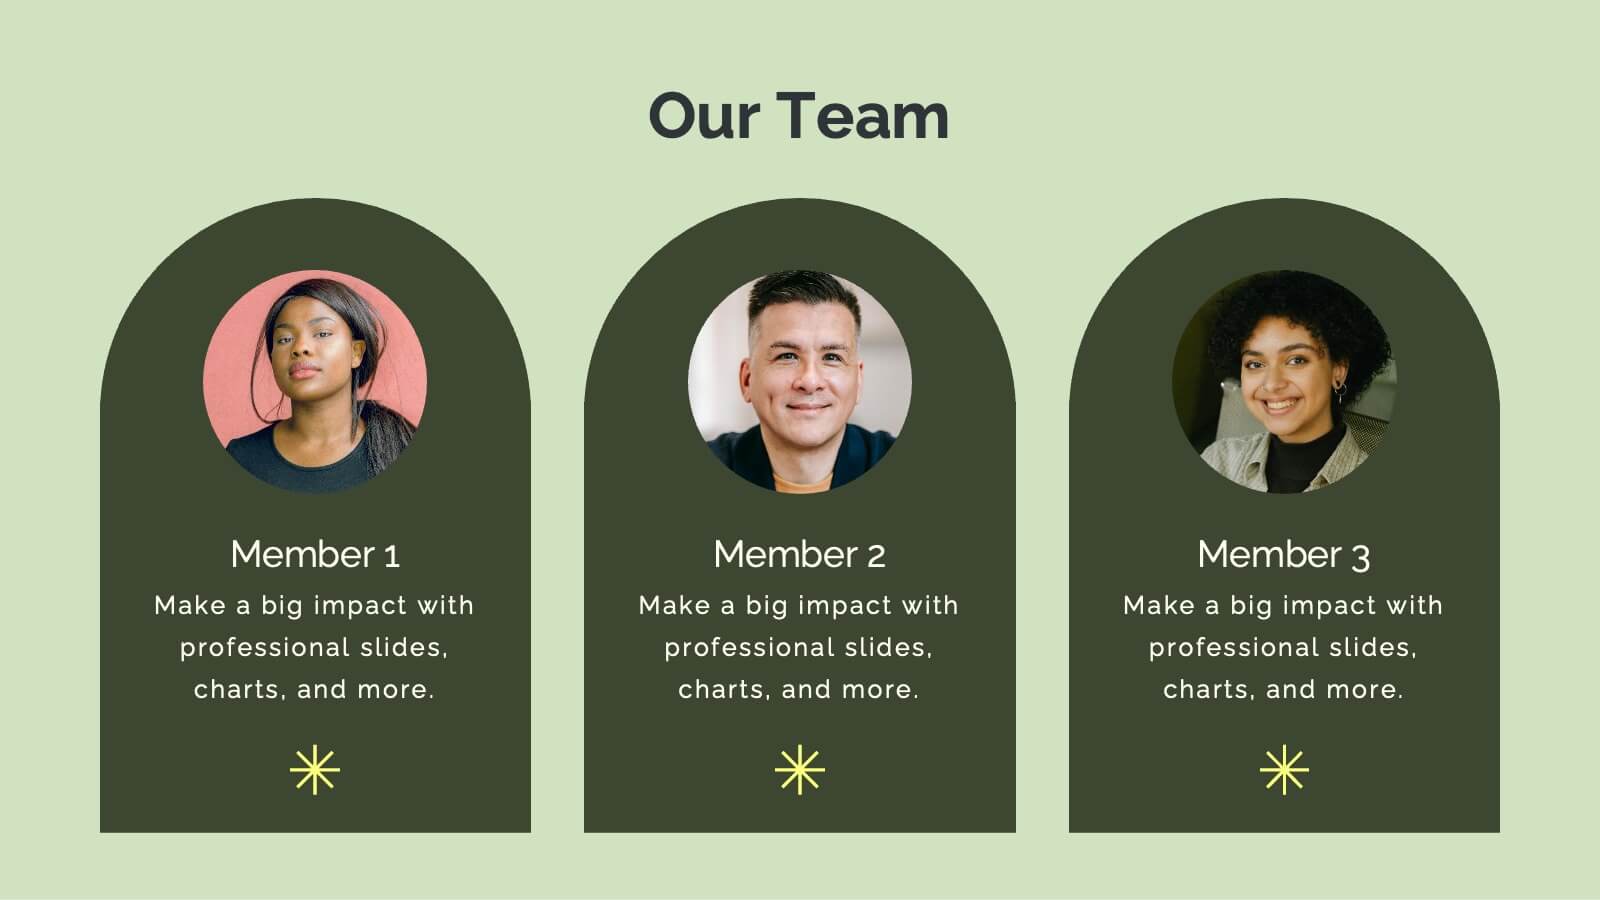
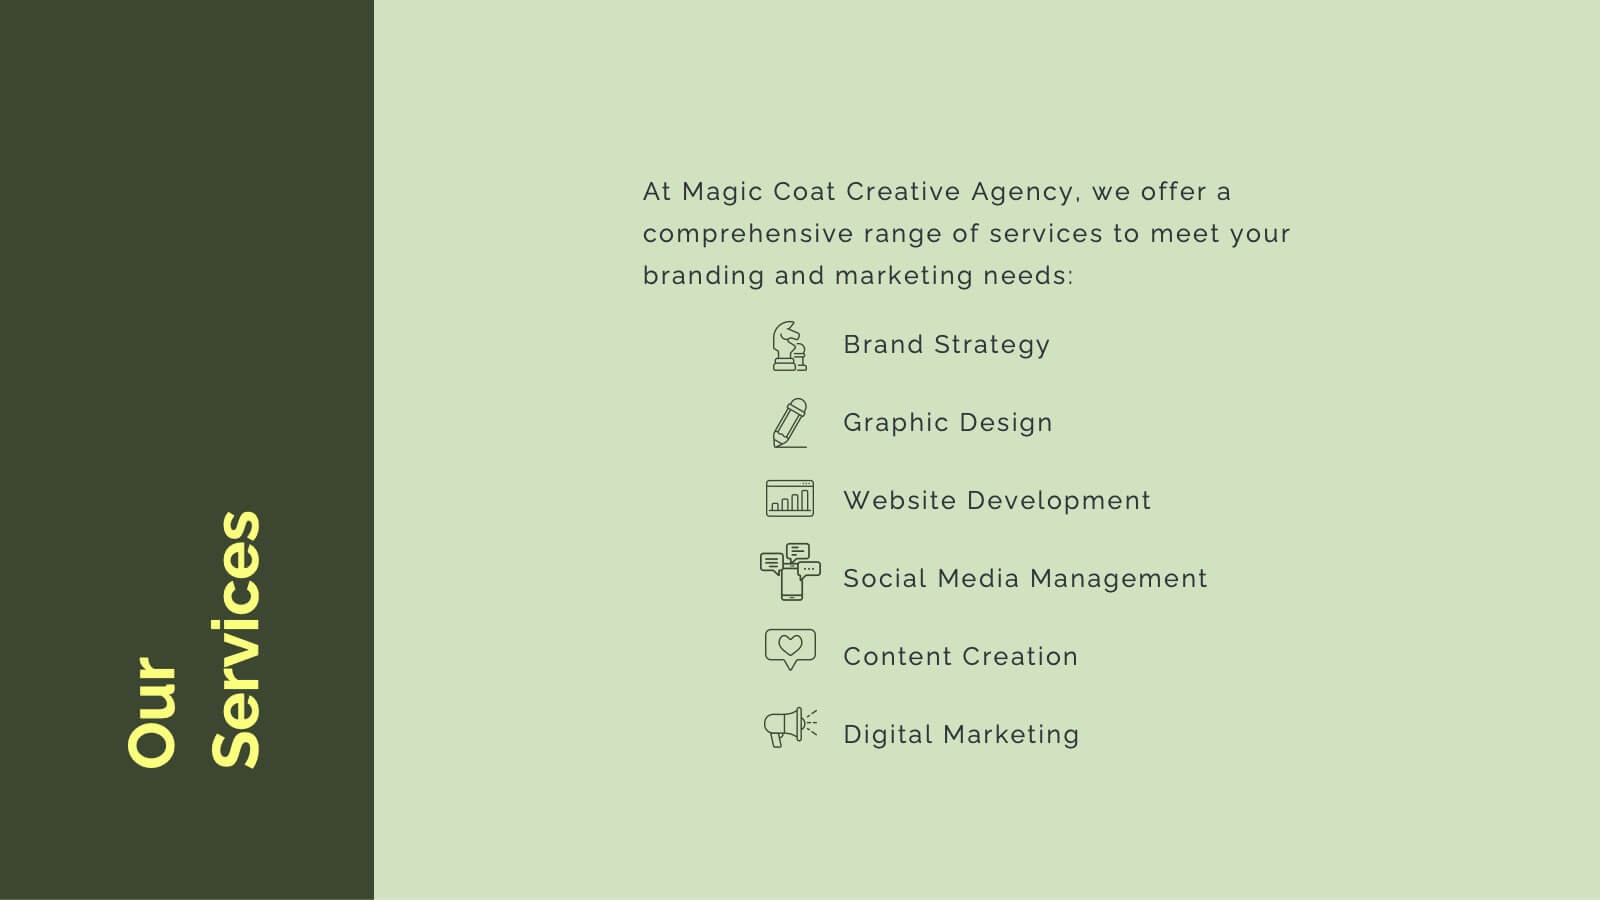
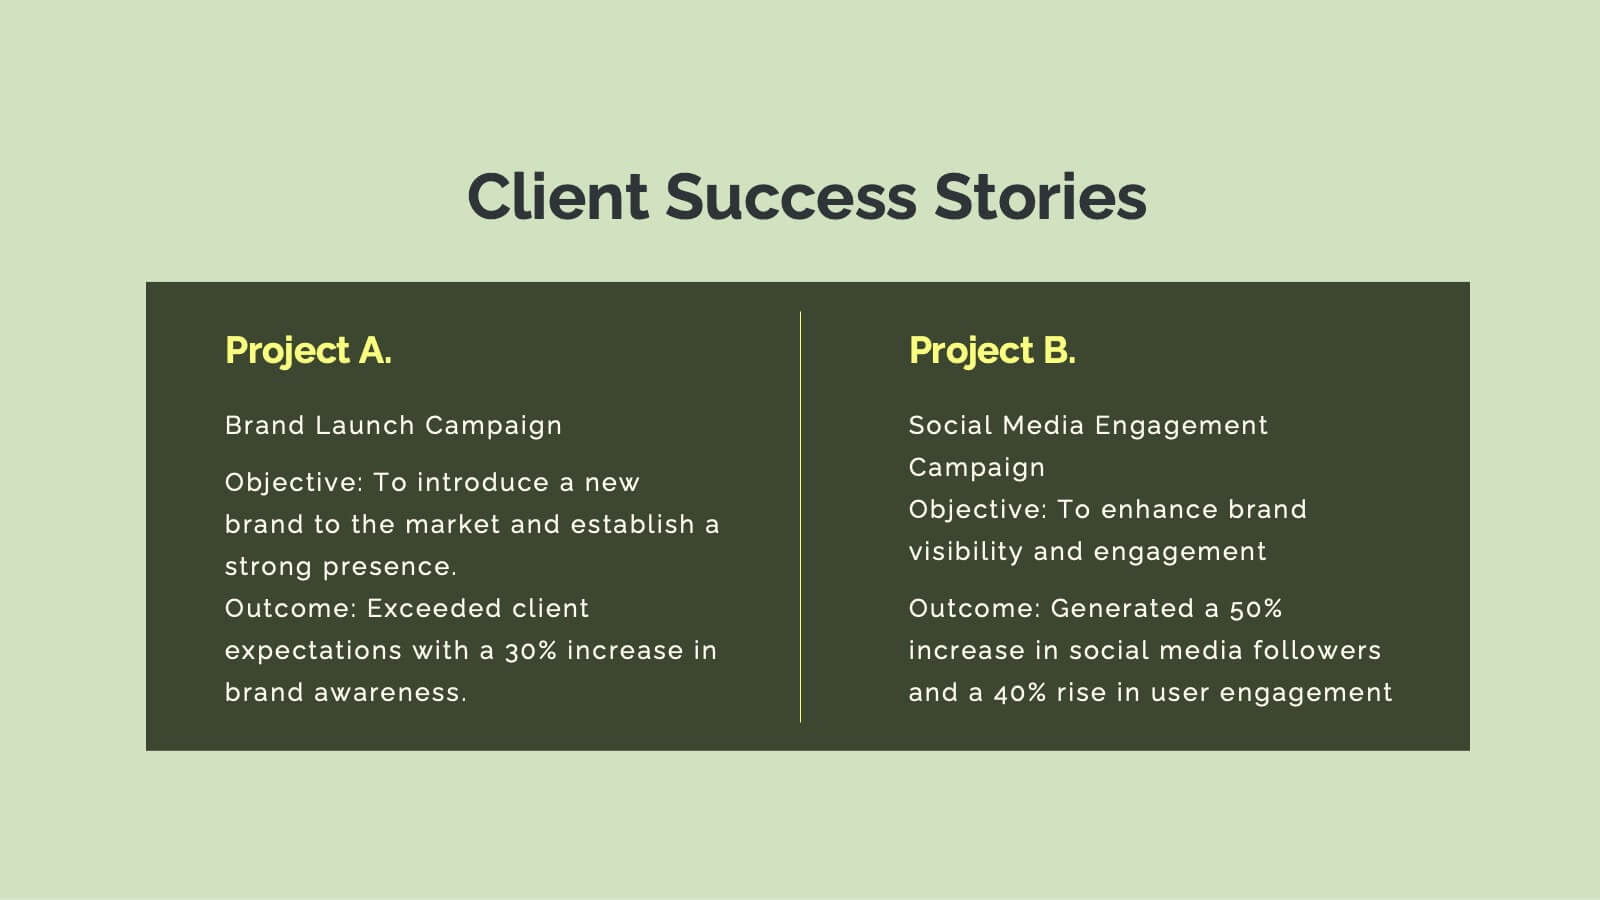
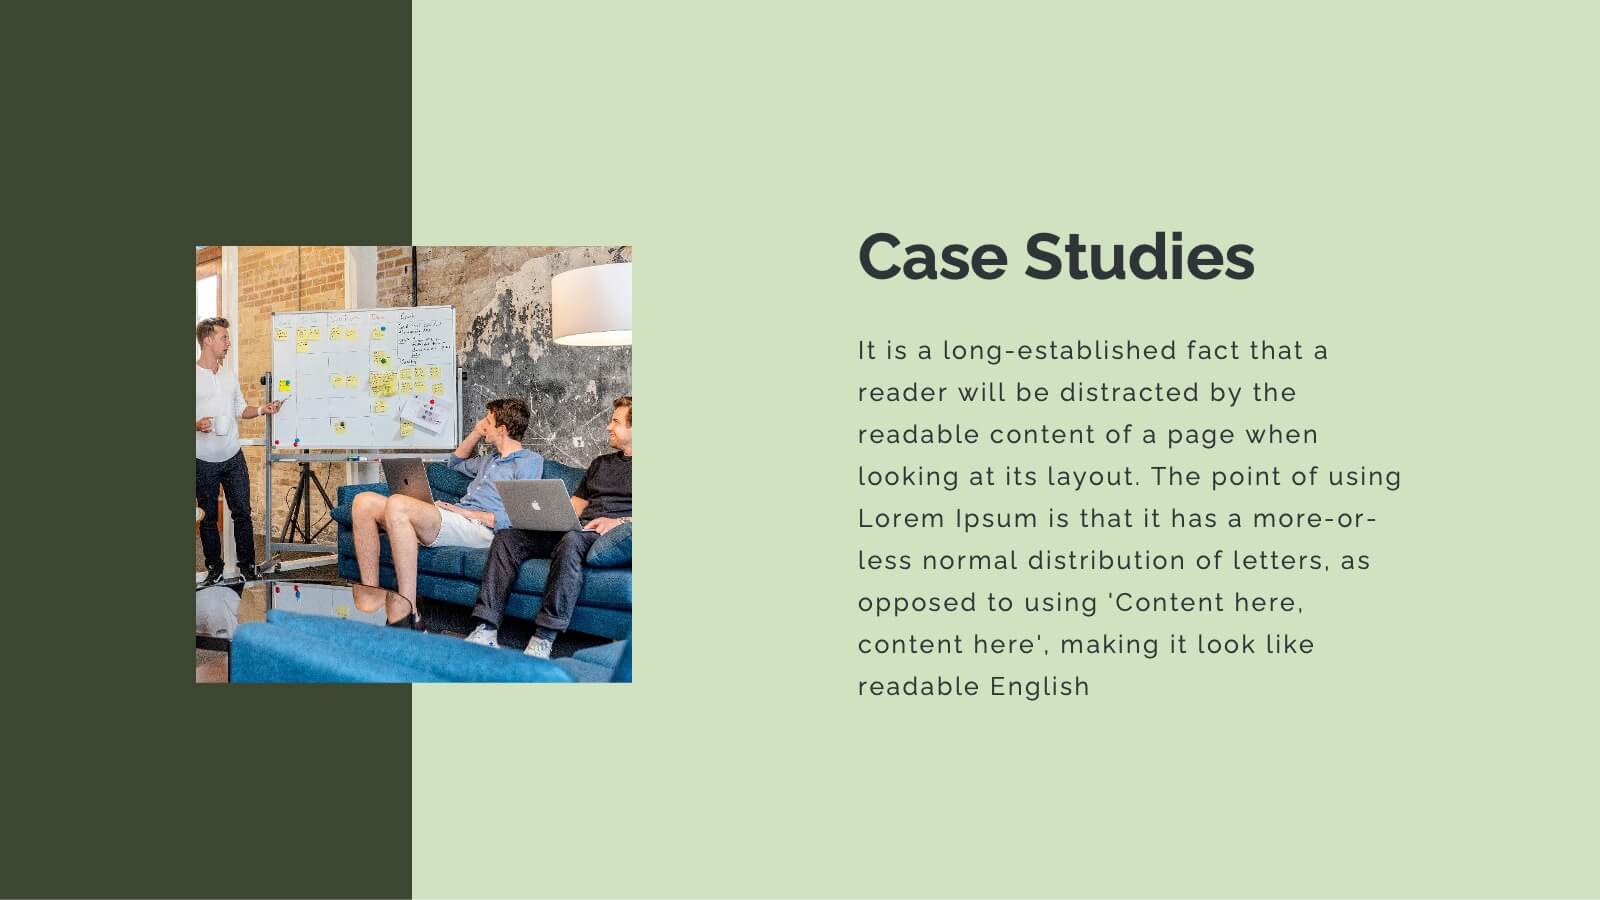
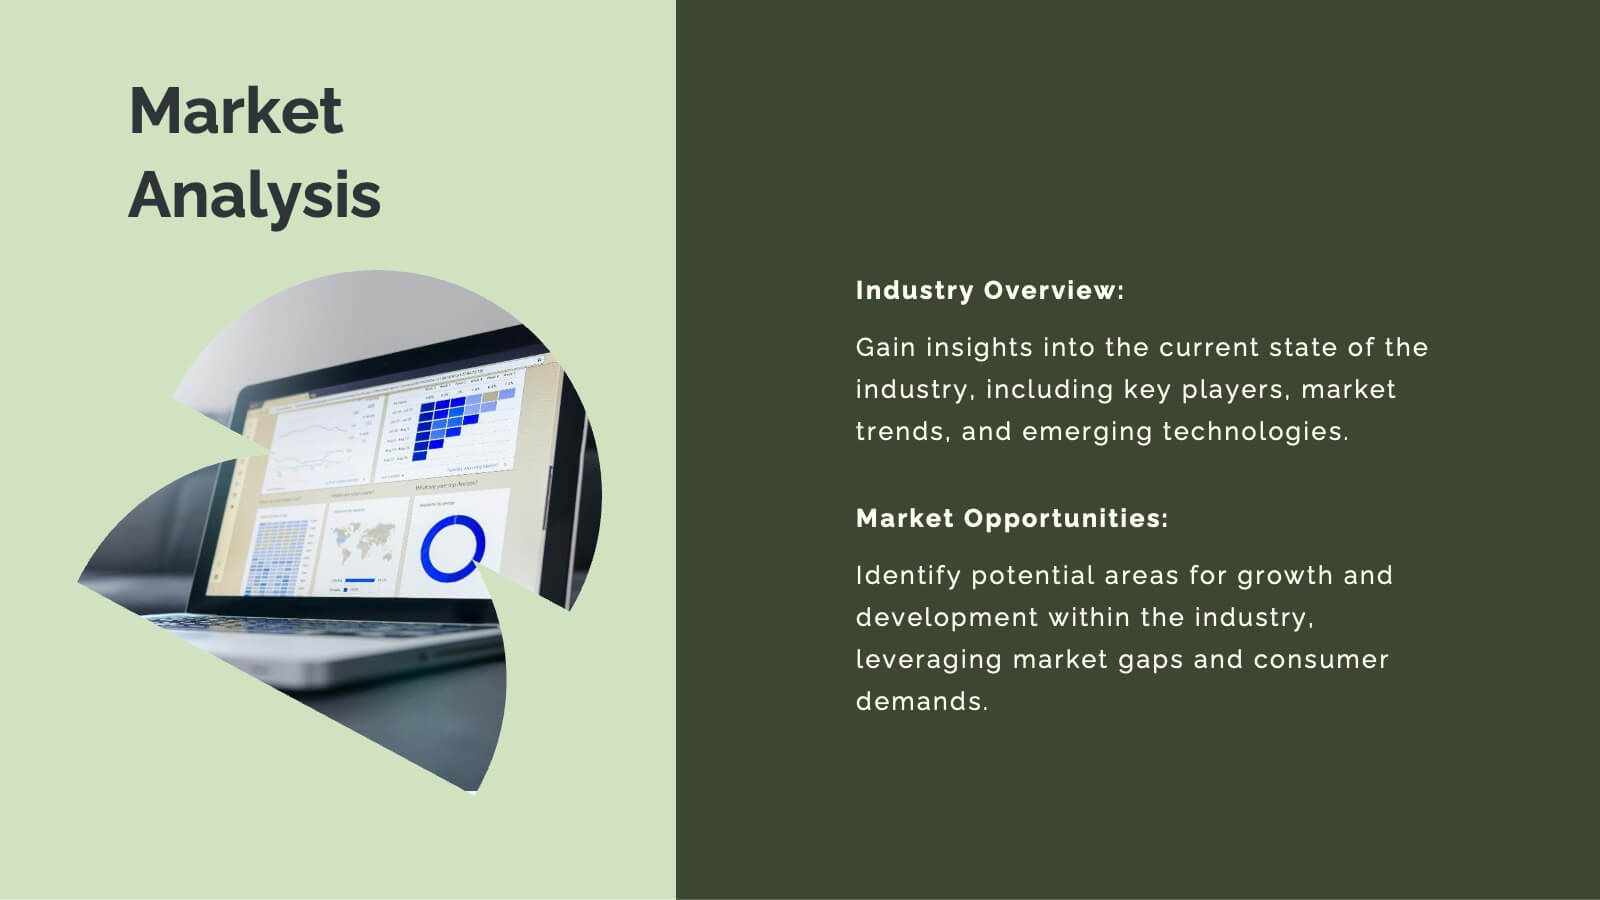
Horizon Advertising Agency Proposal Presentation
Elevate your advertising impact with this comprehensive agency proposal template. It’s meticulously designed to showcase your agency’s capabilities from strategic planning to creative execution, ensuring a persuasive presentation of services like market analysis, campaign strategies, and client success stories. Each slide is formatted to facilitate understanding and engagement, making it perfect for highlighting your team's expertise and unique approach. Compatible with major presentation platforms like PowerPoint, Google Slides, and Keynote, this template supports your efforts to secure new clients and projects seamlessly across various devices.


7 slides
Self-sufficient Environmental Infographic
In an era where sustainability is paramount, understanding self-sufficiency in environmental contexts has never been more crucial. Our refreshing infographic, adorned in crisp whites, lush greens, with subtle black nuances, delves deep into this pivotal subject. Crafted to be both educational and engaging, this infographic sheds light on the essentials of eco-friendly independence. It's a must-have tool for educators, environmental enthusiasts, policy-makers, and individuals aiming for a green footprint. Seamlessly integrated with PowerPoint, Keynote, and Google Slides, our infographic invites you to explore, educate, and empower for a more sustainable tomorrow.


6 slides
Strategy for Effective Solutions Presentation
Unlock strategic clarity with the Strategy for Effective Solutions template, which effectively organizes complex strategies into six interconnected segments, ideal for sequentially showcasing business insights. Its clear, systematic design supports concise communication and is compatible with PowerPoint, Keynote, and Google Slides, making it a versatile tool for professional presentations.


26 slides
Salus Rebranding Project Plan Presentation
This rebranding project plan template offers a clear framework for presenting brand identity transformation. Covering brand values, identity components, target audience, positioning, and guidelines, it’s ideal for companies refreshing their brand. Compatible with PowerPoint, Keynote, and Google Slides, it ensures a streamlined, professional presentation of your rebranding strategy.


6 slides
Corporate Framework Planning Presentation
Organize and present your strategic plans with this clean corporate framework layout. Ideal for showcasing six key areas of focus, this slide helps communicate business insights, goals, and execution pillars clearly. Fully editable in Canva, PowerPoint, and Google Slides—perfect for business plans, executive meetings, or internal project reviews.


7 slides
Financial Health and Budget Planning Presentation
Present your budgeting journey with clarity using the Financial Health and Budget Planning Presentation. This slide features a horizontal flow diagram with six editable steps—perfect for outlining savings strategies, expense tracking, or financial goals. Each icon-based block helps highlight key actions. Fully customizable in PowerPoint, Canva, and Google Slides.