


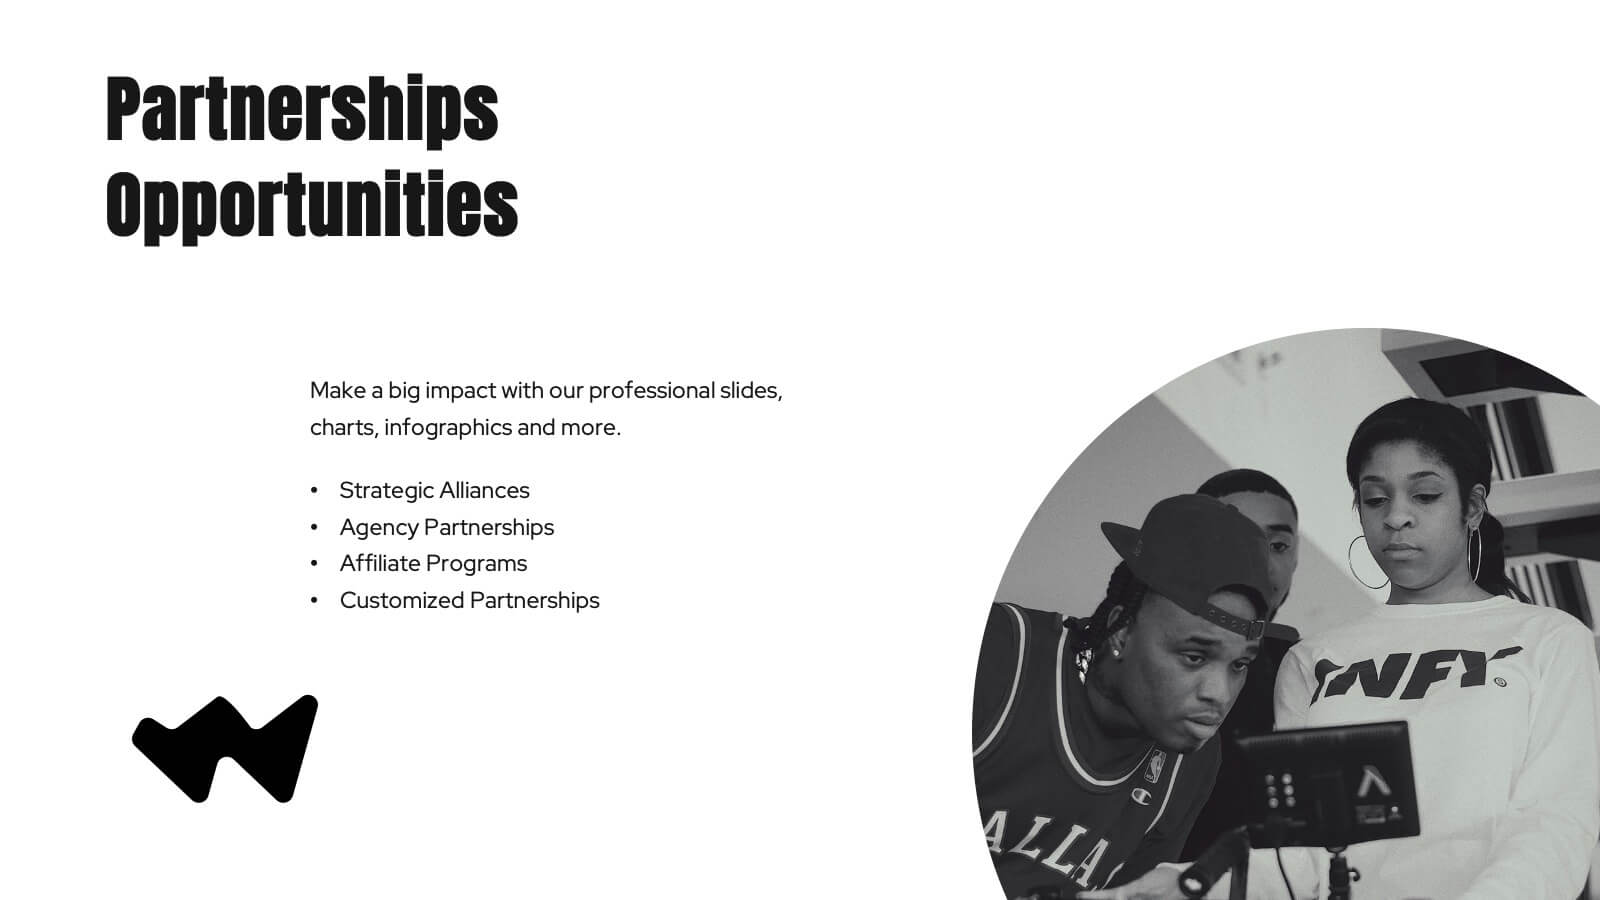
Features
- 5 Unique slides
- Fully editable and easy to edit in Microsoft Powerpoint, Keynote and Google Slides
- 16:9 widescreen layout
- Clean and professional designs
- Export to JPG, PDF or send by email


Do you have any questions?
Recommend


7 slides
Harvey Ball Assessment Infographic Presentation
A Harvey Ball Infographic is a graphic design element that utilizes the iconic Harvey Ball. This Harvey Ball template is designed as a way to increase morale and productivity in the workplace. This infographic is useful for businesses and organizations who want to present data or information in a way that is easy to understand and engaging to their audience. By incorporating the harvey ball into your presentations it adds a fun and lighthearted element to an otherwise dry or complex topic. Designed in Powerpoint, Keynote, and Google Slides, customized the text and graphs to fit your brand.


6 slides
Life Insurance Infographic
Life insurance is a contract between an individual and an insurance company, where the insurance company agrees to pay a sum of money (the death benefit) to the designated beneficiaries upon the death of the insured person. This infographic template is designed to provide a clear and concise overview of what life insurance is, why it is important, and the different types of life insurance coverage available. This infographic aims to educate and inform individuals about the value of life insurance in protecting their loved ones and securing their financial future. This infographic is compatible with Powerpoint, Keynote, and Google Slides.


5 slides
Next-Gen Networks and 5G Infrastructure Presentation
Build the future, one signal at a time. This engaging infographic presentation visually tracks the evolution of mobile network infrastructure, using a clean timeline layout with colorful tower icons and milestone markers. Perfect for tech educators, analysts, or engineers. Fully compatible with PowerPoint, Keynote, and Google Slides for seamless editing.


5 slides
Business Strategy Planning Puzzle Presentation
Visualize interconnected initiatives with this Business Strategy Planning Puzzle Presentation. The magnifying glass design and five-piece puzzle format help you break down complex strategy components into digestible segments. Ideal for highlighting core objectives, key performance drivers, and strategic focus areas. Fully customizable with editable text boxes and icons. Compatible with PowerPoint, Keynote, and Google Slides.


8 slides
Cognitive Psychology and Decision Making
Unlock the logic behind human choices with this eye-catching presentation template that puts cognitive puzzles into perspective—literally. Dive into how thought patterns, mental shortcuts, and biases influence decision making, all illustrated through clean visuals and digestible layouts. Easily customizable for PowerPoint, Keynote, and Google Slides.

22 slides
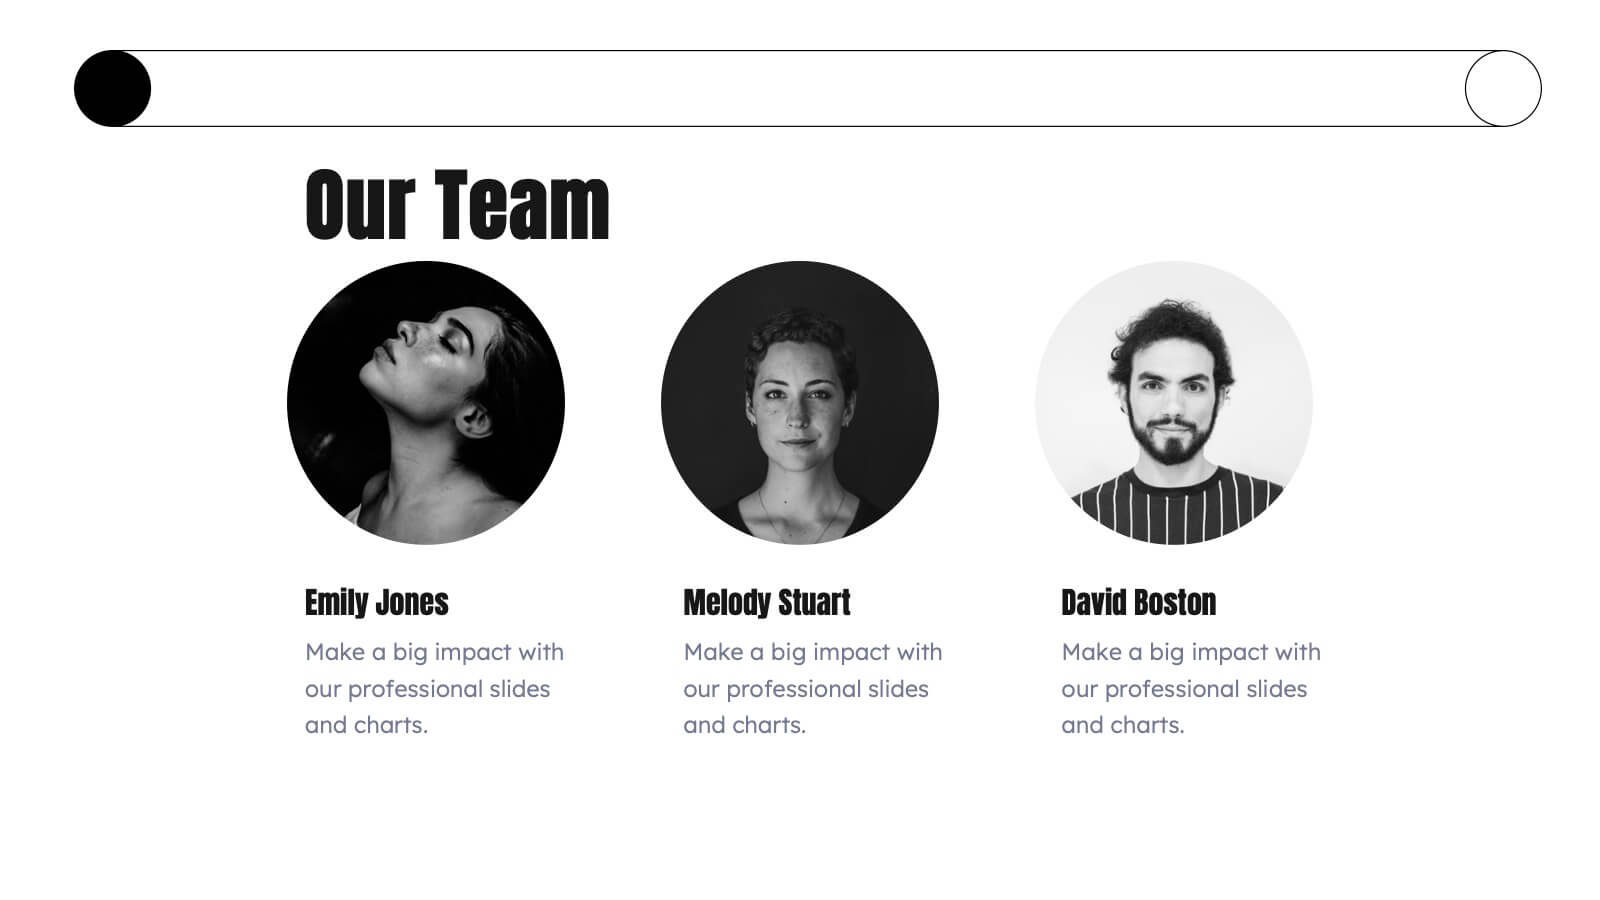
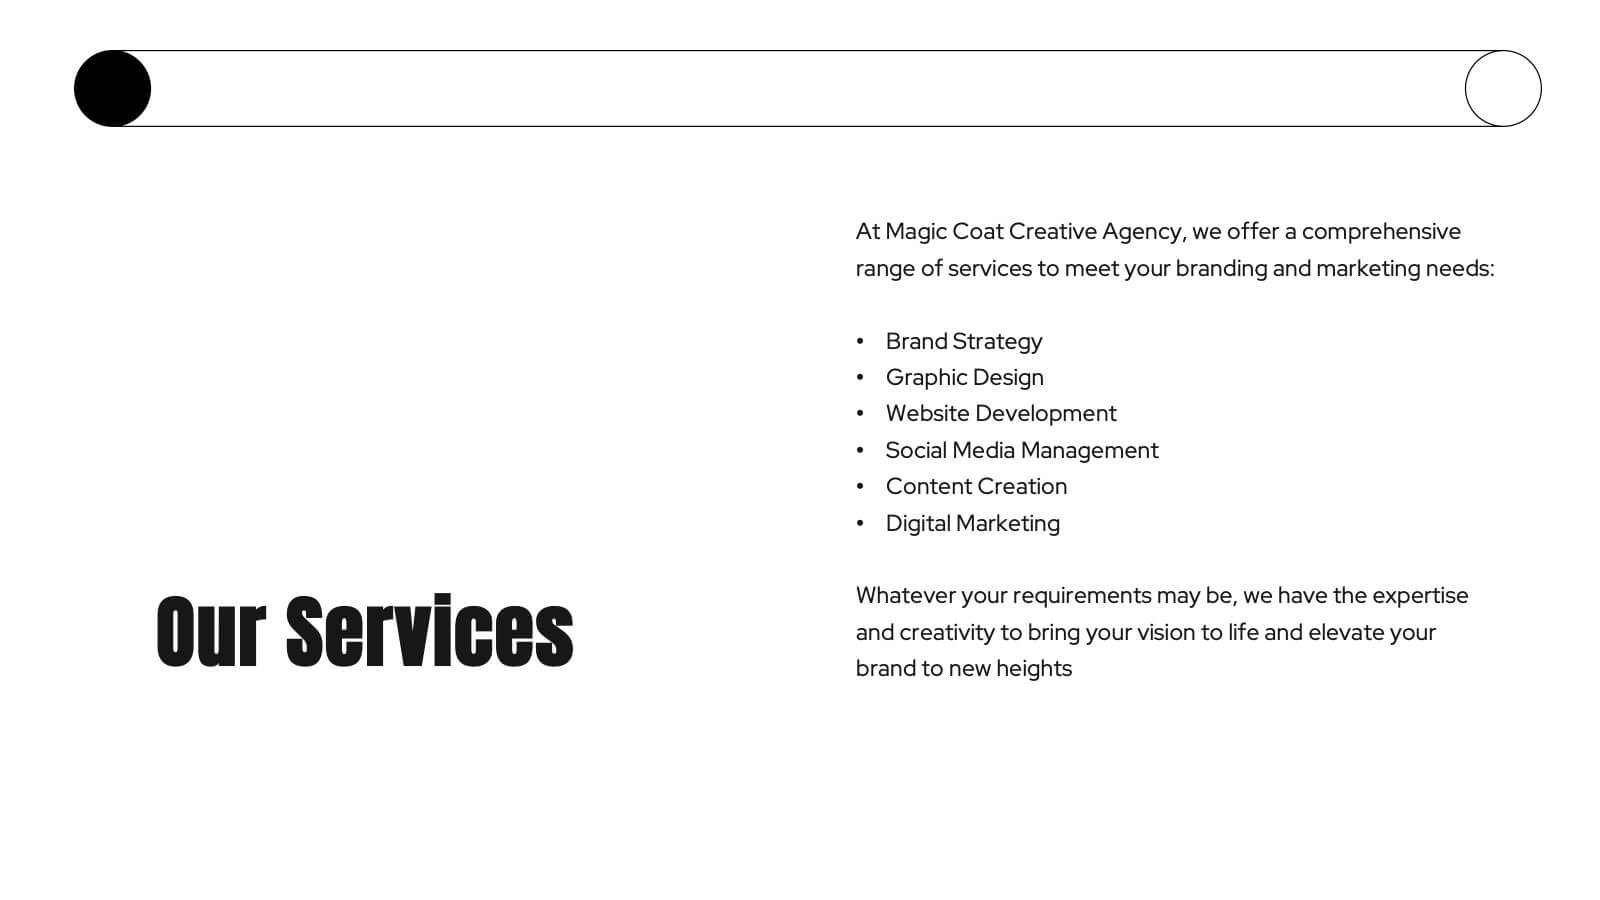
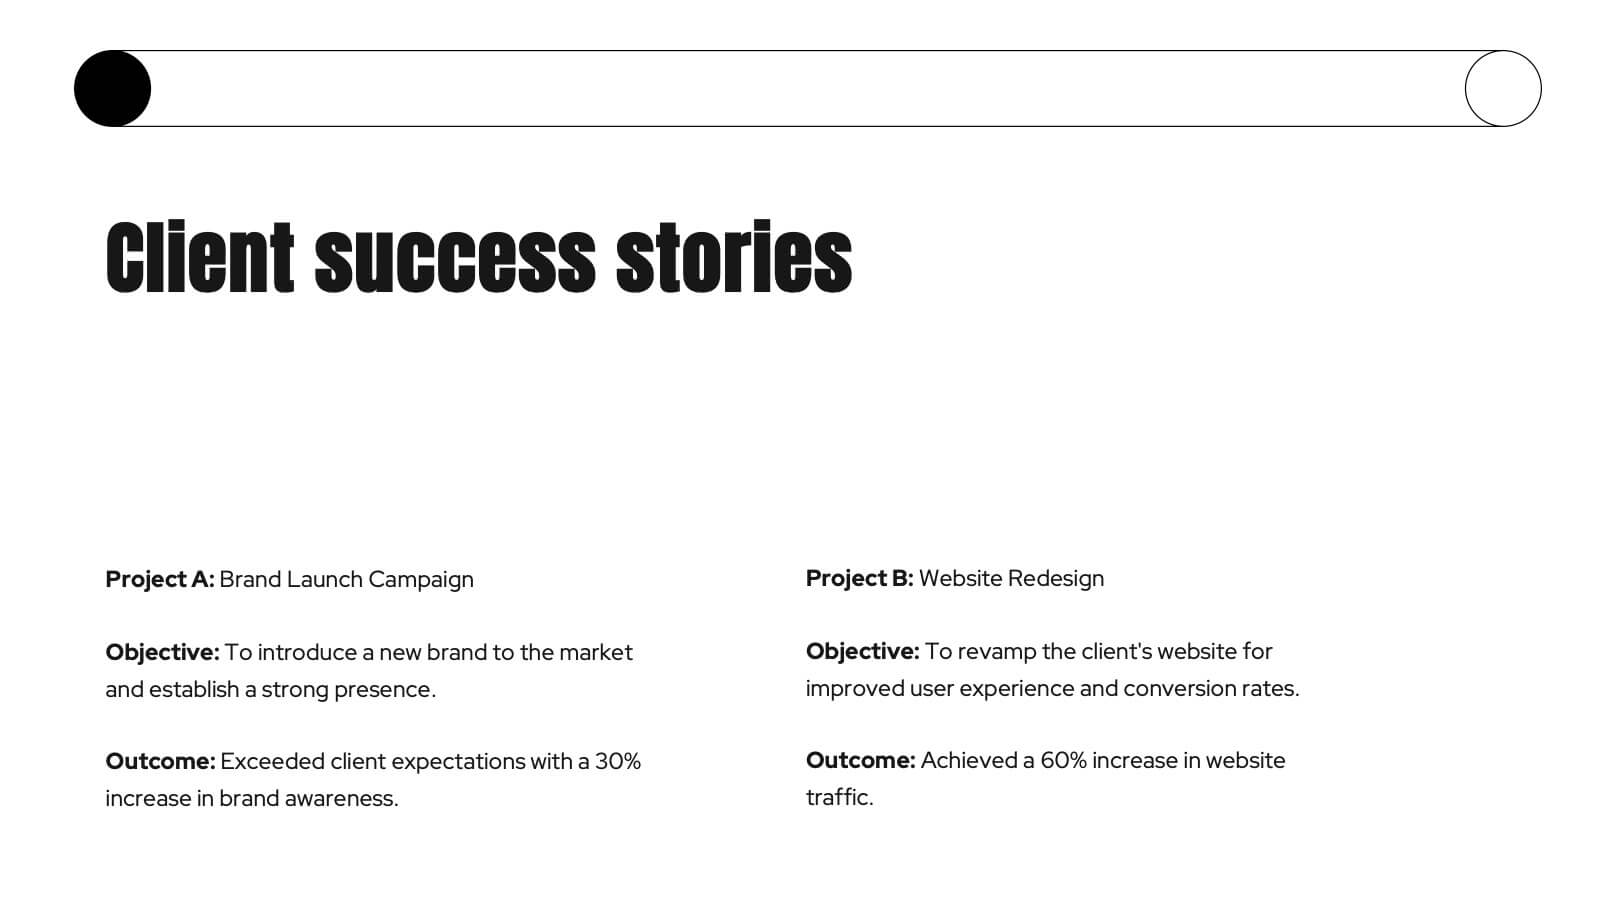
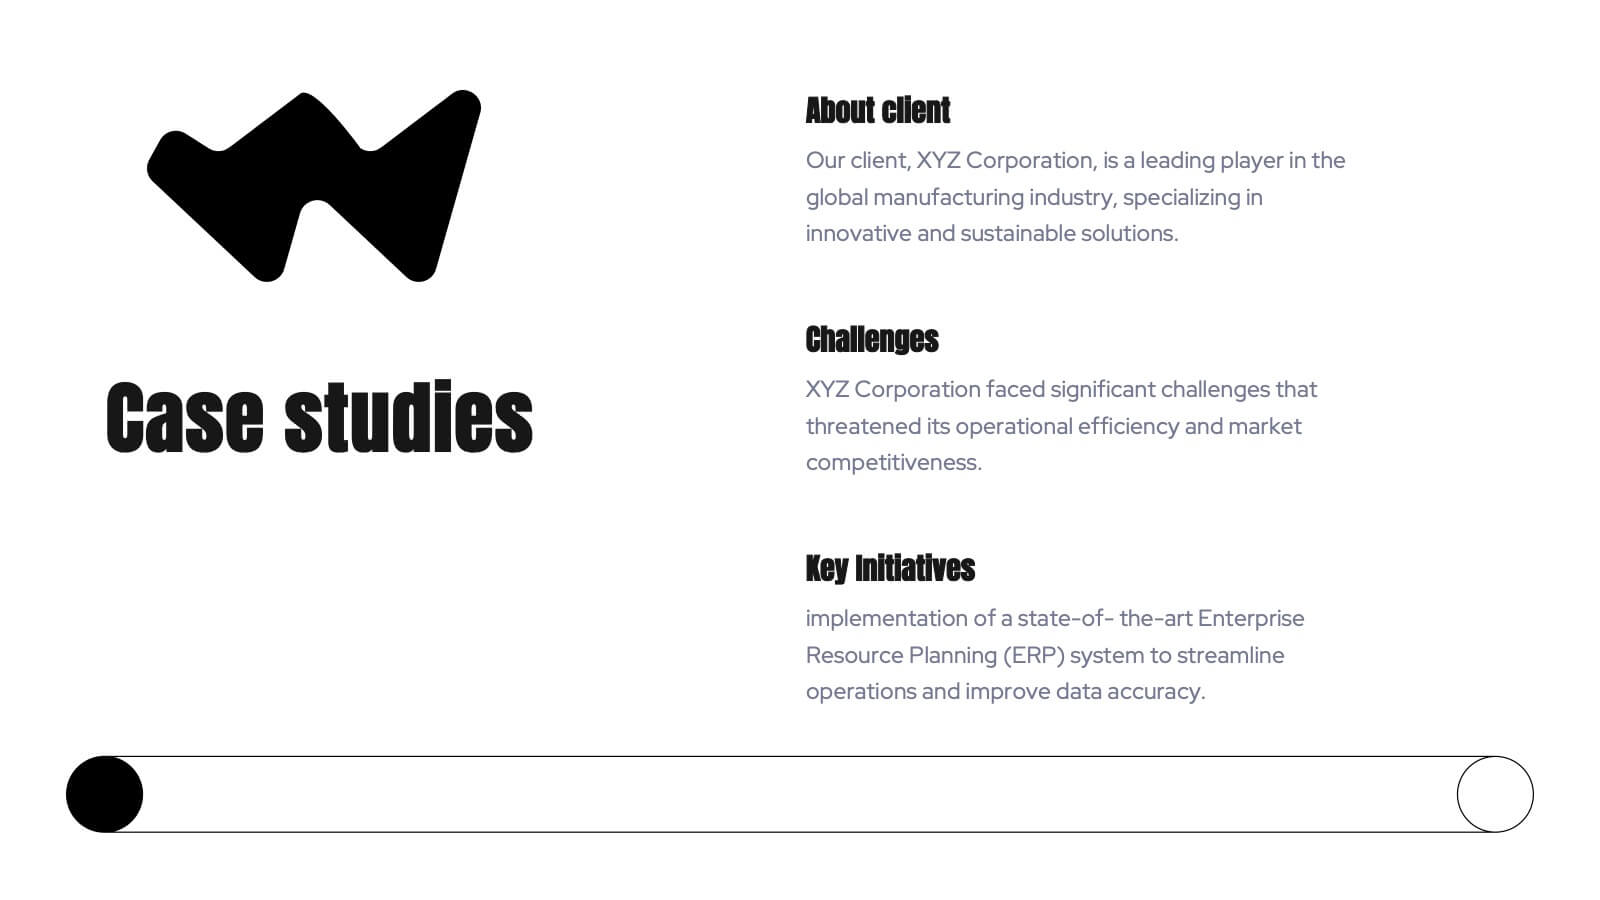
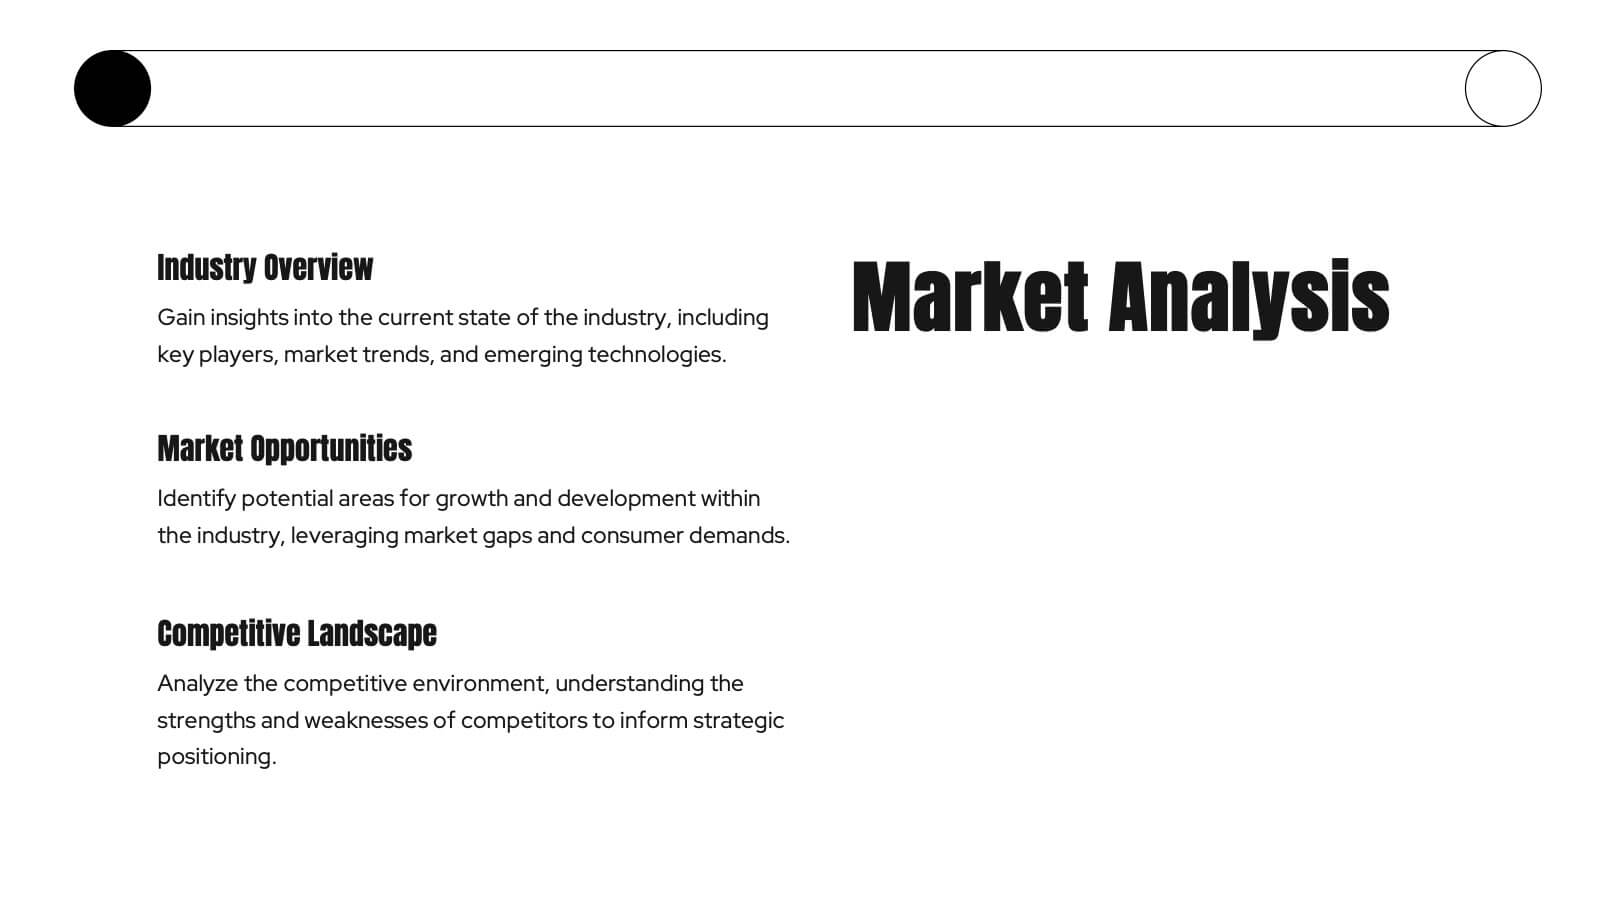
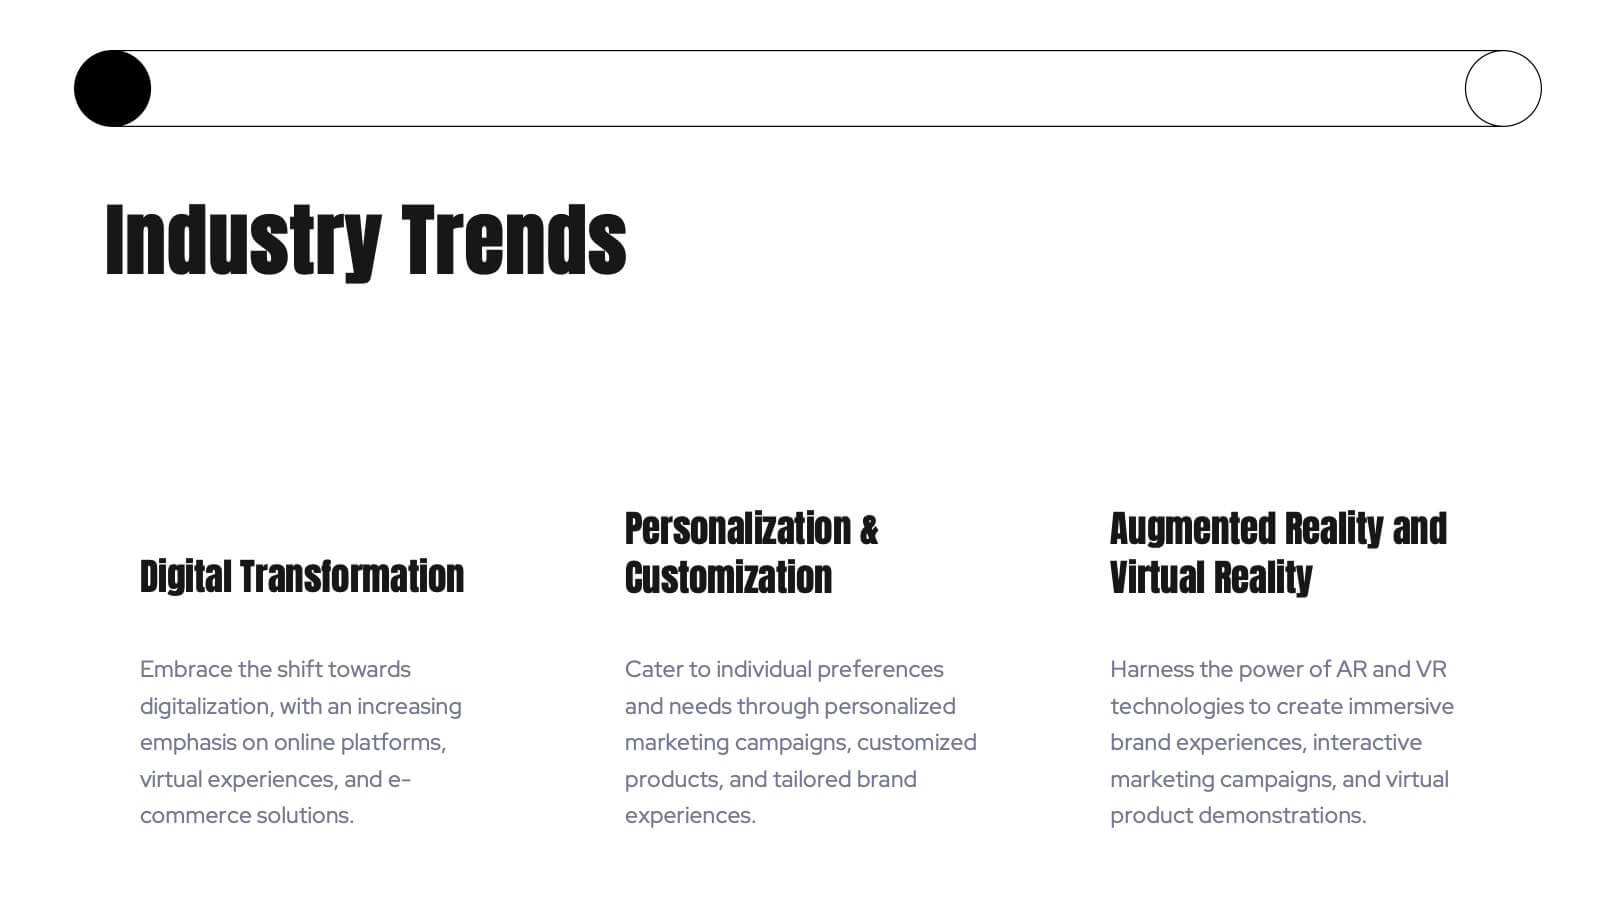
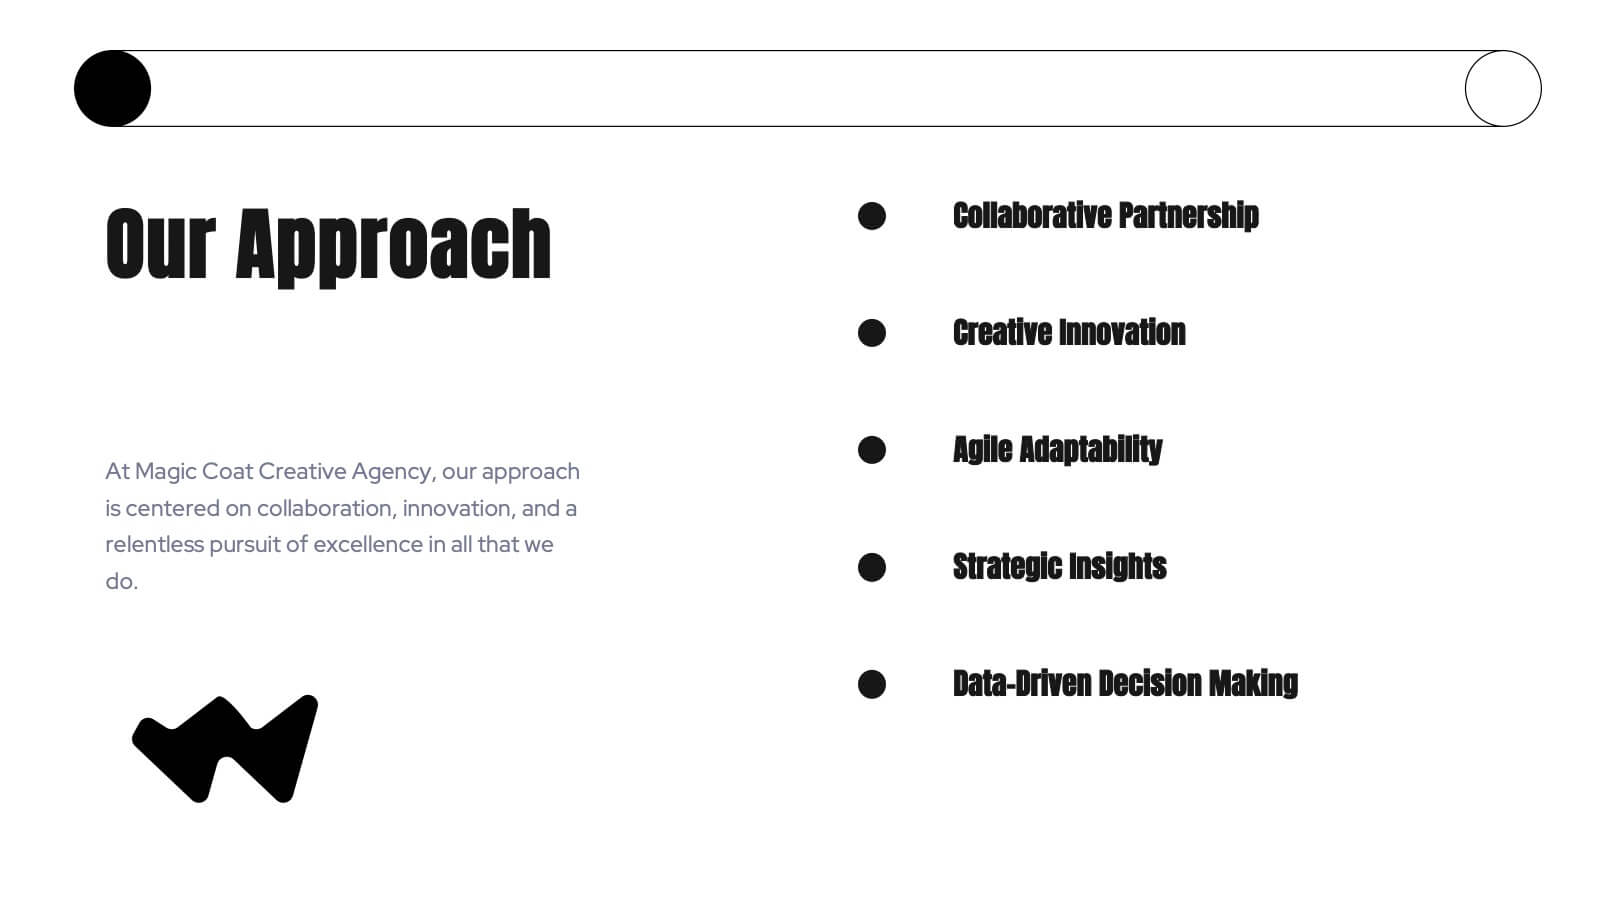
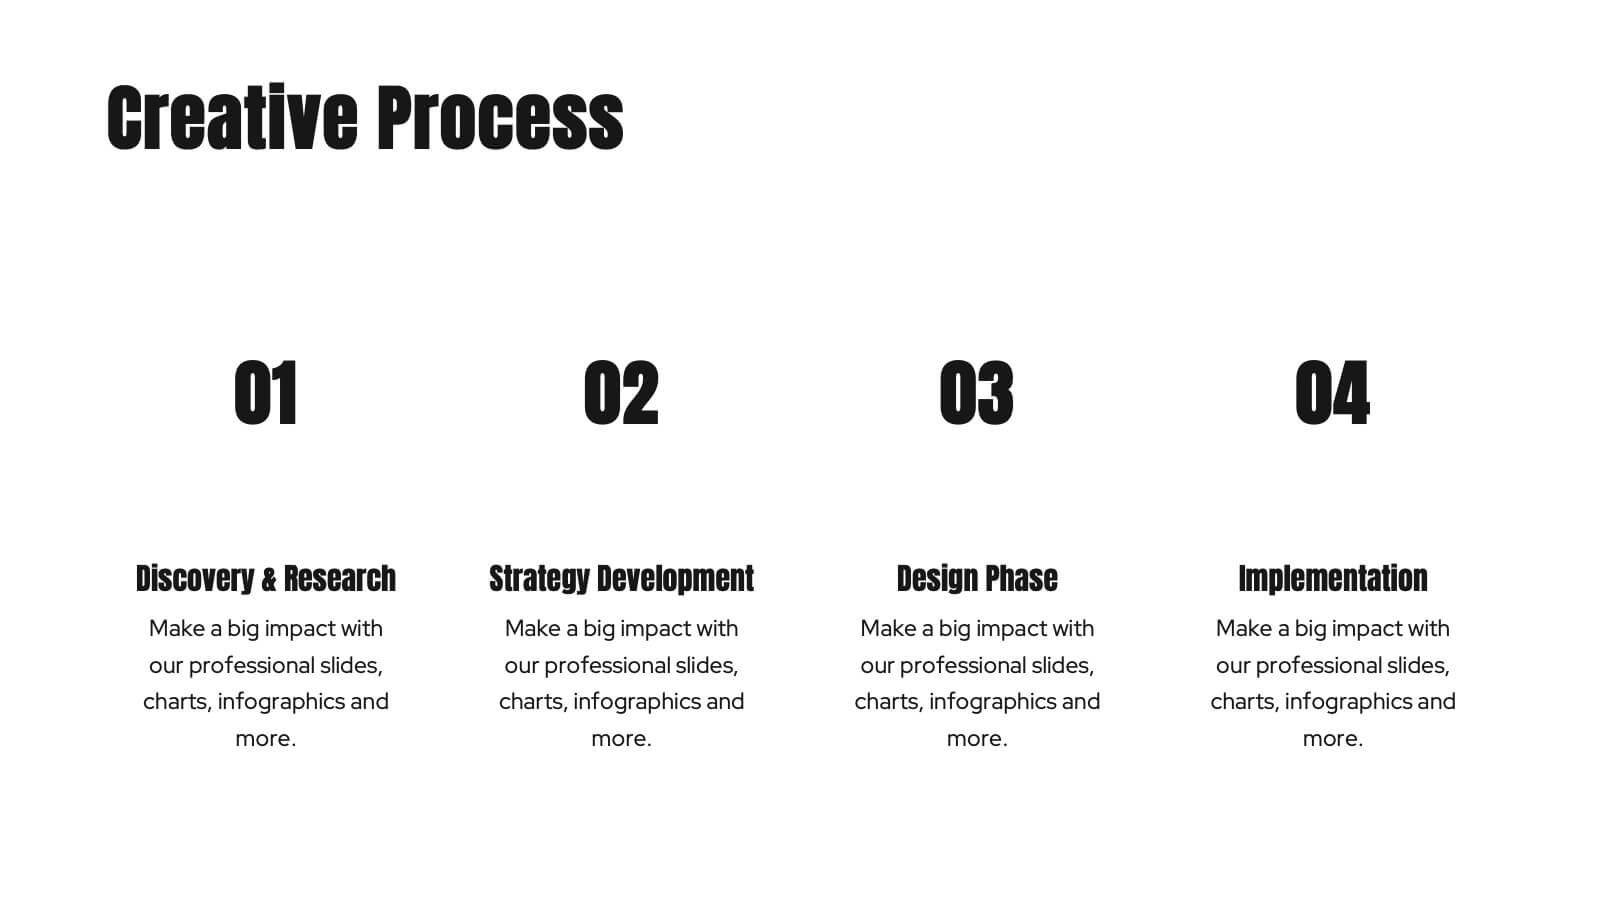
Kraken Agency Portfolio Presentation
This agency portfolio template showcases your agency's work and expertise with a sleek, modern design. It features slides for client success stories, case studies, services, market analysis, and creative process. Perfect for demonstrating your team’s skills and approach. Compatible with PowerPoint, Keynote, and Google Slides for easy customization and presentation.


5 slides
Building Strong Business Relationships
Create lasting partnerships with this structured business relationship infographic. Ideal for outlining trust-building strategies, collaboration frameworks, and stakeholder engagement plans. Fully editable in PowerPoint, Keynote, and Google Slides, making it simple to align the design with your company’s branding and professional goals.


7 slides
Sales Cycle Infographic
A sales cycle, refers to the series of stages or steps that a salesperson or a sales team follows to convert a prospective customer into a paying customer. This infographic template is a structured approach to lead a potential customer from the initial contact to making a purchase. Compatible with Powerpoint, Keynote, and Google Slides. This is an illustrative guide to the fundamental stages of the sales journey. Equip yourself with an understanding of how sales progress, from prospecting to closing the deal, enabling you to optimize your strategies and drive success in the dynamic world of sales.


6 slides
McKinsey 7S Framework
Visualize the interdependent elements of organizational success with this professional McKinsey 7S Framework template. Ideal for strategic planning, change management, or internal assessments, this editable slide highlights structure, systems, style, staff, skills, strategy, and shared values. Fully compatible with PowerPoint, Keynote, and Google Slides.


7 slides
Mission Statement Infographic
Present your organization's core values and goals with clarity using this collection of professionally designed slide templates. Each one is crafted to communicate key elements of your strategic vision effectively, combining aesthetic appeal with functional design to ensure your message resonates. Featuring a clean and professional layout, these slides emphasize the importance of your foundational principles. The balanced use of images and text is ideal for enhancing corporate presentations, stakeholder meetings, or team workshops. With various designs available, you can select the layout that best aligns with your branding and organizational ethos. These templates are fully customizable, allowing for adjustments in color, font, and imagery to perfectly articulate your core messages. They are an excellent tool for motivating your team, impressing stakeholders, and conveying the driving purpose behind your initiatives.


6 slides
Governance Structure Overview Presentation
A clear, polished flow of ideas makes this slide instantly engaging, guiding viewers through each essential component with ease. This presentation explains how an organization structures oversight, responsibilities, and decision-making to ensure accountability and performance. Clean icons and balanced spacing keep everything easy to follow. Fully compatible with PowerPoint, Keynote, and Google Slides.


7 slides
World Maps Medical Security Infographic
Introducing our world map medical security infographic, a template designed to spotlight global medical security concerns and solutions. With a pristine white backdrop punctuated by shades of blue, this infographic offers a tranquil yet informative ambiance, reminiscent of the medical field. Embedded within are custom graphics of the world map, tailor-made to highlight regions based on their medical security levels, accompanied by relevant icons that represent various aspects of healthcare protection and risks. It’s compatibility with platforms such as PowerPoint, Keynote, and Google Slides ensures seamless presentations across various devices and audiences.


5 slides
Team Role Distribution Matrix Presentation
Clarify responsibilities and improve collaboration with the Team Role Distribution Matrix Presentation. This RACI-style slide helps visualize team accountability across multiple tasks, making it ideal for project management, cross-functional teams, or workflow planning. Each layout option includes clearly labeled roles and color-coded responsibilities: Responsible, Accountable, Consulted, and Informed. Fully editable in Canva, PowerPoint, Keynote, and Google Slides.


20 slides
Oceandra Sales Proposal Presentation
Present your sales strategy with precision and professionalism using this versatile proposal template. Designed to clearly communicate your problem statement, proposed solutions, and goals, it’s perfect for impressing potential clients and stakeholders. Walk your audience through the project scope, methodology, and deliverables with clean, visually appealing layouts. With sections for pricing structures, team expertise, and risk mitigation strategies, this template ensures your proposal is comprehensive and persuasive. The next steps and action plan slide helps solidify your commitment to achieving results. Fully compatible with PowerPoint, Google Slides, and Keynote, it’s customizable to meet any business or industry requirements. Ideal for turning prospects into partnerships!


5 slides
Business Issue Root Cause Identification
Pinpoint the real reasons behind business challenges with this clear and visual layout. This root cause identification template breaks down effects and traces them back to their sources, making it easier to align your team and propose actionable solutions. Fully customizable in PowerPoint, Keynote, and Google Slides.


5 slides
Gantt Chart Project Schedule Presentation
Bring structure to your project timeline with a clean, easy-to-read layout that maps tasks, durations, and progress at a glance. This presentation helps teams stay aligned, visualize schedules, and track milestones with clarity and precision. Fully compatible with PowerPoint, Keynote, and Google Slides.


6 slides
5-Step Investment Planning Presentation
Guide your audience through a clear, structured journey with a modern layout that turns each financial step into a simple, visual milestone. This presentation helps you explain goals, outline processes, and communicate actionable insights with ease and clarity. Fully editable and compatible with PowerPoint, Keynote, and Google Slides.