


Features
- 3 Unique slides
- Fully editable and easy to edit in Microsoft Powerpoint, Keynote and Google Slides
- 16:9 widescreen layout
- Clean and professional designs
- Export to JPG, PDF or send by email


Do you have any questions?
Recommend


3 slides
Stock Market Performance Overview Presentation
Showcase financial growth like a pro with this clean, data-driven layout designed to visualize performance, market activity, and business progress over time. Ideal for professionals presenting key financial trends, metrics, or strategies. Fully compatible with PowerPoint, Keynote, and Google Slides for easy customization and professional presentation results.


4 slides
Problem-Solving Strategy Presentation
Navigate challenges with confidence using this problem-solving strategy template! Designed to break down complex issues into manageable steps, this structured layout helps teams identify solutions effectively. Perfect for business leaders, project managers, and strategists aiming for clarity and action. Fully customizable and compatible with PowerPoint, Keynote, and Google Slides.


7 slides
Leadership Infographic Presentation Template
Leadership is a vital function of management. It helps to direct an organization's resources toward improved efficiency and the achievement of goals. While leadership can be defined in many ways, it is best explained as the ability to motivate and inspire others through example, providing them with direction and being a source of inspiration for those under your authority. This template is designed for you to build the key skills of leadership. Leadership is important for the success of any organization. This template will help you identify your leadership strengths and how to use them.


20 slides
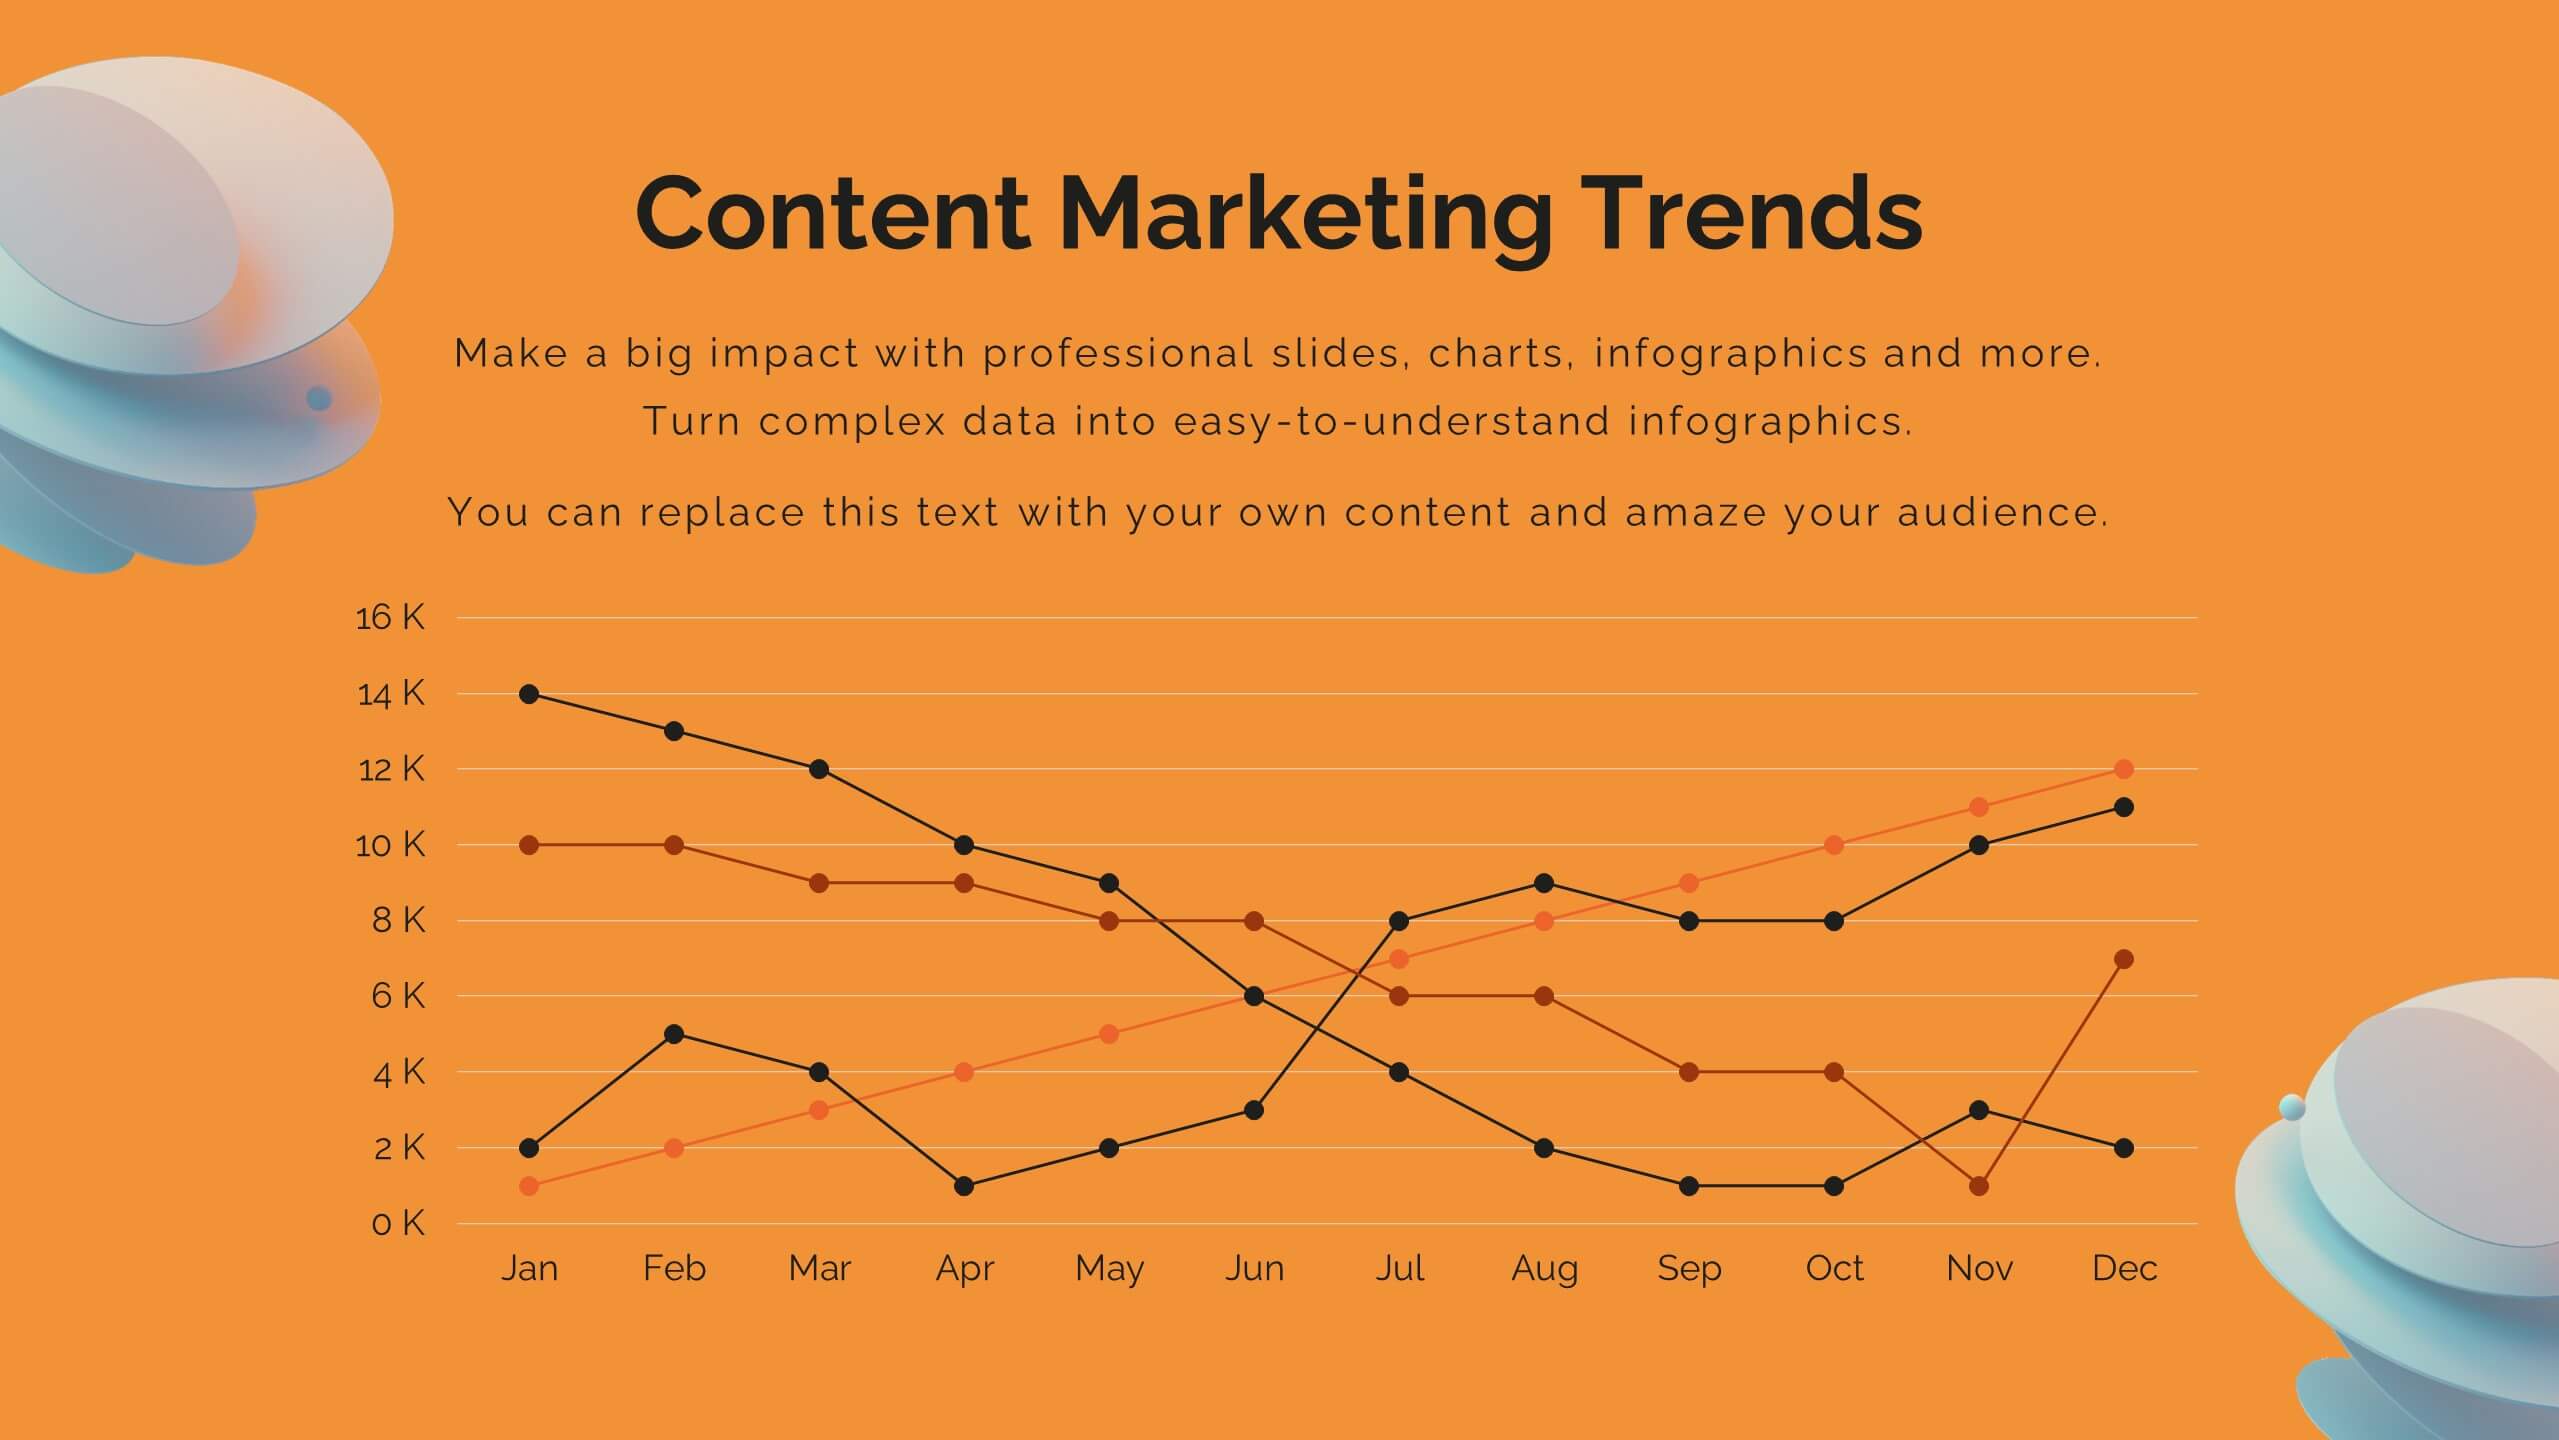
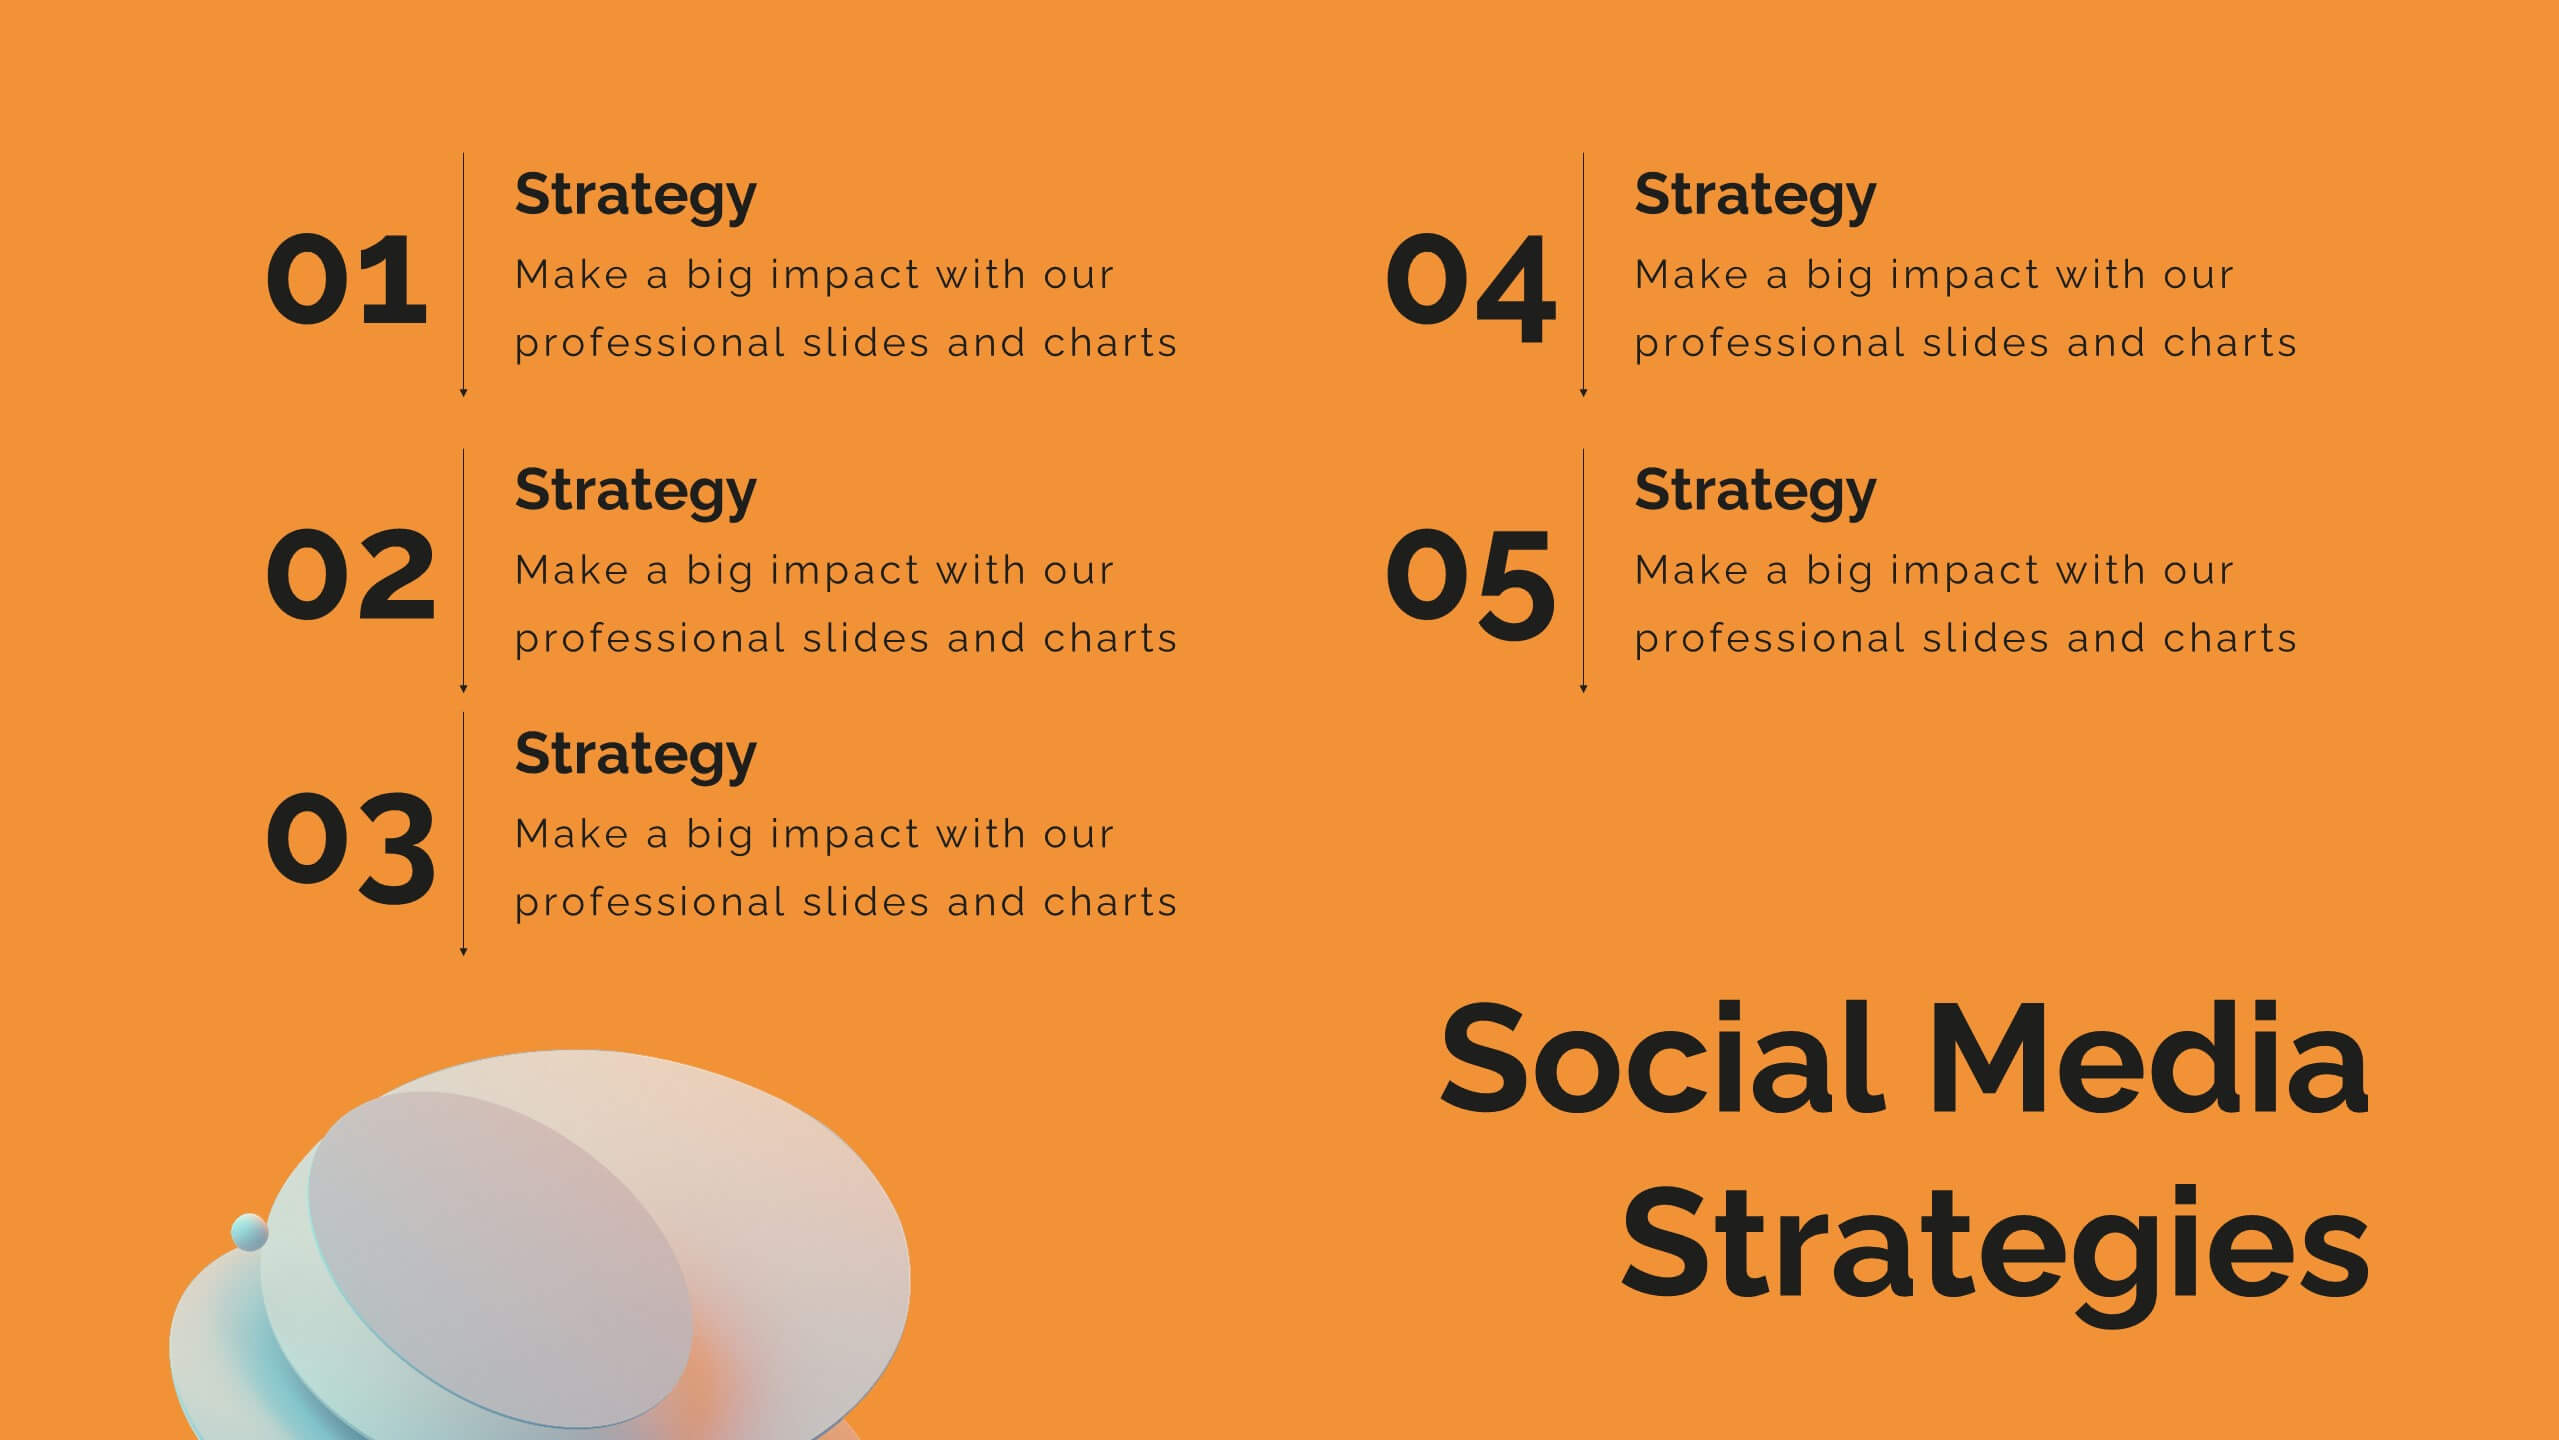
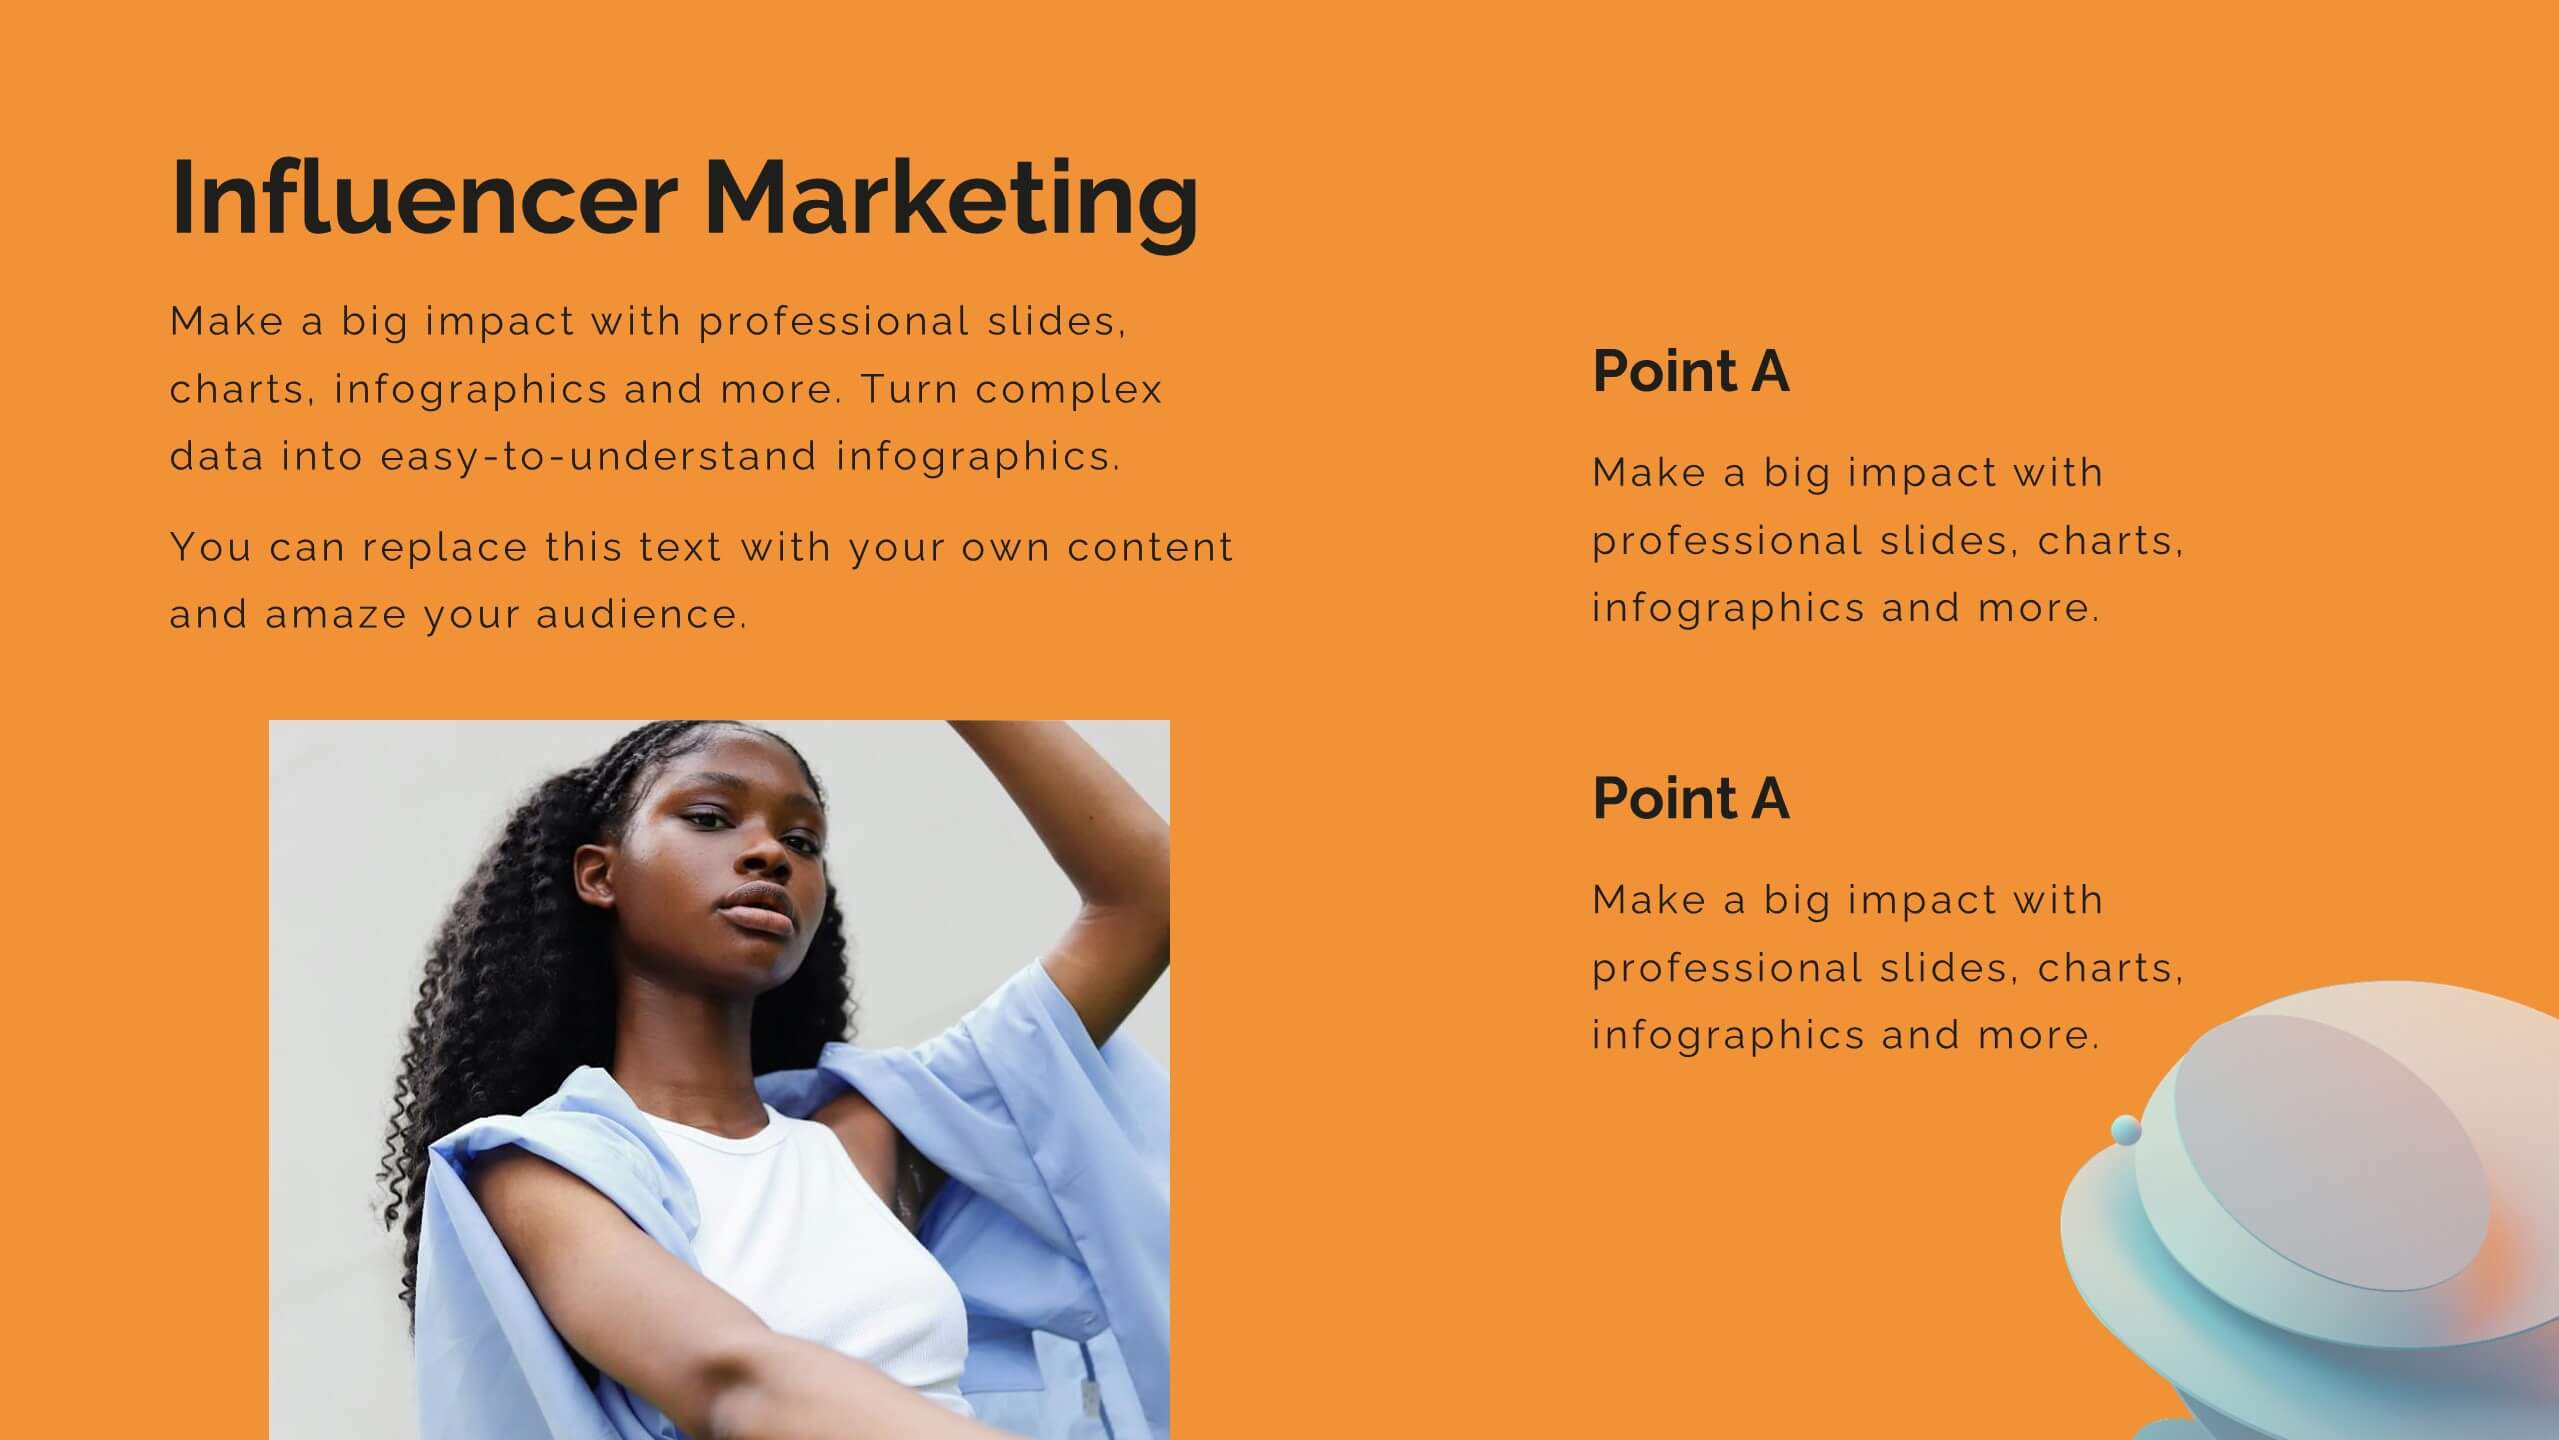
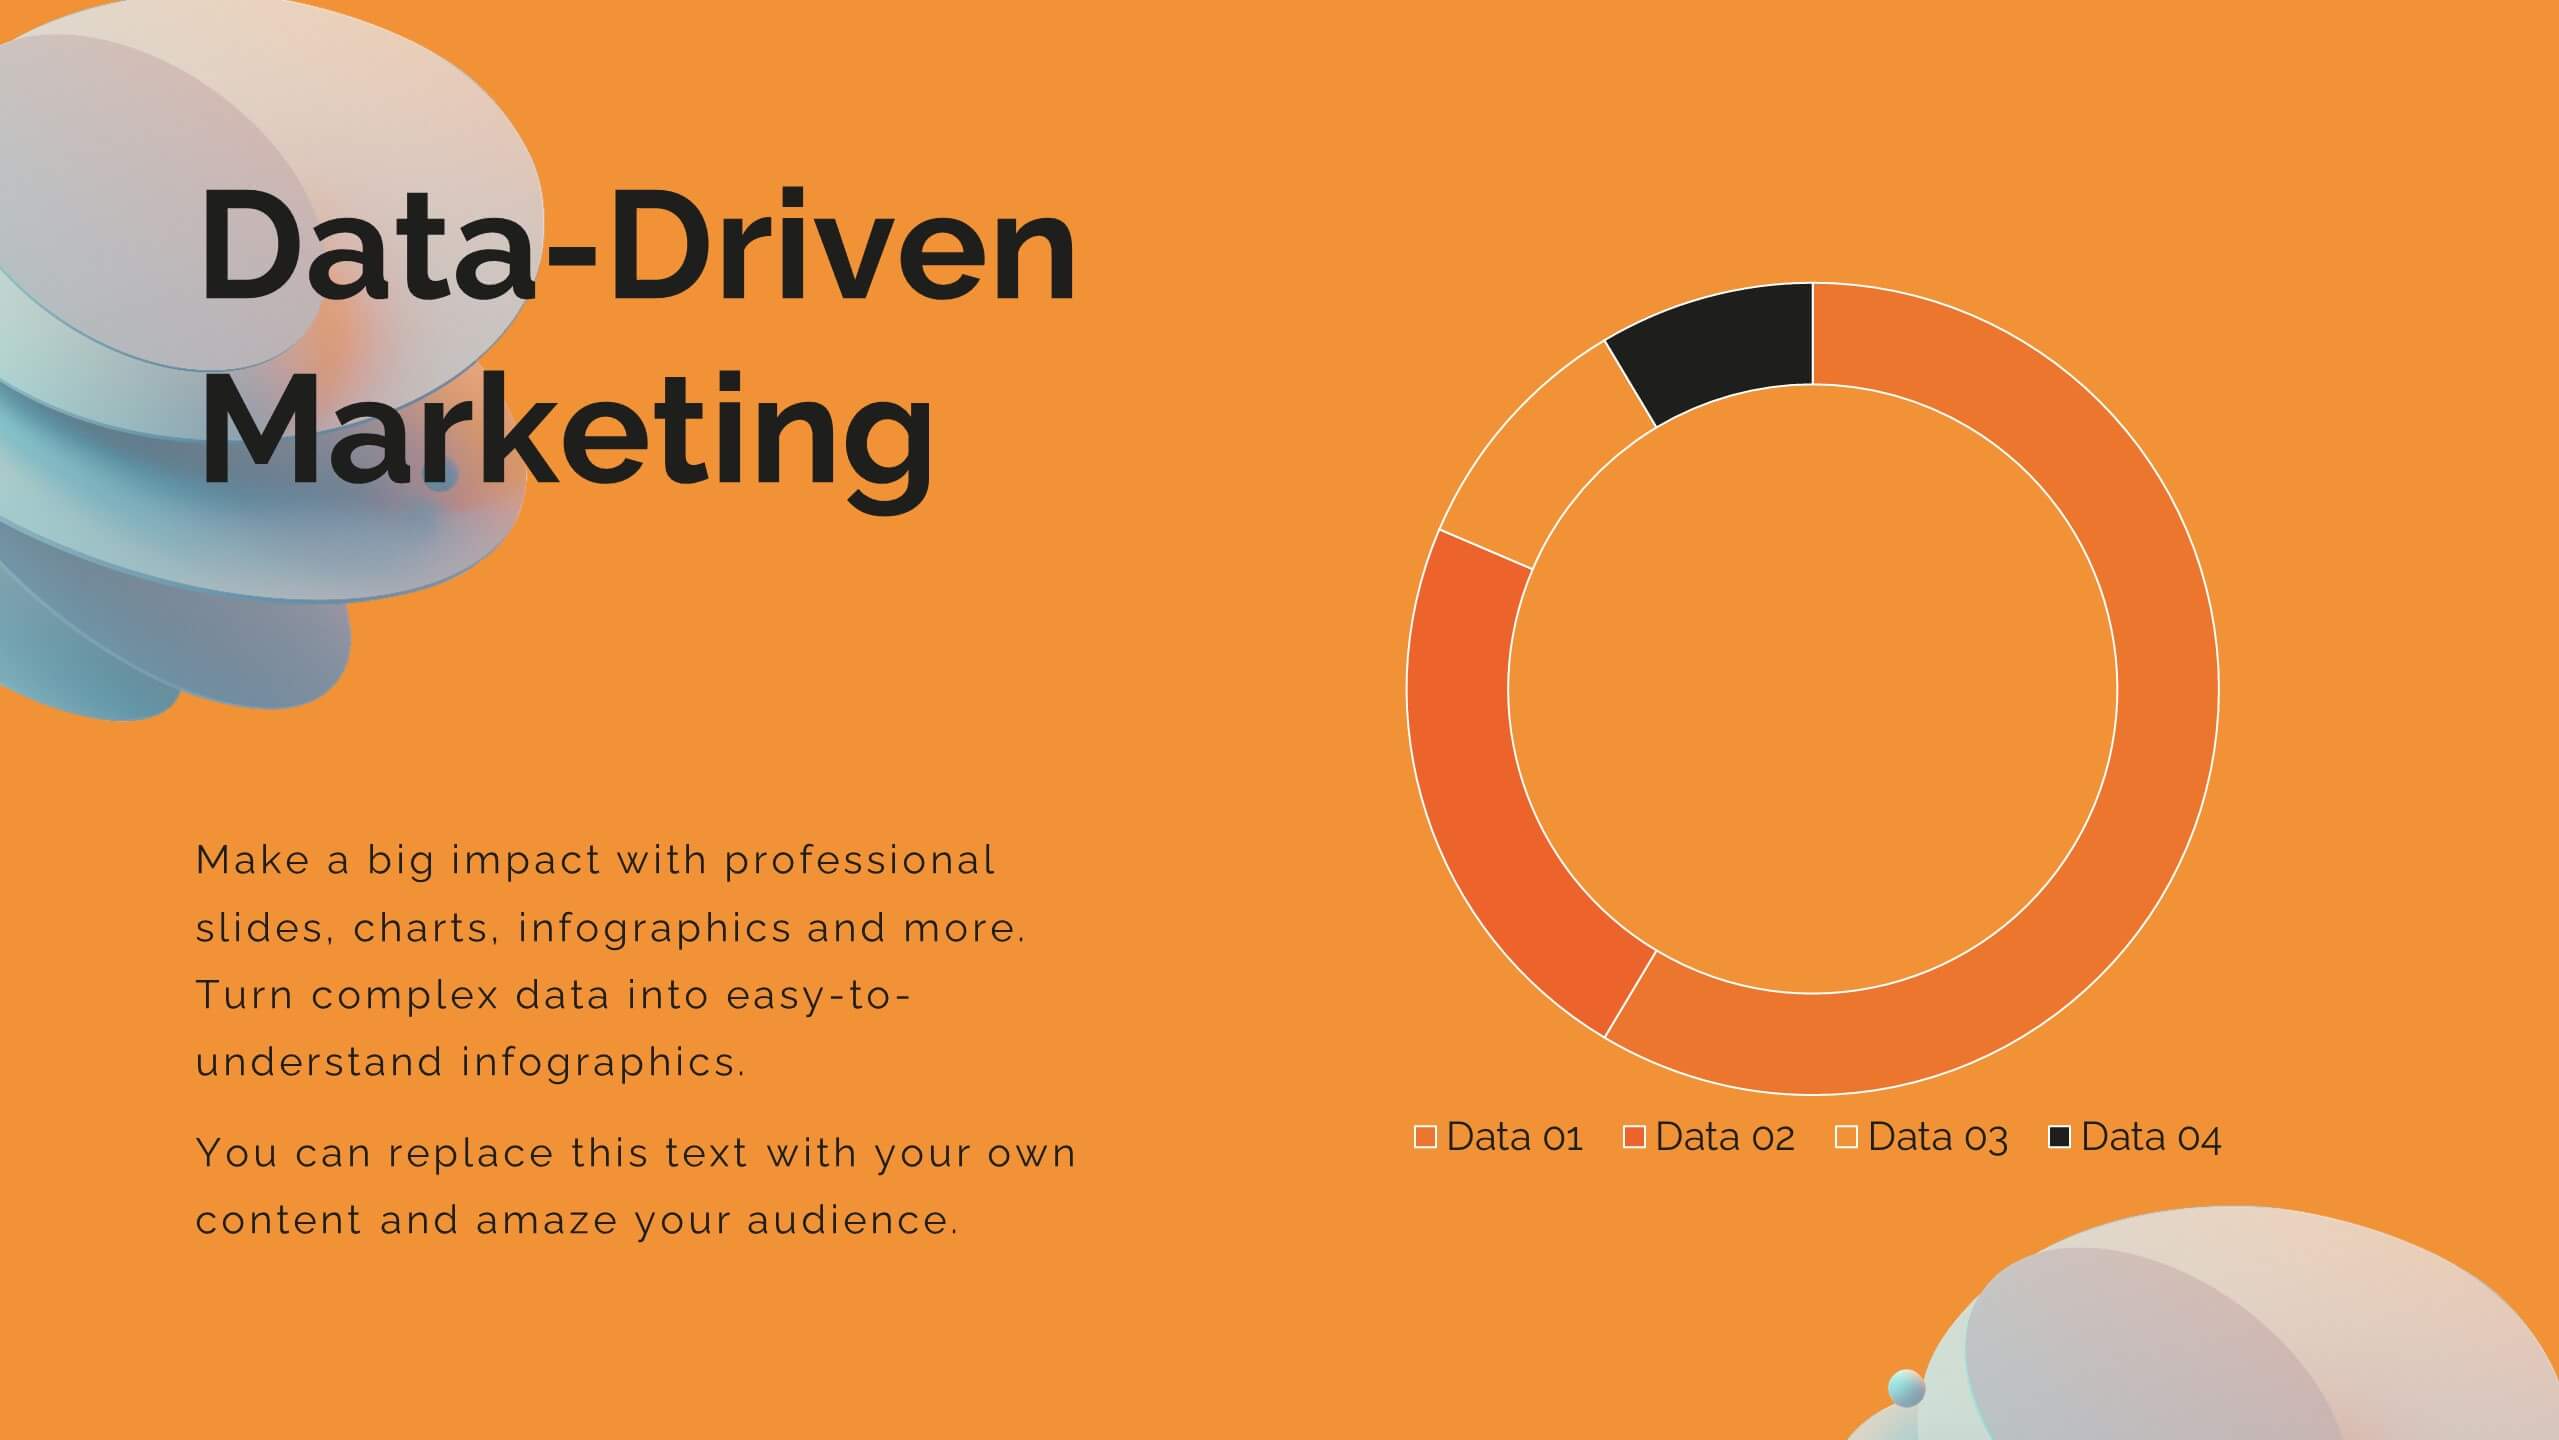
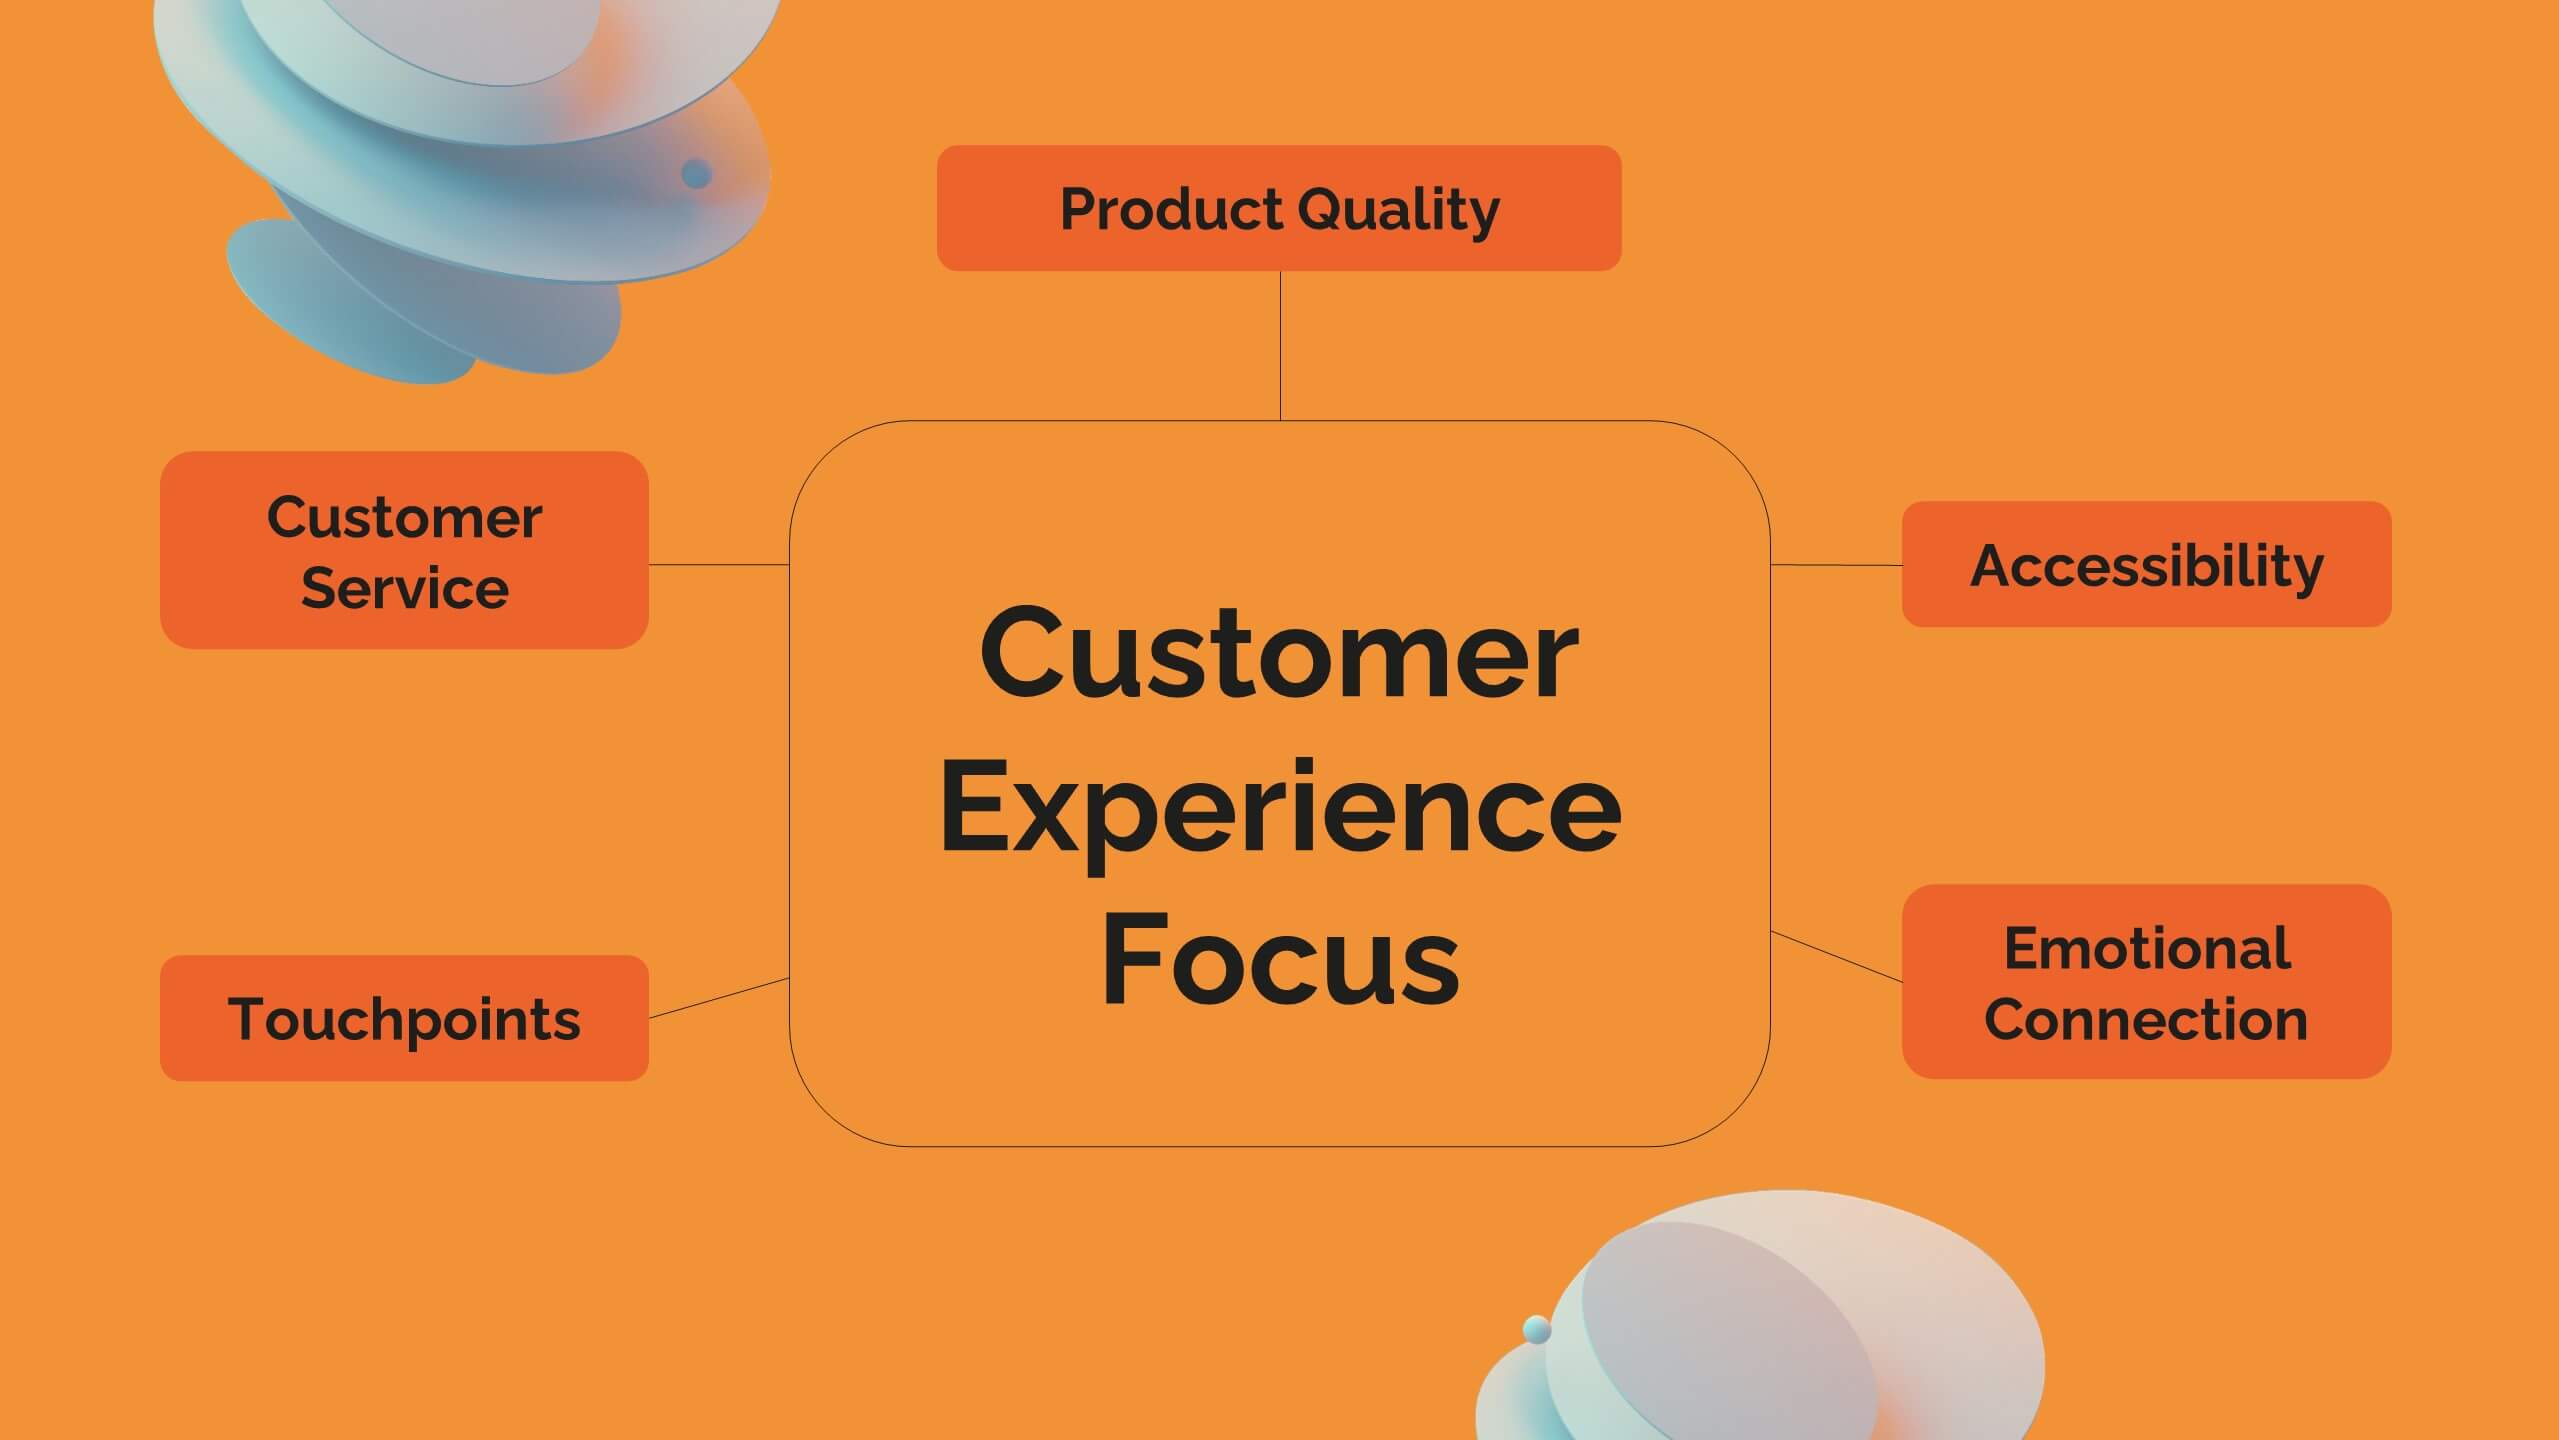
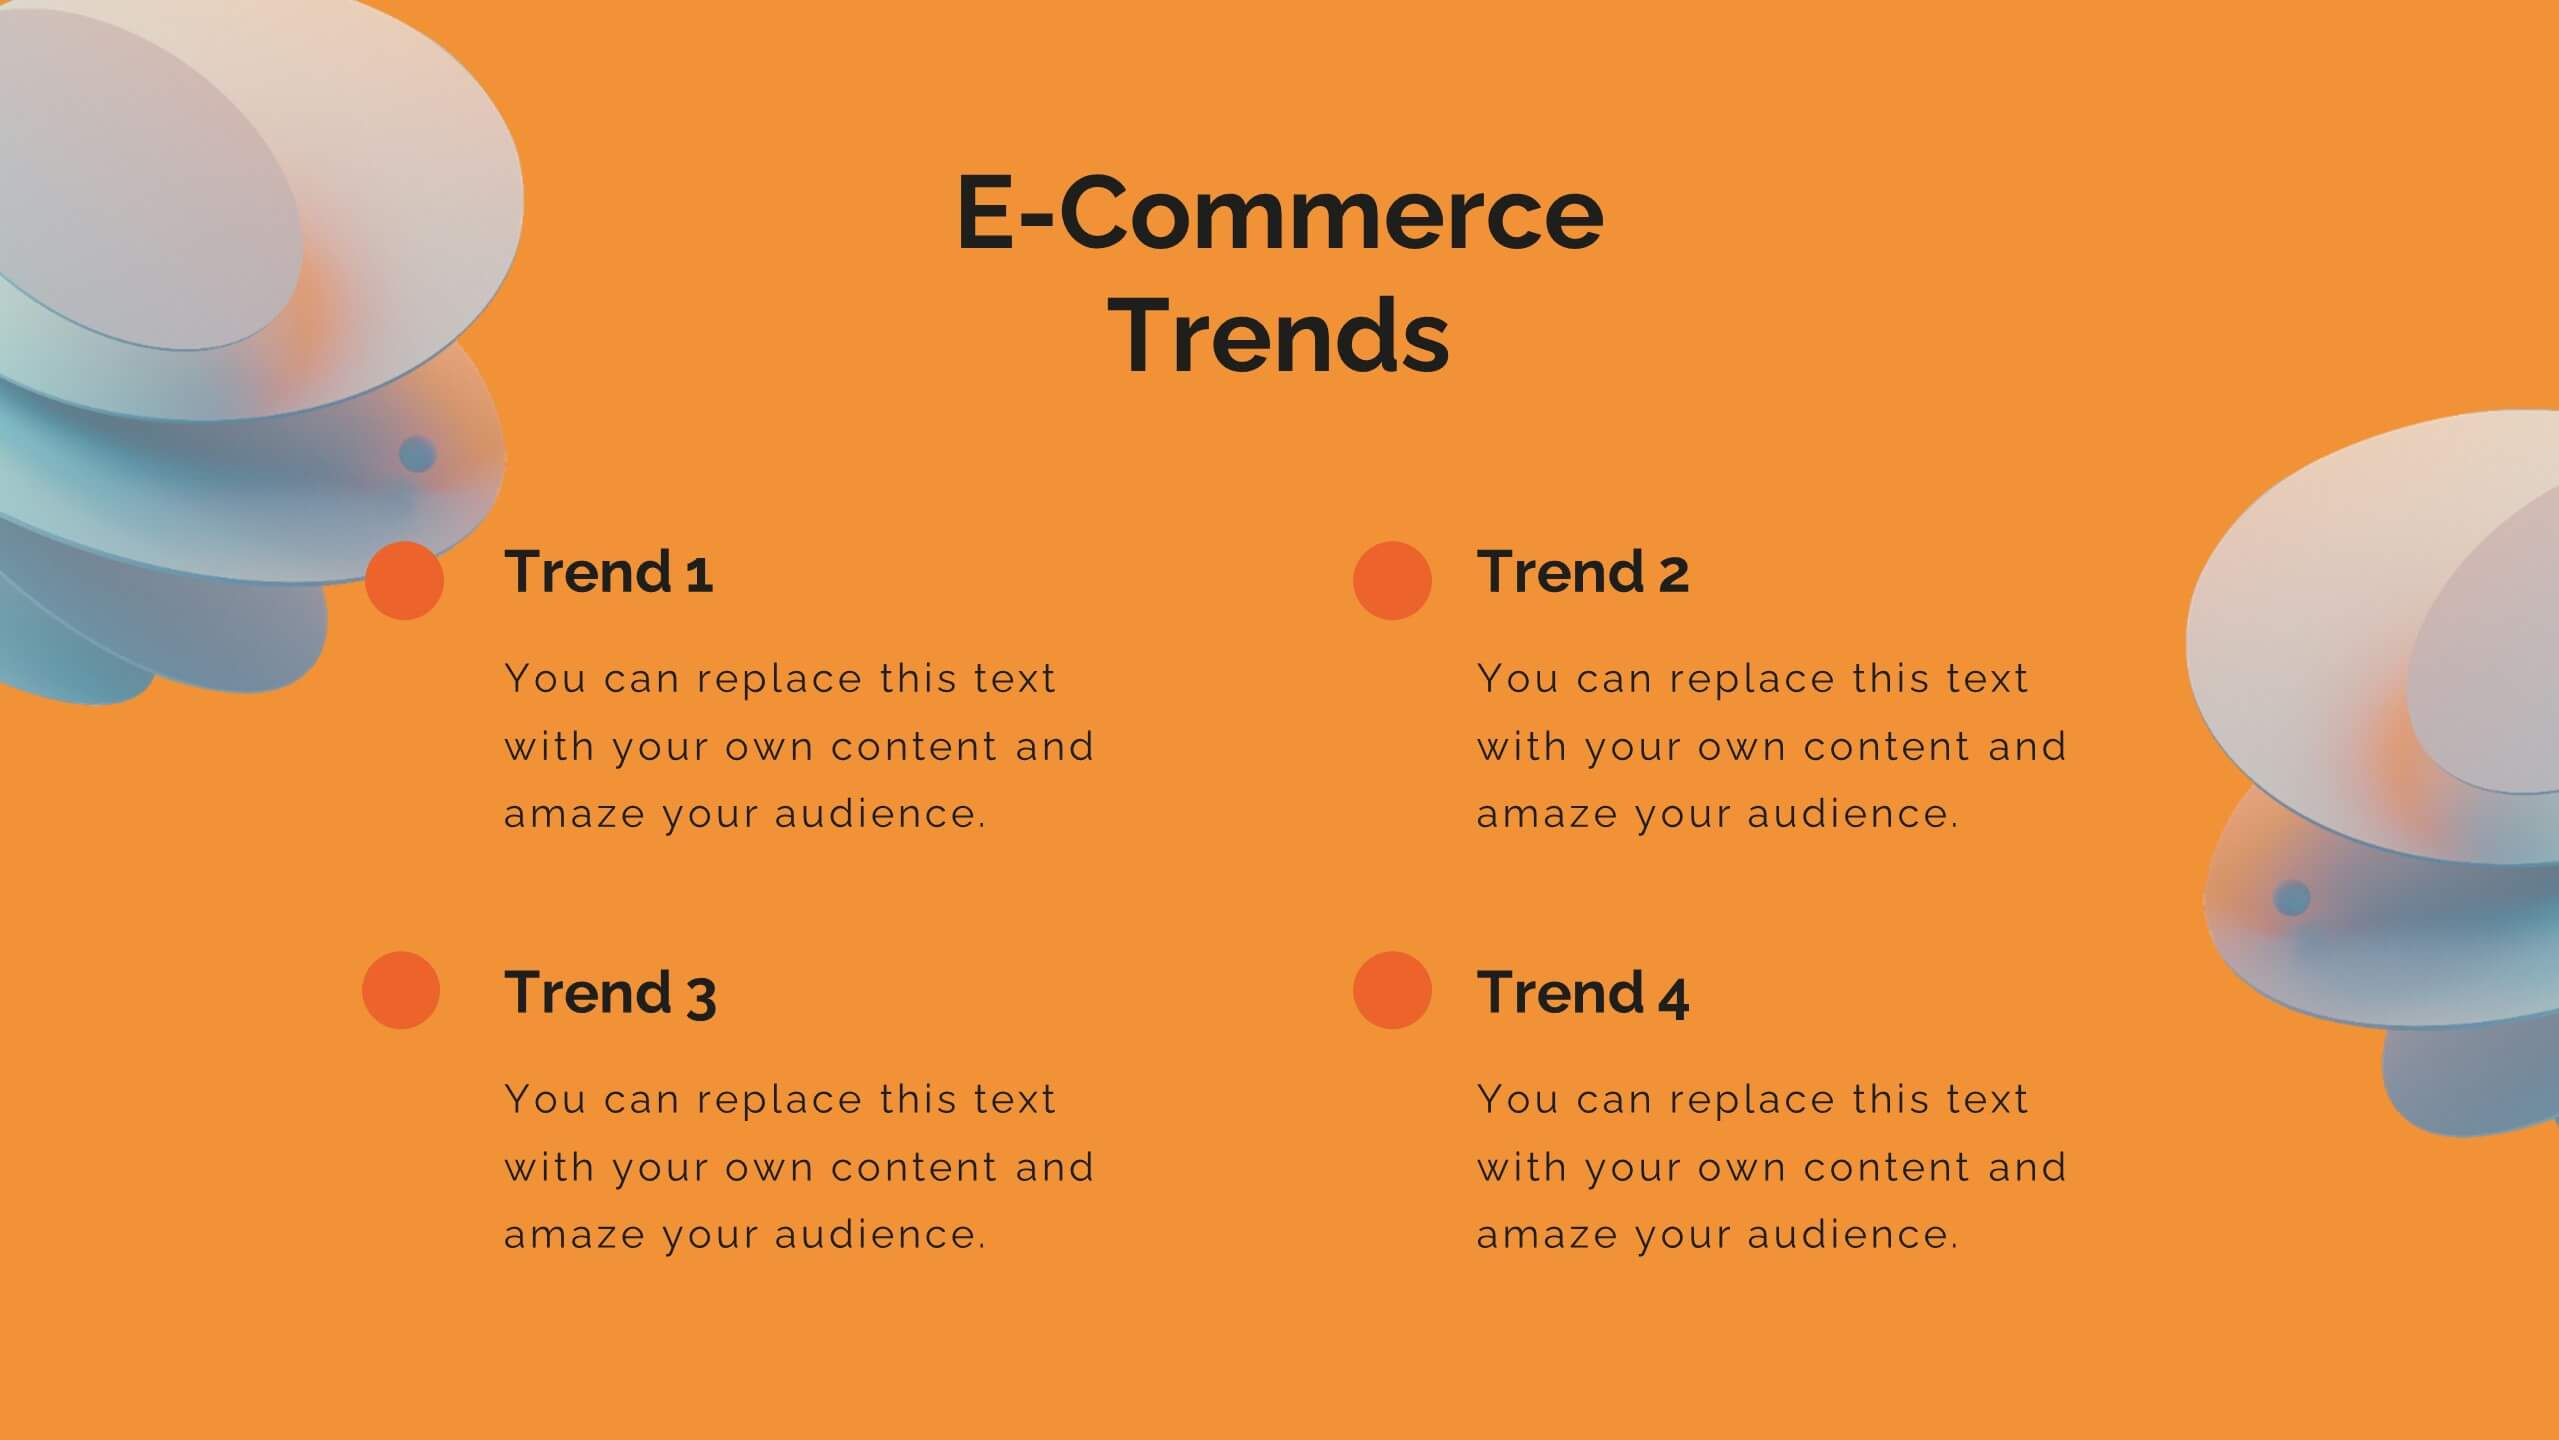
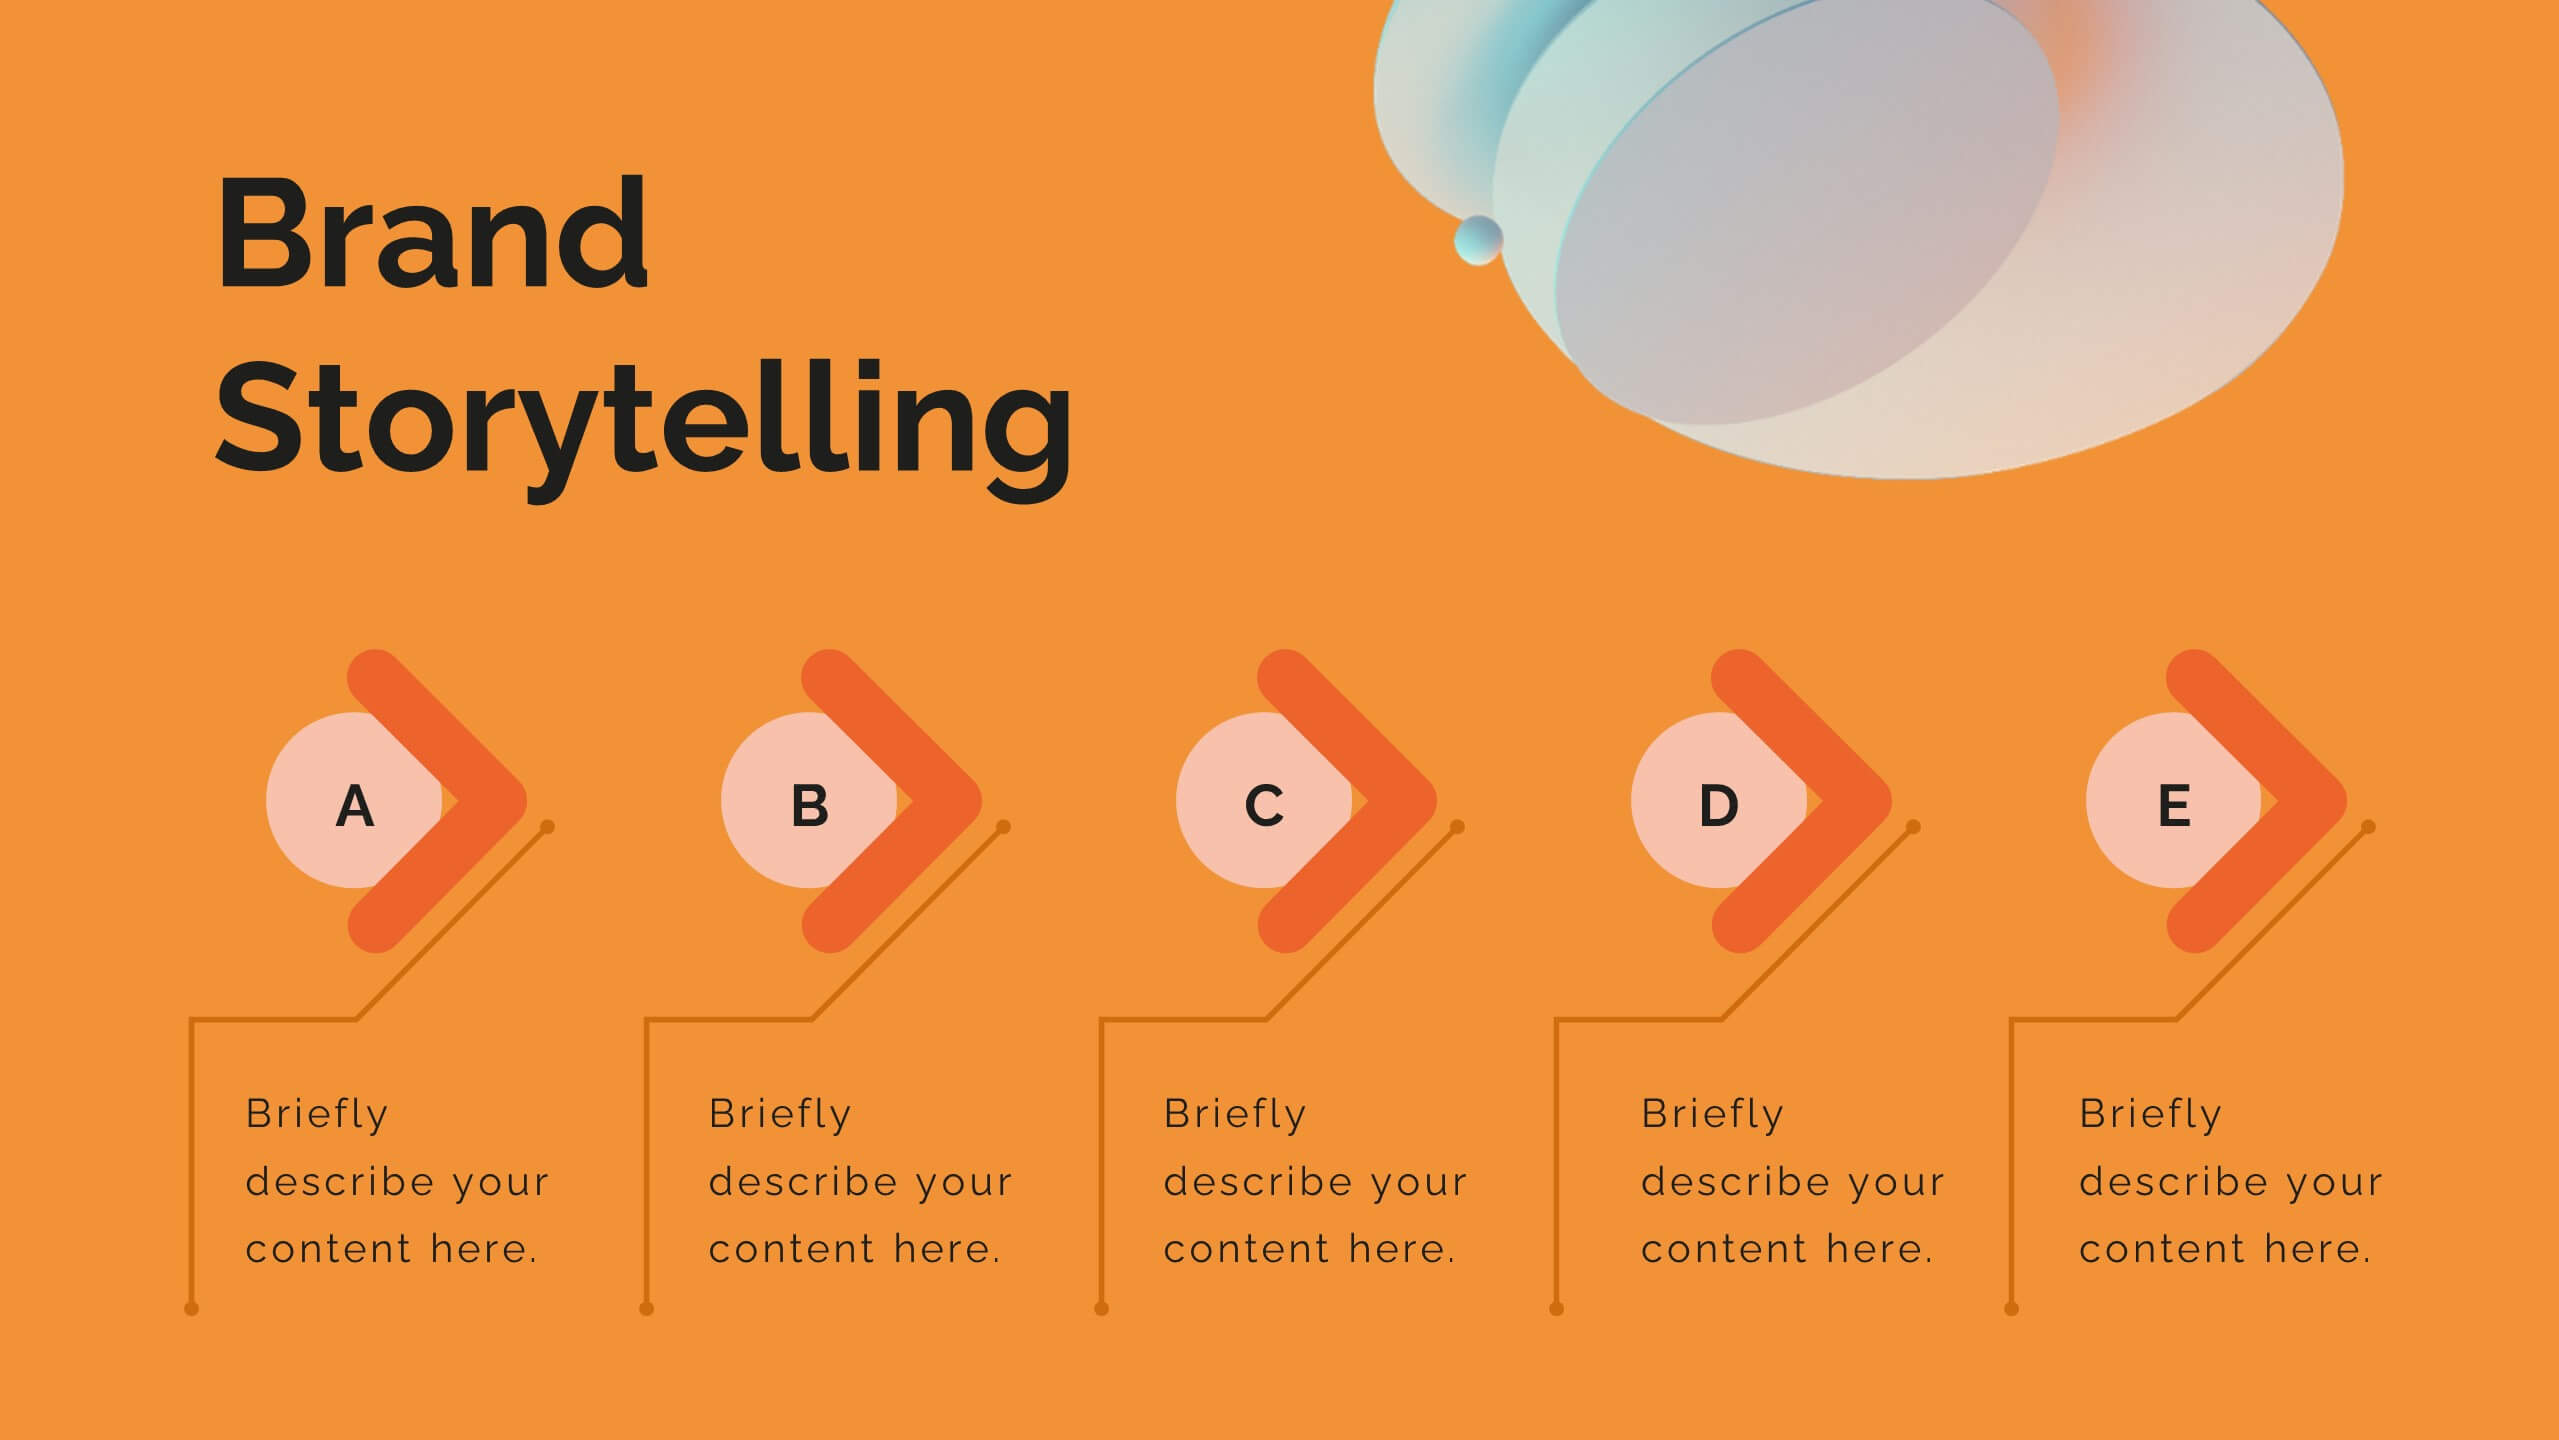
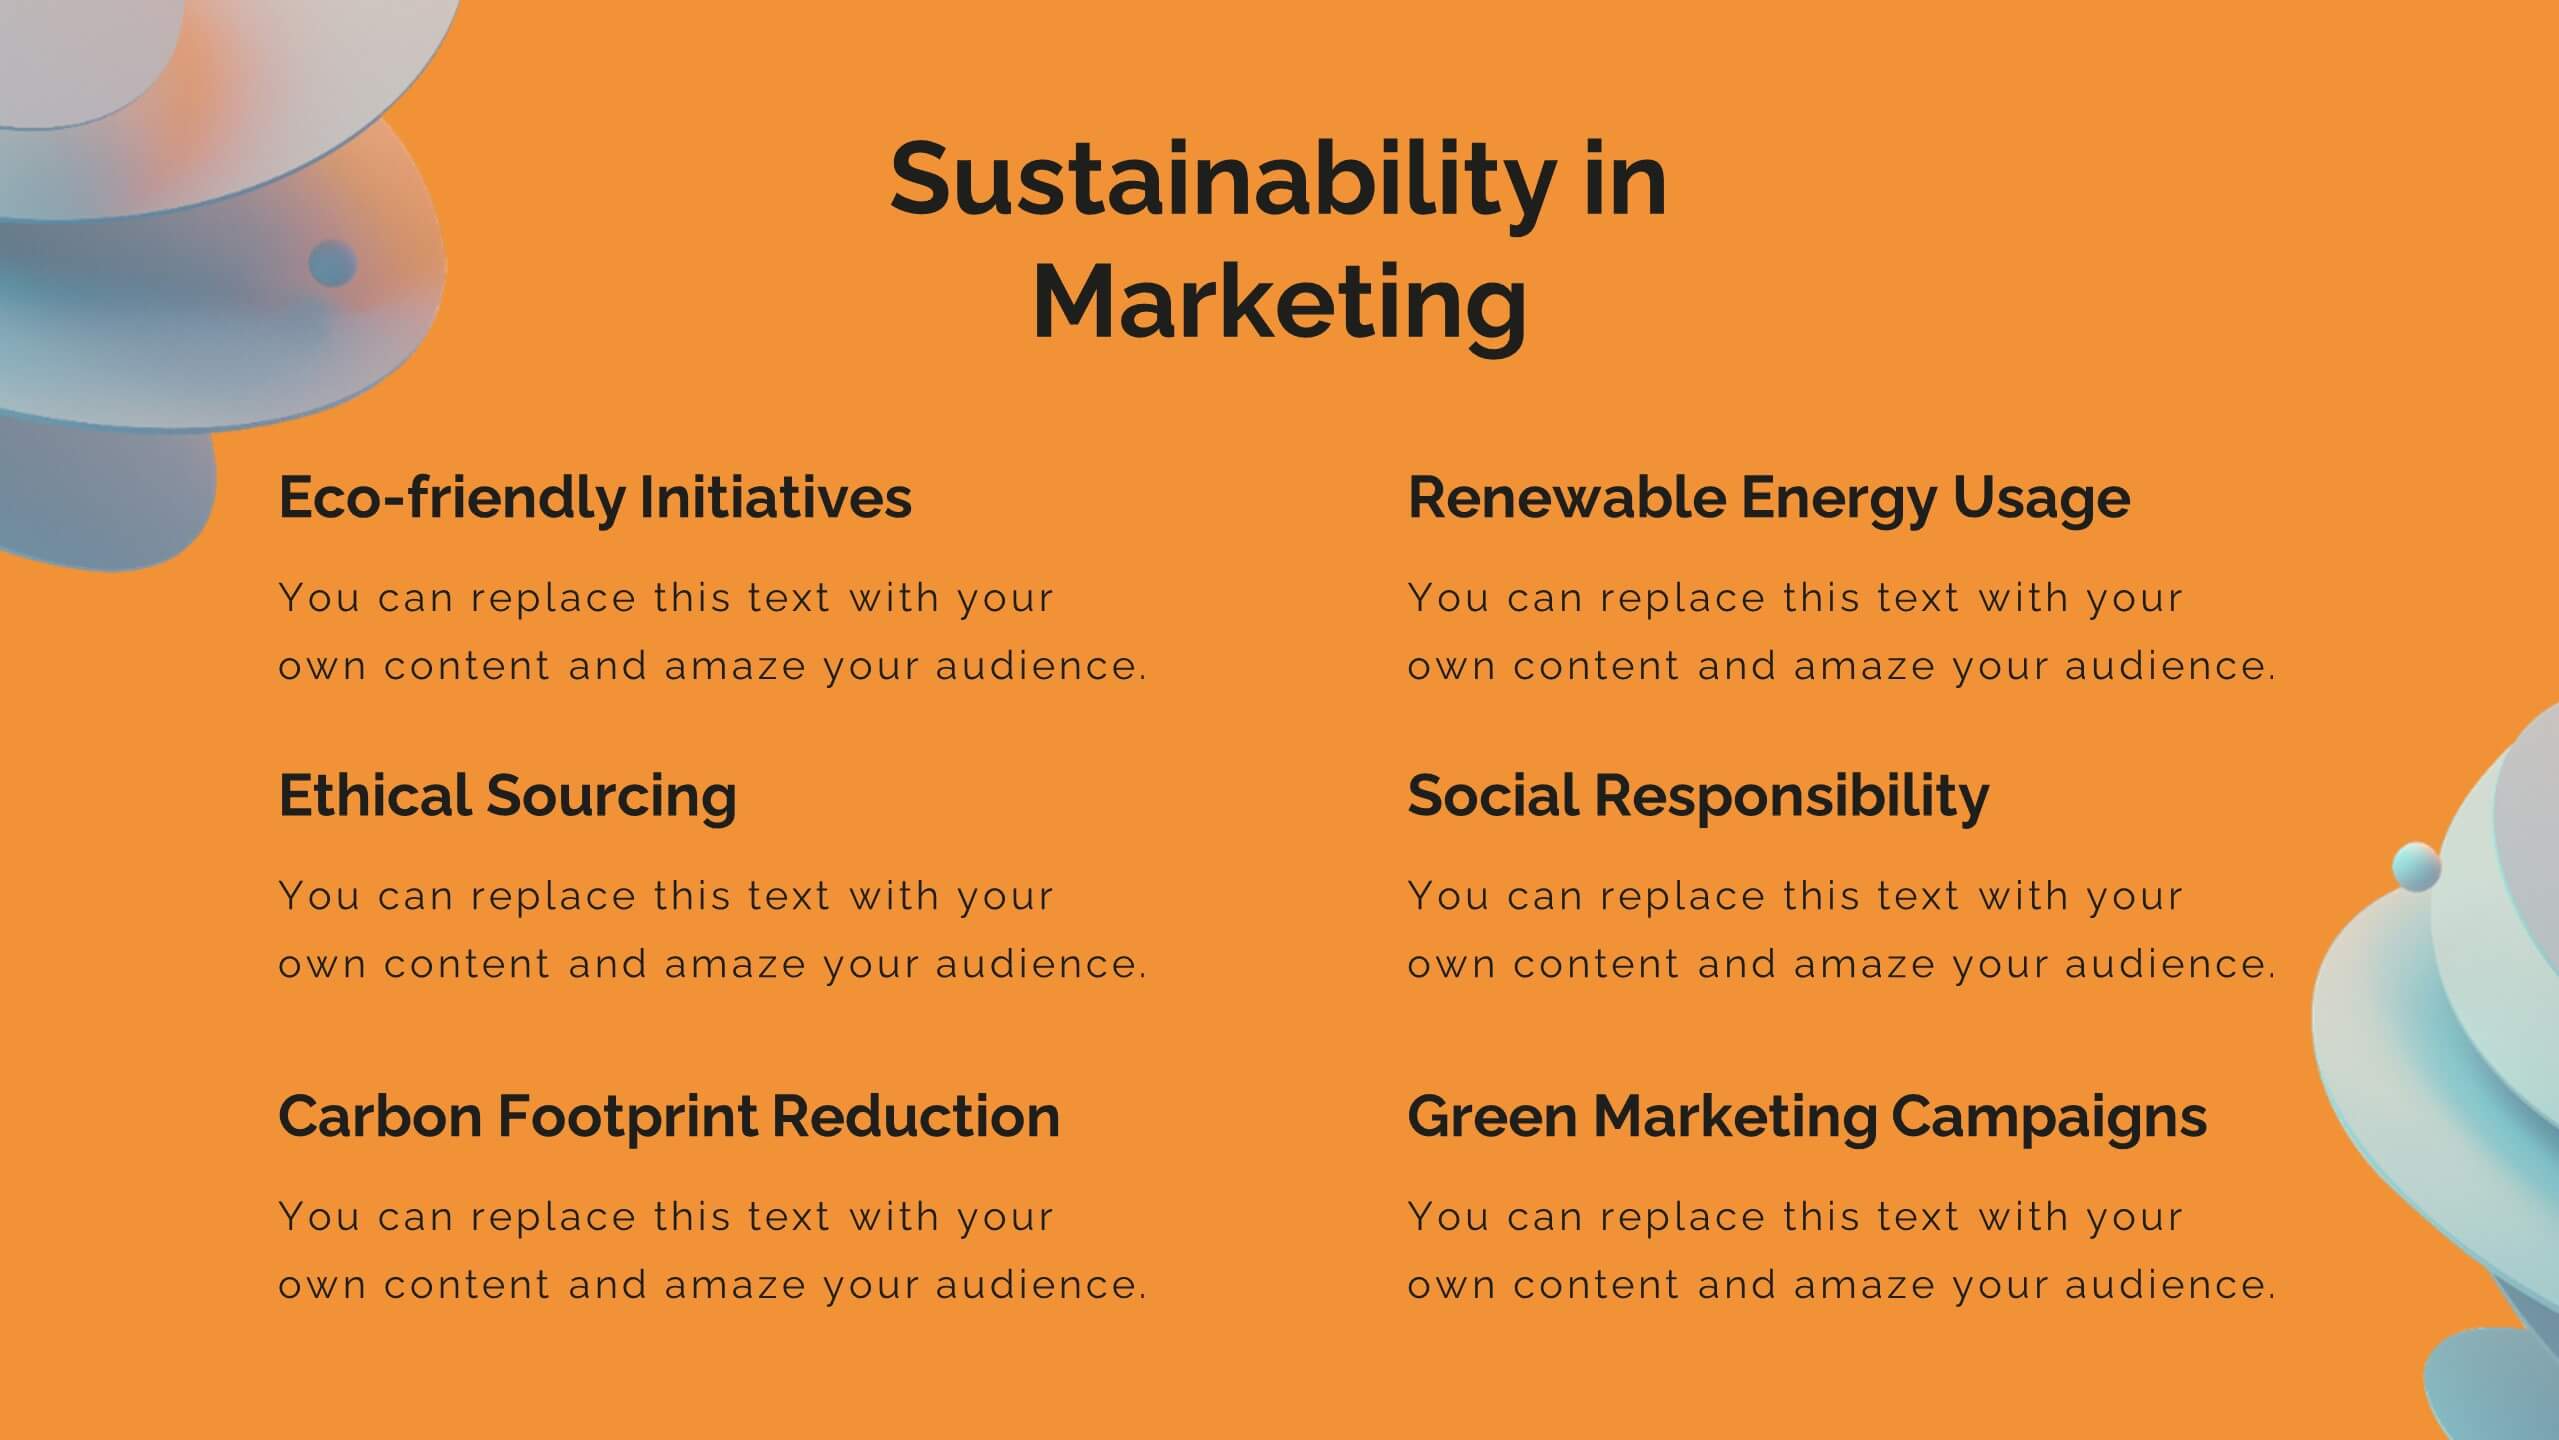
Breeze Content Marketing Pitch Deck Presentation
Elevate your content marketing strategy with this vibrant pitch deck! Perfect for outlining industry trends, consumer behavior, and innovative techniques. Ideal for marketers aiming to impress clients and stakeholders. Compatible with PowerPoint, Keynote, and Google Slides, this template ensures your pitch is engaging, persuasive, and professional. Achieve marketing success today!


5 slides
Movies & Film Market Infographics
Step into the spotlight with our movies & film market infographics, designed to orchestrate your data into a cinematic experience. In the enchanting hues of blue and purple, this template captures the essence of the big screen, offering a vertical layout that resonates with the the film industry. It's a tool for film marketers, and cinema analysts, providing a platform to depict trends, and reviews with a touch of Hollywood style. The set includes captivating graphics, themed icons, and adaptable image placeholders, all curated to help you direct your audience's attention to key insights in the ever-evolving realm of movies and entertainment.


7 slides
Technology Consulting Infographic
Technology consulting, also known as IT consulting or tech consulting, involves providing expert advice and guidance to organizations regarding their technology strategy, utilization, and optimization. This infographic template provides a compelling way to illustrate complex concepts, strategies, and data related to technology consulting. Fully customizable and compatible with Powerpoint, Keynote, and Google Slides. The sleek, modern design reflects the cutting-edge nature of technology and consulting services. This infographic is your go-to tool for creating presentations that showcase your technology consulting expertise.


7 slides
Africa Map Infographic Presentation Template
The African continent is home to a great deal of linguistic and cultural diversity. Africa has approximately one-third of the world's languages. There are at least seventy-five African languages with more than one million speakers. The diversity of Africa's languages is evidenced by their populations. This template features fully editable vector shapes of countries, national flags and lines to highlight routes across this diverse continent. Use this Africa map template to illustrate the countries of Africa and their borders. You can easily add information, such as other icons in the blank spaces.


2 slides
Corporate Identity and Services Overview Presentation
Clearly showcase your company’s offerings with the Corporate Identity and Services Overview Presentation. This modern, minimalist layout is ideal for highlighting key services, team roles, or business pillars with clarity and visual appeal. Fully editable in Canva, PowerPoint, and Google Slides for quick customization and professional results.


21 slides
Terraflare Project Status Report Presentation
Keep stakeholders updated with this comprehensive project status report template, featuring agenda, key highlights, performance metrics, project progress, risk assessments, and goals. Easily track progress, strategic initiatives, and team productivity. Perfect for PowerPoint, Keynote, and Google Slides, ensuring clear communication of project updates and priorities.


4 slides
Athletic Event Planning and Scoring Presentation
Plan, organize, and present sports events with the Athletic Event Planning and Scoring template. Featuring a pyramid layout with sports icons, clear section labels, and bold color accents, it’s perfect for scheduling, rules, and scoring breakdowns. Fully editable in Canva, PowerPoint, and Google Slides to match your event’s theme and branding.


6 slides
Agile Project Management Infographic
Agile methodology is an iterative and collaborative approach to project management and software development. This infographic template outlines the key principles and practices of the Agile project management approach. This template is designed to help project managers, teams, and stakeholders understand and implement Agile methodologies for efficient and collaborative project delivery. This serves as a comprehensive guide to understanding and implementing Agile methodologies in project management. It presents the key principles, frameworks, practices, and benefits of Agile in a visually engaging and easy-to-understand format.


2 slides
Engaging Opening Introduction Presentation
Make a lasting first impression with this Engaging Opening Introduction Slide. Designed for professional presentations, networking events, and business pitches, this slide offers a modern, structured layout with a dynamic image section and clear text area. Fully customizable in PowerPoint, Keynote, and Google Slides, you can easily adjust colors, fonts, and content to match your brand.


4 slides
High-Performance Team Collaboration Presentation
Showcase teamwork, trust, and synergy with this bold, interconnected arms graphic. Ideal for illustrating roles, partnerships, or team frameworks, this infographic is perfect for leadership, HR, or corporate strategy slides. Fully customizable in PowerPoint, Keynote, and Google Slides.


4 slides
Commonly Asked Questions Analysis Presentation
Simplify and clarify key topics using this FAQ-style layout, ideal for addressing top customer or stakeholder questions. With a clean lightbulb design and three-part structure, this template keeps content digestible and professional. Fully editable in Canva, PowerPoint, or Google Slides—perfect for onboarding, reports, or support documentation.


8 slides
Value Creation Strategy
Present your strategic pillars with clarity using this linear, milestone-style layout. Ideal for business consultants, growth strategists, and product teams aiming to showcase value drivers, innovation stages, or competitive differentiators. Fully editable in PowerPoint, Keynote, and Google Slides—customize icons, colors, and text for a branded, professional finish.


12 slides
Visual Data Representation Bubble Map Presentation
Present complex data effectively with the Visual Data Representation Bubble Map presentation. This template organizes information into clear, interconnected segments, making it ideal for analytics, business insights, and strategic planning. Compatible with PowerPoint, Keynote, and Google Slides.


4 slides
Key Pillar Infographic Slide Presentation
Make your ideas stand tall with this modern pillar-themed infographic layout. Perfect for illustrating strategies, business foundations, or organizational principles, it transforms complex data into visually clear, structured visuals. Fully editable and compatible with PowerPoint, Keynote, and Google Slides for professional and easy-to-customize presentations.