


Features
- 10 Unique slides
- Fully editable and easy to edit in Microsoft Powerpoint, Keynote and Google Slides
- 16:9 widescreen layout
- Clean and professional designs
- Export to JPG, PDF or send by email


Do you have any questions?
Recommend


21 slides
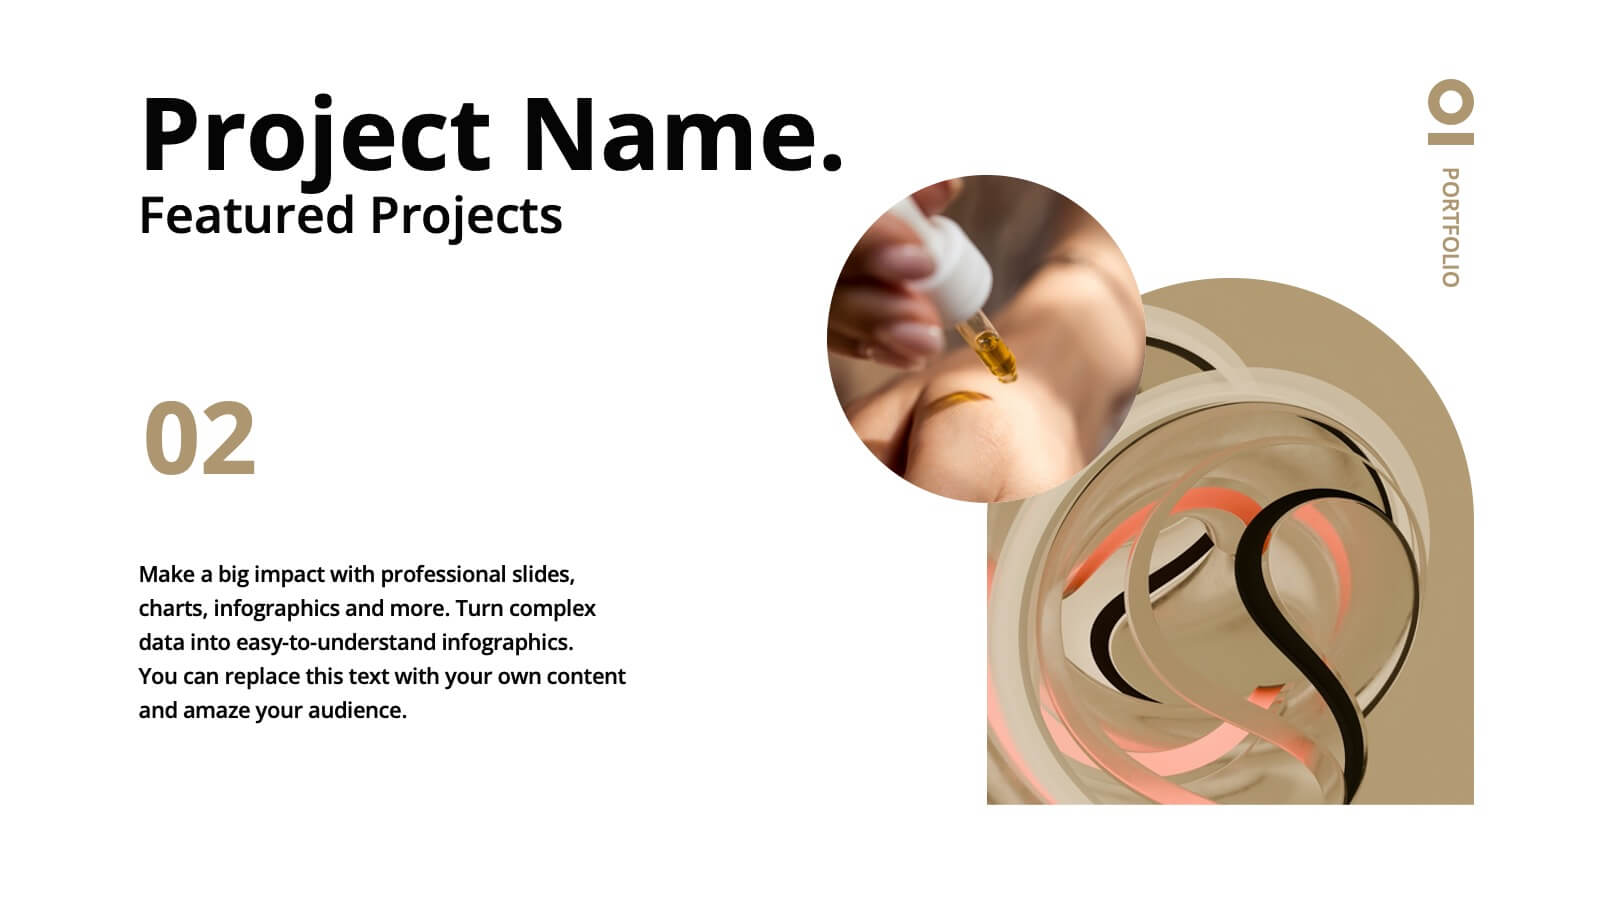
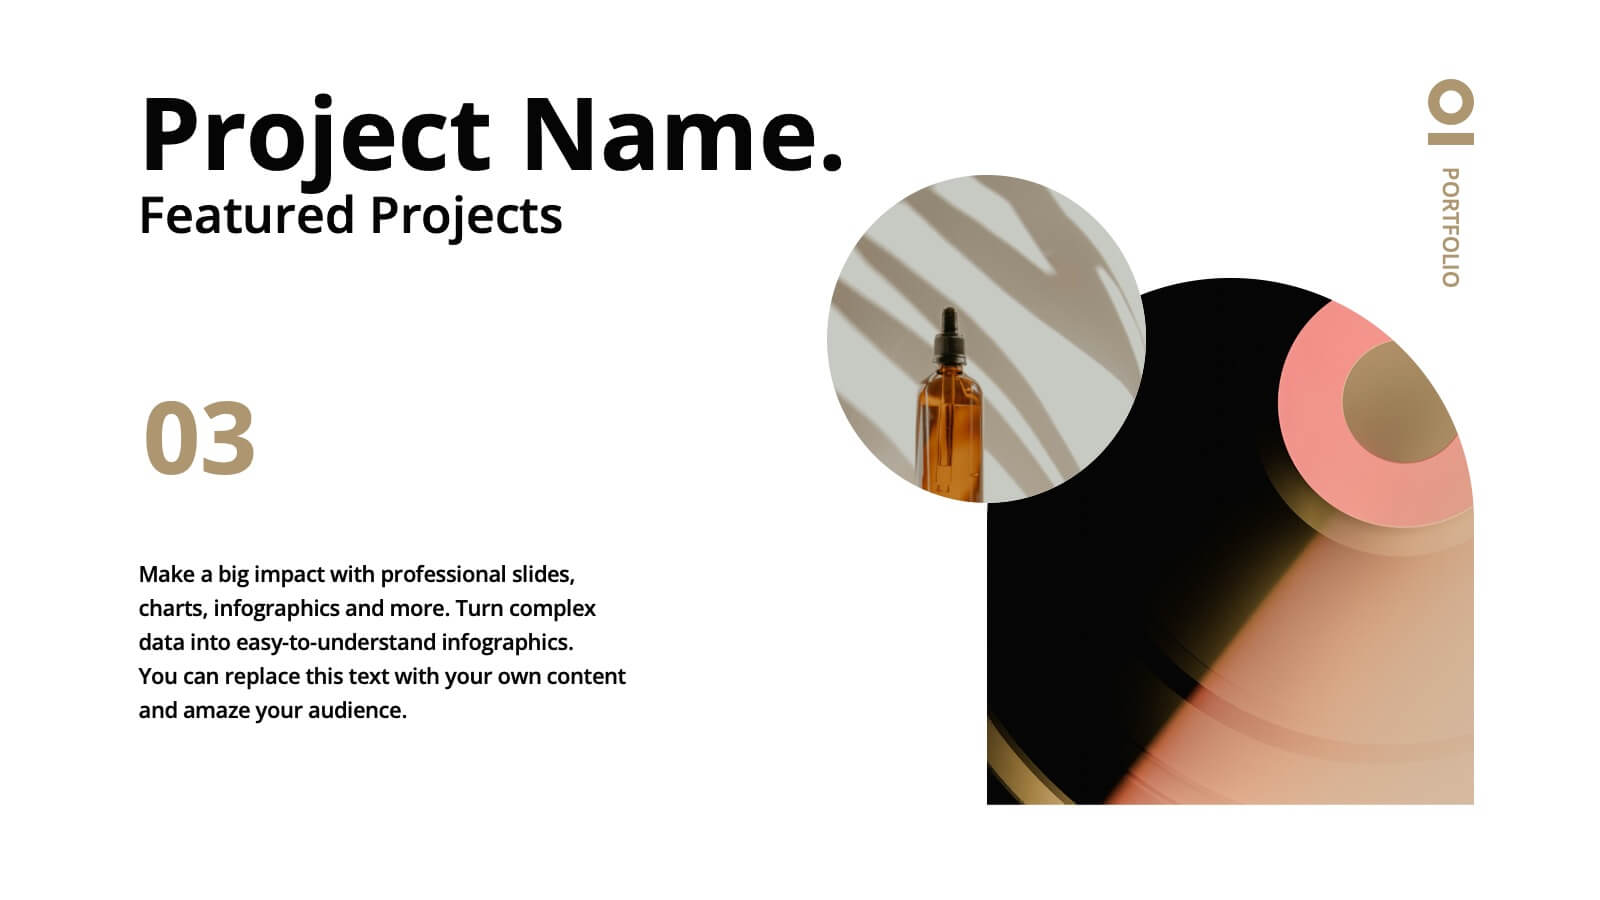
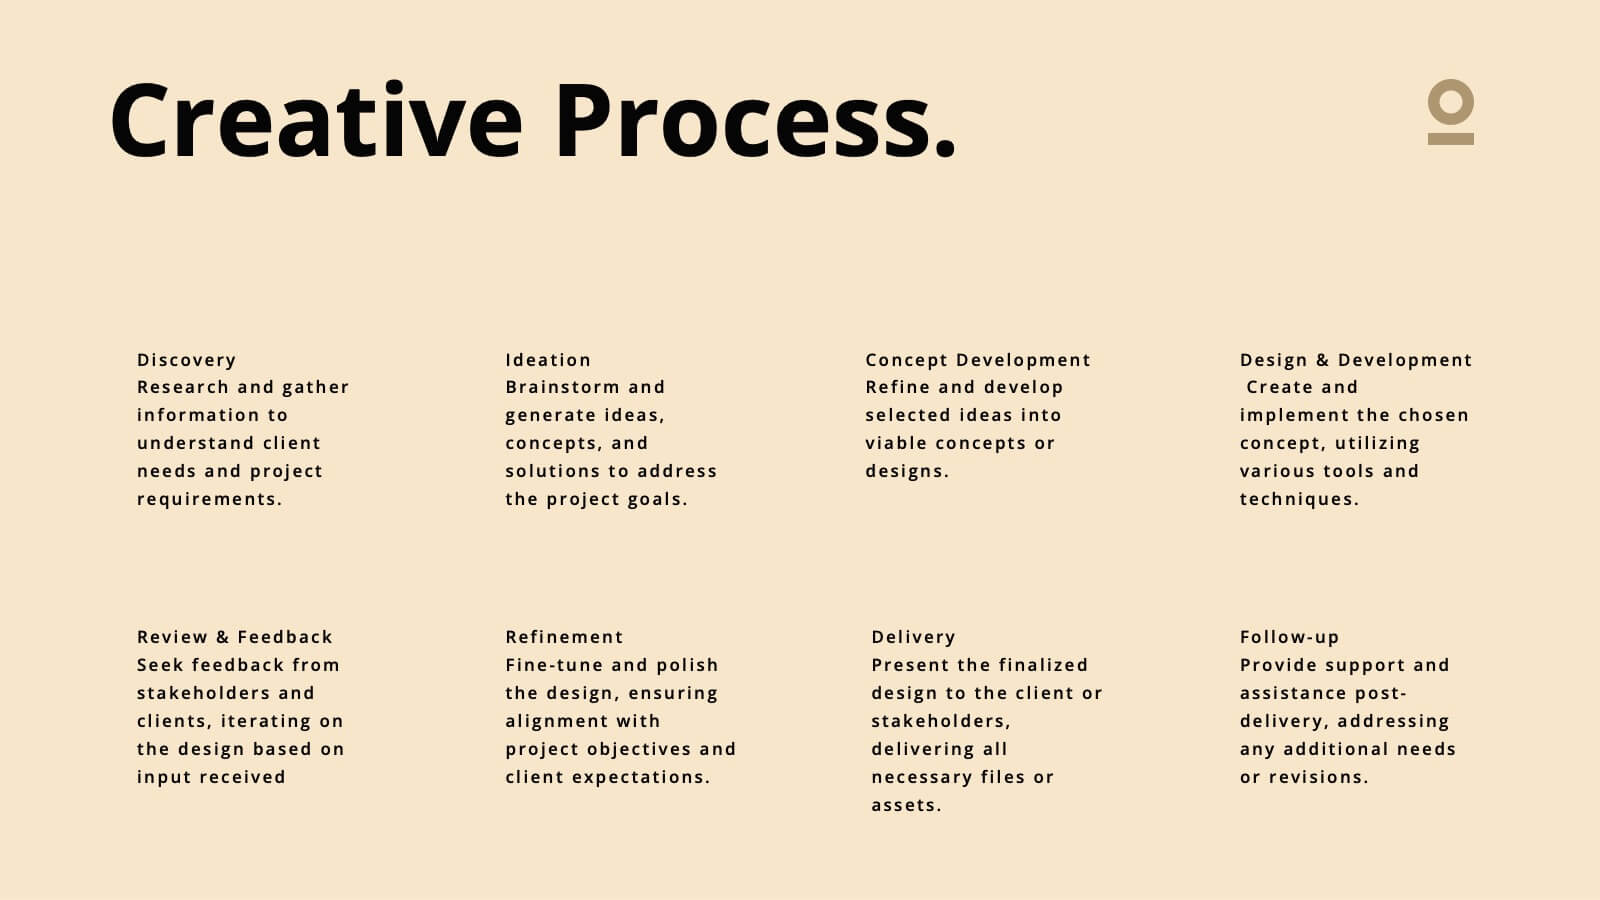
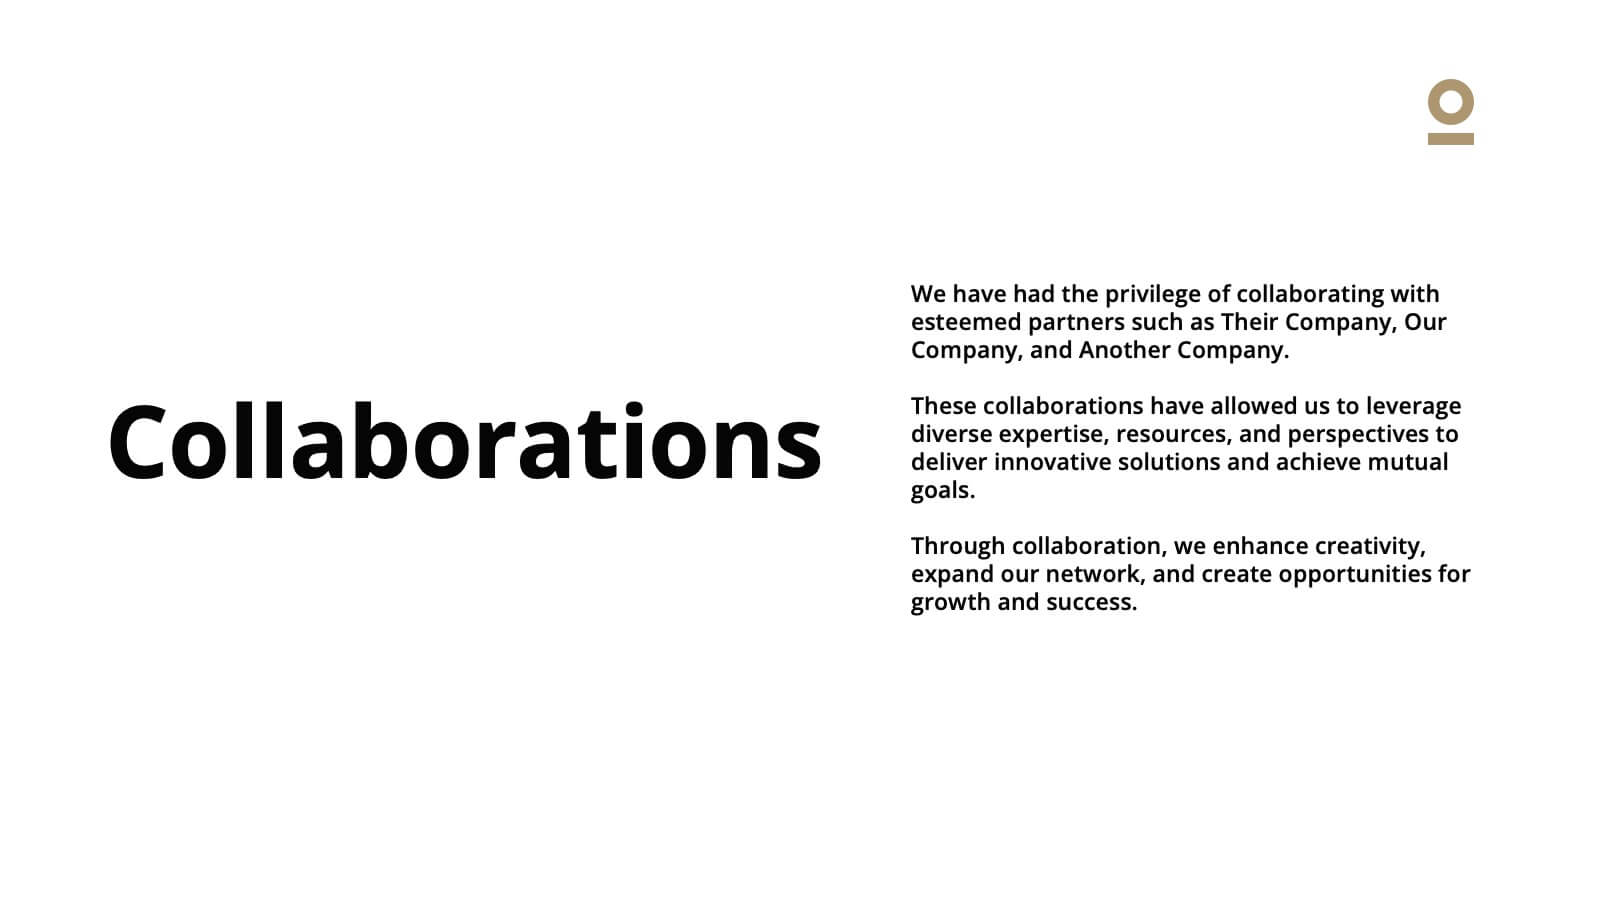
Haze Professional Portfolio Showcase Presentation
Elevate your professional presence with this stunning haze-inspired presentation template! Ideal for showcasing your portfolio, it beautifully highlights your skills, projects, and achievements with a clean and sophisticated design. This template ensures your work stands out, captivating potential clients and employers. Compatible with PowerPoint, Keynote, and Google Slides.


22 slides
Galileo Advertising Agency Proposal Presentation
Present your advertising agency’s capabilities with a proposal template designed to captivate and convince. This sleek and professional layout is perfect for agencies looking to showcase their services, team expertise, and strategic approach to clients. Highlight key sections such as your mission, client success stories, market analysis, and creative process, ensuring every detail is covered. Dive into campaign execution plans, resource allocation, and testimonials to build trust and credibility. Visualize your strategy development with data-driven slides and impactful case study layouts. Fully customizable in PowerPoint, Google Slides, and Keynote, this template is tailored for seamless editing to reflect your agency’s branding. The clean design, bold accents, and structured content make it ideal for pitches, client proposals, or business development meetings. Take your presentations to the next level and leave a lasting impression on potential clients.


20 slides
Vivid Product Development Plan Presentation
Develop your product with confidence using this detailed product development plan template! Perfect for outlining features, market analysis, and competitive advantages. Ideal for product managers and teams. Compatible with PowerPoint, Keynote, and Google Slides, this template ensures your plan is clear, professional, and comprehensive. Achieve product success today!


6 slides
Problem Analysis Infographic
These slides provide a structured and aesthetically pleasing approach for detailing problem analysis within a project or organizational context. Each slide incorporates various design elements that guide the viewer through the steps or layers of the problem, allowing for a comprehensive understanding and discussion. The use of soft color palettes and clear text placement ensures that the information is easily digestible. The diverse layouts cater to different aspects of problem analysis, from bullet points to diagrammatic representations, making these templates versatile for various presentation needs. These are ideal for presenting complex information in a straightforward manner to ensure clear communication of issues and strategies within team meetings or presentations to stakeholders. The flexibility of the design also allows for easy customization to suit specific project requirements or branding needs.


7 slides
Science Research Infographic
Science research, is a systematic and organized inquiry that aims to generate new knowledge, validate existing knowledge, or solve specific problems using scientific methods and principles. This infographic template aims to present your science research initiatives, achievements, and vision to the audience in an engaging and informative way. This is essential to convey complex scientific data and discoveries in a visually appealing manner. Fully customizable and compatible with Powerpoint, Keynote, and Google Slides. Adapt and personalize the content to align with your specific research center's focus and mission.


5 slides
Science Branches Infographics
Science is a vast and diverse field that encompasses several branches or disciplines, each focusing on different aspects of the natural world, physical phenomena, and the study of living organisms. These infographic templates are perfect for presenting the diverse fields of science and their significant contributions to our understanding of the world. Use these infographics to deliver a presentation on science education, scientific research, or the interdisciplinary nature of science. This template will help you visually communicate the information, engage your audience, and create an impactful presentation experience.


6 slides
Supply Chain Management Strategy
Navigate your next big idea with a flow that’s clear, visual, and sharp. This presentation template breaks down key business logistics and process steps into a bold, easy-to-follow infographic layout. Ideal for showcasing strategic planning and operational structure, it's fully compatible with PowerPoint, Keynote, and Google Slides for effortless use.


5 slides
Future of 5G Technology Infographics
Embrace the telecommunications revolution with the future of 5G technology infographics template. This vibrant, creatively styled vertical layout is designed to captivate and educate, making it an ideal companion for tech enthusiasts and educators alike. The template, adorned in a dynamic spectrum of purple, orange, blue, and green, simplifies the complex narrative of 5G evolution. Compatible with Powerpoint, Keynote, and Google Slides. It features intuitive graphics, engaging icons, and image placeholders, all to highlight 5G's possibilities and its impact on global connectivity. It's the perfect medium for illustrating the sophisticated architecture.


5 slides
Health and Safety Training Presentation
Ignite your team's commitment to safety with our 'Health and Safety Training' presentation template. Designed to highlight key safety practices and emergency procedures, this tool is essential for effective training sessions. Ideal for any organization, it's compatible with PowerPoint, Keynote, and Google Slides, ensuring wide accessibility.


7 slides
Performance Summary Infographic
Boost your reporting capabilities with our Infographic Templates, designed to deliver exceptional clarity and impact. This series is perfectly suited for professionals seeking to present performance data compellingly and concisely. With a variety of designs including radial graphs, tiered lists, and comparative bars, these templates allow for an informative and aesthetically pleasing showcase of critical metrics. Each template is customizable, letting you adjust the color schemes and text to fit your corporate style, enhancing both visual appeal and brand consistency. Whether used in PowerPoint, Google Slides, or Keynote, these tools are vital for anyone looking to articulate achievements, assess comparative results, and plan based on solid data insights. They are indispensable for consultants, managers, and team leaders who require clear, persuasive presentation resources to drive decisions and highlight successes.


4 slides
Strategic Triangle Model Slide
Visualize your core pillars with this Strategic Triangle Model Slide Presentation. Featuring a clean triangular layout with three editable segments, this template is perfect for showcasing frameworks such as mission-vision-values, policy-strategy-impact, or key business objectives. Each point of the triangle is paired with an icon and customizable text, making complex concepts easy to digest. Ideal for strategy planning, leadership discussions, or consulting proposals. Fully editable in PowerPoint, Google Slides, and Keynote.


20 slides
Celestique Photography Portfolio Template Presentation
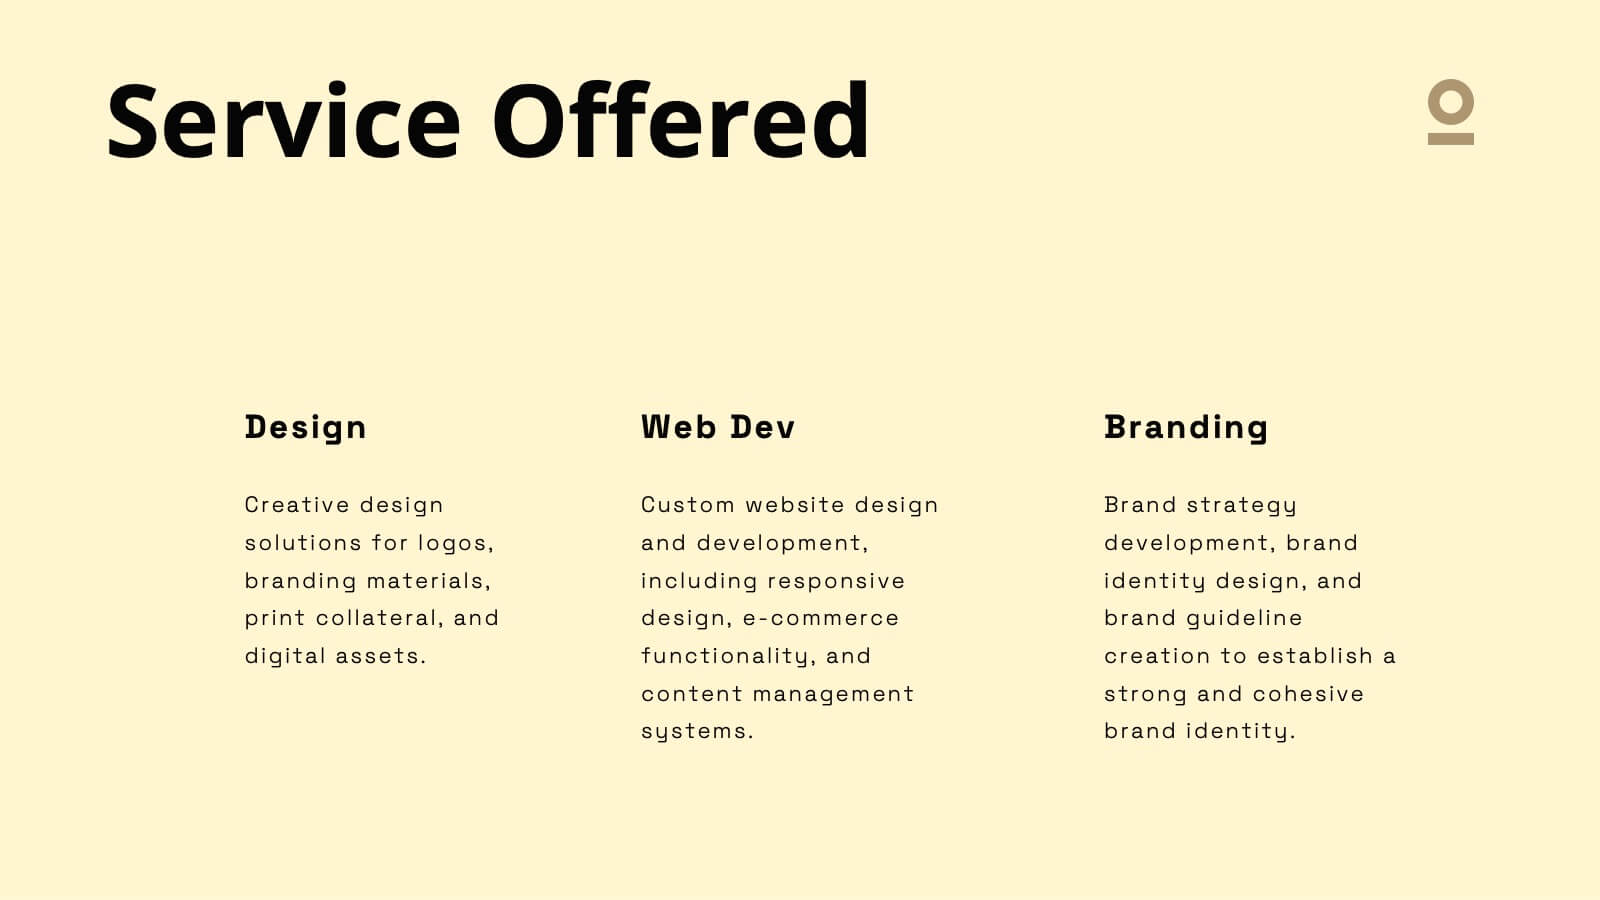
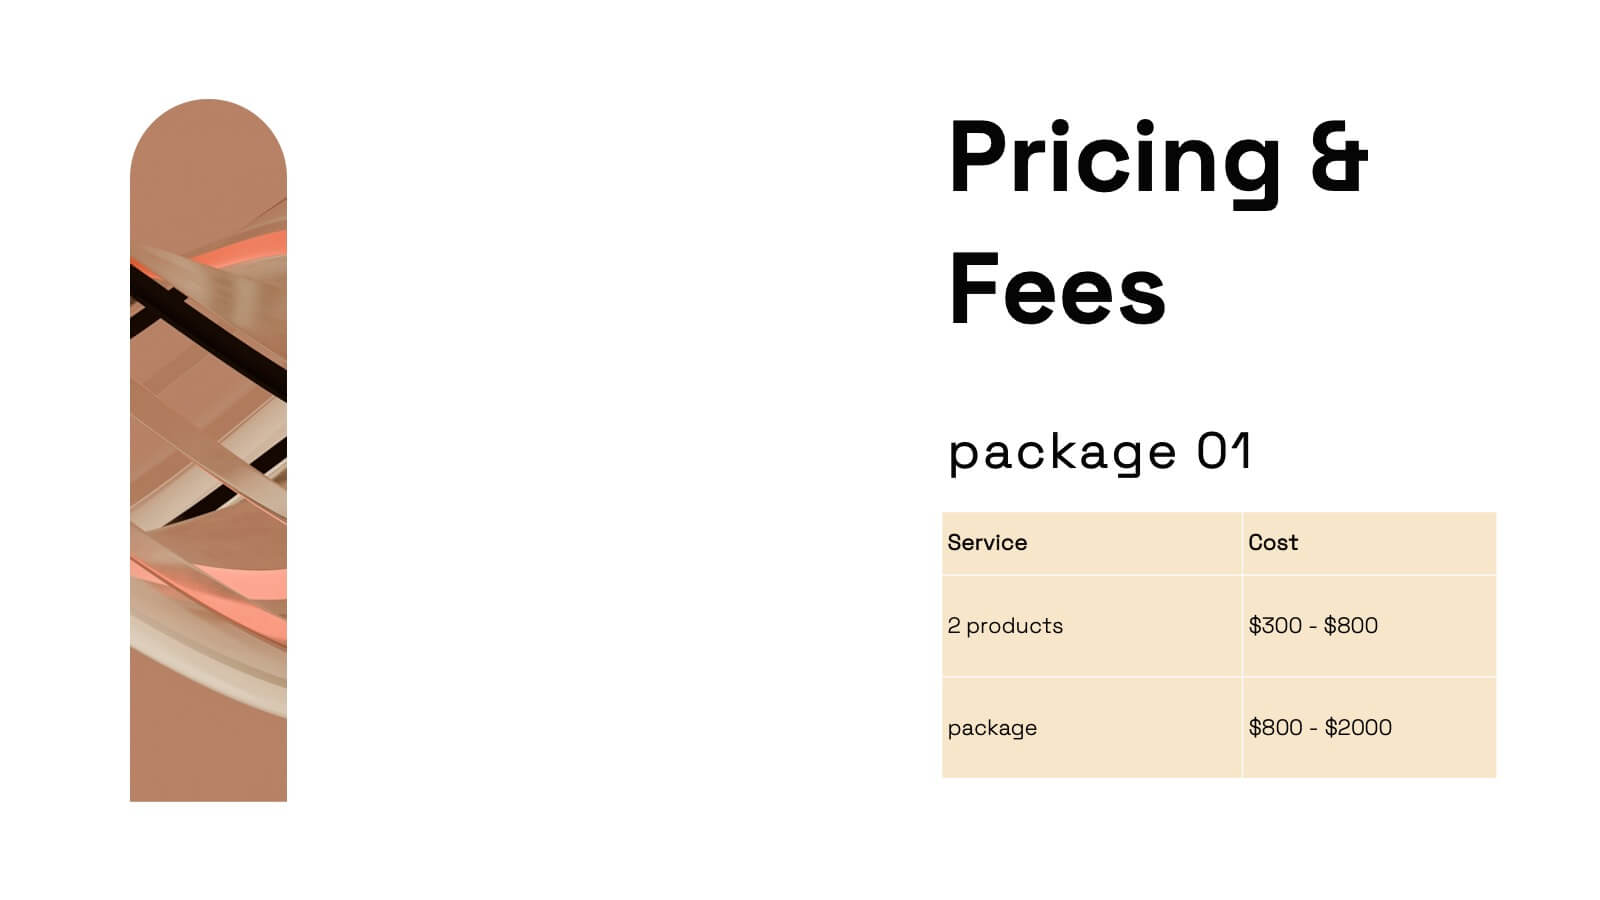
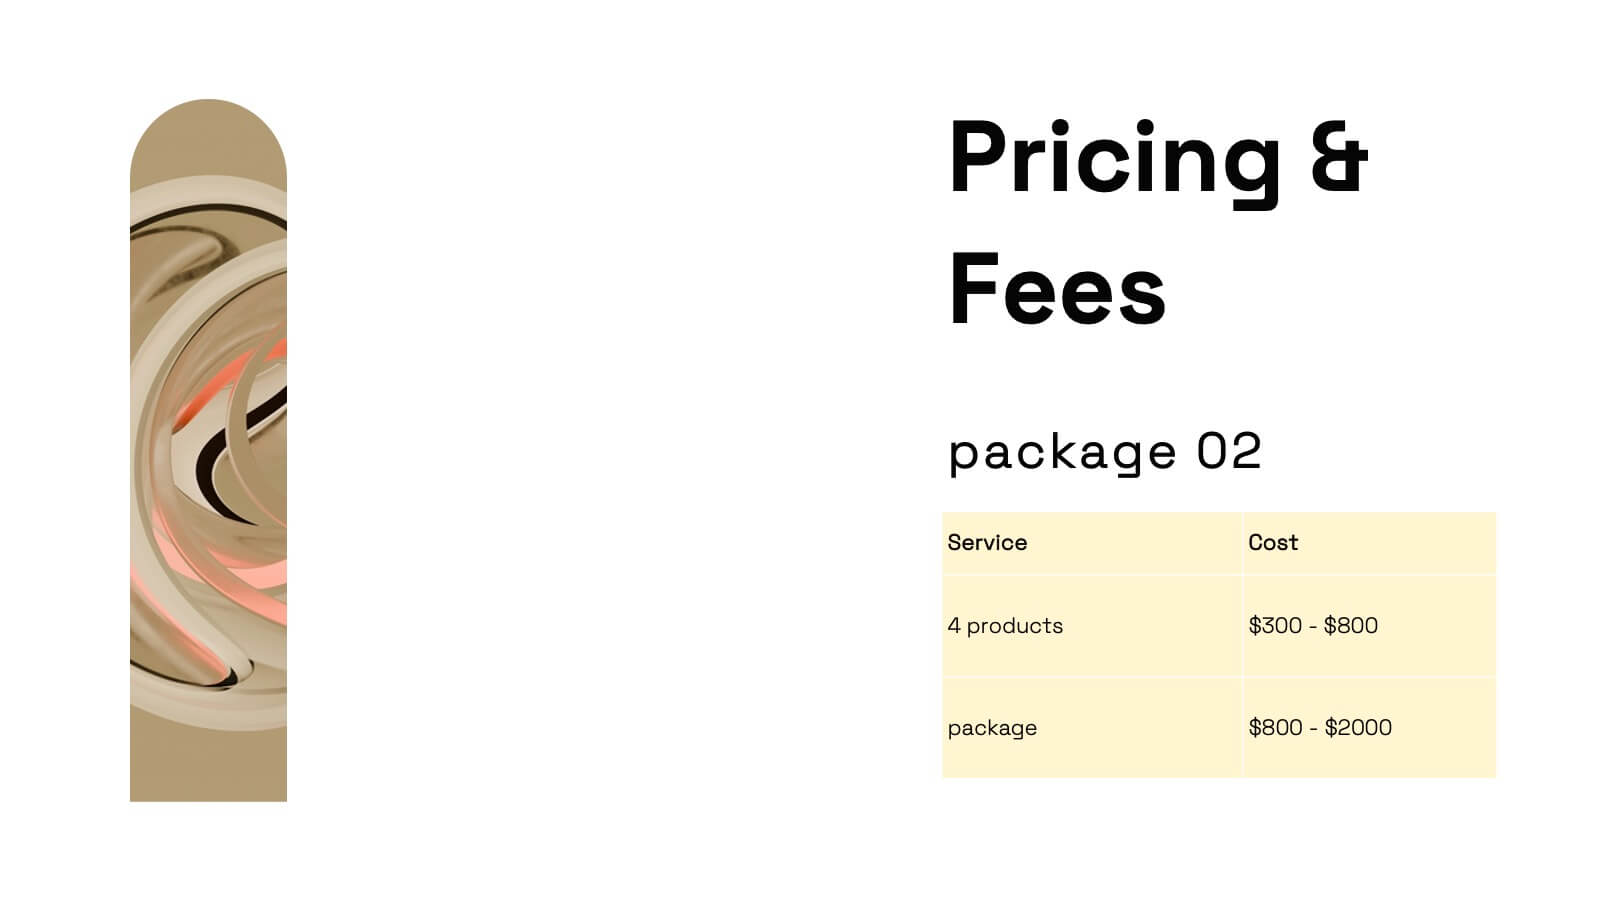
This Photography Portfolio Presentation offers a sleek and modern design to showcase your work professionally. Featuring sections for project highlights, creative process, client testimonials, and pricing, it's fully customizable and easy to edit in PowerPoint, Keynote, and Google Slides. Perfect for photographers looking to impress potential clients.


6 slides
Audience Segmentation by Region Presentation
Discover where your audience truly connects with a visually engaging layout that highlights market insights across regions. This presentation helps businesses identify, compare, and target audiences by location for smarter decision-making. Fully customizable and compatible with PowerPoint, Keynote, and Google Slides for seamless professional use and presentation flexibility.


6 slides
Formal Numbers Infographics
Enter the world of formal numbers, a vital concept in mathematics and science! This infographic acts as your gateway to comprehending the structure and significance of formal numbers. From the fundamental properties of natural numbers to the intricate details of real and complex numbers, we unveil the secrets that underpin these mathematical entities. Discover the mathematical significance of formal numbers across various fields, from algebra to calculus and beyond. Explore how these numbers are used in practical applications, including engineering, physics, and computer science. Gain an appreciation for the elegance and versatility of formal numbers in solving real-world problems. With this informative infographic, compatible with PowerPoint, Keynote, and Google Slides, sharing your understanding of formal numbers becomes seamless. Empower yourself with the knowledge to navigate the intricate world of mathematics. Dive into the realm of formal numbers and embark on a journey of mathematical exploration and enlightenment.


5 slides
Group Dynamics and Work Roles Presentation
Visualize team roles and responsibilities clearly with the Group Dynamics and Work Roles Presentation. This horizontal timeline layout highlights individual contributions and their position in the workflow, making it ideal for team structure, leadership roles, or project stages. Fully editable in Canva, PowerPoint, or Google Slides for smooth collaboration.


5 slides
USA Demographic Map Presentation
Visualize regional insights effortlessly with this USA Demographic Map Presentation. Featuring editable color-coded state maps and matching infographic sections, this template is ideal for presenting population data, customer distribution, or market segmentation. Fully compatible with PowerPoint, Keynote, and Google Slides.


22 slides
Runestone Scientific Research Presentation
The Scientific Research Presentation Template offers 22 clean and professional slides to present your research findings effectively. Cover key areas like objectives, methodology, data analysis, key findings, and future directions. Perfect for academic or professional settings, it's fully customizable and compatible with PowerPoint, Keynote, and Google Slides.